
Chapter 1 DP Title 1 - · Web viewThe conformity process does not address ... The...
57
Blue Text = Instructions and guidance to be deleted Red Text = Boilerplate (required) text to be customized Black Text = Required text and headings Purple Text = Sample text Air Quality Conformity Analysis [Project Title] [General location information][District]-[County code]-[Route]-[PM] [EA/Project No. or Federal-Aid Project Number] [Month Year] Prepared By: ___________________________________ Date: ______________________ [Author’s Name, Title] [District/Region (if prepared by Caltrans)] [Consultant Company Name]
Transcript of Chapter 1 DP Title 1 - · Web viewThe conformity process does not address ... The...

Blue Text = Instructions and guidance to be deletedRed Text = Boilerplate (required) text to be customizedBlack Text = Required text and headingsPurple Text = Sample text
Air Quality Conformity Analysis[Project Title]
[General location information][District]-[County code]-[Route]-[PM]
[EA/Project No. or Federal-Aid Project Number]
[Month Year]
Prepared By: ___________________________________ Date: ______________________[Author’s Name, Title][District/Region (if prepared by Caltrans)][Consultant Company Name]

Table of Contents
Be sure to regenerate the Table of Contents (right click, choose ‘Update Field’), updating the entire table not just page numbers, before printing or completing the report. You may have different Appendix numbering if, for instance, the CO modeling appendix is not necessary.
Section 1. Introduction and Project Description........................................................................11.1. Project Description.........................................................................................................................11.2. Air Quality Regulatory Framework...............................................................................................21.3. Public Review Comments Related to Air Quality Conformity.....................................................2
Section 2. Regional Conformity................................................................................................3Section 3. Localized Impact (Hot-Spot) Conformity..................................................................5
3.1. Carbon Monoxide Hot-Spot Analysis............................................................................................53.2. PM2.5/PM10 Hot-Spot Analysis...................................................................................................73.3. Construction-Related Hot-Spot Emissions..................................................................................11
Appendix A. Public Review Comments and Responses Related to Air Quality Conformity...13Appendix B. Documentation Related to Regional Conformity................................................14Appendix C. Carbon Monoxide Hot-Spot Analysis Modelling Procedures..............................16Appendix D. PM Interagency Consultation.............................................................................20
1.1 Summary......................................................................................................................................211.2 Background..................................................................................................................................211.3 Project is Not a Project of Local Air Quality Concern (POAQC)...............................................221.4 Supporting Information................................................................................................................23
1.1.1 Table A: Traffic Data – Daily Traffic on [name of street/road]..........................................231.1.2 Discussion of Traffic Data [if needed].................................................................................241.1.3 Table B: Intersection Analysis – Year 2015 Conditions.....................................................241.1.4 Table C: Intersection Analysis – Year 2035 Conditions.....................................................241.1.5 Discussion of Intersection Data [if needed].........................................................................24
1.5 Conclusion:..................................................................................................................................251.6 Public Involvement Process:........................................................................................................25
Appendix E. PM Hot-Spot Analysis........................................................................................27Appendix F. CO Modeling Data and Analysis Graphics.........................................................35Appendix G. PM Modeling Data and Analysis Graphics.........................................................36
List of Tables [make sure everything appears here]
Table 1. Project Area Attainment Status......................................................................................2Table 2. CO Modeling Results (in Parts Per Million)..................................................................19
List of Figures [make sure everything appears here]
Figure 1. CO Modeling Network and Receptors.........................................................................17
[Project Title] Air Quality Conformity Analysis i
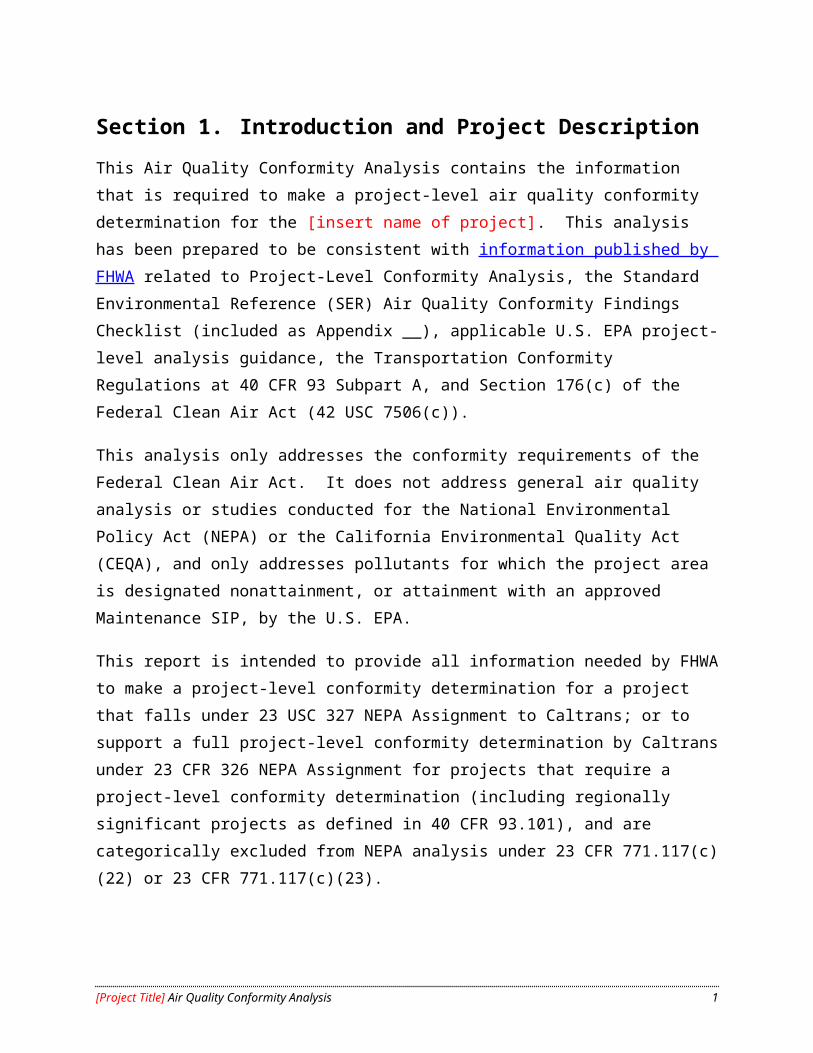
Section 1. Introduction and Project DescriptionThis Air Quality Conformity Analysis contains the information that is required to make a project-level air quality conformity determination for the [insert name of project]. This analysis has been prepared to be consistent with information published by FHWA related to Project-Level Conformity Analysis, the Standard Environmental Reference (SER) Air Quality Conformity Findings Checklist (included as Appendix __), applicable U.S. EPA project-level analysis guidance, the Transportation Conformity Regulations at 40 CFR 93 Subpart A, and Section 176(c) of the Federal Clean Air Act (42 USC 7506(c)).
This analysis only addresses the conformity requirements of the Federal Clean Air Act. It does not address general air quality analysis or studies conducted for the National Environmental Policy Act (NEPA) or the California Environmental Quality Act (CEQA), and only addresses pollutants for which the project area is designated nonattainment, or attainment with an approved Maintenance SIP, by the U.S. EPA.
This report is intended to provide all information needed by FHWA to make a project-level conformity determination for a project that falls under 23 USC 327 NEPA Assignment to Caltrans; or to support a full project-level conformity determination by Caltrans under 23 CFR 326 NEPA Assignment for projects that require a project-level conformity determination (including regionally significant projects as defined in 40 CFR 93.101), and are categorically excluded from NEPA analysis under 23 CFR 771.117(c)(22) or 23 CFR 771.117(c)(23).
1.1. Project Description
Provide a brief statement describing the following:
Project purpose and why the action is needed; Description of the preferred alternative (include a location map and any other graphics
needed to accurately describe the project); Components of the project that change capacity (additional or reduced lanes, new alignments,
new ramps, etc); and Length of the construction period and when the action is expected to be open-to-traffic.
This information should be obtained from the Caltrans Environmental Generalist/Planner to ensure that information presented here is consistent with information to be provided in the environmental document.
[Begin typing here].
[Project Title] Air Quality Conformity Analysis 1
1.2. Air Quality Regulatory Framework
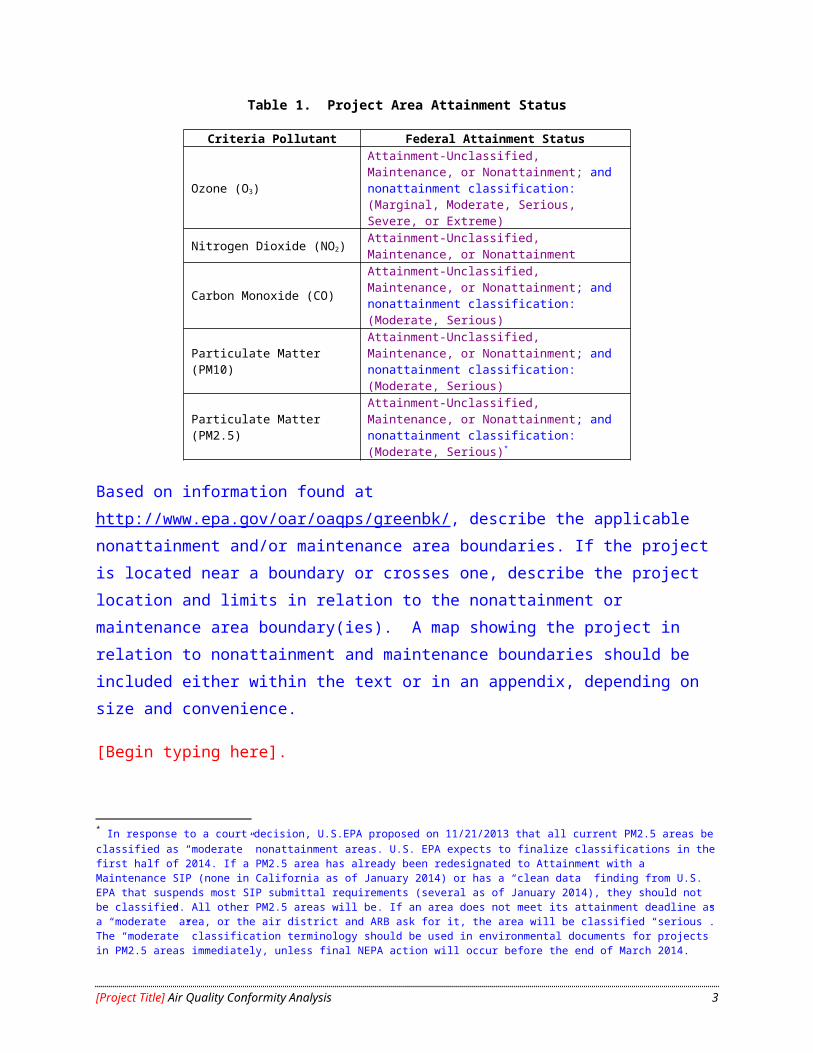
Table 1 shows that the proposed project is located in an area that is nonattainment for [insert criteria pollutant(s)] and attainment-maintenance for [insert criteria pollutant(s)] (as applicable). This analysis focuses on these criteria pollutant(s). The conformity process does not address pollutants for which the area is attainment/unclassified, mobile source air toxics, other toxic air contaminants or hazardous air pollutants, or greenhouse gases.
In Table 1, for each criteria pollutant, identify the applicable federal attainment status.
Table 1. Project Area Attainment Status
Criteria Pollutant Federal Attainment Status
Ozone (O3)
Attainment-Unclassified, Maintenance, or Nonattainment; and nonattainment classification: (Marginal, Moderate, Serious, Severe, or Extreme)
Nitrogen Dioxide (NO2)Attainment-Unclassified, Maintenance, or Nonattainment
Carbon Monoxide (CO)Attainment-Unclassified, Maintenance, or Nonattainment; and nonattainment classification: (Moderate, Serious)
Particulate Matter (PM10)Attainment-Unclassified, Maintenance, or Nonattainment; and nonattainment classification: (Moderate, Serious)
Particulate Matter (PM2.5)Attainment-Unclassified, Maintenance, or Nonattainment; and nonattainment classification: (Moderate, Serious)*
Based on information found at http://www.epa.gov/oar/oaqps/greenbk/, describe the applicable nonattainment and/or maintenance area boundaries. If the project is located near a boundary or crosses one, describe the project location and limits in relation to the nonattainment or maintenance area boundary(ies). A map showing the project in relation to nonattainment and maintenance boundaries should be included either within the text or in an appendix, depending on size and convenience.
[Begin typing here].
1.3. Public Review Comments Related to Air Quality Conformity
If no comments were received during public circulation of the NEPA document, or during separate circulation of conformity information (for example, in cases where a new conformity
* In response to a court decision, U.S.EPA proposed on 11/21/2013 that all current PM2.5 areas be classified as “moderate” nonattainment areas. U.S. EPA expects to finalize classifications in the first half of 2014. If a PM2.5 area has already been redesignated to Attainment with a Maintenance SIP (none in California as of January 2014) or has a “clean data” finding from U.S. EPA that suspends most SIP submittal requirements (several as of January 2014), they should not be classified. All other PM2.5 areas will be. If an area does not meet its attainment deadline as a “moderate” area, or the air district and ARB ask for it, the area will be classified “serious”. The “moderate” classification terminology should be used in environmental documents for projects in PM2.5 areas immediately, unless final NEPA action will occur before the end of March 2014.
[Project Title] Air Quality Conformity Analysis 2
determination is required after PA&ED), describe conformity circulation and state that no comments related to conformity were received. Include a copy of the public notice in Appendix A—for example:
Public comment regarding the conformity analysis was requested [as part of draft NEPA document circulation on __(date)__ OR (if done separately from NEPA circulation) on __(date)__]. No public comments related to conformity were received. A copy of the public notice is included in Appendix A.
If comments related to the air quality conformity determination were received during the draft NEPA document or separate conformity public review period, state that in this section and refer to Appendix A for details regarding the comments and responses.
If the project is processed with a NEPA Categorical Exclusion under 23 USC 326 or 23 CFR 327 NEPA Assignment procedures and is not exempt from conformity, and therefore requires a FHWA (or Caltrans for 23 USC 326) conformity determination, public circulation is not required. In that (probably rare) case, state:
Circulation for public comment was not required because the NEPA determination for this project is a Categorical Exclusion.
Section 2. Regional ConformityInsert the following text if project is located in an area with a conforming regional transportation plan (RTP) and transportation improvement program (TIP) (MPO area) or conforming TIP (“donut” non-MPO area where an MPO is within the nonattainment or maintenance area). If the project is located in an isolated rural area, do not include the section below and skip to next section for isolated rural areas.
Use the following paragraph only in MPO areas. Non-MPO (rural) counties, whether isolated rural or “donut,” do not have RTPs with federal standing.
The [insert project name] project was included in the regional emissions analysis conducted by [insert name of applicable Metropolitan Planning Organization (MPO)] for the conforming [insert name and date of applicable regional transportation plan (RTP)]. The project’s design concept and scope have not changed significantly from what was analyzed in the regional emission analysis. This analysis found that the plan , which takes into account regionally significant projects and financial constraint, will conform to the state implementation plan(s) (SIP(s)) for attaining [and/or maintaining] the National Ambient Air Quality Standards (NAAQS) as provided in Section 176(c) of the Clean Air Act. FHWA determined that the RTP
[Project Title] Air Quality Conformity Analysis 3

conforms to the SIP on [insert date]. Additional documentation related to the regional emissions analysis is contained in Appendix B.
Use the following paragraph in both MPO and “donut” non-MPO areas. “Donut” areas must have a regional conformity analysis based on the FTIP. Note: as of 10/2013, while there are no official “donut” areas in California, the tribal lands of the Morongo and Pechanga Nations are treated as such for regional conformity analysis purposes; this should not affect project-level conformity determinations unless one is done for a project within the tribal lands.
The [insert project name] project is also included in the federal [insert name and date of applicable federal Transportation Improvement Program (TIP), including the MPO or RTPA responsible for the TIP, and provide reference]. The project’s open-to-traffic year is consistent with (within the same regional emission analysis period as) the construction completion date identified in the federal TIP and/or RTP. The federal TIP gives priority to eligible Transportation Control Measures (TCMs) identified in the SIP and provides sufficient funds to provide for their implementation. FHWA determined that the TIP conforms to the SIP on [insert date]. Documentation related to the public and interagency consultation process conducted to develop the TIP is contained in Appendix B.
Document with copies of appropriate listings/pages from RTP and TIP in Appendix B.
Use the following text only if the project is located in an isolated rural area.
The [insert project name] project is located in an isolated rural area. A regional emissions analysis was conducted to estimate vehicle miles traveled, travel speeds, and associated air emissions for the project and for the regional transportation system. Appendix B describes the approach used for this analysis. The project’s design concept and scope have not changed significantly from what was analyzed in the regional emissions analysis. That analysis found that project emissions, in combination with emissions from all regionally significant projects expected to be constructed within at least a 20 years planning period, meet mobile source emission budgets contained in the state implementation plans (SIPs) for achieving the National Ambient Air Quality Standards (NAAQS) or, if no adequate or approved emission budgets are available, meets “interim” emission tests [insert reference to appendix containing the regional analysis]. Documentation related to the public and interagency consultation process conducted to develop the regional emissions analysis is contained in Appendix B.
[Project Title] Air Quality Conformity Analysis 4
Section 3. Localized Impact (Hot-Spot) ConformityIf the project is located in Attainment-Unclassified areas for ALL OF CO, PM10, and PM2.5, no project-level hot-spot analysis is necessary. There are a few areas that are nonattainment only for ozone. If that is the case, include the following language. No hot-spot analysis will be necessary for the AQCA report.
The project is located in an area that is Attainment /Unclassifiable for both carbon monoxide (CO) and particulate matter (PM10 and PM2.5). Therefore, no hot-spot analysis is required for conformity purposes, and project-level conformity analysis requirements are satisfied by the regional conformity analysis described above.
Otherwise, continue with the CO and/or PM hot-spot analysis described below.
3.1. Carbon Monoxide Hot-Spot Analysis
If the project is NOT located in a CO nonattainment or maintenance area, include the first statement below, do not include Appendix C, and skip to the PM hot-spot analysis section. Otherwise, if the project is in a CO nonattainment or maintenance area, include the rest of this section.
(In attainment-unclassified areas only):
This project is located in an area that is designated attainment-unclassified for carbon monoxide (CO). Therefore, no project-level conformity analysis is necessary for CO.
If the project is located in a CO nonattainment or attainment-maintenance area:.
The California Project-Level Carbon Monoxide Protocol† (CO Protocol) was used to analyze CO impacts for the [insert name of project]. The hot-spot analysis covered the most congested intersections affected by the project in [insert year representing the maximum CO concentration, or insert open-to-traffic and horizon years and identify them as such].
If the project screens out through the qualitative analysis process in the CO Protocol, include the following language:†† CAL3QHCR can also be used, with EMFAC emission factors, in place of the CO Protocol. If this type of analysis is done, describe fully: why the CO Protocol was not used, how the analysis complies with U.S.EPA regulations (Appendix W and other CO modeling guidance), modeling assumptions and inputs, outputs, and evaluation regarding whether or not the project will cause, contribute to, or worsen a CO hot-spot. Interagency consultation regarding model usage, emission factors (latest EMFAC version made available for conformity use by U.S. EPA), and results is required if CAL3QHCR is used, and must be documented in a suitable appendix along with listings of all model inputs and outputs.
[Project Title] Air Quality Conformity Analysis 5

The ambient air quality effects of traffic emissions were evaluated qualitatively according to the CO Protocol. The project screens out at Level __ of the flow chart at Figure 3 in the CO Protocol, and therefore will not have the potential for causing or worsening violation of the National Ambient Air Quality Standards for CO.
Otherwise, quantitative modeling must be done and the results documented as below:
The ambient air quality effects of traffic emissions were evaluated using the modeling procedures described in Appendix B of the CO Protocol and Appendix C of this document. The assumptions used in the hot-spot analysis are consistent with those used in the regional emissions analysis.
Document CO modeling procedures in Appendix C. Include copies of all input and output files from model runs, including EMFAC and CALINE4, in Appendix F. Modeling documentation should cover direct project effects, and if in a nonattainment area should also document how actual or potential CO violations in the project area were identified and how they will be reduced or eliminated.
For projects where CO hot-spot analysis is carried out, insert the following findings as applicable.
Insert the following sentence if the project is located in a nonattainment or maintenance area for CO: The modeling results shown in Appendix C indicate that project-related CO emissions would not cause or contribute to any new or worsened localized violations of the federal 1-hour or 8-hour CO ambient standards.
Also insert the following sentence if the project is located in a nonattainment area for CO: The project is also expected to reduce the severity and number of localized CO violations in the project area.
If the project reduces the number and severity of existing CO violations in a nonattainment area, describe where those violations take place now and how much they are reduced (or if they are eliminated) based on the modeling documented in Appendix C.
If the project’s NEPA document identifies avoidance, minimization, and/or mitigation measures for CO, include the following statement: The NEPA document for this project identifies the following avoidance, minimization, and/or measures for CO:
As of January, 2009, there are no nonattainment areas in California for CO. All CO areas are maintenance. Verify current CO status at the time the AQCA is prepared.
[Project Title] Air Quality Conformity Analysis 6
[List measures]
Approval of the NEPA document for this project is the written commitment to implement the identified CO control measures.
If the project’s NEPA document does not identify avoidance, minimization, and/or mitigation measures for CO, include the following statement:
The NEPA document for this project does not identify specific avoidance, minimization, and/or mitigation measures for CO. A written commitment to implement such control measures is therefore not required.
If the approved RTP or TIP contains any CO mitigation or control measures that relate to the project’s construction or operation, include the following statement:
Approval of the NEPA document for this project is the written commitment to implement the following applicable CO mitigation or control measures identified as a condition of the RTP or TIP conformity determination:
[List measures]
If the approved RTP or TIP has no CO mitigation or control measures that relate to the project’s construction or operation, include the following statement:
The approved RTP and TIP for the project area has no CO mitigation or control measures that relate to the project’s construction or operation. Therefore, a written commitment to implement CO control measures is not required.
3.2. PM2.5/PM10 Hot-Spot Analysis
If the project is NOT located in a particulate matter (PM10 or PM2.5) nonattainment or maintenance area, include the following statement, do not include Appendices D and E, and skip to the next section.
(In attainment-unclassified areas only):
This project is located in an area that is designated attainment-unclassified for particulate matter (both PM10 and PM2.5). Therefore, no project-level conformity analysis is necessary for particulate matter.
[Project Title] Air Quality Conformity Analysis 7
Complete the rest of this section if the project is located in a PM2.5 and/or PM10 nonattainment or maintenance area. The following provides guidance on documenting PM hot-spot analysis.
Particulate matter (PM) hot-spot analysis is required under the U.S. EPA Transportation Conformity rule for Projects of Air Quality Concern (POAQC), as described in U.S. EPA's Final Rule of March 10, 2006. U.S. EPA issued guidance in 2006 regarding the basic hot-spot analysis process with emission analysis as the detailed analysis step. U.S. EPA released guidance in 2010 that describes a more detailed analysis process using dispersion modeling that replaces the emission analysis step in the 2006 guidance. All projects with PM10 and/or PM2.5 hot-spot analysis started since December 10, 2012 must use the quantitative analysis procedures in the 2010 guidance. Projects with PM analysis started before December 2012 using the 2006 qualitative analysis procedures must complete both the project-level conformity determination and the Final NEPA document within 3 years of circulating the Draft NEPA document.
Projects that are not POAQC do not require detailed PM hot-spot analysis but must have the reason for conformity exemption or Not-POAQC status documented. A project that is not exempt from conformity but is not a POAQC must have a basic traffic-oriented analysis, concurrence in that status by interagency consultation in an MPO-based or “donut” conformity area, and if not processed with a NEPA CE must have public notice (normally done as part of NEPA document public notice). See Appendix D for documentation of POAQC consultation and include a copy of the public notice and response to any conformity-related comments in Appendix A.
If the project is in a PM10 or PM2.5 nonattainment or maintenance area but is fully exempt from conformity requirements (see list of project types in 40 CFR 93.126 and 40 CFR 93.128), insert the following language, do not include Appendices D and E, and skip to the next section:
This project is located in a particulate matter (PM10 and/or PM2.5) nonattainment or maintenance area, but is exempt from conformity requirements under [40 CFR 93.126 OR 40 CFR 93.128]. Project-level hot-spot analysis for particulate matter is therefore not required for a conformity determination.
According to the U.S. EPA Transportation Conformity Guidance (Final Rule), March 10 2006 (not changed in the 2010 guidance), the following types of projects are considered POAQC:
1) New or expanded highway projects that have a significant number of or significant increase in diesel vehicles (significant number is defined as greater than 125,000 Annual Average Daily Traffic (AADT) and 8% or more of such AADT is diesel truck traffic, or
[Project Title] Air Quality Conformity Analysis 8

in practice 10,000 truck AADT or more regardless of total AADT; significant increase is defined in practice as a 10% increase in heavy duty truck traffic);
2) Projects affecting intersections that are at a Level of Service D, E, F, with a significant number of diesel vehicles, or that that will change to Level of Service D, E, or F because of increased traffic volumes from a significant number of diesel vehicles related to the project;
3) New bus and rail terminals and transfer points that have a significant number of diesel vehicles congregating at a single location;
4) Expanded bus and rail terminals and transfer points that significantly increase the number of diesel vehicles congregating at a single location; or
5) Projects in or affecting locations, areas, or categories of sites which are identified in the PM2.5 or PM10 implementation plan or implementation plan submission, as appropriate, as sites of possible violation.
These are not thresholds, what EPA would call “bright line” criteria, but absent unusual conditions (especially large amounts of diesel truck or bus traffic) they typically apply. Also, while not stated in the criteria, 8% of 125K AADT is 10,000 trucks; that numeric criterion is often used as well. Discuss how the project meets the criteria in Appendix E and document concurrence by interagency consultation in Appendix D.
Insert the following text if the project is NOT a POAQC, then skip to the discussion of control measures below.
The proposed project is not considered a project of air quality concern for PM10 and/or PM2.5 (POAQC) because it does not meet the definition of a POAQC as defined in U.S. EPA’s Transportation Conformity Guidance. [Discuss all five criteria listed above, and provide justification that the project does not meet any of the criteria.] PM hot-spot analysis is not required.
The project has undergone Interagency Consultation (IAC) regarding POAQC determination. IAC participants concurred that the project is not a POAQC (see Appendix D).
Provide documentation in Appendix D.
Insert the following text only if the project is a POAQC.
The proposed project is considered a project of air quality concern for PM10 and/or PM2.5 (POAQC) because it meets the definition of a POAQC as defined in U.S. EPA’s Transportation
[Project Title] Air Quality Conformity Analysis 9
Conformity Guidance. [Discuss any of the five criteria listed above that apply to the project, and provide justification that the project meets the criterion/criteria specified.]
The project has undergone Interagency Consultation (IAC) regarding POAQC determination. IAC participants concurred that the project is a POAQC (see Appendix D).
Provide documentation in Appendix D.
A PM hot-spot analysis has been conducted for the project, as described in Appendix E. The [PM2.5 and/or PM10] hot-spot analysis shows that the project will not cause or contribute to, or worsen, any new localized [PM2.5 and/or PM10] violations.
If an approved SIP contains any control measures that relate to the project’s construction or operation, include the following statement:
Approval of the NEPA document for this project is the written commitment to implement the following applicable particulate matter control measures contained in the approved [PM10 and/or PM2.5] SIP:
[List measures]
If the approved SIP has no measures applicable to the proposed project, then include the following statement:
The approved [PM10 and/or PM2.5] SIP has no control measures applicable to the proposed project. Therefore, a written commitment to implement control measures is not required.
If the project area does not have an approved SIP for the nonattainment pollutant, then insert the following statement:
There is no approved [PM10 and/or PM2.5] SIP for the project area. Therefore, a written commitment to implement control measures is not required.
If the project’s NEPA document identifies avoidance, minimization, and or mitigation measures for PM10 and/or PM2.5, include the following statement:
The NEPA document for this project identifies the following avoidance, minimization, and or mitigation measures related to PM10 and/or PM2.5:
[List measures]
[Project Title] Air Quality Conformity Analysis 10
Approval of the NEPA document for this project will be considered a written commitment to implement the identified [PM10 and/or PM2.5] control measures.
If the project’s NEPA document does not identify avoidance, minimization, and or mitigation measures for PM10 and/or PM2.5, include the following statement:
The NEPA document for this project does not identify specific avoidance, minimization, and or mitigation measures for PM10 and/or PM2.5. A written commitment to implement such control measures is therefore not required.
If the approved RTP or TIP contains any PM10 and/or PM2.5 mitigation or control measures that relate to the project’s construction or operation, include the following statement:
Approval of the NEPA document for this project, expected in [insert month and year or year], will be considered a written commitment to implement the following applicable PM10 and/or PM2.5 mitigation or control measures identified as a condition of the RTP or TIP conformity determination:
[List measures]
If the approved RTP or TIP has no PM mitigation or control measures that relate to the project’s construction or operation, include the following statement:
The approved RTP and TIP for the project area has no PM mitigation or control measures that relate to the project’s construction or operation. Therefore, a written commitment to implement PM control measures is not required.
3.3. Construction-Related Hot-Spot Emissions
40 CFR 93.123(c)(5) states that: “CO, PM10 , and PM2.5 hot-spot analyses are not required to consider construction-related activities which cause temporary increases in emissions. Each site which is affected by construction-related activities shall be considered separately, using established ‘Guideline’ methods. Temporary increases are defined as those which occur only during the construction phase and last five years or less at any individual site.”
If the project is located in a CO, PM10, and/or PM2.5 nonattainment or maintenance area and will be under construction for more than 5 years in one general location, insert the following:
The [insert project name] project will be under construction for more than five years in one general location. Therefore, construction-related emissions have been included in the project-level [insert CO, PM10, and/or PM2.5, as applicable] hot-spot analysis, and in the regional
[Project Title] Air Quality Conformity Analysis 11
analysis used for the Regional Transportation Plan (RTP) and Transportation Improvement Program (TIP) conformity determination.
If the project is located in a CO, PM10, and/or PM2.5 nonattainment or maintenance area, but the project will be under construction for 5 years or less, insert the following:
Because construction of the project is expected to last less than five years, construction-related emissions related to it are not considered in the project-level or regional conformity analysis.
[Project Title] Air Quality Conformity Analysis 12
Appendix A. Public Review Comments and Responses Related to Air Quality Conformity
If the project is not processed with a NEPA CE and is not exempt from all conformity requirements, the determination whether or not it is a POAQC and any detailed study done for a POAQC is subject to public review and comment. The public notice is usually circulated with the NEPA document, but in some cases (for example, when a new conformity determination is required after PA&ED) a separate public notice is required. Include a copy of public notice (see boilerplate for conformity public notice on the SER Forms and Templates page) with this appendix. If any comments were received that relate to the conformity analysis, include copies of all such comments and provide individual or grouped responses to them in this appendix.
If no public comments related to conformity were received, state:
No public comments related to conformity were received during public review of this project’s NEPA document or any separate public notice period related to conformity.
Otherwise:
[Begin typing and copying here]
[Public Comment]
Response to Comment – how is it addressed in project-level conformity studies and does it affect the project-level conformity determination? Are mitigation or other measures added as a result of the comment to ensure conformity?
Appendix B. Documentation Related to Regional Conformity
[Project Title] Air Quality Conformity Analysis 13

Insert the following text if project is located in an area with a conforming regional transportation plan and transportation improvement program. If the project is located in an isolated rural area, do not include the sections below and skip to the section for isolated rural areas.
Regional Emissions Analysis Conducted for Conforming RTP
The regional emissions analysis found that regional emissions will not exceed the SIP’s emission budgets for mobile sources in the build year, a horizon year at least 20 years from when conformity analysis started, and additional years meeting conformity regulation requirements for periodic analysis. The regional emissions analysis was based on the latest population and employment projections for [insert name of planning area such as county or counties] that were adopted by the [insert name of MPO or RTPA] at the time the conformity analysis was started on [insert date that projections were adopted]. These assumptions are less than five years old. The modeling was conducted using current and future population, employment, traffic, and congestion estimates. The traffic data, including the fleet mix data, were based on the most recently available vehicle registration data included in the EMFAC model. EMFAC _____ was used, which was the most recent version of the model developed by the California Air Resources Board and approved for use in California by the U.S. EPA at the time of the analysis.
Public and Interagency Consultation Process for TIP
The federal TIP was developed in accordance with [insert MPO’s or RTPA’s name] policies for community input and interagency consultation procedures. These procedures ensure that the public has adequate opportunity to be informed of the federal TIP development process and encourages public participation and comment.
To document fulfillment of interagency and public consultation requirements, outlined in a specific implementation plan, provide further information on the public and interagency consultation process, as applicable, including summarizing comments and responses to comments received on the conformity tests and methodologies.
[Begin typing here]
Insert the following text if project is located in an isolated rural area.
Isolated Rural Area Regional Emissions Analysis
In certain Isolated Rural PM10 areas (Coso Junction and Owens Valley), the SIP approval includes a U.S. EPA finding that on-road motor vehicles are not a significant contributor to
[Project Title] Air Quality Conformity Analysis 14
nonattainment or former nonattainment. If the project is in one of those areas, see the footnote below† for recommended language.
A regional emissions analysis was conducted for the [insert project name] project, located in an isolated rural area. Describe approach used for the regional emissions analysis. Insert table for nonattainment and maintenance area pollutants showing emissions and emission targets.
The regional emissions analysis was developed in accordance with [insert RTPA’s name] and Caltrans’ policies for community input and interagency consultation procedures. These procedures ensure that the public has adequate opportunity to be informed of the regional emissions analysis approach and encourages public participation and comment. Provide any further information on the public and interagency consultation process, as applicable, including summarizing comments and responses to comments received on the conformity tests and methodologies. [Begin typing here]
The regional emissions analysis was based on the latest population and employment projections at the time the conformity analysis began on [insert date]. These assumptions are less than five years old. The modeling was conducted using current and future population, employment, traffic, and congestion estimates. The traffic data, including the fleet mix data, were based on the most recently available vehicle registration data included in the [insert model version, such as EMFAC 2011] model. The EMFAC ____ model, developed by the California Air Resources Board, is the most recent version approved for use in California by the U.S. EPA.
† Suggested language for area where on-road emissions are not significant: The SIP for the project area indicates that on-road mobile source emissions are not a significant contributor to nonattainment or former nonattainment. Therefore, no regional emission analysis is necessary. Project-level hot-spot analysis remains necessary, and is documented elsewhere.
[Project Title] Air Quality Conformity Analysis 15

Appendix C. Carbon Monoxide Hot-Spot Analysis Modelling Procedures
Include this appendix only if a project in a CO nonattainment or maintenance area does not “screen out” using the CO Protocol. This appendix assumes that detailed modeling analysis is performed, according to Appendix B of the CO Protocol.
The “Baseline” year – “existing” or the year that studies started – is not generally needed for CO hot-spot analysis done for conformity, although a baseline analysis (existing conditions at the time of the Notice of Preparation (NOP) or at the time the environmental studies began) is required for CEQA. If a baseline year was analyzed disclose it. In nonattainment areas (none in California as of 10/2011), conformity might require showing that the project does not worsen existing violations in which case the baseline year is relevant.
The ambient air quality effects of project-related traffic emissions were evaluated using the CALINE4 dispersion model (Benson 1989) and the modeling procedures described below. These procedures are based on Appendix B of the Caltrans/UCD CO Protocol.
Roadway and Traffic Conditions
Traffic volumes and operating conditions used in the modeling were obtained from the traffic analysis prepared for this project. Carbon monoxide modeling was conducted using [insert a.m. or p.m. peak-hour] traffic volumes. The peak hour used was chosen to represent the one with the most stable meteorological conditions.
Carbon monoxide modeling was performed for the following scenarios:
Insert list of scenarios, such as:
Baseline/Existing (year), Open-to-traffic year (year) without project; Open-to-traffic year (year) with project; Other year (year) without project [if needed to represent highest-emission year] Other year (year) with project [if needed to represent highest-emission year] 20-year horizon year (year) without project, and 20-year horizon year (year) with project.
[Project Title] Air Quality Conformity Analysis 16
Vehicle Emission Rates
Vehicle emission rates were determined using the California Air Resources Board's [insert either EMFAC2007 or successor] emission rate program.
Receptor Locations
CO concentrations were estimated at [insert number of receptor locations] receptor locations located near the most congested intersections affected by the project. Those intersections included the following:
[insert list of intersections]
Receptors were chosen based on Caltrans’ CO Protocol. Figure 1 shows the modeling network and receptors used for the proposed interchange analysis. Receptor heights were set at [insert height] feet ([insert height] meters). U.S. EPA modeling guidance suggests that receptors normally be chosen to be around breathing height (1.8 meters). [Explain reason for using a different number.]
Insert figure that shows roadways and receptors.
Figure 1. CO Modeling Network and Receptors
Meteorological Conditions
Meteorological inputs to the CALINE4 model were determined using the methodology recommended in the CO protocol (Garza et al. 1997). The meteorological conditions used in the modeling represent a calm winter period. The worst-case wind angles option was used to determine a worst-case concentration for each receptor. The meteorological inputs include:
[insert speed] feet per second wind speed, [insert a–g stability class] stability class ground-level temperature inversion, [insert degrees] degree wind direction standard deviation, and [insert height] feet mixing height.
Background Concentrations and Eight-Hour Values
A background concentration of [insert ppm] parts per million (ppm) was added to the modeled 1-hour values to account for sources of CO not included in the modeling. Eight-hour modeled values were calculated from the 1-hour values using a persistence factor of [insert persistence
[Project Title] Air Quality Conformity Analysis 17
factor]. A background concentration of [insert ppm] ppm was added to the modeled 8-hour values. All background concentration data were taken from the monitoring data provided by the Air Resources Board (California Air Resources Board, 2007) for [identify monitoring site(s)].
The CO air quality modeling results are shown in Table 2.
Insert a table showing the CO air quality modeling results. A sample is provided below. This sample is based on the scenarios listed above in the “Traffic and Roadway Conditions” section.
[Project Title] Air Quality Conformity Analysis 18
Table 2. CO Modeling Results (in Parts Per Million)
Receptor
Existing Concentration
(2008)1-Hr
Existing Concentration
(2008)8-Hr
Future No Project
(2015) 1-Hr
Future No Project
(2015) 8-Hr
Future With
Project (2015) 1-Hr
Future With
Project (2015) 8-Hr
Future No Project
(2028) 1-Hr
Future No Project
(2028) 8-Hr
Future With
Project (2028) 1-Hr
Future With
Project (2028) 8-Hr
1a
2a
3a
4a
5b
6b
7b
8b
CO Threshold
20.0 9.0 20.0 9.0 20.0 9.0 20.0 9.0 20.0 9.0
a First Street/Chestnut Streetb First Street/Cherry Street
[Project Title] Air Quality Conformity Analysis 19

Appendix D. PM Interagency ConsultationIf the project is not a POAQC, provide evidence that the Interagency Consultation concurred with this conclusion. Evidence can include copies of Interagency Consultation minutes, a web page indicating action, or copies of email indicating concurrence by key participants (at least U.S. EPA and FHWA). Include a copy with this appendix.
[Begin typing here]
If the project is a POAQC, provide evidence that the Interagency Consultation concurred with this conclusion. Evidence can include copies of Interagency Consultation minutes, a web page indicating action, or copies of email indicating concurrence by key participants (at least U.S. EPA and FHWA). Include a copy with this appendix.
[Begin typing here]
Most Interagency Consultation processes use a form developed by the Southern California Association of Governments (download form – MS Word) to structure their review of projects. In the San Joaquin Valley (SJV), a different format (cover email and brief report) is used because the email circulation process in that area provides less opportunity for questions about project details. A generic form based on the SJV process follows:
This annotated outline is intended to help structure documentation that a project is not a “Project of Air Quality Concern” (POAQC) under U.S. EPA’s Transportation Conformity regulations, and 2006 and 2010 Particulate Matter Hot-spot Analysis Guidance documents. Most projects in PM10 or PM2.5 nonattainment or maintenance areas that are not exempt from all conformity requirements (see 40 CFR 93.126 and 128 for exempt projects) need this documentation, which would be attached to a cover memo or an information summary form for interagency consultation concurrence. If a project is Not a POAQC (does not meet the criteria of 40 CFR 93.123(b)(1) as listed in the body of the outline), and concurrence by regional interagency consultation in that determination is obtained, public comment must be requested consistent with NEPA practice – generally combined with NEPA document notices (see boilerplate conformity notice language at the SER Forms and Templates page); this outline would provide the background information to meet public information requests and should be included with NEPA documentation and technical studies as appropriate. If a project is determined to be a POAQC most of this information would be transferred to a larger document that covers the modeling and other detailed analysis done based on U.S. EPA Guidance.
The outline is based largely on documentation used in the San Joaquin Valley (Caltrans Districts 6 and 10) interagency consultation process. In areas where the SCAG project review form or a variation on it (e.g. Sacramento, Bay Area) is used, this outline would
[Project Title] Air Quality Conformity Analysis 20
support and be attached to the completed form if desired. Extended discussion in the form could then be referred to appropriate sections or pages in this document.
Projects with a NEPA CE do not need public comment on the project-level conformity hot-spot analysis; only projects with a NEPA Environmental Assessment (EA) or Environmental Impact Statement (EIS) need that. NEPA CE projects can omit discussion of public review and comment for conformity.
This outline/document, if done, would be included as an appendix along with any other review materials and documentation of consultation in an Air Quality Conformity Analysis (AQCA) report for FHWA.
Blue Text = Instructions and guidance to be deletedRed Text = Instructions to be replaced with textBlack Text = Boilerplate textPink Text = Sample text
Particulate Matter (PM10 and PM2.5) Conformity Assessment – Project is not a Project of Air Quality Concern (POAQC)
1.1 SummaryThis project is located in [insert city, county, route, etc] and the [air basin or name of nonattainment area(s)]. The [nonattainment area name or abbreviation] is designated as [nonattainment or attainment/maintenance] for the [PM10, PM2.5, or both as applicable] National Ambient Air Quality Standards (NAAQS). The proposed [project identification] is primarily surrounded by [describe primary land use] uses with [describe other land uses; include discussion of where they are in relation to the project if important as “to the south” or the like].
According to the U.S. EPA’s 2006 and 2010 Guidance documents, PM hot-spot analysis is required only for projects of local air quality concern (“Projects of Air Quality Concern” or POAQCs) in nonattainment and maintenance areas for PM10 and/or PM2.5. Projects that are exempt from conformity requirements (listed in 40 CFR 93.126 or 128) do not need any hot-spot analysis for project-level conformity purposes. Based on the information provided below, this non-exempt project is not a project of local air quality concern (POAQC) because it does not meet U.S. EPA criteria; therefore, a detailed hot-spot analysis for [PM10, PM2.5, or both] is not required.
Concurrence by Interagency Consultation is requested in this determination that the project is not a POAQC. After concurrence, public comment will be requested on this determination (for NEPA projects with an EA or EIS), and any public comments received will be responded to in an Air Quality Conformity Analysis report provided to the Federal Highway Administration (FHWA) to support a project-level conformity determination for the NEPA document.
1.2 BackgroundSection 93.116(a) of 40 Code of Federal Regulations (CFR) states that an FHWA/ FTA project must not cause or contribute to any new localized PM2.5 violations or increase the frequency or severity of any existing PM10 and PM2.5 violations in nonattainment or maintenance areas. The regulations further state that projects may satisfy this requirement without an analysis of their
[Project Title] Air Quality Conformity Analysis 21

potential to create PM hot-spots provided that they do not meet the criteria set forth in Section 93.123 (b) for POAQC. Projects that are not a POAQC do not require detailed hot-spot analysis because, generally, they would not substantially affect high-priority PM10 or PM2.5 (as applicable) concentrations and are unlikely to cause or contribute to new or continued localized violation of the NAAQS.
The following paragraph establishes that the project is not exempt from all conformity requirements and therefore requires some form of PM10/2.5 localized impact analysis.
With regard to local air quality impacts analysis, a project may be considered to have one of three types of status: (1) exempt; (2) not exempt but not a POAQC based on the specific parameters established in the U.S. EPA regulations; and (3) a POAQC, which requires that a qualitative hot-spot analysis be conducted. The [project name] Project does not meet the definition of an exempt project under Sections 93.126 or 93.128.
The following paragraph lists the criteria for POAQC. Further analysis/discussion is needed to address each of the points in the list. If a project is argued to be Not a POAQC, information must be provided that none of the criteria are met.
The U.S. EPA Transportation Conformity Rule defines projects of localized air quality concern (POAQC), requiring detailed PM10 and PM2.5 hot-spot analysis, in 40 CFR 93.123(b)(1) as:
(i) New or expanded highway projects that have a significant number of or significant increase in diesel vehicles;
(ii) Projects affecting intersections that are at LOS D, E, or F with a significant number of diesel vehicles, or those that will change to LOS D, E, or F because of increased traffic volumes from a significant number of diesel vehicles related to the project;
(iii) New bus and rail terminals and transfer points that have a significant number of diesel vehicles congregating at a single location;
(iv) Expanded bus and rail terminals and transfer points that significantly increase the number of diesel vehicles congregating at a single location; and
(v) Projects in or affecting locations, areas, or categories of sites that are identified in the PM2.5 and PM10 applicable implementation plan or implementation plan submission, as appropriate, as sites of violation or possible violation.
Sample “Not a POAQC” language based on a fairly simple interchange project follows. Note again that each of EPA’s criteria is addressed even if to say it doesn’t apply. Include additional information as needed to explain answers. Modify as needed to address the specific project type. If the project doesn’t fit a project type in 40 CFR 93.127, as would occur for a regionally significant project, more extensive discussion is needed to explain why the project is not expected to affect capacity or, if it does (as for a lane addition), doesn’t meet the POAQC criteria. For example, an HOV lane project adds capacity but might not affect truck traffic. This is sample language only and will need to be modified or replaced with specific project information.
1.3 Project is Not a Project of Local Air Quality Concern (POAQC)The [project name] Project does not fall within any of the above five categories of projects considered to be POAQCs, as explained below.
[Project Title] Air Quality Conformity Analysis 22
i. The proposed project is not a new or expanded highway project and is not considered to significantly affect diesel truck traffic on SR__. The proposed project is a [type of project – use project types in 40 CFR 93.127 if applicable] project that does not increase the capacity of SR __. This type of project improves highway operations by reducing traffic congestion at existing interchanges or intersections and improving merge operations. Based on the Traffic Operations Report ([provide specific reference & have available for consultation review]) traffic volumes would increase along [road(s) identification – for interchange project probably the local street]. However, the traffic volumes along [name of the local street] would not approach or exceed the 125,000 AADT criterion for a POAQC. In addition, the total truck volume would remain below the 10,000 AADT criterion (8% of 125,000 AADT) for POAQC ([briefly summarize basis, such as ”based on a worst case assumption of 8 percent truck trips on [local street]”]). The future traffic volumes on [name of key street(s)] are shown in Table A.
ii. The proposed project does not affect intersections that are at level of service (LOS) D, E, or F with a significant number of diesel vehicles. As indicated in Tables B and C, the project does not worsen or improves LOS at a majority of the intersections in the project area. The intersections where the proposed project will increase delay would not be affected by a significant increase in the number of diesel vehicles.
iii. The proposed project does not include the construction of a new bus or rail terminal.
iv. The proposed project does not expand an existing bus or rail terminal.
v. The proposed project is not in or affecting locations, areas, or categories of sites that are identified in the PM10 and PM2.5 applicable implementation plan or implementation plan submission, as appropriate, as sites of violation or possible violation.
Therefore, the proposed project meets the Clean Air Act requirements and 40 CFR 93.116 without any explicit hot-spot analysis. The proposed project would not create a new, or worsen an existing, PM10 and PM2.5 violation.
1.4 Supporting InformationFollowing table has some sample numbers from a San Joaquin Valley project. Insert appropriate data for the project.
1.1.1 Table A: Traffic Data – Daily Traffic on [name of street/road]
Model Year Without Project(AADT / Truck ADT /
Truck %)
With Project(AADT / Truck ADT / Truck %)
Project Related Increase in Traffic
(AADT / Truck AADT / % difference in truck
AADT)2015 3,800 / 304 / 8% 10,100 / 808 / 8% 6,300 / 504 / 165%2035 18,900 / 1,512 / 8% 50,300 / 4,024 / 8% 31,400 / 2,512 / 266%
Source: [identify traffic study and date].
[Project Title] Air Quality Conformity Analysis 23

1.1.2 Discussion of Traffic Data [if needed]If Build and No Build traffic data are the same, and lanes are added, explain why in accompanying text; U.S. EPA and FHWA reviewers always question that if capacity is increased. Be prepared to defend truck % and volumes particularly with poor peak or daily LOS and high truck volumes – is the % really constant for Build vs. No Build and opening vs. design years? Increased traffic with the Build alternative is expected if lanes (auxiliary or through, including HOV) are added. However, the road should operate better with Build than with No Build (consider adding speed/LOS data if available) which would usually mitigate the effect of a modest traffic increase.
Large (more than about 10%) changes in truck traffic should be explained even if the actual numbers are low. In the sample case, for instance, the more-than-doubling of trucks between No Build and Build should be explained even though the overall volumes (total and trucks) are well below U.S. EPA’s criteria for doing a detailed analysis. The actual volumes (<< 100,000 AADT or 10, 000 truck AADT) are the main reason why the project is Not a POAQC.
1.1.3 Table B: Intersection Analysis – Year 2015 Conditions
Intersection Peak Hour
No Build Build Alternatives
Control Delay LOS Control
Delay LOS
1. [location]AM >150 F >150 FPM >150 F >150 F
2. [location]AM >150 F >150 FPM >150 F 111 F
[ … more as needed/available]AM
PM
1.1.4 Table C: Intersection Analysis – Year 2035 Conditions
Intersection Peak Hour
No Build Build Alternatives
Control Delay LOS Control
Delay LOS
1. [location]AM >150 F >150 F
PM >150 F >150 F
2. [location]AM >150 F >150 FPM >150 F 111 F
[ … more as needed/available]AM
PM
1.1.5 Discussion of Intersection Data [if needed]If intersection LOS is D or worse and doesn’t improve with the project, explain why. Describe the land use and traffic generators around the intersections, why they don’t involve substantial
[Project Title] Air Quality Conformity Analysis 24
diesel traffic, and what kind of (or lack of) localized impact is expected. In the examples shown (from a San Joaquin Valley project), for instance, it’s stated elsewhere (specific traffic data would be better) that diesel traffic is not involved at the affected intersections, and the data show that while LOS is and F with or without the project the delay is a bit better with the project – that would usually reduce emissions slightly. While the conformity guidance usually requires just Build/No Build in the opening and design years, comparison to existing (baseline) conditions for project-level hot-spot analysis might also be useful if LOS is very poor now and improves with the project. It would also be useful to indicate how long the peak period is – a peak hour usually doesn’t cover the real extent of peak congestion.
If the daily and/or truck traffic varies by more than about 10% between segments (such as between different intersections or interchanges), expand the Table A to show that. Under those circumstances, it might also be worthwhile to add daily volumes (though not LOS – that’s usually meaningless for daily volumes) to Table B.
1.5 Conclusion:There is no reason to believe that this project would create a new violation or worsen an existing violation of the PM10 & PM2.5 National Ambient Air Quality Standards (NAAQS). This project does not meet the U.S. EPA criteria for being a Project of Local Air Quality Concern (POAQC).
Caltrans [or other project sponsor] has completed this PM10 & PM2.5 [or just PM10 or PM2.5 depending on the area] hot-spot assessment and has determined that this project is not “Project of Air Quality Concern;” therefore no further PM hot-spot analysis is required for conformity [Omit the following if this documentation is done for areas where no PM conformity analysis is needed for conformity.] upon concurrence with this determination by Interagency Consultation.
1.6 Public Involvement Process:Public involvement discussion is only applicable for NEPA EA and EIS projects. CE projects don’t require it. For CE projects, simply state:
This project was categorically excluded from NEPA requirements. Therefore no public circulation of this hot-spot review or an updated conformity determination is required.
Otherwise (for EA and EIS documents) use this language:
"Transportation Conformity" is a process set up under the Federal Clean Air Act to ensure that transportation planning, transportation improvement programs, and projects are consistent with plans to achieve and maintain federal air quality standards. Specific requirements are set by EPA regulations in 40 CFR 93, EPA and FHWA guidance documents, and local regulations and/or procedures set up by the [identify MPO and air districts; if there is an adopted conformity SIP, reference it e.g. “and as provided in the Conformity SIP approved by U.S. EPA”]. A(n) [identify type of CEQA and NEPA document(s)] is being prepared, which is anticipated to be available for public review in [general timeframe for NEPA public review]. Public comment will be requested as part of the circulation process for the NEPA document. [Alternative, for “add-on” conformity studies where NEPA is already done: “A(n) [type of NEPA document] was completed and a [ROD/FONSI] signed on [date]. Public comment will be requested on this PM hot-spot review, consistent with NEPA procedures or what was done for the original NEPA document, before the next federal approval action for the project.”
[Project Title] Air Quality Conformity Analysis 25
Attach backup information for the information in this summary. Include project layouts (preferably on aerial photos which show surrounding land uses), traffic study, and any other information that might help non-technical staff on the interagency consultation committee understand what the project is and does.
PM standards are daily and annual, not hourly. AADT must be provided and discussed as in Table A above. Peak hour data are relevant only for intersection LOS discussions, and should if possible include truck % or volume in addition to total. Where there may be significant differences between peak and off-peak truck traffic, those should be explained, but the ultimate focus is on daily truck and total volumes not peak hours. Major focus is on diesel emissions, but if a detailed analysis is done (not covered here – see U.S. EPA Guidance for details) it must include re-entrained dust in PM10 areas; in PM2.5 areas re-entrained dust must only be included if certain U.S. EPA, ARB, and air district findings are made or an U.S. EPA-approved PM2.5 SIP requires it.
Hot-spot analysis in general must cover the expected highest-emission year. Normally, that will be either the opening year or the horizon/design year (at least 20 years after opening). The opening year will have the highest emission factors, and the design year will have the most traffic (though lower emission factors), so one of those years is likely to be the worst for emissions. Both years must be included in any traffic or air quality analysis that supports the conformity determination (and usually the CEQA and NEPA documents as well). If conditions exist that are likely to cause rapid traffic increase after opening, such as an expected new land use that will generate large numbers of new trips shortly after project opening, an additional analysis year should be provided that reflects the increased traffic, such as 5 years after the opening year. Note that emission factors decline over time, so traffic increases that occur more or less linearly between opening and horizon years, or that occur late in the analysis period, are unlikely to require an “extra” analysis year. However, “step” increases that occur early in the project’s operating life can cause a problem due to relatively high emission factors.
While the horizon or design year normally should be 20 years after the project opens to traffic, it is somewhat flexible. For instance, if the design year of a project would be less than 3 years beyond the horizon year for the RTP, the RTP horizon year is commonly used. That avoids potential issues with traffic or modeling procedures in years beyond those available from regional modeling or EMFAC. Be sure to discuss this with the interagency consultation group.
[Project Title] Air Quality Conformity Analysis 26

Appendix E. PM Hot-Spot Analysis This appendix is used if a project is determined to be a POAQC, and a detailed hot-spot analysis is performed. Analysis for a POAQC must use either 1) emission analysis consistent with U.S. EPA guidance of March 2006 (if started before December 2012), or 2) dispersion modeling studies consistent with U.S. EPA guidance of December 2010. Interagency consultation is required to determine the proper approach for studies started during the transition period between methods (December 2010-December 2012). The analysis should be documented in this appendix and copies of all modeling inputs, outputs, and interpretation must be included. Considerable detail is needed in the PM Interagency Consultation Appendix (Appendix D) regarding concurrence in choice of model, planning assumptions, and other details.
Documentation is generally similar to CO, but the PM standards are 24-hour and annual so comparison to standards requires calculation of design values rather than simple comparison to a number. In addition, more details are needed if dispersion modeling is done because the U.S. EPA-standard models AERMOD or CAL3QHCR are used; CALINE4 cannot be used for this analysis. U.S. EPA Guidance generally requires dispersion modeling for detailed analysis that is started after November 2012, and allows completion of emission analysis-based (EPA 2006 guidance) detailed analyses started before that time.
Add or modify text as needed to describe the specifics of the project and the location.
Analysis Method
This project was determined to be a Project of Concern (POAQC) for localized particulate matter [PM10 and/or PM2.5], based on interagency consultation concluded on [date]. Project-level particulate matter (PM) analysis was started on [date]. Analysis follows the U.S. EPA Guidance of [2006 or 2010]. [If analysis used 2006 guidance] Analysis is based on comparison of Build alternative emissions with No Build to determine whether the project is likely to cause or worsen a localized violation of the [PM10 and/or PM2.5annual and/or 24-hour] [PM10 is only a 24-hour standard] standards. [If analysis used 2010 guidance] Analysis is based on dispersion modeling of PM emissions from the project, and comparison of design values derived from that modeling to the applicable [PM10 and/or PM2.5] standards at sensitive receptor locations.
[Add text as needed to describe specifics of how this analysis was done.]
[Project Title] Air Quality Conformity Analysis 27

Summary Conclusion
The project will not cause, contribute to, or worsen an existing violation of the [adjust depending on what the area is nonattainment or maintenance for] PM10 24-hour, PM2.5 annual, and PM2.5 24-hour standards. [If emission analysis was used] Based on emission analysis, the Build Alternative will produce PM[10, 2.5, or 10 and 2.5] emissions that are not greater than [“lower than” is preferred] than No Build, will not reduce LOS at (an) intersection(s) with a substantial number of trucks to D or worse, and will not move emissions significantly closer to existing sensitive receptors. Therefore, the project is unlikely to cause or contribute to, or worsen existing, violations of the PM standards. [If dispersion modeling is used] Based on dispersion modeling analysis, the project will not cause or contribute to, or worsen existing, violations of the [PM10, 2.5, or 10 and 2.5] standards in the project area.
[If these findings cannot be made, then mitigation measures might be added that, if effective, would allow the above findings. If mitigation measures are needed, additional text must be developed to describe them and make appropriate findings. If there is no way to avoid increased emissions or if the project does cause or worsen violations, it can’t go forward as-is and an AQCA report would probably not be done.]
Planning Assumptions
Traffic volumes, fleet mix, and roadway link speeds were determined using traffic analysis developed for this project. Land use and regional travel modeling information, if used, were determined in consultation with the [MPO or RTPA], [name of MPO or RTPA]. Emission models described below were used, with concurrence by interagency consultation.
The project is listed in the conforming Regional Transportation Plan (RTP) and Transportation Improvement Program (TIP) as [project description/design concept and scope] for opening in the [begin and end dates/years] conformity analysis period. Analysis years described below (Roadway and Traffic Conditions section) were based on an open-to-traffic year consistent with the RTP, a horizon year based on the Design Year of the project or the horizon year of the RTP conformity analysis, and other year(s) as needed to capture the year of likely highest emissions.
If the full 20-year period after opening goes beyond the RTP and EMFAC, use a linear or other justified extrapolation from RTP or EMFAC horizon years. For analysis of years beyond the last year available from EMFAC, hold the final EMFAC year’s emission factors constant and apply them to extrapolated traffic; this will, of course, cause apparent increased emissions compared to the final year available in EMFAC.
[Project Title] Air Quality Conformity Analysis 28
[If dispersion modeling (EPA 2010 guidance) is done] The [AERMOD or CAL3QHCR] dispersion model was used to calculate pollutant concentrations at receptor locations in the vicinity of the project. Interagency Consultation concurred with model choice on [date].
[Add text as needed. Specifics of date(s) and what was discussed for interagency consultation must be included.]
Roadway and Traffic Conditions
Hot-spot analysis was performed using [hourly, or peak and off-peak] and annual average daily traffic volumes, truck volumes or percentage, and average speed for the entire project and, if identified, specific roadway links within the project were determined using traffic analysis developed for this project. The traffic analysis was compared to regional travel demand data, and any adjustments are explained in the traffic analysis report. Analysis was prepared for the following scenarios:
Insert list of scenarios, such as (but not limited to):
Baseline/Existing (year), [Required] Open-to-traffic year (year) without project; [Required] Open-to-traffic year (year) with project; Other year (year) without project [if needed to represent highest-emission year] Other year (year) with project [if needed to represent highest-emission year] [Required] 20-year horizon year or (if later) RTP horizon (year) without project, and [Required] 20-year horizon year or (if later) RTP horizon (year) with project.
Insert table of AADT, AM Peak, Midday off-peak, PM Peak, and Overnight off-peak data for all traffic, % trucks, truck volume, and average speed. At minimum, provide data for each direction for the whole project. If data are available for more periods, include them. If a project runs through major intersections or interchanges, additional detail will be needed, such as LOS and average speeds at the intersections and interchanges. List all roadway network links, with all traffic information for each link that is defined for emission modeling using EMFAC.
TABLE 1: Traffic Data Used for Modeling
Link AADT AM Peak (3 hr) PM Peak (3 hr) Day Off-Peak Night Off-PeakAll Trk Spd All Trk Spd All Trk Spd All Trk Spd All Trk Spd
NBSBEtc.
[Project Title] Air Quality Conformity Analysis 29
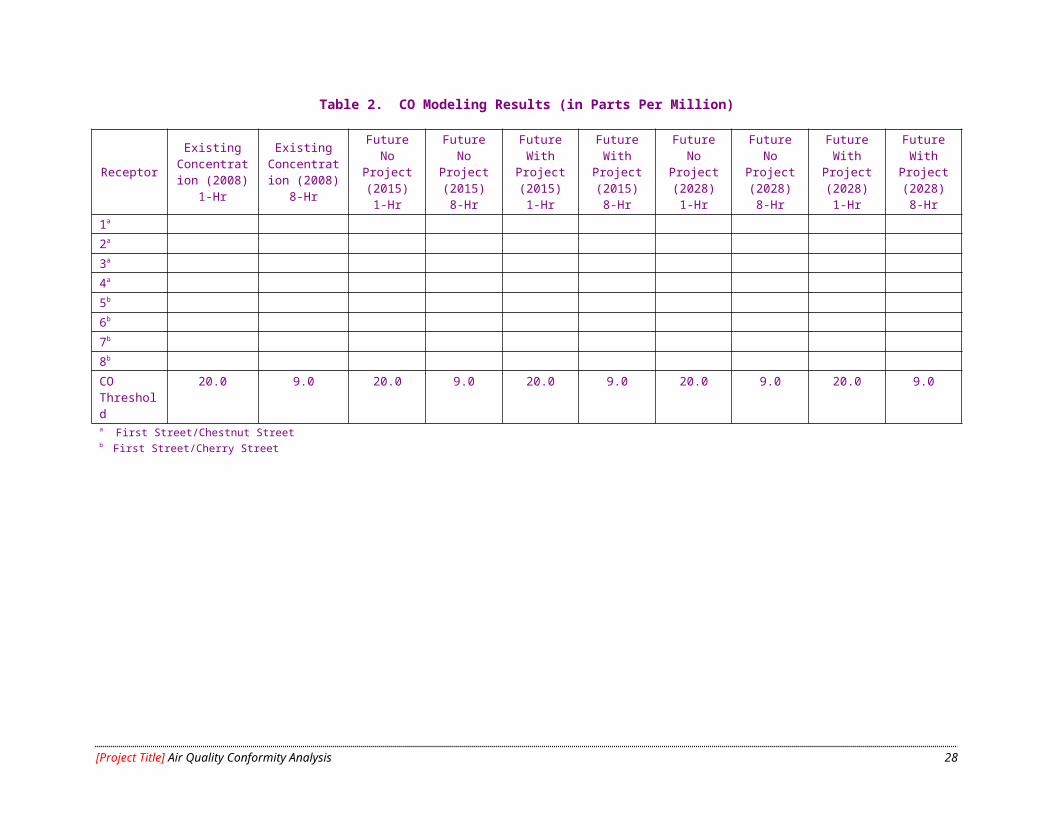
Figure 1: Diagram of Emission Modeling Links [consider overlaying on project layout or air photo]
While emission modeling (U.S. EPA 2006 guidance) might not require a lot of road network detail, dispersion modeling (U.S. EPA 2010 guidance) requires that an emission modeling link be defined for every road segment (including possibly individual lanes) that has a generally uniform operating character. Intersections, in particular, will generally have a minimum of 4 links in each direction for each leg of the intersection (approach cruise, queue, acceleration, and departure cruise); each link will have a volume, truck volume or %, and average speed for each analysis year. Additional emission modeling links may be needed for channelization lanes that have separate queues, HOV or transit lanes, and the like. For projects with many emission modeling links, it may be appropriate to include the complete listing in Appendix F or another appendix that also includes all other modeling data and results, and refer to it here. Then include here only summary data for the whole project.
INCLUDE A DIAGRAM OF THE LINK LAYOUT HERE UNLESS VERY COMPLEX – if too detailed refer to the other appendix where modeling details are provided.
Links for emission modeling may differ from links for dispersion modeling: dispersion models cannot handle curves, so a curved emission link might be broken up into several short linear links for dispersion modeling. Traffic data will be uniform for emission modeling links and any sub-links of them used for dispersion modeling.
Vehicle Emission Rates
Vehicle emission rates were determined using the California Air Resources Board's EMFAC ____ emission factor program. EMFAC [year] was made available by U.S. EPA for conformity analysis purposes on [date of Federal Register or other notice]. [If applicable:] The CT-EMFAC [version number] tool published by the California Department of Transportation (Caltrans), which is based on EMFAC ____ and was approved for conformity use by U.S. EPA on [date], was used for this project.
[If PM10 is being analyzed, or if the SIP or EPA/ARB findings indicate that re-entrained dust must be included in PM2.5 analysis, add:] EMFAC produces emission rates for exhaust emissions, tire wear, and brake wear. In addition to those emissions, this project is located in an area where re-entrained road dust emissions must be included. The latest U.S. EPA AP-42 analysis method for paved road dust is used; paved road dust emissions are added to emissions estimated using EMFAC or CT-EMFAC to determine the total emissions from the project or any
[Project Title] Air Quality Conformity Analysis 30
analysis network link. [If a different method is used, based on interagency consultation and approval of the alternative method in the SIP, change this language as needed.]
[Use the following section if emission analysis (U.S. EPA 2006 guidance) was used]
Qualitative Emission Analysis (2006 U.S. EPA Guidance)
Qualitative emission analysis based on the methodology outlined in the 2006 U.S. EPA Guidance was carried out for this project. Emissions evaluated include direct exhaust emissions, tire wear, and brake wear. [If in a PM10 area, or a PM2.5 area where road dust emissions are considered significant in the SIP or by EPA/ARB findings:] Paved road dust emissions were calculated and added to direct vehicle emissions. [If in a PM2.5 area where required by the SIP or EPA/ARB findings; as of 10/2013 does not apply in California:] NO2 emissions were also calculated as precursors to PM2.5.
The project was determined to be a project of concern (POAQC) through interagency consultation, on [date]. The modeling approach including planning assumptions and emission model version was concurred with by interagency consultation on [date], and the approach was concurred with by interagency consultation on [date]. Results were reviewed with interagency consultation on [date] and concurrence was obtained on that date.
In order to show that the project is unlikely to cause or contribute to, or worsen existing, PM hot-spots, emissions from the Build alternative must be equal to or lower than emissions from the No Build or No Project alternative. The emission analysis for this project demonstrates that this criterion is met (see Table xxx). In addition, the project cannot move emissions significantly closer to existing sensitive receptors, and cannot cause intersection operation where a substantial number of diesel trucks are present to deteriorate below LOS D. This project also meets those criteria.
[Insert Table xxx with results of emission calculations for the whole project, by alternative, and for each emission link evaluated if the project is broken down into more detailed links.]
[Insert Table yyy with results of truck volume and LOS analysis for intersections affected by the project.]
[If the project moves emissions closer to sensitive receptors than no project, but has lower emissions, include:] The project will move emissions up to ___ feet (___ meters) closer to sensitive receptors. Given the overall reduction in emissions, this is not considered to be a significant reduction in distance to sensitive receptors.
[Project Title] Air Quality Conformity Analysis 31
Based on this emission analysis, the Build Alternative will produce PM [2.5 and/or 10] emissions that are not greater than [“lower than” is preferred] than No Build, will not reduce LOS at (an) intersection(s) with a substantial number of trucks to D or worse, and will not move emissions significantly closer to existing sensitive receptors. Therefore, the project is unlikely to cause or contribute to, or worsen existing, violations of the PM standards.
If all of those criteria are not met—see U.S. EPA 2006 Guidance for details—the the project either needs dispersion analysis or cannot meet project-level conformity requirements. In that case, the AQCR would probably not be prepared, unless mitigation measures can be developed that reduce emissions or the effects of emissions to where hot-spot requirements can reasonably be argued to be met. If mitigation measures are needed to make the analysis work, interagency consultation concurrence in use of the mitigation measures and their effect on the analysis is needed, and must be well-documented.
Detailed documentation of emission analysis, including emission model input documents and reports, is included in Appendix [F or G as appropriate – may want to use a separate appendix if CO modeling is also done].
[Use the following section if dispersion modeling (U.S. EPA 2010 guidance) was used]
Quantitative Hot-spot Analysis (2010 U.S. EPA Guidance)
Quantitative dispersion modeling analysis based on the methodology outlined in the 2010 U.S. EPA Guidance was carried out for this project. Emissions evaluated include direct exhaust emissions, tire wear, and brake wear. [If in a PM10 area, or a PM2.5 area where road dust emissions are considered significant in the SIP or by EPA/ARB findings] Paved road dust emissions were calculated and added to direct vehicle emissions. [If in a PM2.5 area where required by the SIP or EPA/ARB findings] NO2 emissions were also calculated as precursors to PM2.5.
The project was determined to be a project of concern (POAQC) through interagency consultation, on [date]. Modeling approach including planning assumptions and emission model version was concurred with by interagency consultation on [date]. Dispersion modeling was carried out using [AERMOD or CAL3QHCR] using procedures defined in the U.S. EPA 2010 PM Hot-spot Analysis Guidance, and the approach was concurred with by interagency consultation on [date]. Results were reviewed with interagency consultation on [date] and concurrence was obtained on that date.
[Project Title] Air Quality Conformity Analysis 32

Meteorological Conditions
Meteorological inputs to the dispersion model were determined using the methodology recommended in the 2010 U.S. EPA Guidance, U.S. EPA’s general modeling guidance (‘Appendix W’), and specific U.S. EPA guidance for the dispersion model used. Meteorological data were obtained from [source] for (the) monitoring station(s) at [site(s)] for at least 5 years up to and including the most recent year for which data are available. [If AERMOD was used:] Surface data for the project area is based on weather data from [site(s)], and upper air data are based on data from [sites(s)]. Locations of surface data monitoring locations with respect to the project are shown in Figure ___ [a map] below.
In rare cases, meteorological data may be based on a station set up at the project site. If that is done extensive documentation of the station location and setup are needed – for one site, that can be done here, but for multiple sites it might be better summarizing and including site data in an appendix. On-site surface meteorology data usually can be for only one year if desired.
Background Concentrations
Background concentrations used in the emission model are based on 5 years of concentration data at the [location] monitoring site operated by [agency]. Background concentrations are projected for future years using methods described in the U.S. EPA 2010 Guidance document or as specified in an approved SIP. Background concentrations are added to the modeled project concentrations to determine whether the National Ambient Air Quality Standards (NAAQS) are violated at any given receptor location. If violations are projected, concentrations are compared with concentrations similarly modeled for the No Project alternative, and the effect of potential mitigation measure may be examined.
Background concentrations applied to the various parts of the project, in the analysis years used, are summarized in Table ____ below. Monitoring station locations are shown in Figure ___ [a map] below showing their relation to the project alternative locations.
In rare cases, background data may be based on a station set up at the project site. If that is done extensive documentation of the station location and setup are needed – for one site, that can be done here, but for multiple sites it might be better summarizing and including site data in an appendix. On-site background concentration data usually can be for only one year if desired.
Monitored background concentrations may include high values from unusual conditions, such as a nearby wildfire. U.S. EPA calls these “exceptional events” and allows them to be excluded from data used to determine attainment if certain conditions are met. If such data exist in the dataset used for the project, that can be excluded only if 1) an approved SIP includes an
[Project Title] Air Quality Conformity Analysis 33

approved exceptional event exclusion analysis for those data (specific reference is required), or 2) the method is used and approvals granted for exclusion under U.S. EPA’s Exceptional Events policy for SIPs as part of this project-level analysis. Either way, for “exceptional event” data, the exclusion process and results must be described here because dropping those data affects the background concentration. Interagency consultation concurrence in use and results of exceptional even analysis is required, as it is for many aspects of quantitative analysis; in principle, all consultation can be done at once at the end, but it’s often worthwhile to do it during analysis to make sure everybody agrees before a lot of other work is done. WRITE IT UP HERE.
Receptor Locations
PM concentrations were estimated at [insert number of receptor locations] receptor locations located near the project. Based on U.S. EPA 2010 guidance, receptors were initially located using a [meters] grid extending approximately 500m from the edge of traveled way for each project alternative including No Project.
Describe deviations for the standard U.S. EPA receptor grid guidance, why, effect on modeling, etc. Interagency consultation concurrence is required for deviation from the Guidance.
Figure ___ shows the modeling network and receptors used for the modeling analysis. Receptor heights were set at [2.4 meters or insert height].
Insert figure that shows roadways and receptors.
Modeling Results
The PM modeling results are shown in Table ___, and are illustrated in the contour map shown in Figure ___.
Insert a table showing the modeling results and provide appropriate discussion. Due to the likely very large number of receptors in a gridded analysis for larger projects, the table may need to be summarized with full detail in an appendix, and visualization using a concentration contour map is usually necessary. The table and map should be highlighted to show high or maximum values, and values at unusually sensitive receptors such as schools and health care facilities.
[Project Title] Air Quality Conformity Analysis 34
Appendix F. CO Modeling Data and Analysis Graphics
ONLY IF DETAILED PROJECT-LEVEL CO Modeling (CALINE4) was conducted: include copies of all model input data and output reports. Include graphics showing project, analysis network links, receptor locations, and if possible background and modeled pollutant concentrations. Where an extensive grid of receptors is used, a contour plot of modeled concentrations is desirable, and should also be included in Appendix C. Refer to this appendix as appropriate in Appendix C. Sufficient information must be available to allow another modeler to understand the assumptions & inputs, run the model(s), and verify your results.
[Begin typing or copying here]
[Project Title] Air Quality Conformity Analysis 35
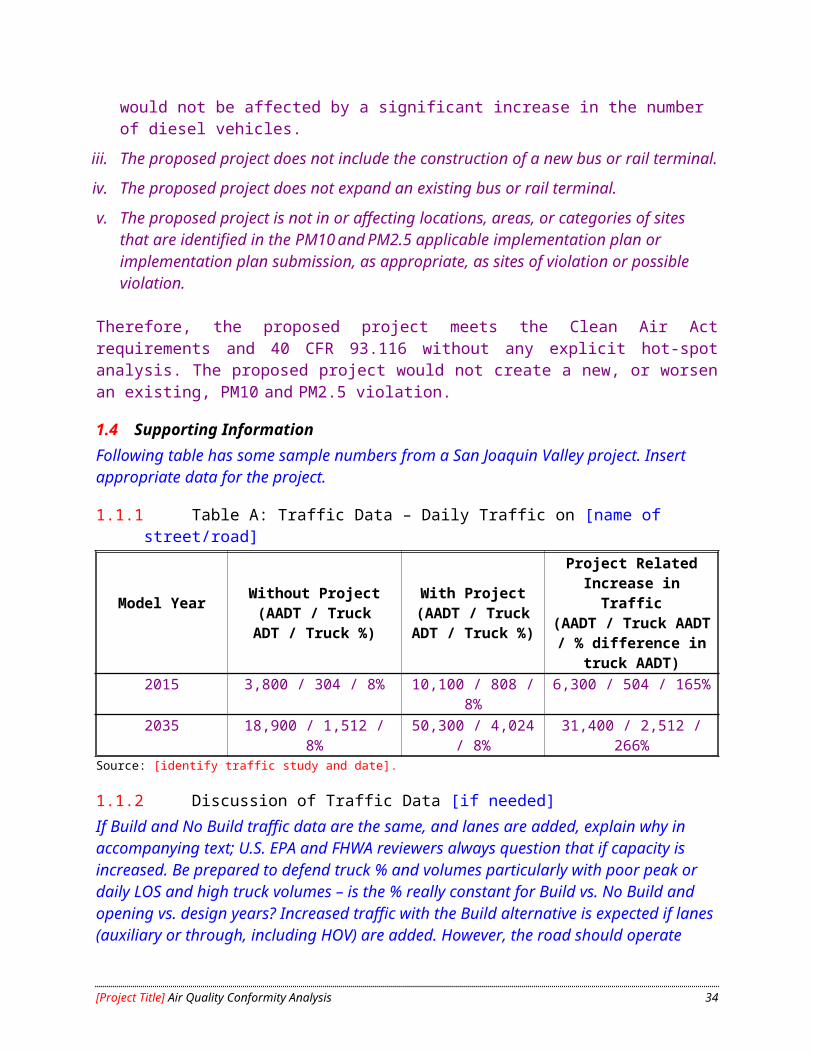
Appendix G. PM Modeling Data and Analysis Graphics
ONLY IF DETAILED PROJECT-LEVEL PM Modeling (CAL3QHCR or AERMOD) was conducted: include copies of all model input data and output reports or provide references to a modeling report and dataset with all the details. Include graphics showing project, analysis network links, receptor locations, and if possible background and modeled pollutant concentrations. Because an extensive grid of receptors is usually used, a contour plot of modeled concentrations is necessary, and should also be included in Appendix D and/or Appendix E. Refer to this appendix as appropriate in Appendices D and E. Sufficient information must be available to allow another modeler to understand the assumptions & inputs, run the model(s), and verify your results.
[Begin typing or copying here]
[Project Title] Air Quality Conformity Analysis 36


![Signalised Intersections [170309]](https://static.fdocuments.in/doc/165x107/577cde291a28ab9e78ae8510/signalised-intersections-170309.jpg)


