Chief Diagnostic Medical Physicist Inspector University of ...

39Chief Medical Officer’s Report 2011
Chapter 1
Demography
this page is intentionally blank

40 41Chief Medical Officer’s Report 2011 Chief Medical Officer’s Report 2011
DemographyChapter 1 – Overview
Populations are the product of births, deaths and migration patterns. They are constantly changing in size and composition. This is a result of many factors impacting on the number of children we have, how long we live for and where we reside. Health, culture and national policies are but a few of these factors. The health of individuals is also influenced by their genetics and their past and present experiences and environments, including those in early life.
This demography chapter focuses on what we can currently say about how the population is changing. It considers birth rates, fertility, ethnic distribution and migration patterns. We know that different populations have different health needs. Some groups have greater behavioural risks or are exposed to different social determinants. Others are at greater biological risk or may simply require specific services (such as pregnant women). By analysing population data from the past, we can begin to anticipate future needs. We can forecast the composition of our population to plan for the population’s future health and healthcare needs.
This chapter includes population statistics from the Office for National Statistics and the University of Leeds (ethnicity projections). These are the most complete and accurate data we have on the demographic composition of England in May 2012. By understanding the current population make-up we can help to ensure that current health, public health and social services are meeting the needs of the population. By understanding how our population is likely to change, we can plan future service development. Whilst the results of the 2011 census will lead to changes to some of our population estimates, the broad messages on which future planning should be based are likely to remain the same.
Forecasting future health is challenging. Our rates of birth and death and migration patterns are all determinants of our current population. It is therefore important to take account of the delicate balance of all factors to anticipate need. What we do know is that with positive net migration, increased fertility rates and declining mortality rates our population is increasing in size and ageing. When a population is already ageing but has a low fertility and mortality rate, changes in death rate in the older age groups are the major determinant of further population ageing.
� With an ageing population, health and healthcare needs will also increase, both for the elderly and for those reaching retirement age. It is well known that older people make much heavier demands on health and social services than young adults. The most elderly make the heaviest demands of all. As the elderly population increases their healthcare needs will outstrip the current provision of care. To address this the focus must be on public health, in conjunction with social care, to increase disability free years through preventative efforts. Stronger mental health support, fracture prevention and ‘warm front’ initiatives are just a few of the approaches that can make a big difference to quality of life.
� The sex composition in the oldest age groups is changing, with males living for longer than previously. The medical and social implications of a more elderly male population are yet to be realised. However, their needs are likely to be different to those of elderly females. Geographical movement within our population is also sizeable, with large numbers of people moving around local areas. Much of the care and support given to elderly people is provided informally by their children or other relatives. With an increase in the ratio of dependent to working age people in the population, and potentially fewer people living near their relatives, family support networks will be tested in their provision of care to the elderly.
� Fertility rates are a critical component in forecasting future needs. There are a huge range of social, economic, cultural and psychological factors that affect the decision to have children. Data show an increase in birth rates at older ages, accompanied by higher risk for both mother and baby. Maternity services will need to adapt to provide for the changing demographic and the risks associated with pregnancy and birth at an older age. Higher risk is also associated with giving birth under 18 years. Encouragingly, we see a reduction in conception and birth rates for this age group.
� Lastly, the demographic data show that our population is becoming more ethnically diverse. We have seen an increase in the contribution of black and minority ethnic groups to our population, particularly Asian people. We have also seen an increase in the number of people from Eastern European countries. This has further implications on health needs and the way we provide healthcare.
This chapter provides a basis on which to build a picture of the health of our nation. Information on mortality and morbidity, risk factors, social determinants of health and healthcare provision should be considered in light of our demographic change.

42 43Chief Medical Officer’s Report 2011 Chief Medical Officer’s Report 2011
DemographyProjected population growth – population size, structure and fertility
Our population is growing and ageing. There will be an increase in the number of males and females in most age groups by 2020. This rise will be most apparent in the older age groups (70 years and over).
Since 2001, the number of babies born has gradually risen. Current figures suggest that women have, on average, two babies in their lifetime. Complication rates, and lifelong health impact, for both mother and child are highest when women fall pregnant under 18 years and over 35 years. Women are more likely to give birth at older ages than a decade ago. In 2000, fertility rates were highest in the 25-29 year age group, whereas in 2010 they are highest between 30-34 years. The number of pregnancies in under 18 year olds has fallen during this time period, with 50% of conceptions leading to abortion (rate 16.6 per 1000 women aged under 18 years in 2010).
There are wide variations in projected population growth across local authorities, ranging from over 20% to under 5% rises over the next 10 years. There is also wide variation in estimated change by age group. Local healthcare planning of provision should hence be tailored to the future composition of its population.

44 45Chief Medical Officer’s Report 2011 Chief Medical Officer’s Report 2011
DemographyProjected population growth – 0 to 39 years

46 47Chief Medical Officer’s Report 2011 Chief Medical Officer’s Report 2011
DemographyProjected population growth – 40 to 85+ years
48 49Chief Medical Officer’s Report 2011 Chief Medical Officer’s Report 2011
DemographyComponents of change – ethnicity
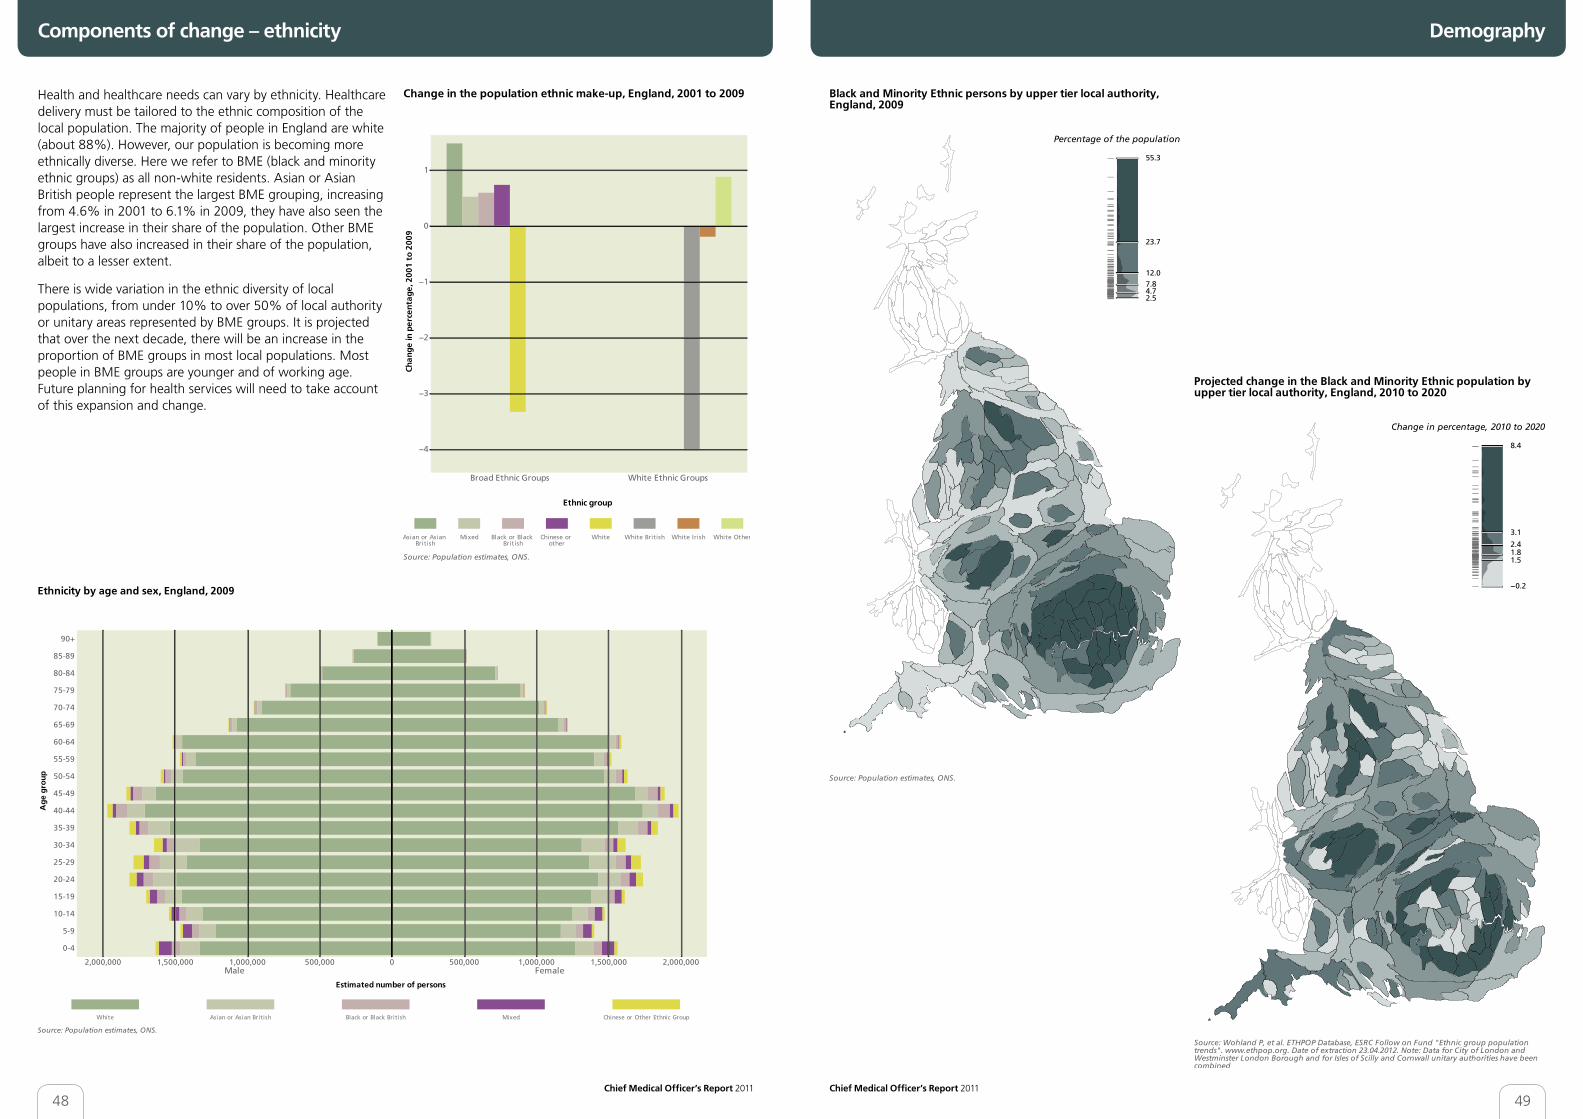
Health and healthcare needs can vary by ethnicity. Healthcare delivery must be tailored to the ethnic composition of the local population. The majority of people in England are white (about 88%). However, our population is becoming more ethnically diverse. Here we refer to BME (black and minority ethnic groups) as all non-white residents. Asian or Asian British people represent the largest BME grouping, increasing from 4.6% in 2001 to 6.1% in 2009, they have also seen the largest increase in their share of the population. Other BME groups have also increased in their share of the population, albeit to a lesser extent.
There is wide variation in the ethnic diversity of local populations, from under 10% to over 50% of local authority or unitary areas represented by BME groups. It is projected that over the next decade, there will be an increase in the proportion of BME groups in most local populations. Most people in BME groups are younger and of working age. Future planning for health services will need to take account of this expansion and change.

50 51Chief Medical Officer’s Report 2011 Chief Medical Officer’s Report 2011
DemographyComponents of change – internal and international migration
Understanding population movement is essential to service planning. Migration can be both international and internal (moves around the UK).
New international immigrants may have specific health needs, dependent on their age and origin. The number of people immigrating to England has increased over the last 20 years, although in recent years this number has plateaued. Emigration is also higher than it was 20 years ago. There were fairly equal contributions of people immigrating from the EU, New Commonwealth and other foreign countries in 2010. Most immigrants are between 15 and 45 years. Future international immigration rates are difficult to predict, being influenced by factors both at home and abroad.
Internal migration is also important, potentially affecting continuity of care. Internal migration estimates are based on GP registrations. While young people move more than older people, the sex differences shown should be treated with caution as they will be influenced by the fact that young men are both less likely and slower to register with GPs. Projected migration between local areas varies, from estimated reductions to increases. However, given the extent of turnover (over 10% for some local authorities), it is crucial that local service planners take account of this in preparing for future need.