Chapter 1 - An Introduction to Computers and Problem Solvingokikeq/documents/Chapter1_003.pdf · 1...
59
1 Chapter 1 - An Introduction to Computers and Problem Solving • 1.1 An Introduction to Computers • 1.2 Windows, Folders, and Files • 1.3 Program Development Cycle • 1.4 Programming Tools
Transcript of Chapter 1 - An Introduction to Computers and Problem Solvingokikeq/documents/Chapter1_003.pdf · 1...
1
Chapter 1 - An Introduction to Computers and Problem Solving
• 1.1 An Introduction to Computers • 1.2 Windows, Folders, and Files • 1.3 Program Development Cycle • 1.4 Programming Tools
2
1.1 An Introduction to Computers
• Miscellaneous Questions

3
Communicating with the Computer
• Machine language – low level, hard for humans to understand
• Visual Basic – high level, understood by humans, consists of instructions such as Click, If, and Do

Compiler • A compiler translates a high-level
language into machine language. • The Visual Basic compiler points out
certain types of errors during the translation process.
4

5
Programming and Complicated Tasks
• Tasks are broken down into instructions that can be expressed by a programming language
• A program is a sequence of instructions • Programs can be only a few instructions
or millions of lines of instructions

6
All Programs Have in Common:
• Take data and manipulate it to produce a result
• Input – Process – Output • Input – from files, the keyboard, or other
input device • Output – usually to the monitor, a printer, or
a file
7
Hardware and Software • Hardware – the physical components of
the computer • Central processing unit • Disk drive • Monitor
• Software – The instructions that tell the computer what to do

8
Programmer and User • Programmer – the person who solves the
problem and writes the instructions for the computer
• User – any person who uses the program written by the programmer

9
Problem Solving • Developing the solution to a problem • Algorithm – a step by step series of
instructions to solve a problem

10
Visual Basic 2010
• BASIC originally developed at Dartmouth in the early 1960s
• Visual Basic created by Microsoft in 1991 • Visual Basic 2010 is similar to original
Visual Basic, but more powerful
11
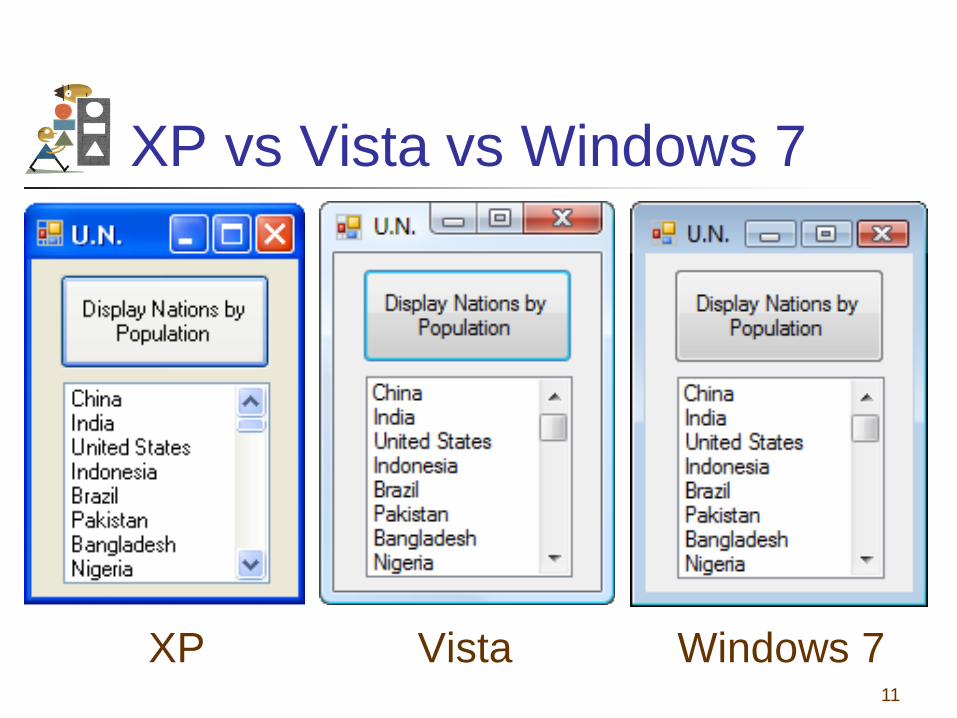
XP vs Vista vs Windows 7
XP Vista Windows 7

12
1.2 Windows, Folders, and Files
• Windows and Its Little Windows • Mouse Actions • Files and Folders

13
Windows and Its Little Windows
• Difference between Windows and windows.
• Title bar indicates if window is active.

14
Mouse Actions:
• Hover • Drag and drop • Click • Right-click • Double-Click

15
Files and Folders
File: holds programs or data. Its name usually consists of letters, digits, and spaces.
Folder: contains files and other folders (called subfolders).
16
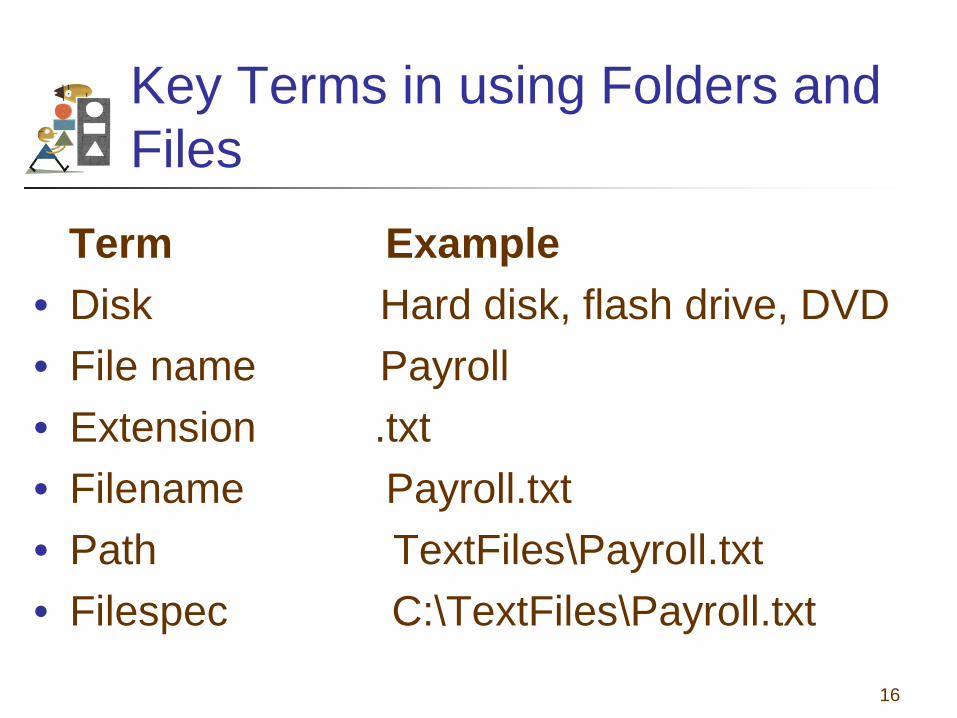
Key Terms in using Folders and Files
Term Example • Disk Hard disk, flash drive, DVD • File name Payroll • Extension .txt • Filename Payroll.txt • Path TextFiles\Payroll.txt • Filespec C:\TextFiles\Payroll.txt
17
Windows Explorer • Used to view, organize, and manage
folders and files. • Manage: copy, move, delete
18
Invoking Windows Explorer
• Right-click on Windows Start button • Click on Explore (or Open Windows
Explorer) in context menu

19
Display File Extensions (Vista & Windows 7)
• Click on Windows Start button. • Type Folder Options into Search box. • Press Enter key. • Click on View tab in dialog box. • Uncheck ″Hide extensions for known file
types″. • Click on OK.

Display File Extensions (Vista & Windows 7 cont.)
20

21
Display File Extensions (XP)
• Alt/Tools/Folder Options • Click the View tab. • Uncheck "Hide extensions for known file
types“. • Click on OK.

22
1.3 Program Development Cycle
• Performing a Task on the Computer • Program Planning

23
Terminology A computer program may also be called:
• Project • Application • Solution
24
Program Development Cycle • Software refers to a collection of
instructions for the computer • The computer only knows how to do
what the programmer tells it to do • Therefore, the programmer has to know
how to solve problems

25
Performing a Task on the Computer
• Determine Output • Identify Input • Determine process necessary to turn
given Input into desired Output

26
Problem-Solving: Approach Like Algebra Problem
• How fast is a car traveling if it goes 50 miles in 2 hours?
• Output: a number giving the speed in miles per hour
• Input: the distance and time the car has traveled
• Process: speed = distance / time

27
Pictorial representation of the Problem Solving Process

28
Program Planning • A recipe is a good example of a plan • Ingredients and amounts are
determined by what you want to bake
• Ingredients are input • The way you combine them is the
processing • What is baked is the output

29
Program Planning (continued) • Always have a plan before trying to
write a program • The more complicated the
problem, the more complex the plan must be
• Planning and testing before coding saves time

30
Program Development Cycle 1. Analyze: Define the problem. 2. Design: Plan the solution to the
problem. 3. Choose the interface: Select the
objects (text boxes, buttons, etc.).

31
Program Development Cycle (continued)
4. Code: Translate the algorithm into a programming language.
5. Test and debug: Locate and remove any errors in the program.
6. Complete the documentation: Organize all the materials that describe the program.

32
1.4 Programming Tools • Flowcharts • Pseudocode • Hierarchy Chart • Direction of Numbered NYC Streets
Algorithm • Class Average Algorithm

33
Programming Tools Three tools are used to convert algorithms into computer programs: • Flowchart - Graphically depicts the logical
steps to carry out a task and shows how the steps relate to each other.
• Pseudocode - Uses English-like phrases with some Visual Basic terms to outline the program.
• Hierarchy chart - Shows how the different parts of a program relate to each other.

34
Algorithm A step-by-step series of instructions for solving a problem (a recipe is an example of an algorithm).

35
Problem Solving Example • How many stamps should you use when
mailing a letter? • One rule of thumb is to use one stamp
for every five sheets of paper or fraction thereof.

36
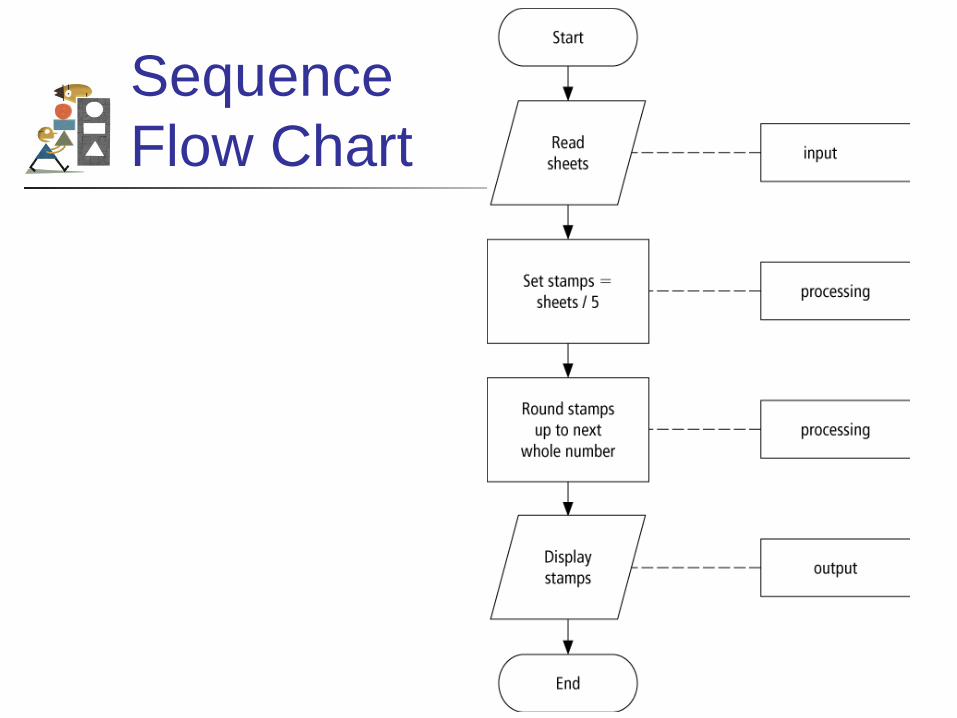
Algorithm 1. Request the number of sheets of paper;
call it Sheets. (input) 2. Divide Sheets by 5. (processing) 3. Round the quotient up to the next
highest whole number; call it Stamps. (processing)
4. Reply with the number Stamps. (output)

37
Flowchart Graphically depicst the logical steps to carry out a task and show how the steps relate to each other.

38
Flowchart Symbols

39
Flowchart Symbols (continued)

40
Flowchart Example

41
Pseudocode Uses English-like phrases with some Visual Basic terms to outline the task.

42
Pseudocode Example Determine the proper number of stamps for
a letter Read Sheets (input) Set the number of stamps to Sheets / 5
(processing) Round the number of stamps up to the
next whole number (processing) Display the number of stamps (output)
43
Hierarchy Chart • Shows how the different parts of a program
relate to each other Hierarchy charts are also called • structure charts • HIPO (Hierarchy plus Input-Process-Output)
charts • top-down charts • VTOC (Visual Table of Contents) charts

44
Hierarchy Charts Example

45
Divide-and-Conquer Method • Used in problem solving – take a large
problem and break it into smaller problems
• Solve the small problems first

46
Statement Structures • Sequence – execute instructions from
one line to the next without skipping over any lines
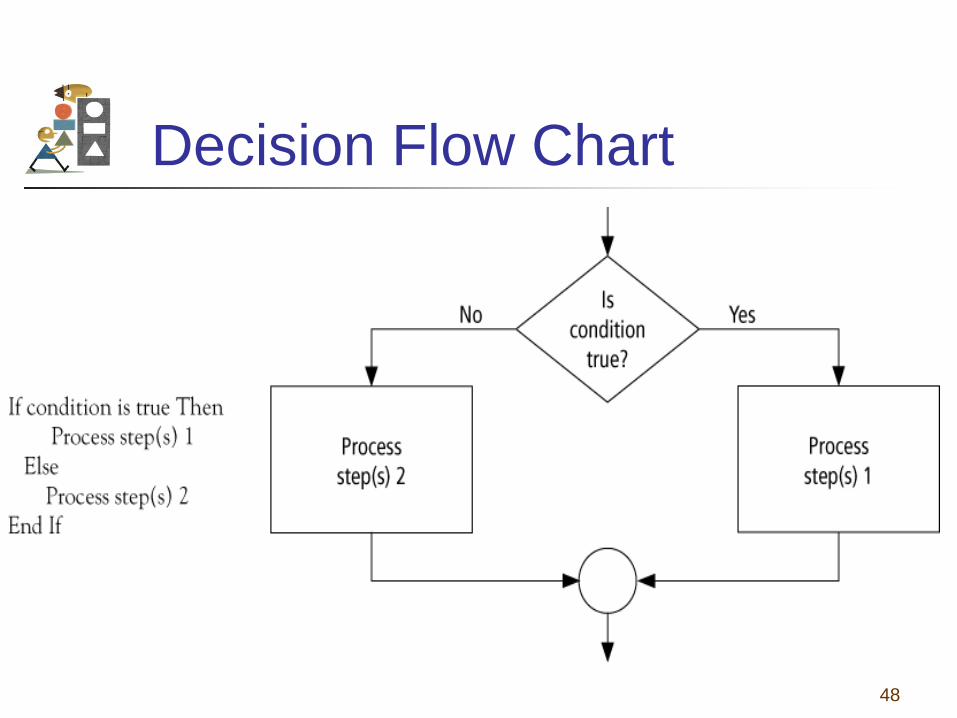
• Decision - if the answer to a question is “Yes” then one group of instructions is executed. If the answer is “No,” then another is executed
• Looping – a series of instructions are executed repeatedly
47
Sequence Flow Chart
48
Decision Flow Chart

49
Looping Flow Chart

50
Direction of Numbered NYC Streets Algorithm
• Problem: Given a street number of a one-way street in New York City, decide the direction of the street, either eastbound or westbound
• Discussion: in New York City even numbered streets are Eastbound, odd numbered streets are Westbound

51
Flowchart

52
Pseudocode Program: Determine the direction of a
numbered NYC street Get street If street is even Then Display Eastbound Else Display Westbound End If

53
Hierarchy Chart
54
Class Average Algorithm Problem: Calculate and report the average
grade for a class Discussion: The average grade equals the
sum of all grades divided by the number of students
Input: Student grades Processing: Find sum of the grades; count
number of students; calculate average Output: Average grade

55
Flowchart

56
Pseudocode Program: Determine average grade of a class Initialize Counter and Sum to 0 Do While there are more data Get the next Grade Add the Grade to the Sum Increment the Counter Loop Compute Average = Sum / Counter Display Average

57
Hierarchy Chart
58
Comments • When tracing a flowchart, begin at the start
symbol and follow the flow lines to the end symbol.
• Testing an algorithm at the flowchart stage is known as desk checking.
• Flowcharts, pseudocode, and hierarchy charts are program planning tools that are in dependent of the language being used.

59
Tips and Tricks of Flowcharts • Flowcharts are time-consuming to write and
difficult to update • For this reason, professional programmers
are more likely to favor pseudocode and hierarchy charts
• Because flowcharts so clearly illustrate the logical flow of programs, they are a valuable tool in the education of programmers