![Evolving Mobile Networks - John Wiley & Sonscatalogimages.wiley.com/images/db/pdf/0470853220.excerpt.pdf · Evolving Mobile Networks ... Ericsson puts it [4], ... The global evolution](https://static.fdocuments.in/doc/165x107/5a7ddb087f8b9a49588ded0b/evolving-mobile-networks-john-wiley-mobile-networks-ericsson-puts-it-4.jpg)
Chapter 1 A Forecasting Overview - John Wiley &...
16
Chapter 1 A Forecasting Overview In This Chapter Knowing the different methods of forecasting Arranging your data in an order Excel can use Getting acquainted with the Analysis ToolPak Going it alone A sales forecast is like a weather forecast: It’s an educated guess at what the future will bring. You can forecast all sorts of things — poppy-seed sales, stock market futures, the weather — in all sorts of ways: You can make your own best guess; you can compile and composite other people’s guesses; or you can forecast on the basis of wishful thinking. Unfortunately, all three of these options are less than desirable. If you want to do better more often than you do worse, you need to take advantage of some better options. Lucky for you, there are different ways to forecast, ways that have proven their accuracy over and over. They’re a little more time consum- ing than guessing, but in the long run I’ve spent more time explaining bad guesses than doing the forecasts right in the first place. Microsoft Excel was originally developed as a spreadsheet application, suited to figuring payment amounts, interest rates, account balances, and so on. But as Microsoft added more and more functions — for example, AVERAGE and TREND and inventory-management stuff — Excel became more of a multipur- pose analyst than a single-purpose calculator. Excel has the tools you need to make forecasts, whether you want to prepare something quick and dirty (and who doesn’t from time to time?) or some- thing sophisticated enough for a boardroom presentation. The tools are there. You just need to know which tool to choose and know how to use it. You need to know how to arrange data for the tool. And you need to know how to interpret what the tool tells you — whether that tool’s a basic one or something more advanced. COPYRIGHTED MATERIAL
Transcript of Chapter 1 A Forecasting Overview - John Wiley &...

Chapter 1
A Forecasting OverviewIn This Chapter� Knowing the different methods of forecasting
� Arranging your data in an order Excel can use
� Getting acquainted with the Analysis ToolPak
� Going it alone
A sales forecast is like a weather forecast: It’s an educated guess at whatthe future will bring. You can forecast all sorts of things — poppy-seed
sales, stock market futures, the weather — in all sorts of ways: You can makeyour own best guess; you can compile and composite other people’s guesses;or you can forecast on the basis of wishful thinking.
Unfortunately, all three of these options are less than desirable. If you want todo better more often than you do worse, you need to take advantage of somebetter options. Lucky for you, there are different ways to forecast, ways thathave proven their accuracy over and over. They’re a little more time consum-ing than guessing, but in the long run I’ve spent more time explaining badguesses than doing the forecasts right in the first place.
Microsoft Excel was originally developed as a spreadsheet application, suitedto figuring payment amounts, interest rates, account balances, and so on. Butas Microsoft added more and more functions — for example, AVERAGE andTREND and inventory-management stuff — Excel became more of a multipur-pose analyst than a single-purpose calculator.
Excel has the tools you need to make forecasts, whether you want to preparesomething quick and dirty (and who doesn’t from time to time?) or some-thing sophisticated enough for a boardroom presentation.
The tools are there. You just need to know which tool to choose and know howto use it. You need to know how to arrange data for the tool. And you need toknow how to interpret what the tool tells you — whether that tool’s a basic oneor something more advanced.
05_575937 ch01.qxd 2/17/05 10:23 PM Page 9
COPYRIG
HTED M
ATERIAL

Understanding Excel ForecastsIf you want to forecast the future — next quarter’s sales, for example — youneed to get a handle on what’s happened in the past. So you always start withwhat’s called a baseline (that is, past history — how many poppy seeds acompany sold last year, where the market futures wound up last month, whatthe temperature was today).
Unless you’re going to just roll the dice and make a guess, you need a base-line for a forecast. Today follows yesterday. What happens tomorrow gener-ally follows the pattern of what happened today, last week, last month, lastquarter, last year. If you look at what’s already happened, you’re taking asolid step toward forecasting what’s going to happen next. (Part I of this booktalks about forecast baselines and why they work.)
An Excel forecast isn’t any different from forecasts you make with a special-ized program. But Excel is a very useful application for making sales fore-casts, for a variety of reasons:
� You often have sales history recorded in an Excel worksheet. Whenyou already keep your sales history in Excel, basing your forecast on theexisting sales history is easy — you’ve already got your hands on it.
� Excel’s charting features make it much easier to visualize what’s goingon in your sales history and how that history defines your forecasts.
� Excel has tools (found in what’s called the Analysis ToolPak) that makegenerating forecasts easier. You still have to know what you’re doing and what the tools are doing — you don’t want to just jam the numbersthrough some analysis tool and take the result at face value, withoutunderstanding what the tool’s up to. But that’s what this book is here for.
� You can take more control over how the forecast is created by skip-ping the Analysis ToolPak’s forecasting tools and entering the formu-las yourself. As you get more experience with forecasting, you’llprobably find yourself doing that more and more.
You can choose from several different forecasting methods, and it’s here thatjudgment begins. The three most frequently used methods, in no specialorder, are moving averages, exponential smoothing, and regression.
Method #1: Moving averagesMoving averages may be your best choice if you have no source of informa-tion other than sales history — but you do need to know your sales history.Later in this chapter, I show you more of the logic behind using moving aver-ages. The underlying idea is that market forces push your sales up or down.By averaging your sales results from month to month, quarter to quarter, or
10 Part I: Understanding Sales Forecasting and How Excel Can Help
05_575937 ch01.qxd 2/17/05 10:23 PM Page 10

year to year, you can get a better idea of the longer-term trend that’s influenc-ing your sales results.
For example, you find the average sales results of the last three months oflast year — October, November, and December. Then you find the average ofthe next three-month period — November, December, and January (and thenDecember, January, and February; and so on). Now you’re getting an idea ofthe general direction that your sales are taking.
Method #2: Exponential smoothingExponential smoothing is closely related to moving averages. Just as withmoving averages, exponential smoothing uses past history to forecast thefuture. You use what happened last week, last month, and last year to fore-cast what will happen next week, next month, or next year.
The difference is that when you use smoothing, you take into account howbad your previous forecast was — that is, you admit that the forecast was alittle screwed up. (Get used to that — it happens.) The nice thing about expo-nential smoothing is that you take the error in your last forecast and use thaterror, so you hope, to improve your next forecast.
If your last forecast was too low, exponential smoothing kicks your next fore-cast up. If your last forecast was too high, exponential smoothing kicks thenext one down.
The basic idea is that exponential smoothing corrects your next forecast in away that would have made your prior forecast a better one. That’s a goodidea, and it usually works well.
Method #3: RegressionWhen you use regression to make a forecast, you’re relying on one variable topredict another. For example, when the Federal Reserve raises short-term inter-est rates, you might rely on that variable to forecast what’s going to happen tobond prices or the cost of mortgages. In contrast to moving averages or expo-nential smoothing, regression relies on a different variable to tell you what’slikely to happen next — something other than your own sales history.
Getting the Data ReadyWhich method of forecasting you use does make a difference, but regardlessof your choice, in Excel you have to set up your baseline data in a particular
11Chapter 1: A Forecasting Overview
05_575937 ch01.qxd 2/17/05 10:23 PM Page 11
way. Excel prefers it if your data is in the form of a list. In Part II, I fill you inon how to arrange your data so that it best feeds your forecasts, but follow-ing is a quick overview.
Using listsThere’s nothing mysterious about an Excel list. A list is something very muchlike a database. Your Excel worksheet has columns and rows, and if you put alist there, you just need to manage three requirements:
� Keep different variables in different columns. For example, you canput sales dates in one column, sales amounts in another column, salesreps’ names in another, product lines in yet another.
� Keep different records in different rows. When it comes to recordingsales information, keep different sales records in different rows. Putinformation about a sale that was made on January 15 in one row, andinformation about a sale made on January 16 in a different row.
� Put the names of the variables in the list’s first row. For example, youmight put “Sales Date” in column A, “Revenue” in column B, “Sales Rep”in column C, and “Product” in column D.
Figure 1-1 shows a typical Excel list.
Why bother with lists? Because many Excel tools, including the ones you useto make forecasts, rely on lists. Charts — which help you visualize what’s goingon with your sales — rely on lists. Pivot tables — which are the most power-ful way you have for summarizing your sales results in Excel — rely heavilyon lists. The Analysis ToolPak — a very useful way of making forecasts — relieson lists, too.
You find a lot more about creating and using lists in Chapter 6. In the mean-time, just keep in mind that a list has different variables in different columns,and different records in different rows.
Ordering your data“Ordering your data” may sound a little like “coloring inside the lines.” Thedeal is that you have to tell Excel how much you sold in 1999, and then howmuch in 2000, and in 2001, and so on. If you’re going to do that, you have toput the data in chronological order.
12 Part I: Understanding Sales Forecasting and How Excel Can Help
05_575937 ch01.qxd 2/17/05 10:23 PM Page 12

The best — and I mean the best — way to put your data in chronological orderin Excel is by way of pivot tables. A pivot table takes individual records thatare in a list (or in an external database) and combines the records in waysthat you control. You may have a list showing a year’s worth of sales, includ-ing the name of the sales rep, the product sold, the date of sale, and the salesrevenue. If so, you can very quickly create a pivot table that totals sales rev-enue by sales rep and by product across quarters. Using pivot tables, you cansummarize tens of thousands of records, quite literally within seconds. If youhaven’t used pivot tables before, this book not only introduces the subject butalso makes you dream about them in the middle of the night.
There are a couple of wonderful things about pivot tables:
� They can accumulate for you all your sales data — or, for that matter,your data on the solar wind, but this book is about sales forecasting. Ifyou gather information on a sale-by-sale basis, and you then want toknow how much your reps sold on a given day, in a given week, and soon, a pivot table is the best way to do so.
� You can use a pivot table as the basis for your next forecast, whichsaves you a bunch of time.
� They have a unique way of helping you group your historical data —by day, by week, by month, by quarter, by year, you name it. Chapter8 gives you much more information on pivot tables, including trou-bleshooting some common problems.
Figure 1-1:You don’t
have tokeep the
records indate order
— you canhandle that
later.
13Chapter 1: A Forecasting Overview
05_575937 ch01.qxd 2/17/05 10:23 PM Page 13

Making Basic ForecastsPart III gets into the business of making actual forecasts, ones that are basedon historical data (that is, what’s gone on before). You see how to use theAnalysis ToolPak to make forecasts that you can back up with actuals — giventhat you’ve looked at Part II and set up your actuals correctly. (Your actuals arethe actual sales results that show up in the company’s accounting records —say, when the company recognizes the revenue.)
The Analysis ToolPak (often abbreviated ATP) is a gizmo that has shipped withExcel ever since 1995. The ATP is a convenient way to make forecasts, as wellas to do general data analysis. The three principal tools Excel’s ATP gives youto make forecasts are:
� Moving Averages
� Exponential Smoothing
� Regression
14 Part I: Understanding Sales Forecasting and How Excel Can Help
All the news that’s fit to print — and then someYou may not be familiar with newsgroups, and ifyou’re not, I think you should be. Newsgroups arewhat used to be called bulletin boards before theInternet and the Web came along. They’re placeswhere you can post questions (for example,about Excel) and a little later on read answersthat other users have posted. (Unfortunately,because newsgroups are largely public, you alsosee a lot of garbage.) One good way to get famil-iar with newsgroups is to use Google:
1. Go to www.google.com.
2. Click on Groups, and then click AdvancedGroups Search.
The Advanced Groups Search link is inreally small print to the right of the SearchGroups button.
3. Enter Microsoft.Public.Excel.* in the ReturnOnly Messages from the Group box.
The asterisk returns all public newsgroupsbeginning with Microsoft.Public.Excel.
4. Enter a word or phrase you want to look forin one of the Find Messages boxes.
For example, you can type add-in to searchspecifically for newsgroups about Exceladd-ins.
5. Click the Google Search button.
You’ll see all the questions — and all theanswers — concerning the word or phraseyou entered that have shown up in thosenewsgroups.
Newsgroups are a great way to find out aboutExcel — or, for that matter, any other application.
05_575937 ch01.qxd 2/17/05 10:23 PM Page 14

Those are the three principal forecasting methods, and they form the basisfor the more-advanced techniques and models. So it’s no coincidence thatthese tools have the same names as the forecasting methods mentioned ear-lier in this chapter.
The Analysis ToolPak is an add-in. An add-in does tasks, like forecasting, onyour behalf. An add-in is much like the other tools that are a part of Excel —the difference is that you can choose whether to install an add-in. For exam-ple, you can’t choose whether the Goal Seek tool (Tools ➪ Goal Seek) is avail-able to you. If you decide to install Excel on your computer, Goal Seek is justpart of the package. Add-ins are different. You can decide whether to installthem. When you’re installing Excel — and in most cases this means whenyou’re installing Microsoft Office — you get to decide which add-ins you want to use.
The following sections offer a brief introduction to the three ATP tools.
Given a good baseline, the ATP can turn a forecast back to you. And thenyou’re responsible for evaluating the forecast, for deciding whether it’s acredible one, for thinking the forecast over in terms of what you know aboutyour business model. After all, Excel just calculates — you’re expected to do the thinking.
Putting moving averages to work for youYou may already be familiar with moving averages. They have two main char-acteristics, as the name makes clear:
� They move. More specifically, they move over time. The first movingaverage may involve Monday, Tuesday, and Wednesday; in that case, the second moving average would involve Tuesday, Wednesday, andThursday; the third Wednesday, Thursday, and Friday, and so on.
� They’re averages. The first moving average may be the average ofMonday’s, Tuesday’s, and Wednesday’s sales. Then the second movingaverage would be the average of Tuesday’s, Wednesday’s, andThursday’s sales, and so on.
The basic idea, as with all forecasting methods, is that something regular andpredictable is going on — often called the signal. Sales of ski boots regularlyrise during the fall and winter, and predictably fall during the spring andsummer. Beer sales regularly rise on NFL Sundays and predictably fall onother days of the week.
But something else is going on, something irregular and unpredictable —often called noise. If a local sporting goods store has a sale on, discountingski boots from May through July, you and your friends may buy new bootsduring the spring and summer, even though the regular sales pattern (the
15Chapter 1: A Forecasting Overview
05_575937 ch01.qxd 2/17/05 10:23 PM Page 15

signal) says that people buy boots during the fall and winter. As a forecaster,you can’t predict this special sale. It’s random and tends to depend on thingslike overstock. It’s noise.
Let’s say you run a liquor store, and a Thursday night college football gamethat looked like it would be the Boring Game of the Week when you were sched-uling your purchases in September has suddenly in November turned into onewith championship implications. You may be caught short if you scheduledyour purchases to arrive at your store the following Saturday, when the signalin the baseline leads you to expect your sales to peak. That’s noise — the differ-ence between what you predict and what actually happens. By definition, noiseis unpredictable, and for a forecaster it’s a pain.
If the noise is random, it averages out. Some months, your stores will be dis-counting ski boots for less than the cost of an arthroscopy. Some months, anew and really cool model will come on line, and they’ll be taking every pos-sible advantage. The peaks and valleys even out. Some weeks there will be anextra game or two and you’ll sell (and therefore need) more bottles of beer.Some weeks there’ll be a dry spell from Monday through Friday, you won’tneed so much beer, and you won’t want to bear the carrying costs of beeryou’re not going to sell for a while.
The idea is that the noise averages out, and that what moving averages showyou is the signal. To misquote Johnny Mercer, if you accentuate the signaland eliminate the noise, you latch on to a pretty good forecast.
So with moving averages, you take account of the signal — the fact that yousell more ski boots during certain months and fewer during other months, orthat you sell more beer on weekends than on weekdays. At the same time youwant to let the random noises — also termed errors — cancel one anotherout. You do that by averaging what’s already happened in two, three, four, or more previous consecutive months. The signal in those months is empha-sized by the averaging, and that averaging also tends to minimize the noise.
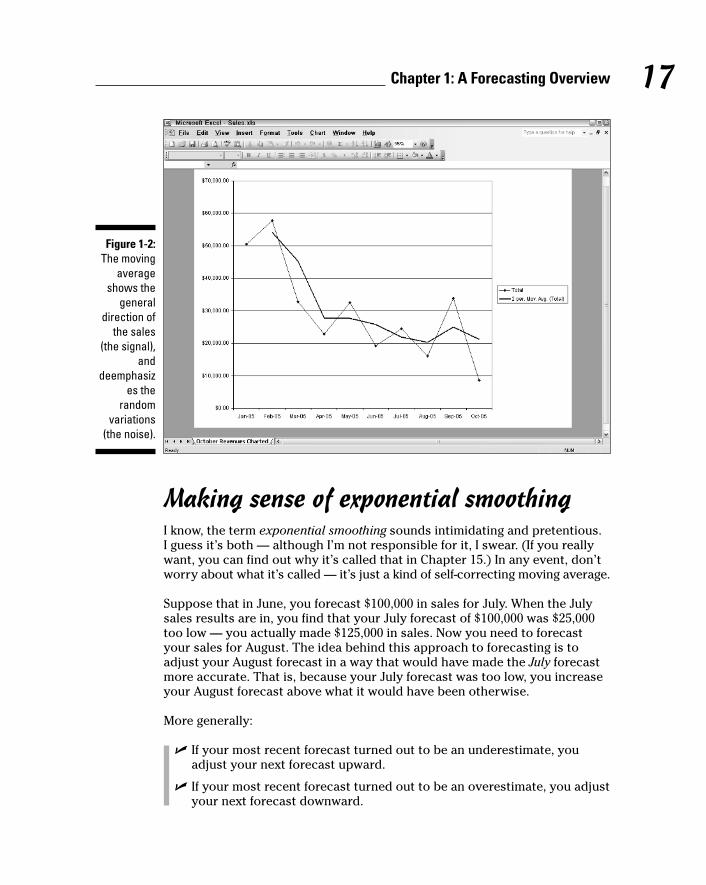
Suppose you decide to base your moving averages on two-month records.That is, you’ll average January and February, and then February and March,and then March and April, and so on. So you’re getting a handle on the signalby averaging two consecutive months and reducing the noise at the sametime. Then, if you want to forecast what will happen in May, you hope to beable to use the signal — that is, the average of what’s happened in March andApril.
Figure 1-2 shows an example of the monthly sales results and of the two-month moving average.
Chapter 14 goes into more detail about using moving averages for forecasting.
16 Part I: Understanding Sales Forecasting and How Excel Can Help
05_575937 ch01.qxd 2/17/05 10:23 PM Page 16
Making sense of exponential smoothingI know, the term exponential smoothing sounds intimidating and pretentious. I guess it’s both — although I’m not responsible for it, I swear. (If you reallywant, you can find out why it’s called that in Chapter 15.) In any event, don’tworry about what it’s called — it’s just a kind of self-correcting moving average.
Suppose that in June, you forecast $100,000 in sales for July. When the Julysales results are in, you find that your July forecast of $100,000 was $25,000too low — you actually made $125,000 in sales. Now you need to forecastyour sales for August. The idea behind this approach to forecasting is toadjust your August forecast in a way that would have made the July forecastmore accurate. That is, because your July forecast was too low, you increaseyour August forecast above what it would have been otherwise.
More generally:
� If your most recent forecast turned out to be an underestimate, youadjust your next forecast upward.
� If your most recent forecast turned out to be an overestimate, you adjustyour next forecast downward.
Figure 1-2:The moving
averageshows the
generaldirection of
the sales(the signal),
anddeemphasiz
es therandom
variations(the noise).
17Chapter 1: A Forecasting Overview
05_575937 ch01.qxd 2/17/05 10:23 PM Page 17

You don’t make these adjustments just by guessing. There are formulas thathelp out, and the ATP’s Exponential Smoothing tool can enter the formulasfor you. Or you can roll your own formulas if you want. Turn to Chapter 15 to see how to do that.
Figure 1-3 shows what you would forecast if your prior forecast (for July) wastoo low — then you boost your forecast for August.
And if your prior, July forecast was too high (you optimist!), you cool yourjets a little bit in your August forecast, as shown in Figure 1-4.
Using regression to get what you wantThe term regression doesn’t sound as bad as exponential smoothing, but it is —I admit — more complicated, at least in terms of the math.
And that’s why the ATP is convenient. It takes responsibility for the math,just as it does with moving averages and exponential smoothing. Remember:You still have to give a good baseline to the ATP to get accurate results.
Here’s a quick look at forecasting with regression. (You can find a moredetailed look in Chapter 11.)
Figure 1-3:Here’s what
happens if your
forecast forJuly was an
underesti-mate.
Notice thatthe Augustforecast iskicked up.
18 Part I: Understanding Sales Forecasting and How Excel Can Help
05_575937 ch01.qxd 2/17/05 10:23 PM Page 18

The idea behind regression is that one variable has a relationship withanother variable. When you’re a kid, for example, your height tends to have a relationship to your age. So if you want to forecast how tall you’ll be nextyear — at least, until you quit growing — you can check how old you’ll benext year.
Of course, people differ. When they’re 15 years old, some people are 5 feet tall,some are 6 feet tall. On average, though, you can forecast with some confi-dence how tall someone will be at age 15. (And you can almost certainly fore-cast that a newborn kidlet is going to be under 2 feet tall, even wearing lifts.)
The same holds true with sales forecasting. Suppose your company sells con-sumer products. It’s a good bet that the more advertising you do, the moreyou’ll sell. At least it’s worth checking out whether there’s a relationshipbetween the size of your advertising budget and the size of your sales rev-enue. If you find that there’s a dependable relationship — and if you knowhow much your company is willing to spend on advertising — you’re in agood position to forecast your sales.
Or suppose your company markets a specialty product, such as fire doors. (Afire door is one that’s supposed to be resistant to fire for some period of time,
Figure 1-4:Your prior
forecastwas toohigh, so
exponentialsmoothingmakes you
back offyour nextforecast.
19Chapter 1: A Forecasting Overview
05_575937 ch01.qxd 2/17/05 10:23 PM Page 19

and there are a lot of them in office buildings.) Unlike consumer products,something such as a fire door doesn’t have to be a particular off-the-shelfcolor or have a fresher-than-fresh aroma. If you’re buying fire doors, you wantto get the ones that meet the specs and are the cheapest.
So if you’re selling fire doors, as long as your product meets the specs, you’dwant to have a look at the relationship between the price of fire doors andhow many are sold. Then you check with your marketing department to findout how much they want you to charge per door, and you can make your fore-cast accordingly.
The point is that more often than not you can find a dependable relationshipbetween one variable (advertising dollars or unit price) and another (usually,sales revenue or units sold).
You use Excel’s tools to quantify that relationship. In the case of regressionforecasts, you give Excel a couple of baselines. To continue the exampleswe’ve used so far in this section:
� Historical advertising expenses and historical sales revenues
� How much you charged per fire door and how many doors you sold
If you give Excel good baselines, it will come back to you with a formula.
� Excel will give you a number to multiply times how much you expect tospend on advertising, and the result will be your expected sales revenue.
� Or, Excel will give you a number to multiply times the unit cost per door,and the result will be the number of doors you can expect to sell.
It’s just a touch more complicated than that. Excel also gives you a number,called a constant, that you need to add to the result of the multiplication. Butas Chapter 11 shows, you can get Excel to do that for you.
Charting Your DataI’ve been doing this stuff for a long time, and I can’t tell you how critical it isto chart your baseline and your forecast. Being able to visualize what’s goingon is important for several reasons.
Using Excel’s charts, you can see how your actuals are doing (see Figure 1-5).And by charting your actuals, you can see how well your sales forecasts doagainst the actual sales results. Figure 1-6 shows a forecast that’s based onmoving averages, against the monthly actuals.
20 Part I: Understanding Sales Forecasting and How Excel Can Help
05_575937 ch01.qxd 2/17/05 10:23 PM Page 20

Figure 1-6:Notice howthe moving
averagelags behind
the actualresults.
Figure 1-5:An Excel
chart makesit much
easier tosee how
your salesare doing.
21Chapter 1: A Forecasting Overview
05_575937 ch01.qxd 2/17/05 10:23 PM Page 21

By charting your baseline and your forecasts, you can:
� See how your actual results are doing. A chart is almost always morerevealing than a table of numbers.
� See how well your forecasts predict actual results. Your eye is a goodgauge of the quality of your forecasts.
� See how well a different variable — advertising dollars or theConsumer Price Index — predicts the sales of your product.
Yes, an R squared or some other summary statistic can give you a conciseestimate of how well your forecasts are working. But there’s nothing, nothing,like a chart to tell you if you’re forecasting results or if you’re forecastingjunk. Chapter 9 shows you how to set up charts with Excel.
Forecasting with Advanced ToolsThere’s a lot to be said for using the Analysis ToolPak to create your fore-casts. The ATP is quick, it does the heavy lifting for you, and it’s pretty com-prehensive, taking care of the math and some of the charting.
But there’s nothing like doing it yourself. When you wave goodbye to the ATP,you establish and maintain control over what’s going on with the forecast. Ifyou have formulas in your worksheet cells — formulas that support your fore-casts — you can change those formulas as your forecasting needs change.And you can change — or add to — the baseline and immediately see whatthe effect doing so has on your forecast.
22 Part I: Understanding Sales Forecasting and How Excel Can Help
A word or two about Excel versionsPivot tables were first introduced in Excel 95.This book has a good bit to say about basingcharts on pivot tables, much of which has beenmade redundant by Excel 2000 and its pivotcharts — beginning with Excel 2000, you cancreate not only pivot tables but also pivot charts.
Many companies continue to use Excel 97,though, and for good reason. The principal argu-ment for upgrading to Excel 2000, 2002, or 2003 isthat other software might rely on Excel to handlecalculations, and that other software requires a
version of Excel that’s more recent than 1997. Acompany that doesn’t have to do the upgrade,though, usually doesn’t — the cost-benefit equa-tion doesn’t say “Upgrade now!”
So, if like many others your company still usesExcel 97, you’ll want to know how to create chartsbased on pivot tables. If your company uses Excel2000 or later, Chapter 9 shows you how to createpivot charts, as well as how to create standardcharts that are based on pivot tables.
05_575937 ch01.qxd 2/17/05 10:23 PM Page 22

When the ATP does not give you formulas but static values instead, you can’texperiment with the forecasts or see the effect of modifying the baseline. Andthe ATP’s Regression tool gives you just the static values. The ExponentialSmoothing tool is a little better, but it mixes formulas with static values. Andthe Moving Averages tool forces you to start over if you want to change thenumber of records in the baseline that make up a moving average.
Suppose that you have the number 3 in cell A1 and the number 5 in cell A2. Incell A3 you can enter the sum of those two numbers, 8. But if you now changethe number 3 in cell A1 to, say, 103, you still have 8 in A3. It’s a constant — anumber, not a formula. It doesn’t react to what’s in cell A1 or A2: You’re stillgoing to see the number 8 in cell A3.
On the other hand, suppose you have this in cell A3:
=A1 + A2
That’s a formula, not a constant, and it tells Excel to add whatever’s in A1 towhatever’s in A2. So if you change what’s in A1, or what’s in A2, Excel recalcu-lates the result and shows it — in this example — in A3.
The point to keep in mind is that the ATP’s regression tool gives you num-bers, not formulas. It calculates your forecast, and the underlying figures, andwrites numbers onto your worksheet. That means, regardless of how youchange the numbers in your baseline, you’re still going to be looking at thesame forecast as offered by the ATP.
But — and it’s a big one — if you make the forecast yourself instead of relyingon the ATP, you can enter the formulas that the ATP denies you. Why is thisimportant? By entering the formulas yourself, you have more control overwhat’s going on with the forecast.
Relying on the ATP, which is a good toolbox, and one that you can generallytrust, is perfectly okay. However, if you enter formulas, ones that react tochanges in your baseline, you can make a change in the baseline and see whathappens to the forecast. You can change this month’s result from $100,000 to$75,000 and see whether your forecast for next month changes substantially.You can’t do that with the ATP’s Regression tool, because it doesn’t give youformulas. To a smaller degree, the same is true of the Exponential Smoothingtool.
But the more important reason, the reason for you to consider entering the for-mulas yourself, is that you’re relying on your own knowledge of how and whyforecasting works. In Part IV, I show you how to use functions like LINEST andTREND to do your regression-based forecasts. You also see how to use arrayformulas to get the most out of those Excel functions.
23Chapter 1: A Forecasting Overview
05_575937 ch01.qxd 2/17/05 10:23 PM Page 23

You don’t need to enter all the formulas yourself to make good forecasts. TheATP is a good tool. But if you do enter the formulas yourself, not only can yoube more confident that you know what’s going on with your forecast, but youcan also exercise more control over what your forecast says is going tohappen. In a business as tricky and trappy as forecasting, the more controlyou have, the better.
24 Part I: Understanding Sales Forecasting and How Excel Can Help
05_575937 ch01.qxd 2/17/05 10:23 PM Page 24