Chapter 1
15
Chapter 1 The Nature of Probability and Statistics
-
Upload
amena-wright -
Category
Documents
-
view
18 -
download
0
description
Chapter 1. The Nature of Probability and Statistics. Chapter 1 Overview. Introduction 1-1 Descriptive and Inferential Statistics 1-2 Variables and Types of Data 1-3 Data Collection & Sampling Techniques 1-4 Observational and Experimental Studies - PowerPoint PPT Presentation
Transcript of Chapter 1

Chapter 1
The Nature of Probability and Statistics

Chapter 1 Overview
Introduction
1-1 Descriptive and Inferential Statistics
1-2 Variables and Types of Data
1-3 Data Collection & Sampling Techniques
1-4 Observational and Experimental Studies
1-5 Uses and Misuses of Statistics
1-6 Computers and Calculators
2Bluman Chapter 1
Introduction Statistics is the science of conducting
studies to
collect,
organize,
summarize,
analyze, and
draw conclusions from data.
3Bluman Chapter 1

1-1 Descriptive and Inferential Statistics A variablevariable is a characteristic or attribute
that can assume different values.
The values that a variable can assume are called datadata.
A populationpopulation consists of all subjects (human or otherwise) that are studied.
A samplesample is a subset of the population.
4Bluman Chapter 1
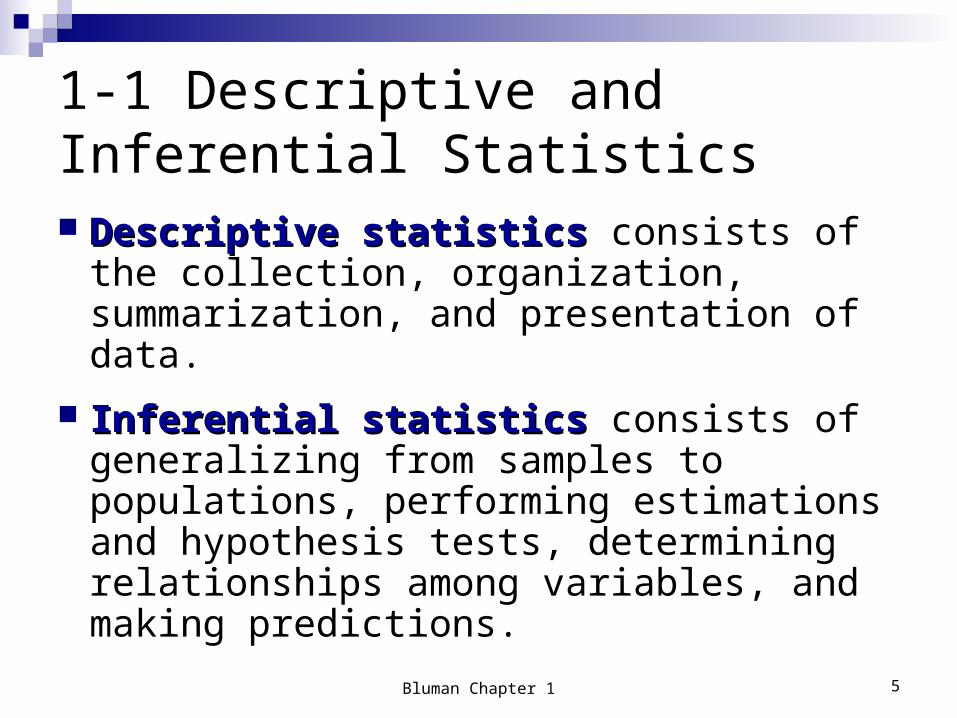
1-1 Descriptive and Inferential Statistics Descriptive statisticsDescriptive statistics consists of the
collection, organization, summarization, and presentation of data.
Inferential statisticsInferential statistics consists of generalizing from samples to populations, performing estimations and hypothesis tests, determining relationships among variables, and making predictions.
5Bluman Chapter 1

1-2 Variables and Types of Data
Data
QualitativeCategorical
QuantitativeNumerical,
Can be ranked
DiscreteCountable
5, 29, 8000, etc.
ContinuousCan be decimals2.59, 312.1, etc.
6Bluman Chapter 1

1-2 Recorded Values and Boundaries
Variable Recorded Value
Boundaries
Length 15 centimeters (cm)
Temperature 86 Fahrenheit (F)
Time 0.43 second (sec)
Mass 1.6 grams (g)
14.5-15.5 cm
85.5-86.5 F
0.425-0.435 sec
1.55-1.65 g
7Bluman Chapter 1

1-2 Variables and Types of Data
Levels of MeasurementLevels of Measurement
1.1. NominalNominal – categorical (names)
2.2. OrdinalOrdinal – nominal, plus can be ranked (order)
3.3. IntervalInterval – ordinal, plus intervals are consistent
4.4. RatioRatio – interval, plus ratios are consistent, true zero
8Bluman Chapter 1

1-2 Variables and Types of Data
Determine the measurement level.
Variable Nominal Ordinal Interval Ratio Level
Hair Color Yes No Nominal
Zip Code Yes No Nominal
Letter Grade Yes Yes No Ordinal
ACT Score Yes Yes Yes No Interval
Height Yes Yes Yes Yes Ratio
Age Yes Yes Yes Yes Ratio
Temperature(F) Yes Yes Yes No Interval
9Bluman Chapter 1
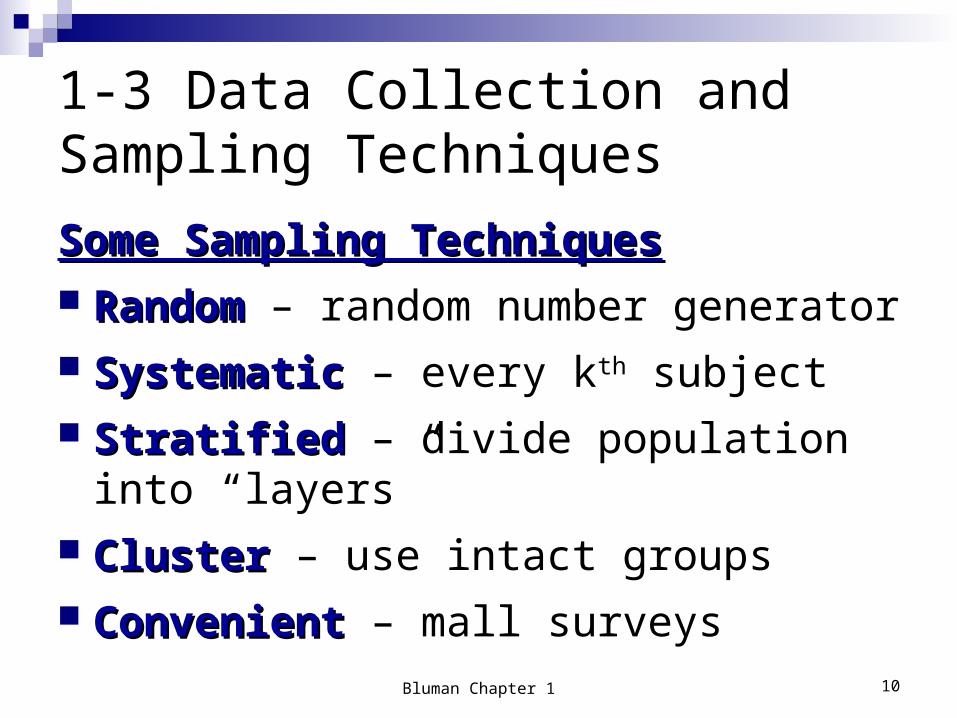
1-3 Data Collection and Sampling Techniques
Some Sampling TechniquesSome Sampling Techniques RandomRandom – random number generator SystematicSystematic – every kth subject StratifiedStratified – divide population into “layers” ClusterCluster – use intact groups ConvenientConvenient – mall surveys
10Bluman Chapter 1

1-4 Observational and Experimental Studies In an observational studyobservational study, the researcher
merely observes and tries to draw conclusions based on the observations.
The researcher manipulates the independent independent (explanatory) variable(explanatory) variable and tries to determine how the manipulation influences the dependent dependent (outcome) variable(outcome) variable in an experimental studyexperimental study.
A confounding variableconfounding variable influences the dependent variable but cannot be separated from the independent variable.
11Bluman Chapter 1

1-5 Uses and Misuses of Statistics
Suspect SamplesSuspect Samples Is the sample large enough?Is the sample large enough?How was the sample selected?How was the sample selected? Is the sample representative of the Is the sample representative of the
population?population?
Ambiguous AveragesAmbiguous AveragesWhat particular measure of average was What particular measure of average was
used and why?used and why?
12Bluman Chapter 1

1-5 Uses and Misuses of Statistics
Changing the SubjectChanging the SubjectAre different values used to represent the Are different values used to represent the
same data?same data?
Detached StatisticsDetached StatisticsOne third fewer calories…….than what?One third fewer calories…….than what?
Implied ConnectionsImplied ConnectionsStudies Studies suggestsuggest that that somesome people people maymay
understand what this statement means.understand what this statement means.
13Bluman Chapter 1
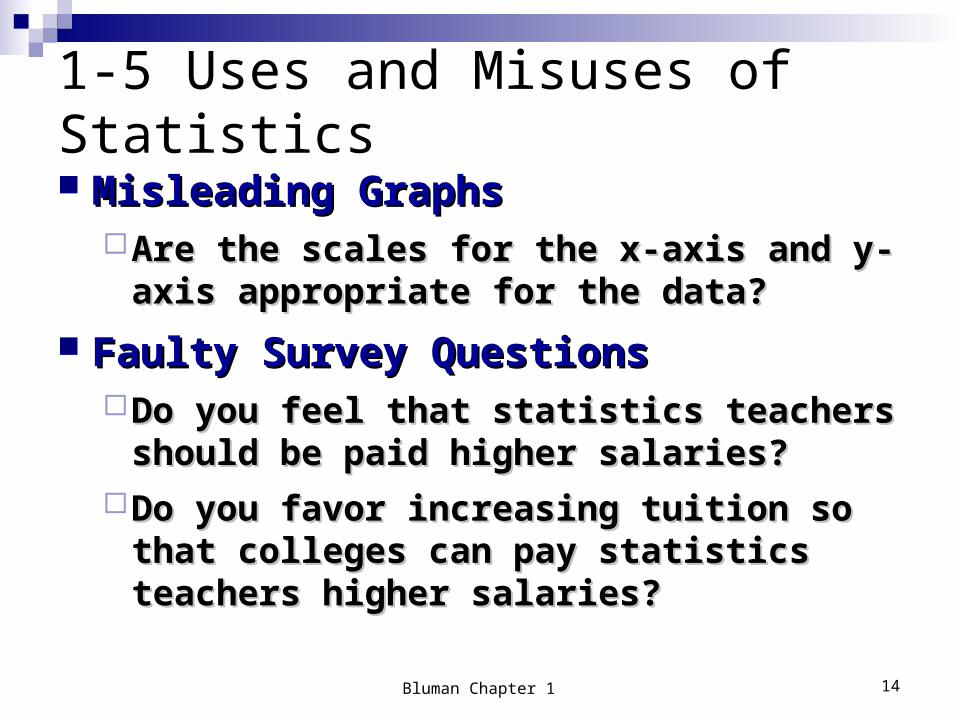
1-5 Uses and Misuses of Statistics
Misleading GraphsMisleading GraphsAre the scales for the x-axis and y-axis Are the scales for the x-axis and y-axis
appropriate for the data?appropriate for the data?
Faulty Survey QuestionsFaulty Survey QuestionsDo you feel that statistics teachers should Do you feel that statistics teachers should
be paid higher salaries?be paid higher salaries?Do you favor increasing tuition so that Do you favor increasing tuition so that
colleges can pay statistics teachers higher colleges can pay statistics teachers higher salaries?salaries?
14Bluman Chapter 1

1-6 Computers and Calculators Microsoft ExcelMicrosoft Excel Microsoft Excel with MegaStatMicrosoft Excel with MegaStat TI-83/84TI-83/84 MinitabMinitab SAS SAS SPSSSPSS
15Bluman Chapter 1
![Chapter 01: Relational Databases - static.packt-cdn.com · Chapter 01: Relational Databases. Chapter 1 [ 2 ] Chapter 1 [ 3 ] Chapter 1 [ 4 ] Chapter 1 [ 5 ] Chapter 02: PostgreSQL](https://static.fdocuments.in/doc/165x107/5e1e7793cab1f72f70306c15/chapter-01-relational-databases-chapter-01-relational-databases-chapter-1-.jpg)