Chapter 06 Risk and Return. Value = + + + FCF 1 FCF 2 FCF ∞ (1 + WACC) 1 (1 + WACC) ∞ (1 + WACC)...
36
Chapter 06 Risk and Return
-
Upload
eugenia-oneal -
Category
Documents
-
view
229 -
download
1
Transcript of Chapter 06 Risk and Return. Value = + + + FCF 1 FCF 2 FCF ∞ (1 + WACC) 1 (1 + WACC) ∞ (1 + WACC)...

Chapter 06Risk and Return

Value = + + +FCF1 FCF2 FCF∞
(1 + WACC)1 (1 + WACC)∞(1 + WACC)2
Free cash flow(FCF)
Market interest rates
Firm’s business riskMarket risk aversion
Firm’s debt/equity mixCost of debt
Cost of equity
Cost of debt
Cost of equity
Weighted averagecost of capital
(WACC)
Net operatingprofit after taxes
Required investmentsin operating capital−
=
Determinants of Intrinsic Value:
The Cost of Equity
...

1. Risk of financial asset is judged by the risk of its cash flow
2. Asset risk: Stand Alone basis vs. Portfolio Context
3. Portfolio context: Diversifiable Risk vs. Market Risk.
4. Investors in general are Risk Averse
Important Notes

Stand alone risk: the risk an investor would face if she or he held only one particular asset.
Investment risk pertains to the probability of actually earning a low or negative return. The greater the chance of low or negative returns, the riskier the investment.
STAND ALONE RISK

.rP = r̂n
1=iii
r = expected rate of return.^
Probability Distribution & Expected Rate of Return
investedAmount
investedAmount - receivedAmount =
investedAmount
ReturnDollar return of rate
Probability Distribution & Expected Rate of Return
Probability Distributions
Demand for the Probability of thisCompany's Products Demand Occurring
Sale.com Basic FoodsStrong 0,30 90% 45%Normal 0,40 15% 15%Weak 0,30 −60% −15%
1,00
Calculation of Expected Rates of Return: Payoff Matrix
Demand for the Probability of this
Company's Products(1)
Demand Occurring(2)
Rate of Return(3)
Product(2) x (3) = (4)
Rate of Return(5)
Product(2) x (5) = (6)
Strong 0,3 90% 27,0% 45% 13,5%Normal 0,4 15% 6,0% 15% 6,0%Weak 0,3 −60% −18,0% −15% −4,5%
1,0
15,0% 15,0%
Sale.com Basic Foods
Rate of Return on Stockif this Demand Occurs
Expected Rate of Return = Sum of Products =
r̂r̂

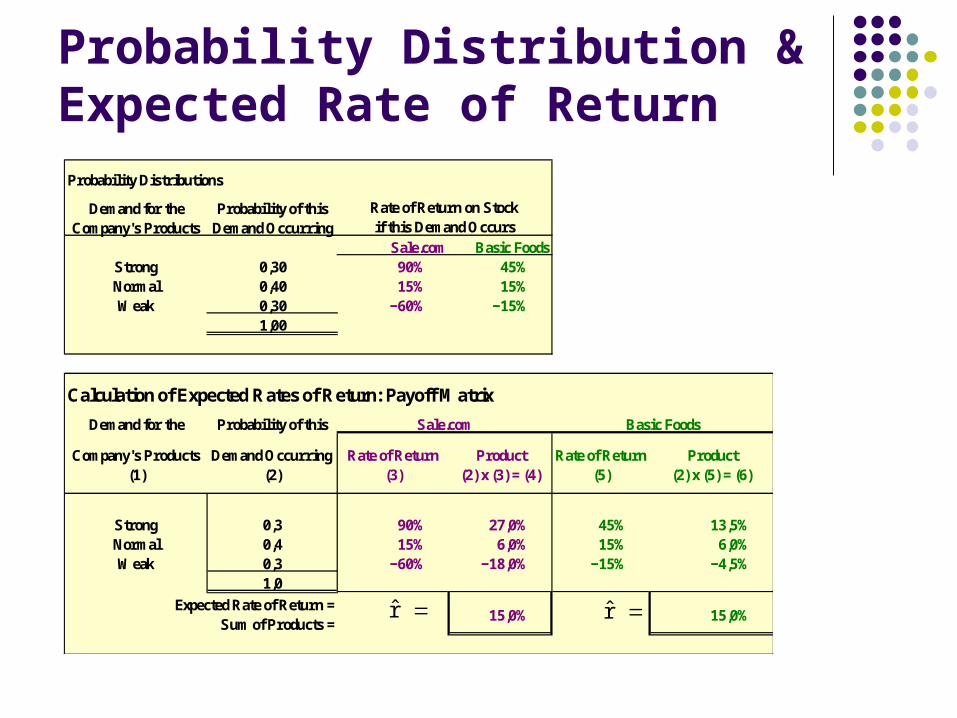
• Standard Deviation: a measure of the tightness of the probability distribution. The tighter the probability distribution, the smaller the Standard Deviation and the less risky the asset.
• Coefficient of Variation: Standard Deviation divided by return. It measures risk per unit of return, thus provides more standardized basis for risk profile comparison between assets with different return.
Stand Alone Risk: Measurements

Standard Deviation
n
1=ii
22 P)r̂(r -i
n
1=ii
2 P)r̂(r -i
Variance
Standard Deviation
Standard Deviation Calculating Standard Deviations
Panel a.
Probability of Occurring
(1)
Rate of Return on Stock
(2)Expected Return
(3)
Deviation from Expected Return
(2) − (3) = (4)
Squared Deviation
(4)2 = (5)
Sq. Dev. × Prob.(5) x (1) = (6)
0,3 90% 15% 75,0% 56,25% 16,88%0,4 15% 15% 0,0% 0,00% 0,00%
0,3 −60% 15% −75,0% 56,25% 16,88%
1,0 Sum = Variance = 33,75%
Std. Dev. = Square root of variance = 58,09%
Panel b.
Probability of Occurring
(1)
Rate of Return on Stock
(2)Expected Return
(3)
Deviation from Expected Return
(2) − (3) = (4)
Squared Deviation
(4)2 = (5)
Sq. Dev. × Prob.(5) x (1) = (6)
0,3 45% 15% 30,0% 9,00% 2,70%0,4 15% 15% 0,0% 0,00% 0,00%
0,3 −15% 15% −30,0% 9,00% 2,70%
1,0 Sum = Variance = 5,40%
Std. Dev. = Square root of variance = 23,24%
Sale.com
Basic Foods

Probability distribution
Expected Rate of Return
Rate ofreturn (%)
90150-60
Basic Foods
Sale.com
-15 45
The larger the Standard Deviation:•the lower the probability that actual returns will be close to the expected return•hence the larger the risk

Historical Data to Measure Standard Deviation
1
)rr( Estimated
n
1=t
2Avg-t
n
S
Standard Deviation

Standardized measure of dispersionabout the expected value:
Shows risk per unit of return.
CV = ^
r
Coefficient of Variation (CV)

0
A B
A = B , but A is riskier because largerprobability of losses.
= CVA > CVB.^r

rp is a weighted average:^
^ ^rp = wiri
n
i = 1
Risk & Return in Portfolio Context
Return
RiskCorrelation Coefficient to measure the tendency of two variables moving together

Portfolio Return
Stock Portfolio weight Expected ReturnMicrosoft 0,25 12,0%General Electric 0,25 11,5%Pfizer 0,25 10,0%Coca-Cola 0,25 9,5%
Portfolio's Expected Return 10,75%

Portfolio Risk:Standard Deviation of 2-Asset-Portfolio
)(2 1221212
22
22
12
12 wwwwp
2pp
12211212 Cov
12Coeficientn Correlatio
Variance
Covariance
Standard Deviation
Portfolio Risk:Standard Deviation of 2-Asset-Portfolio
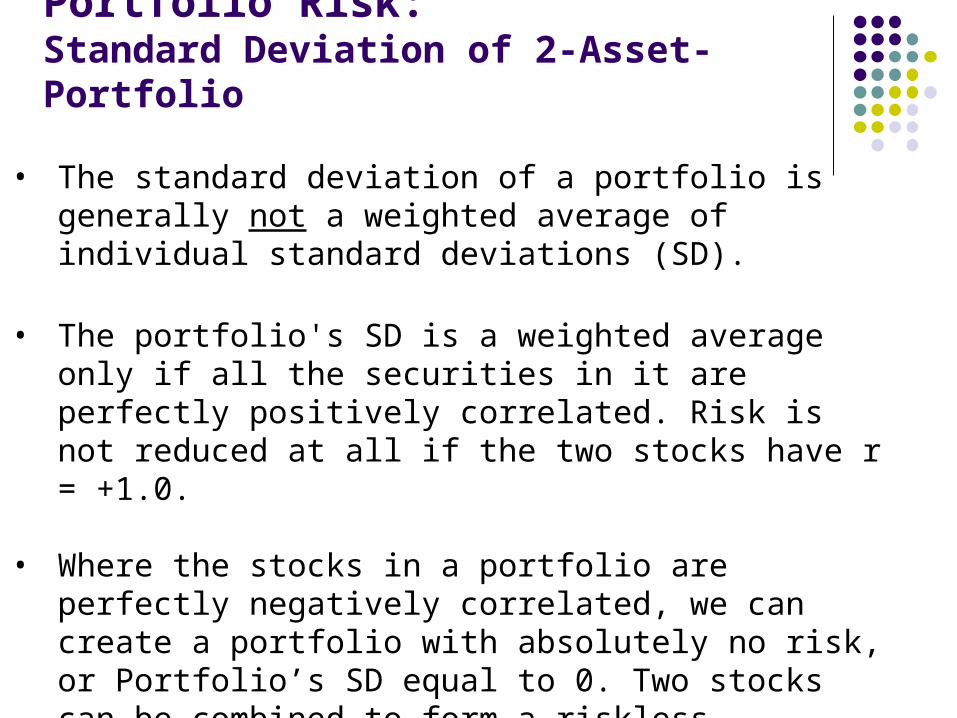
• The standard deviation of a portfolio is generally not a weighted average of individual standard deviations (SD).
• The portfolio's SD is a weighted average only if all the securities in it are perfectly positively correlated. Risk is not reduced at all if the two stocks have r = +1.0.
• Where the stocks in a portfolio are perfectly negatively correlated, we can create a portfolio with absolutely no risk, or Portfolio’s SD equal to 0. Two stocks can be combined to form a riskless portfolio if r = -1.0.

Portfolio Risk:Perfectly Negative Correlation
Portfolio WMYear Stock W returns Stock M returns (Equally weighted avg.)2000 40% -10% 15%2001 -10% 40% 15%2002 35% -5% 15%2003 -5% 35% 15%2004 15% 15% 15%
Average return 15% 15% 15%
Standard deviation 22.64% 22.64% 0.00%Correlation Coefficient -1.00

Returns Distribution for Two Perfectly Negatively Correlated Stocks (ρ = -1.0) and for Portfolio WM
40
15
0
-10 -10 -10
0 0
15 15
40 40
Stock W Stock M Portfolio WM
..
. .
.
.
..
.. . . . .

Portfolio Risk:Perfectly Positive Correlation
Year Stock M returns Stock M' returns Portfolio MM'2000 -10% -10% -10%2001 40% 40% 40%2002 -5% -5% -5%2003 35% 35% 35%2004 15% 15% 15%
Average return 15% 15% 15%
Standard deviation 22,64% 22,64% 22,64%Correlation Coefficient 1,00

Returns Distributions for Two Perfectly Positively Correlated Stocks (ρ= +1.0) and for Portfolio MM’
Stock M
0
15
40
-10
Stock M’
0
15
40
-10
Portfolio MM’
0
15
40
-10
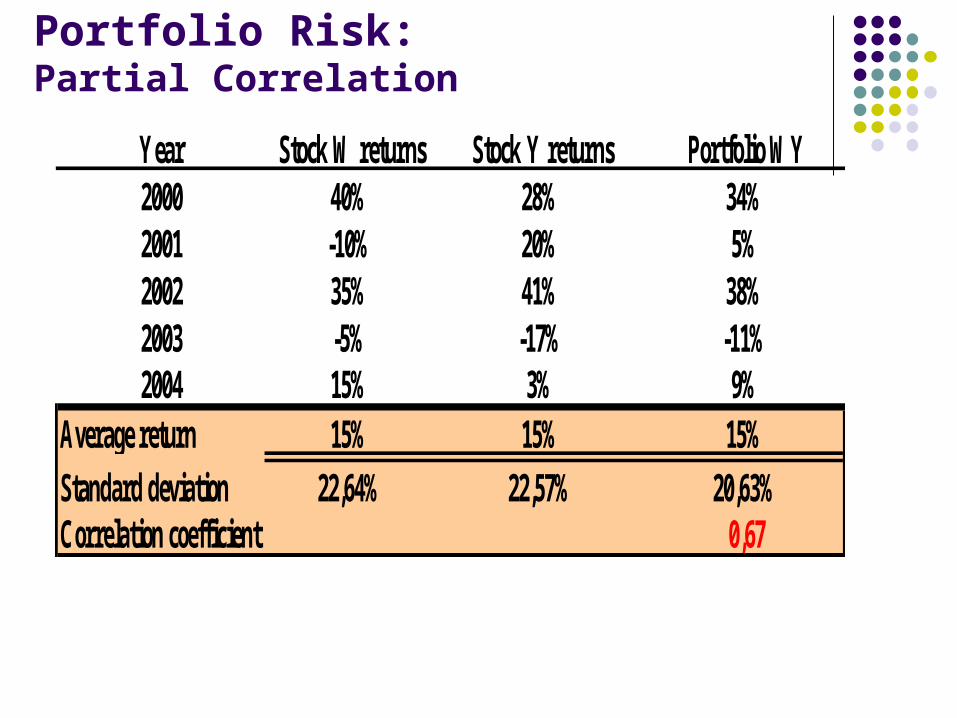
Portfolio Risk:Partial Correlation
Year Stock W returns Stock Y returns Portfolio WY2000 40% 28% 34%2001 -10% 20% 5%2002 35% 41% 38%2003 -5% -17% -11%2004 15% 3% 9%
Average return 15% 15% 15%
Standard deviation 22,64% 22,57% 20,63%Correlation coefficient 0,67

23
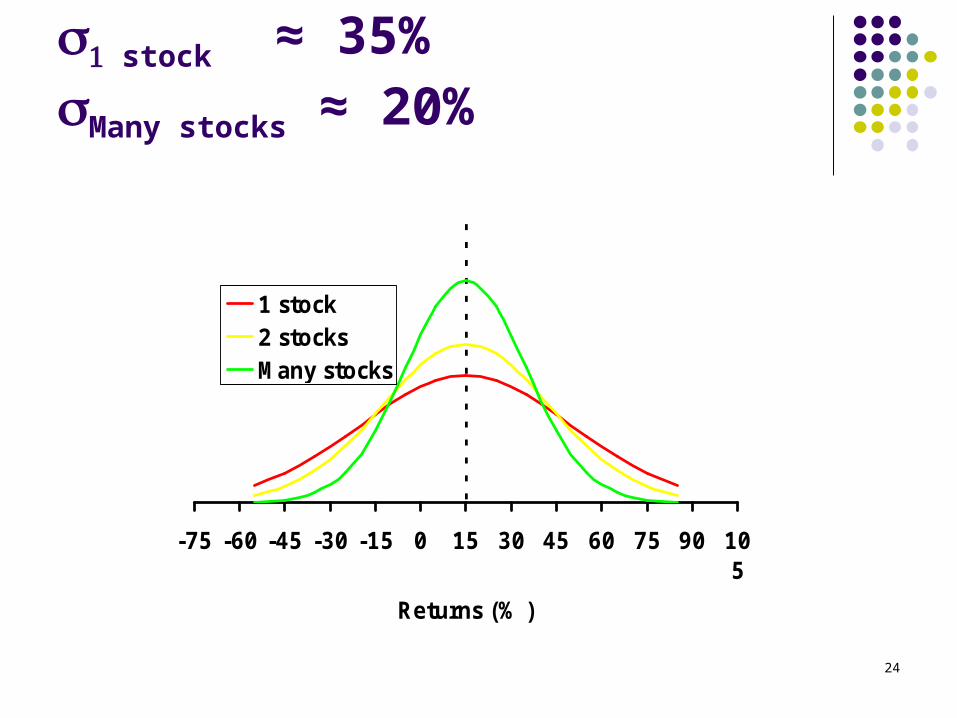
Adding Stocks to a Portfolio
What would happen to the risk of an average 1-stock portfolio as more randomly selected stocks were added?
p would decrease because the added stocks would not be perfectly correlated, but the expected portfolio return would remain relatively constant.
24
stock ≈ 35%Many stocks ≈ 20%
-75 -60 -45 -30 -15 0 15 30 45 60 75 90 105
Returns (% )
1 stock2 stocksMany stocks

# Stocks in Portfolio10 20 30 40 2,000+
Company Specific Risk
Market Risk
20
0
Stand-Alone Risk, p
p (%)
35
Effects of Portfolio Size on Portfolio Risk
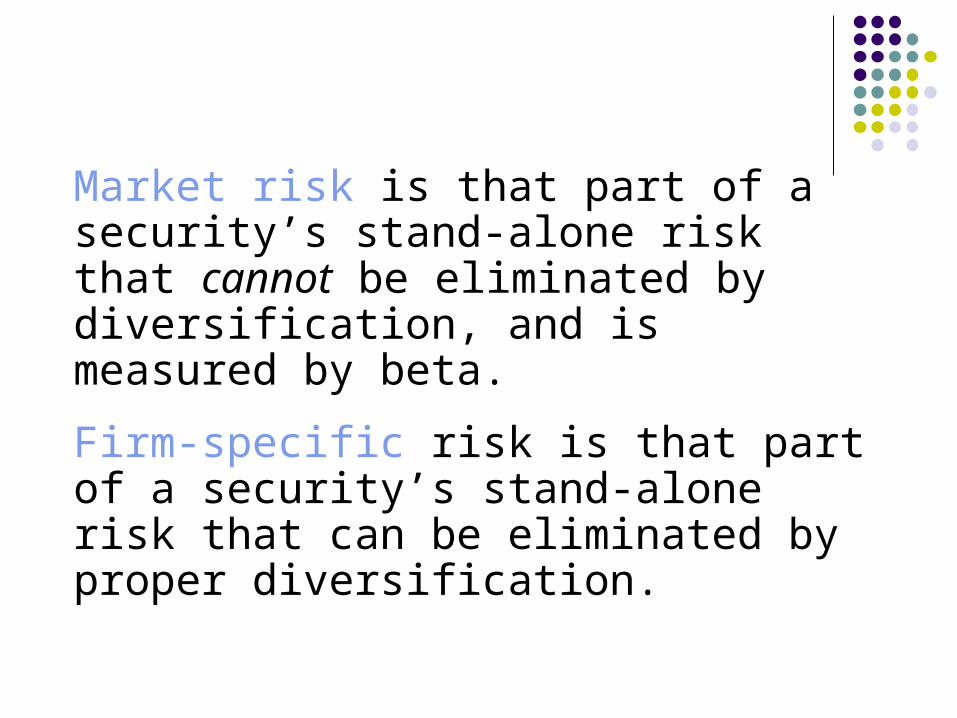
Market risk is that part of a security’s stand-alone risk that cannot be eliminated by diversification, and is measured by beta.
Firm-specific risk is that part of a security’s stand-alone risk that can be eliminated by proper diversification.

Capital Asset Pricing Model (CAPM): relevant risk of individual stock is the amount of risk that the stock contributes to well-diversified stock portfolio, or the market portfolio.
Market risk, which is relevant for stocks held in well-diversified portfolios, is defined as the contribution of a security to the overall riskiness of the portfolio. It is measured by a stock’s beta coefficient.
Beta measures a stock’s market risk. It shows a stock’s volatility relative to the market. Beta shows how risky a stock is if the stock is held in a well-diversified portfolio. Beta can be calculated by running a regression of past returns on Stock i versus
returns on the market. The slope of the regression line is defined as the beta coefficient.
If beta > 1.0, stock is riskier than the market. If beta < 1.0, stock less risky than the market.
Capital Asset Pricing Model & The Concept of Beta
MiM
iib ,

28
Using a Regression to Estimate Beta
Run a regression with returns on the stock in question plotted on the Y axis and returns on the market portfolio plotted on the X axis.
The slope of the regression line, which measures relative volatility, is defined as the stock’s beta coefficient, or b.
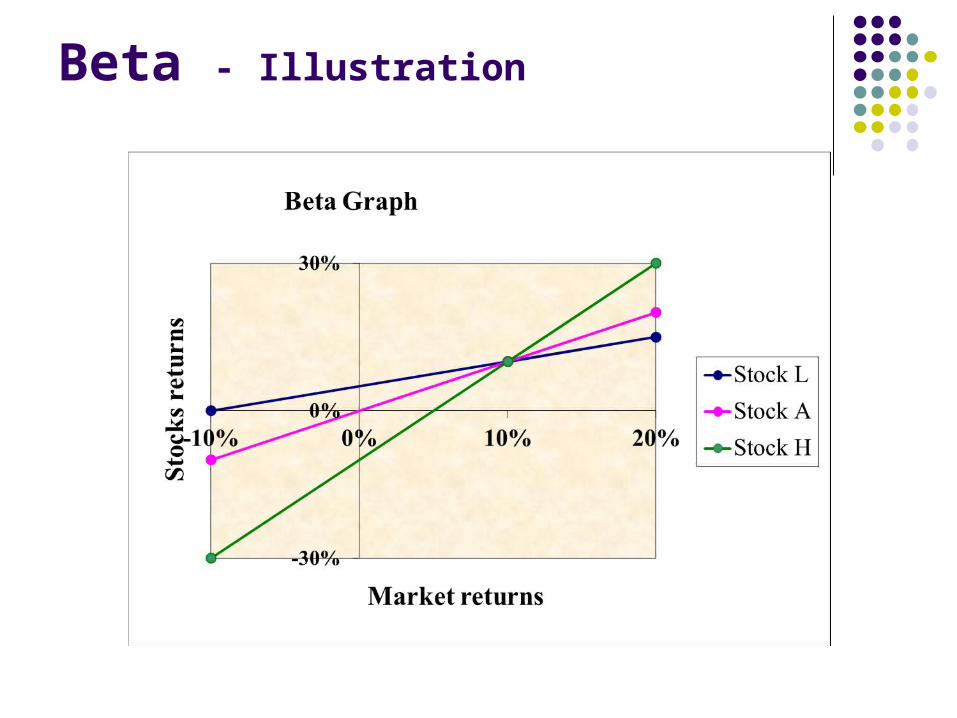
Beta - Illustration

30
Calculating Beta in Practice
Many analysts use the S&P 500 to find the market return.
Analysts typically use four or five years’ of monthly returns to establish the regression line.
Some analysts use 52 weeks of weekly returns.

Beta - Calculation
CALCULATING THE BETA COEFFICIENT FOR AN ACTUAL COMPANYNow we show how to calculate beta for an actual company, General Electric.
Step 1. Acquire DataStep 2. Calculate Returns
DateMarket Level
(S&P 500 Index) Market ReturnGE Adjusted Stock
Price GE ReturnMaret 2003 848,18 0,8% 25,50 6,0%Februari 2003 841,15 -1,7% 24,05 4,7%Maret 1999 1.286,37 NA 34,42 NA
Average return (annual) -8,8% -3,4%Standard deviation (annual) 17,6% 29,2%Correlation between GE and the market. 66,0%Beta (using the SLOPE function) 1,09

32
How is beta interpreted?
If b = 1.0, stock has average risk. If b > 1.0, stock is riskier than average. If b < 1.0, stock is less risky than average. Most stocks have betas in the range of 0.5 to
1.5.

ri = Required return on Stock i rRF = Risk-free return (rM-rRF) = Market risk premium bi = Beta of Stock i
ri = rRF + (rM – rRF)bi .
^
Security Market Line (SML)Relationship between required rate of return and risk
ri = rRF + RPMbi .

34
Use the SML to calculate eachalternative’s required return.
The Security Market Line (SML) is part of the Capital Asset Pricing Model (CAPM).
SML: ri = rRF + (RPM)bi .
Assume rRF = 8%; rM = rM = 15%.
RPM = (rM - rRF) = 15% - 8% = 7%.

35
SML1
Original situation
r (%)
SML2
0 0.5 1.0 1.5 Risk, bi
1815
11 8
New SML I = 3%
Impact of Inflation Change on SML

36
SML1
Original situation
r (%)SML2
After change
Risk, bi
18
15
8
1.0
RPM = 3%
Impact of Risk Aversion Change