Chaotic Analysis on Human Gait Time-Series Signals · The dynamics of the human gait has been...
4
Abstract—Human Gait analysis is an important subject given its application to the study of pathologies of the human locomotor system. The study of the chaotic behavior of this complex system can help to understand in deep the variability of the human gait patterns. This work explains how to develop an acquisition and analysis tool in a twofold manner: first, a simple and practical setup is implemented in order to achieve the measurement of a person Center of Mass (CoM) when walking; second, an improved method for estimating Lyapunov exponents is described in order to analyze the recorded time-series chaotic behavior. Index Terms—Chaotic time-series, human gait, Lyapunov exponents. I. INTRODUCTION The dynamics of the human gait has been studied in order to establish its chaotic behavior based on simple nonlinear time-series analysis methods [1]. This analysis is performed in order to study early diagnose common gait pathologies through unconstrained slow, normal, and fast paces [2], [3]. The importance of having an acquisition system for measuring the human gait becomes important at elder people when walking needs assistance for falling injury avoidance [4]. Therefore in this work, a simple and straightforward wireless setup is developed in order to log data into a personal computer. A common manner to analyze human gait nonlinear and chaotic behavior is through Lyapunov exponents computation. An improved and simple method developed by K. Briggs is hereby implemented to show that the lateral walking movement is responsible for the aforementioned chaotic pattern [5]. II. LATERAL WALKING TIME-SERIES AND PHASE PLOT The lateral time-series x t , x t+1 ,…, x t+i are responsible for 38-40% of gait cycle (swing) [2], which is shown in Fig. 1. This time-series was obtained from experimental data from an accelerometer unit placed at a person waist in order to obtain the Center of Mass (CoM) and therefore, capture the human gait system dynamic behavior. The finding of a positive Lyapunov coefficient means that the system is chaotic; see Fig. 2 where the phase plot shows a moderated chaotic behavior [5]. Manuscript received April 25, 2016; revised September 12, 2016. D. Gomez Rivera, A. D. Palomino Merino, and M. A. D. Vargas Treviño are Benemé rita Universidad Autónoma de Puebla, Av. San Claudio y 18 sur, Ciudad Universitaria, Puebla, México (e-mail: [email protected], [email protected], [email protected]). Gibran Etcheverry is with the Universidad de las Américas Puebla, Sta. Catarina Mártir. Cholula, Puebla, México (e-mail: [email protected]). 0 0.2 0.4 0.6 0.8 1 1.2 1.4 1.6 1.8 2 -0.6 -0.4 -0.2 0 0.2 0.4 0.6 0.8 Human Gait, Lateral Displacement time(s) Displacement(m) Fig. 1. Gait cycle. -1 -0.5 0 0.5 1 1.5 -1 -0.5 0 0.5 1 1.5 -1 -0.5 0 0.5 1 1.5 x(t) Human Gait Phase Plot, Lateral Displacement x(t+5) x(t+10) Fig. 2. Human gait phase plot. III. THE LYAPUNOV EXPONENT In order to compute the Lyapunov exponent, two points are considered within the phase plane: X and X f , such as [2]: i f t X e X (1) In this manner, i is obtained from expression: 1 lim( log ) f i t X t X (2) If any of the Lyapunov exponents is positive, the system is said chaotic. This means that any pair of neighbor points within initial state separate abruptly and the system is sensitive to initial conditions, which is one of the main aspects of a chaotic system. D. Gomez Rivera, A. D. Palomino Merino, M. A. D. Vargas Treviño, and G. Etcheverry Chaotic Analysis on Human Gait Time-Series Signals 313 International Journal of Information and Electronics Engineering, Vol. 6, No. 5, September 2016 doi: 10.18178/ijiee.2016.6.5.645
-
Upload
vuongthuan -
Category
Documents
-
view
217 -
download
0
Transcript of Chaotic Analysis on Human Gait Time-Series Signals · The dynamics of the human gait has been...

Abstract—Human Gait analysis is an important subject given
its application to the study of pathologies of the human
locomotor system. The study of the chaotic behavior of this
complex system can help to understand in deep the variability of
the human gait patterns. This work explains how to develop an
acquisition and analysis tool in a twofold manner: first, a simple
and practical setup is implemented in order to achieve the
measurement of a person Center of Mass (CoM) when walking;
second, an improved method for estimating Lyapunov exponents
is described in order to analyze the recorded time-series chaotic
behavior.
Index Terms—Chaotic time-series, human gait, Lyapunov
exponents.
I. INTRODUCTION
The dynamics of the human gait has been studied in order
to establish its chaotic behavior based on simple nonlinear
time-series analysis methods [1]. This analysis is performed
in order to study early diagnose common gait pathologies
through unconstrained slow, normal, and fast paces [2], [3].
The importance of having an acquisition system for
measuring the human gait becomes important at elder people
when walking needs assistance for falling injury avoidance
[4]. Therefore in this work, a simple and straightforward
wireless setup is developed in order to log data into a personal
computer.
A common manner to analyze human gait nonlinear and
chaotic behavior is through Lyapunov exponents computation.
An improved and simple method developed by K. Briggs is
hereby implemented to show that the lateral walking
movement is responsible for the aforementioned chaotic
pattern [5].
II. LATERAL WALKING TIME-SERIES AND PHASE PLOT
The lateral time-series xt, xt+1,…, xt+i are responsible for
38-40% of gait cycle (swing) [2], which is shown in Fig. 1.
This time-series was obtained from experimental data from an
accelerometer unit placed at a person waist in order to obtain
the Center of Mass (CoM) and therefore, capture the human
gait system dynamic behavior. The finding of a positive
Lyapunov coefficient means that the system is chaotic; see Fig.
2 where the phase plot shows a moderated chaotic behavior
[5].
Manuscript received April 25, 2016; revised September 12, 2016.
D. Gomez Rivera, A. D. Palomino Merino, and M. A. D. Vargas Treviño
are Benemérita Universidad Autónoma de Puebla, Av. San Claudio y 18 sur,
Ciudad Universitaria, Puebla, México (e-mail: [email protected],
[email protected], [email protected]).
Gibran Etcheverry is with the Universidad de las Américas Puebla, Sta.
Catarina Mártir. Cholula, Puebla, México (e-mail:
0 0.2 0.4 0.6 0.8 1 1.2 1.4 1.6 1.8 2-0.6
-0.4
-0.2
0
0.2
0.4
0.6
0.8Human Gait, Lateral Displacement
time(s)
Dis
pla
cem
ent(
m)
Fig. 1. Gait cycle.
-1-0.5
00.5
11.5
-1
-0.5
0
0.5
1
1.5
-1
-0.5
0
0.5
1
1.5
x(t)
Human Gait Phase Plot, Lateral Displacement
x(t+5)
x(t
+10)
Fig. 2. Human gait phase plot.
III. THE LYAPUNOV EXPONENT
In order to compute the Lyapunov exponent, two points are
considered within the phase plane: X and Xf, such as [2]:
if t
Xe
X
(1)
In this manner, i is obtained from expression:
1lim( log )
f
it
X
t X
(2)
If any of the Lyapunov exponents is positive, the system is
said chaotic. This means that any pair of neighbor points
within initial state separate abruptly and the system is
sensitive to initial conditions, which is one of the main aspects
of a chaotic system.
D. Gomez Rivera, A. D. Palomino Merino, M. A. D. Vargas Treviño, and G. Etcheverry
Chaotic Analysis on Human Gait Time-Series Signals
313
International Journal of Information and Electronics Engineering, Vol. 6, No. 5, September 2016
doi: 10.18178/ijiee.2016.6.5.645
A negative exponent implies that the orbits approach a
common fixed point. These systems are non-conservative.
The degree of stability is measured by the absolute value of
the exponent.
A zero exponent means the orbit maintain its relative
position on a stable attractor. These kinds of systems are
conservative and in a steady state mode.
The Lyapunov exponent is also used to differentiate
between periodic signals and chaotic dynamics, because it is a
measure of the rate at which the trajectories separate one from
another and the trajectories of chaotic signals follow typical
patterns in phase space. Another use for this exponent (λ) is to
characterize the average rate of divergence on neighboring
trajectories, with this it can be know the sensitivity to initial
conditions on dynamical systems.
IV. METHODOLOGY
A. Measurement Module and Implementation
In order to obtain the CoM movement information, an
MMA7361 accelerometer is used plus an Arduino nano board;
besides it, a bluetooth HC-06 is adapted to the nano board to
transmit information wireless to a PC as it is shown in Fig. 3.
Fig. 3. Measurement module block diagram.
MMA7361 sensor [6] is a triaxial accelerometer with
analog output, low current and high sensitivity between 1.5 g
and 6 g.
Data obtained from this device are the following: gravity
force and x, y and z axis acceleration. The principal
measurement variable is the device inclination with respect to
the gravity force related to the acceleration components on x
and y axis; from this information and by using trigonometric
functions, the inclination angles are obtained.
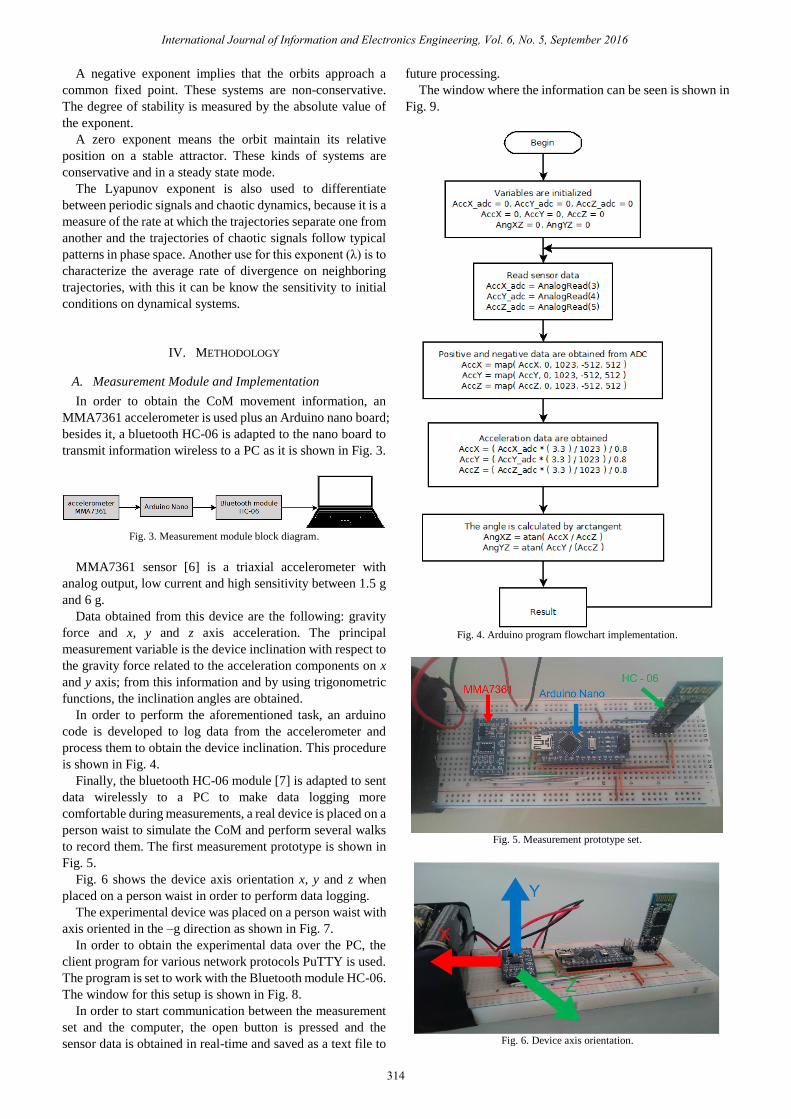
In order to perform the aforementioned task, an arduino
code is developed to log data from the accelerometer and
process them to obtain the device inclination. This procedure
is shown in Fig. 4.
Finally, the bluetooth HC-06 module [7] is adapted to sent
data wirelessly to a PC to make data logging more
comfortable during measurements, a real device is placed on a
person waist to simulate the CoM and perform several walks
to record them. The first measurement prototype is shown in
Fig. 5.
Fig. 6 shows the device axis orientation x, y and z when
placed on a person waist in order to perform data logging.
The experimental device was placed on a person waist with
axis oriented in the –g direction as shown in Fig. 7.
In order to obtain the experimental data over the PC, the
client program for various network protocols PuTTY is used.
The program is set to work with the Bluetooth module HC-06.
The window for this setup is shown in Fig. 8.
In order to start communication between the measurement
set and the computer, the open button is pressed and the
sensor data is obtained in real-time and saved as a text file to
future processing.
The window where the information can be seen is shown in
Fig. 9.
Fig. 4. Arduino program flowchart implementation.
Fig. 5. Measurement prototype set.
Fig. 6. Device axis orientation.
314
International Journal of Information and Electronics Engineering, Vol. 6, No. 5, September 2016
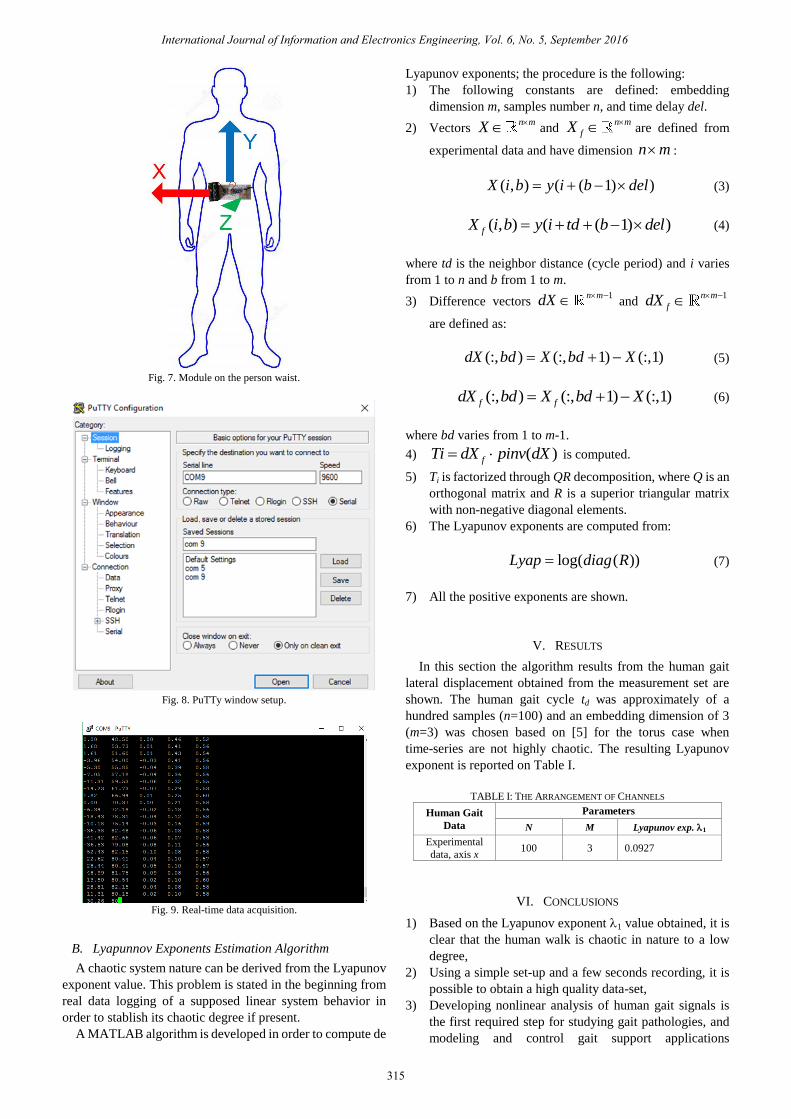
Fig. 7. Module on the person waist.
Fig. 8. PuTTy window setup.
Fig. 9. Real-time data acquisition.
B. Lyapunnov Exponents Estimation Algorithm
A chaotic system nature can be derived from the Lyapunov
exponent value. This problem is stated in the beginning from
real data logging of a supposed linear system behavior in
order to stablish its chaotic degree if present.
A MATLAB algorithm is developed in order to compute de
Lyapunov exponents; the procedure is the following:
1) The following constants are defined: embedding
dimension m, samples number n, and time delay del.
2) Vectors n mX and
n m
fX are defined from
experimental data and have dimension n m :
( , ) ( ( 1) )X i b y i b del (3)
( , ) ( ( 1) )fX i b y i td b del (4)
where td is the neighbor distance (cycle period) and i varies
from 1 to n and b from 1 to m.
3) Difference vectors 1n mdX and
1n m
fdX
are defined as:
(:, ) (:, 1) (:,1)dX bd X bd X (5)
(:, ) (:, 1) (:,1)f fdX bd X bd X (6)
where bd varies from 1 to m-1.
4) ( )fTi dX pinv dX is computed.
5) Ti is factorized through QR decomposition, where Q is an
orthogonal matrix and R is a superior triangular matrix
with non-negative diagonal elements.
6) The Lyapunov exponents are computed from:
log( ( ))Lyap diag R (7)
7) All the positive exponents are shown.
V. RESULTS
In this section the algorithm results from the human gait
lateral displacement obtained from the measurement set are
shown. The human gait cycle td was approximately of a
hundred samples (n=100) and an embedding dimension of 3
(m=3) was chosen based on [5] for the torus case when
time-series are not highly chaotic. The resulting Lyapunov
exponent is reported on Table I.
TABLE I: THE ARRANGEMENT OF CHANNELS
Human Gait
Data
Parameters
N M Lyapunov exp. 1
Experimental
data, axis x 100 3 0.0927
VI. CONCLUSIONS
1) Based on the Lyapunov exponent 1 value obtained, it is
clear that the human walk is chaotic in nature to a low
degree,
2) Using a simple set-up and a few seconds recording, it is
possible to obtain a high quality data-set,
3) Developing nonlinear analysis of human gait signals is
the first required step for studying gait pathologies, and
modeling and control gait support applications
315
International Journal of Information and Electronics Engineering, Vol. 6, No. 5, September 2016

afterwards. Analyze different patterns from a variety of
persons is therefore important, since the gait patterns
vary on different people. For instance, Fig. 10 shows a
gait pattern from one person and Fig. 2 from another one.
Fig. 10. Human gait phase plot from a different person.
4) A problem with the MMA7361 accelerometer is that it’s
very sensitive to vibration and mechanical noise, but the
output signal could be improved using a digital filter.
REFERENCES
[1] M. Perc, “The dynamics of human gait,” Eur. J. Phys., vol. 26, pp.
525-534, 2005.
[2] A. Goshvarpour and A. Goshvarpour, “Nonlinear analysis of human
gait signals,” I. J. Information Engineering and Electronic Business,
vol. 2, pp. 15-21, 2012.
[3] S. Iqbal et al., “Nonlinear time-series analysis of different human
walking gaits,” in Proc. IEEE International Conference on
Electro/Information Technology (EIT), pp. 25-30, 2015.
[4] C. Yang and T. Murakami, “Walking-assist principle analysis for a
multi-legged system,” IEEE Journal of Industry Applications, vol. 4,
no. 3, pp. 294–300, 2015.
[5] K. Briggs, “An improved method for estimating Lyapunov exponents
of chaotic time series,” Physics Letters A, vol. 151, no. 1-2, pp. 27-32,
1990.
[6] Freescale Semiconductor, Technical Data, MMA7361.
[7] Guanzhou HC Information Tecnology, Module Datasheet.
Daniel Gomez Rivera was born in Puebla, México in
1986. He obtained the Bachelor’s degree in Electronics
from the Benemérita Universidad Autónoma de
Puebla. He is currently in the Master program in
Electronics at the same institution.
Palomino, A. was born in Puebla, Mexico. She
graduated in 1992 from Escuela de Ciencias de la
Electrónica, Benemérita Universidad Autónoma de
Puebla, Puebla, Mexico. In 1995 she received the M.
Sc. degree in Electrical Engineering from Centro de
Investigación y de Estudios Avanzados del Instituto
Politécnico Nacional, Mexico City. In 2001 she
received the PhD degree in Control Systems from
Université de Technologie de Compiegne, France.
At present she is a Research Professor of the Facultad de Ciencias de la
Electrónica, Benemérita Universidad Autónoma de Puebla. Puebla, Mexico.
She is mainly engaging in the research fields of non-linear control and
control of dynamics systems.
Vargas. Aurora was born at Puebla, Puebla, Mexico,
on December 14th 1972. She obtained the BSc degree
in Electronics in 1994, the MSc and PhD degrees in
Optoelectronics in 1997 and 2000 respectively, all
from BUAP. Her major fields of study are
instrumentation, automation, robotics and control.
She was instructor in the ICFA 2013 in a laboratory
session on Data Acquisition with LabVIEW and she is
since 2005 a Researcher Professor in Facultad de
Ciencias de la Electronica at the Benemerita Universidad Autonoma de
Puebla. She is currently developing research on Data Acquisition Systems
for High Energy Physics at CERN within the ALICE experiment, besides
Robotics, and Quantum Optics.
Dr. Vargas is member of the National System of Researchers (SNI) level I,
she has 70 indexed articles, 50 papers in congress and has supervised 20
master thesis.
Gibran Etcheverry obtained a Bachelor’s degree in
Electronics at the Universidad Autónoma de Puebla,
Mexico, and the Master’s degree in Advanced
Electronics from University of Warwick in Coventry,
England. Afterwards, he began a PhD at the CNRS
laboratory LAAS in Toulouse in order to study
Nonlinear Systems Identification. Currently he works
on: features extraction from newborn cries, images,
human voice, and ECGs for their classification with
GMMs; Zero Moment Point measurement & stochastic identification; PEA
modeling; and time-series forecasting.
316
International Journal of Information and Electronics Engineering, Vol. 6, No. 5, September 2016


![A Gait Based Approach for Implicit Authentication Using ......gait recognition in security-related applications [2]. Human gait has been extensively acknowledged by researchers as](https://static.fdocuments.in/doc/165x107/5f5df6f2c1ff1c6c18156792/a-gait-based-approach-for-implicit-authentication-using-gait-recognition.jpg)