
Quality and safety of channel catfish affected by production, Harvest ...

Channel Catfish FCR, Feeding
Rate and Growth

Out of Print

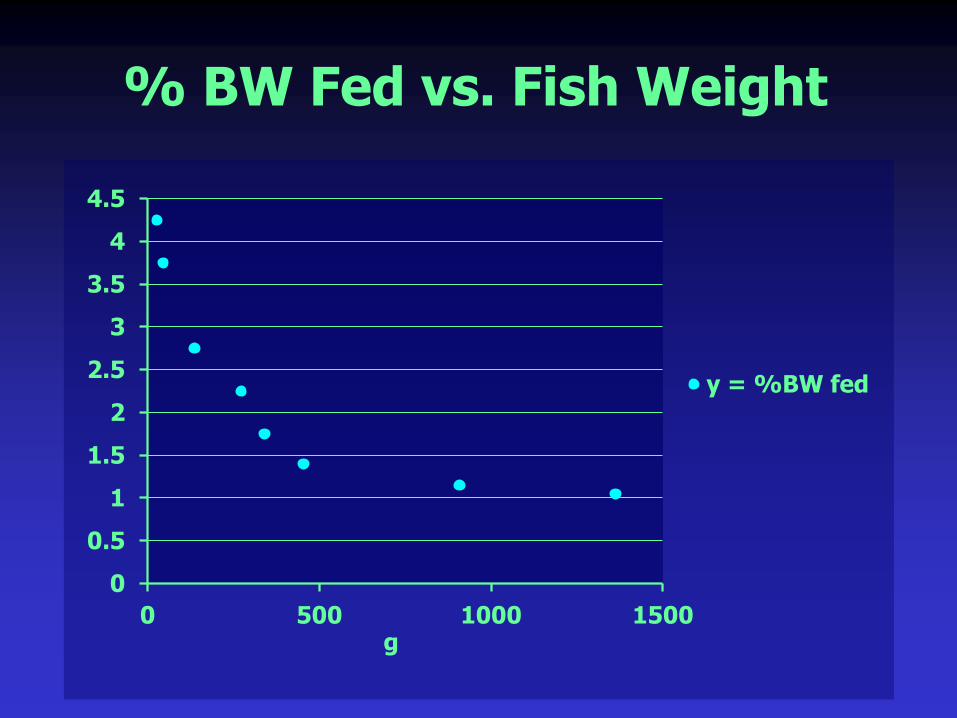
FCR & % Body Weight (BW) consumed for channel catfish (adapted from Robinson et. al. 1998)
Fish Size
(g)
FCR Daily Feed
(% BW)
27.2
45.4
136.2
272.4
340.5
454
908
1362
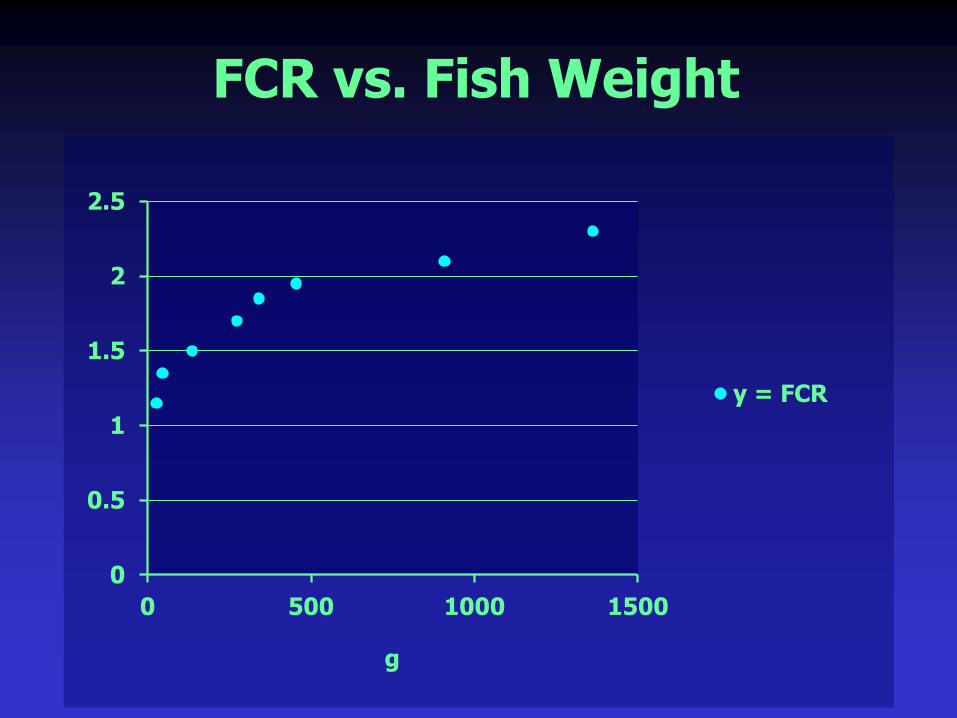
1.15
1.35
1.50
1.70
1.85
1.95
2.10
2.30
4.25
3.75
2.75
2.25
1.75
1.40
1.15
1.05
0
0.5
1
1.5
2
2.5
3
3.5
4
4.5
0 500 1000 1500
y = %BW fed
g
% BW Fed vs. Fish Weight

y = -0.866ln(x) + 7.0132 R² = 0.9755
0
0.5
1
1.5
2
2.5
3
3.5
4
4.5
0 500 1000 1500
y= %BW fed
Log. (y= %BW fed)
g
% BW Fed vs. Fish Weight
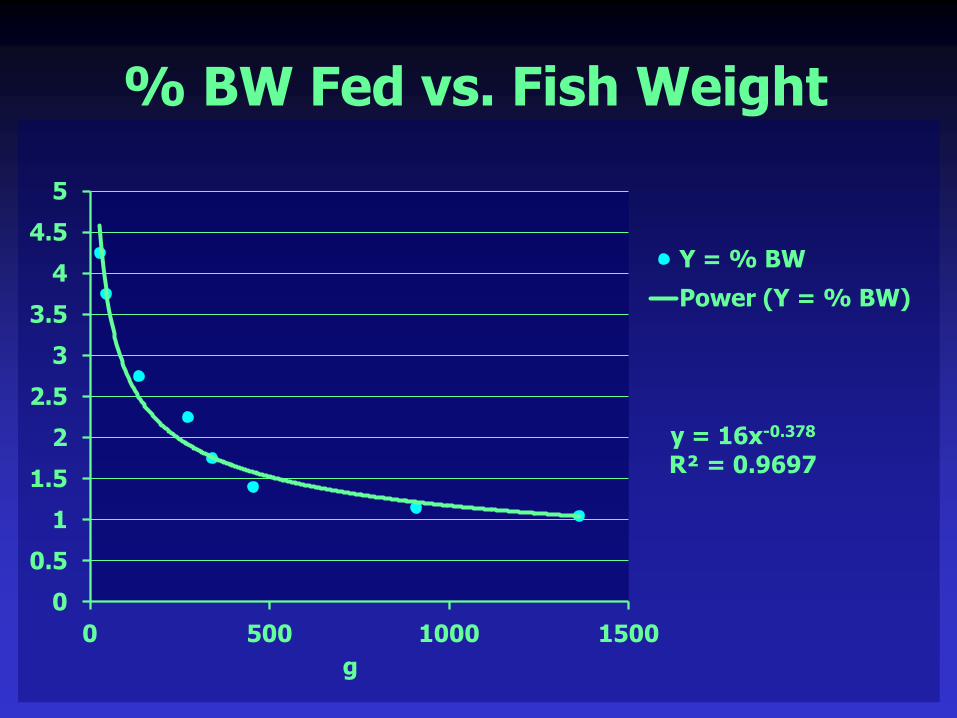
y = 16x-0.378 R² = 0.9697
0
0.5
1
1.5
2
2.5
3
3.5
4
4.5
5
0 500 1000 1500
Y = % BW
Power (Y = % BW)
g
% BW Fed vs. Fish Weight

% BW fed: reported vs. power & natural log calculated values.
Fish Size
(g)
Reported Power (x) ln (x)
27.2
45.4
136.2
272.4
340.5
454
908
1362
4.25
3.75
2.75
2.25
1.75
1.40
1.15
1.05
4.59
3.78
2.49
1.92
1.76
1.58
1.22
1.04
4.15
3.71
2.76
2.16
1.97
1.72
1.12
0.76
0
0.5
1
1.5
2
2.5
0 500 1000 1500
y = FCR
g
FCR vs. Fish Weight
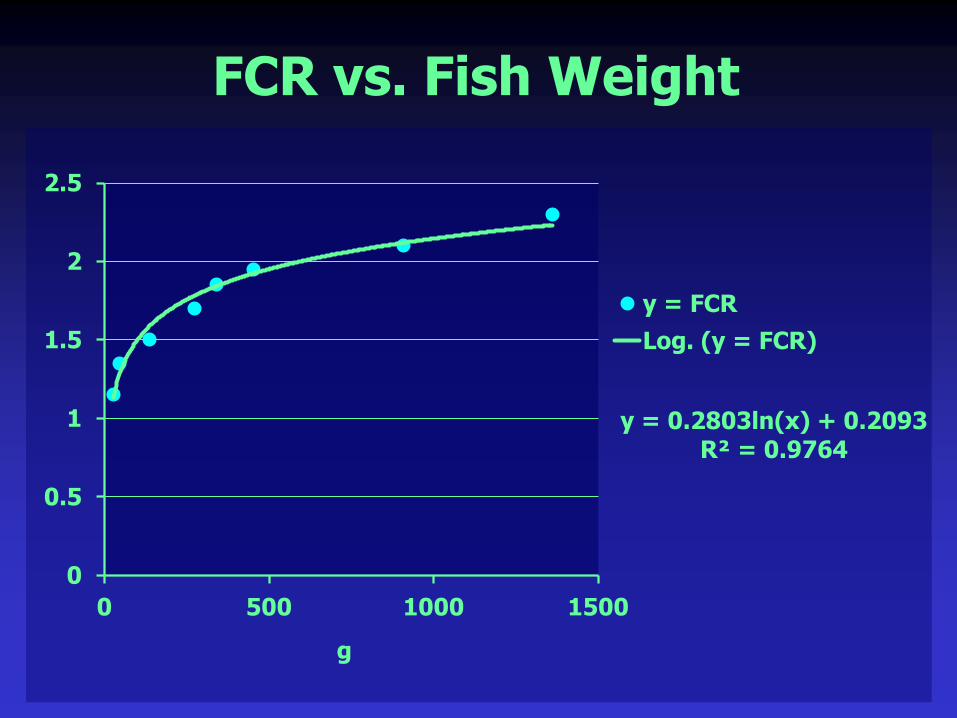
y = 0.2803ln(x) + 0.2093 R² = 0.9764
0
0.5
1
1.5
2
2.5
0 500 1000 1500
y = FCR
Log. (y = FCR)
g
FCR vs. Fish Weight
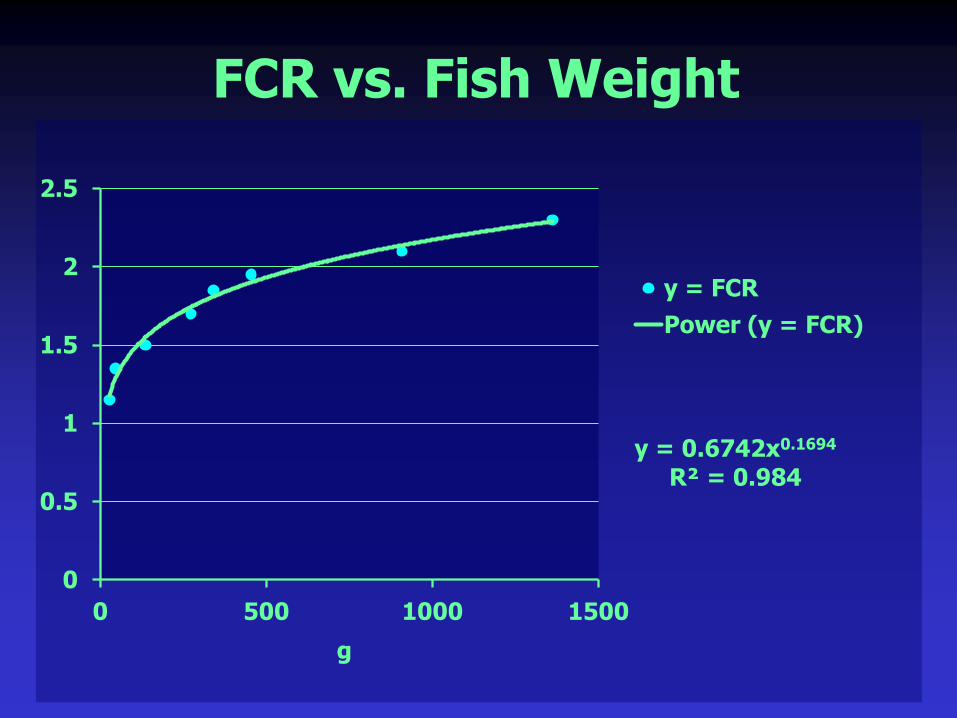
y = 0.6742x0.1694 R² = 0.984
0
0.5
1
1.5
2
2.5
0 500 1000 1500
y = FCR
Power (y = FCR)
g
FCR vs. Fish Weight

FCR: reported vs. power & natural log calculated values.
Fish Size
(g)
Reported Power (x) ln (x)
27.2
45.4
136.2
272.4
340.5
454
908
1362
1.15
1.35
1.50
1.70
1.85
1.95
2.10
2.30
1.18
1.29
1.55
1.74
1.81
1.90
2.14
2.28
1.00
1.10
1.41
1.60
1.66
1.74
1.94
2.05

Feeding Rate
• Feed as a percent of body weight (BW)
• 1-5% daily, convert to decimal
• 3% BW = 0.03 x 100 g = 3g/day
Food Conversion Ratio
• FCR = feed fed/weight gained
• Weight gained = feed fed/FCR

%BW = 16W-0.378 %BW = -0.866ln(x) + 7.0132 where %BW = % body weight fed daily & W = weight
FCR = 0.6742W0.1694 FCR = 0.2803ln(x) + 0.0293 where FCR = food conversion ratio & W = weight
Power & ln Equations: %BW & FCR

1993 Field Data (Wurts & Wynne, 1995)
• Stocked 3720, 45-g fingerlings/ha
• Assumed exponential growth up to 227 g – feeding table
• Fed 3% BW: 45 g to 227 g
• Capped feeding @ 34 kg/ha
• Harvest weight 590 g (175 days)

0
100
200
300
400
500
600
700
800
0 50 100 150 200 250
pwr & pwr
ln & ln
ln & pwr
days
g
Plots of Calculated Weight vs. Time
Field vs. Calculated Weight
• 45 g to 590 g in 175 days: FCR 1.7-2 (Wurts & Wynne, 1995)
• 45 g to 512, 568 or 645 g in 175 days (calculated, 2014)

y = 0.0076x2 + 1.0747x + 26.135 R² = 1
0
100
200
300
400
500
600
0 100 200 300 days
g
(power %BW + power FCR)
Growth: Weight vs. Time

y = 0.0104x2 + 1.3449x + 22.562 R² = 0.9998
0
100
200
300
400
500
600
700
800
0 100 200 300
(ln %BW + ln FCR) g
days
Growth: Weight vs. Time
g

y = 0.0094x2 + 1.0443x + 23.904 R² = 0.9999
0
100
200
300
400
500
600
700
0 100 200 300
(ln % BW & Power FCR)
g
days
Growth: Weight vs. Time

So What?
• Improve feeding efficiency
• Improve growth & survival
• Improve FCR
• Increase profit…

References
• Robinson et. al. 1998. Southern Regional Aquaculture Center (SRAC), Publication No. 181 (Out of Print).
• Wurts & Wynne. 1995. World Aq. 26(3): 54-59.

William A. Wurts, Ph.D.
Extension Aquaculture Specialist
College of Agriculture, Food Science & Sustainable Systems

Online Literature & Slide Shows
www.ca.uky.edu/wkrec/Wurtspage.htm


