CHANGING THE SCHEDULE OF MEDICAL BENEFITS … · CHANGING THE SCHEDULE OF MEDICAL BENEFITS AND THE...
23
Working Paper Series Document de travail de la s´ erie CHESG Special Edition Edition sp´ eciale GECES CHANGING THE SCHEDULE OF MEDICAL BENEFITS AND THE EFFECT ON PRIMARY CARE PHYSICIAN BILLING: QUASI-EXPERIMENTAL EVIDENCE FROM ALBERTA Logan McLeod, Jeffrey A. Johnson Working Paper No: 150010 www.canadiancentreforhealtheconomics.ca July 29, 2015 Canadian Centre for Health Economics Centre canadien en ´ economie de la sant ´ e 155 College Street Toronto, Ontario
Transcript of CHANGING THE SCHEDULE OF MEDICAL BENEFITS … · CHANGING THE SCHEDULE OF MEDICAL BENEFITS AND THE...

Working Paper SeriesDocument de travail de la serie
CHESG Special EditionEdition speciale GECES
CHANGING THE SCHEDULE OF MEDICALBENEFITS AND THE EFFECT ON PRIMARY CARE
PHYSICIAN BILLING: QUASI-EXPERIMENTALEVIDENCE FROM ALBERTA
Logan McLeod, Jeffrey A. Johnson
Working Paper No: 150010
www.canadiancentreforhealtheconomics.ca
July 29, 2015
Canadian Centre for Health EconomicsCentre canadien en economie de la sante
155 College StreetToronto, Ontario

CCHE/CCES Working Paper No. 150010February 17, 2015
Changing the Schedule of Medical Benefits and the Effect on Primary Care
Physician Billing: Quasi-Experimental Evidence from Alberta
Logan McLeod⇤a, Jeffrey A. Johnsonb
aWilfrid Laurier University, Department of EconomicsbUniversity of Alberta, School of Public Health
Abstract
We exploit a quasi-experiment in the province of Alberta, Canada, to identify how changes inthe schedule of medical benefits affected the provision of primary care services to patients withmultiple co-morbidities. Specifically, Alberta introduced a new fee code to compensate physiciansfor completing a comprehensive annual care plan (CACP) for qualifying patients. During the periodof study, primary care physicians could practice in two settings: (i) solo practice; or (ii) primary carenetworks (i.e., team based care). This paper asks how the policy change affected physician-billingpatterns and whether delivery structure affected physician-billing.
Data come from Alberta’s administrative physician claims data, covering the full population ofAlberta and all services provided by primary care physicians, for one year before and two yearsafter the policy change. We employ a difference-in-differences methodology and implement a set ofrobustness checks to control for confounding from other contemporaneous changes that may haveoccurred in Alberta as well as unobserved physician heterogeneity.
Our results suggest the new fee code became the sixth most billed code in its first year (totaling$17.9 million), but was billed by only a small proportion of physicians (roughly 2% of physiciansaccounted for 20% of total billings). The fee code was disproportionately billed by physicians inteam-based care (PCNs), and increased the billing of other complementary fee codes by 5%-10%(or roughly $80 million). The results suggest the unintended consequences of a well-intentionedpolicy can be costly.
JEL Classification: I10; I13; I18
Keywords: physician payment; physician behaviour; difference-in-differences
⇤Corresponding author. Email: [email protected]
1

1 Introduction
Health care in Canada is a provincial responsibility. Each of the 10 Canadian provinces finance
medically necessary hospital and physician services through a single-payer system using general tax
revenue. One set of medically necessary physician service relate to primary care services provided
by physicians.
A continual challenge faced by many provincial ministries of health is the increased proportion
of provincial populations with chronic conditions and multiple chronic conditions. This has been
seen at the national level (e.g., McLeod (2011)), as well as the provincial level. For example, the
Canadian province of Alberta has experienced a 67% increase in the proportion of its population
with Diabetes from 1995 to 2009 (Johnson and Balko (2011)). At the same time, there has been
an increase in the proportion of Albertans with diabetes who have diabetes and hypertension
(Hemmelgarn et al. (2011)).
The increasing proportion of patients with multiple chronic conditions is a particular concern
for provincial ministries of health as people with multiple chronic conditions are in worse health
(by definition) and tend to use more health care services (McLeod (2011), Johnson et al. (2011)).
Patients with multiple chronic conditions in particular face challenges with respect to managing
their health and navigating the health care system. It has been suggested e↵ective management of
multiple chronic conditions requires significant participation by the patient and their physician, as
well as a paradigm shift from episodic care to comprehensive and coordinated care.
Given the challenges of involving patients, incentivizing providers, and instituting a paradigm
shift from episodic to comprehensive, coordinated care, a natural question to as is how can a health
care authority (such as a provincial government) improve care for patients with multiple chronic
conditions? Alberta’s solution was to: (i) provide patients with the information necessary to take
better care of themselves; and (ii) incentivize primary care physicians to deliver the information
to patients using the existing fee-for-service payment model. Information was provided to patients
through a comprehensive annual care plan (CACP). A CACP is a single document containing rele-
vant information for the patient, prepared by a patient’s primary care physician, and communicated
by the primary care physician through direct contact with the patient. Primary care physicians
were incentivized to prepare and deliver a CACP through the introduction of a new fee code (health
2

service code 03.04J). Alberta introduced both CACPs and HSC 03.04J were introduced on April
1, 2009.
Economic theory provides broad predictions regarding physician behavioural responses to the
three primary payment mechanisms (fee-for-service, capitation, and salary). Recent overviews of
some of these issues include: Leger (2008), McGuire (2011), Christianson and Conrad (2011). While
this is an oversimplification, fee-for-service is argued to incentivize physicians to provide more than
the optimal quantity of services. In fact, in the presence of excess physician capacity many (but not
all) researchers expect so-called “physician induced demand” whereby the asymmetric information
between a physician and his/her patient allows the physician to generate demand for services beyond
those medically necessary. For example, a physician may ask a patient to return in two weeks to
discuss their test results even though a phone call from a nurse could either inform the patient their
results indicate no problem; or schedule a follow-up appointment if the results are not benign.
Interestingly, the academic research exploring pay-for-performace payment schemes, such as the
introduction of the HC 03.04J, has found mixed results on the e↵ectiveness of changing behaviour.
Some evidence from Ontario suggests pay-for-performance incentives in Ontario have are generally
not been very e↵ective at changing behaviour (Li et al. (2013)), although Kralj and Kantarevic
(2013) find more positive results looking at the diabetes incentive in Ontario. Van Herck et al.
(2010) conducted a systematic evaluation of 128 studies on a wide range of pay-for-performance
initiatives. They observed a remarkable range of program e↵ects. Some initiatives had zero or
negligible e↵ects on outcomes, while the evaluation of others found appreciable benefits. Context,
design details, and initial conditions all seem to play a very important role.
This paper asks how did the introduction of 03.04J a↵ected the delivery of primary care to
patients with multiple chronic conditions? We use the introduction of CACPs and 03.04J on April
1, 2009 as a quasi-experiment to identify how changes in the schedule of medical benefits a↵ected
the provision of primary care services to patients with multiple co-morbidities. Specifically, we as
what was the e↵ect of 03.04J on a primary care physician’s billing of visit codes? And, did the
introduction of 03.04J have an indirect e↵ect on total billing by increasing the number of ‘visit’
claims made?
3
2 Alberta’s Primary Care Environment
2.1 Comprehensive Annual Care Plan (CACP)
A CACP is a single document containing: (a) clearly defined goals which are mutually agreed upon
between the patient and the primary care physician; (b) a detailed review of the patient’s chart,
current therapies, problem list, and past medical history; (c) any relevant information that may
a↵ect the patient’s health and/or treatment options (including, but not limited, to demographics
and lifestyle behaviours); (d) the patient’s values and personal health goals, with respect to their
complex need; and (e) an outline of the expected outcomes resulting from the plan, including
possible end-of-life issues. The CACP must be communicated by the primary care physician through
direct contact with the patient (or patient’s agent). Confirmation the plan was communicated
verbally and in writing to the patient must be documented through the primary care physician
and patient’s signature on the CACP. The CACP must be retained in the patient’s medical record
(Alberta Health & Wellness (2009)).
The CACP is intended to benefit patients, physicians, and the health care system. The process
of developing and maintaining a CACP is intended to benefit patients by: (i) helping patients to
better understand and manage their health; (ii) helping patients navigate the health system; (iii)
improving patient access to a team of appropriate health care providers; and (iv) providing patients
with a tool to help identify and achieve their goals as they manage their health.
The creation of a CACP is intended to benefit primary care physicians by: (i) facilitating
appropriate remuneration for the time and e↵ort required to e↵ectively manage complex patients
with multiple co-morbidities; (ii) assisting primary care physicians in coordinating and managing
patient care; (iii) improving communication with their patients; and (iv) enhancing collaboration
with other health care providers.
For the health care system, the CACP is intended to: (i) promote comprehensive, coordinated
care for patients with multiple co-morbid chronic conditions; (ii) improve patient care and service
delivery; and (iii) support the continued development of chronic disease management and primary
care strategies in Alberta.
4

2.2 Health Service Code 03.04J
The HSC 03.04J is intended to remunerate primary care physicians for the development, documen-
tation, and administration of a CACP for a patient with a “complex need”. Patients are defined as
having a “complex need” if they have two or more eligible diagnoses as defined by Alberta Health
& Wellness. Table 1 lists the eligible diagnoses and divides them into two groups (A and B). HSC
03.04J defines a patient as having“complex needs” if they have two or more diagnoses in group A,
or one diagnoses in group A and at least one diagnoses in group B.
The primary care physician most responsible for a patient is eligible to claim HSC 03.04J. A
primary care physician may only claim HSC 03.04J once per patient per year. This includes all
ongoing communication as required, including re-evaluation of the patient and the CACP within a
year of the date of first claim.
Table 1: Eligible Diagnostic Codes defining Complex Needs under 03.04J
Group A Group B
Hypertensive Disease (ICD 401) Mental Health Issues (ICD 290-319)Diabetes Mellitus (ICD 250) Obesity (ICD 278)Chronic Obstructive (ICD496) Addictions (ICD 303-304)Pulmonary Disease Tobacco Use (ICD 305.1)Asthma (ICD 493)Heart Failure (ICD428)Ischaemic Heart Disease (ICD413-414)
2.3 Primary Care Delivery Structures
Primary care physicians in Alberta can practice as either a solo practice physician, or as a member of
a Primary Care Network (PCN). A solo practice physician is a single physician, working in a single
location, paid by fee-for-service (Manns et al. (2012), Campbell et al. (2013)). A PCN primary care
physician is a member of an interdisciplinary team of physicians and allied health care providers
(including nurses, dieticians, and pharmacists) located at one or more physical locations. Alberta
introduced the first PCNs in 2005, with new PCNs being introduced annually. In addition to the
standard fee-for-service physician payments, the PCN receives a $50 capitation payment per year in
order to support activities outside of the fee-for-service payment model, but within the objectives
5

of the PCN. When a PCN is formed, they must specify certain objectives (i.e. priority services
provided) of the PCN such as after hours care, seniors’ care, or care for patients with complex and
chronic conditions. The PCN capitation payment can be used to pay for the PCN’s allied health
care providers which are intended to support the PCN’s objectives (Manns et al. (2012), Campbell
et al. (2013)).
The type of primary care delivery structure, and resulting payment models, will have direct
implications on the resources available to a primary care physician for service provision. Solo
practice physicians generally have fewer resources available to provide care relative to physicians
based in a PCN. The is primarily due to the additional labour available in a PCN through additional
primary care physicians, and/or additional allied health care providers.
3 Data
3.1 Data Sources
The analysis uses two of Alberta Health’s administrative databases: (i) the Practitioner payments
database; and (ii) the population registry. The Alberta Practitioners database contains information
on physician services received by individuals in Alberta from a fee-for-service primary care physician
for three fiscal years (April 1, 2008 to March 31, 2011).1 The population registry provided basic
demographic information on patients.
3.2 Variables
Each record represents one health service code claim by a specific primary care physician for a
specific patient and provides information on the specific health service code claimed (including: the
dollar value of the code, the date of claim, and any diagnostic codes accompanying the claim2), the
forward sortation area3 of the physician’s practice, a flag for whether the physician provided the
service while working in a PCN on the date of the claim, basic physician characteristics (e.g. age,
sex), and basic patient characteristics (e.g. age, sex).1According to the Canadian Institute for Health Information (2011), 92.8% of total clinical physician payments
in Ontario were fee-for-service (FFS).2Each record provided a primary diagnostic code, with a possible secondary and tertiary diagnostic code. Each
diagnostic code was based on the International Classification of Diseases, 9th Revision, (ICD-9) codes.3The forward sortation area is the first three digits of the postal code.
6

We constructed two variables. First, the Alberta Health Service zone (a categorical variable
with five categories: North, Edmonton, Central, Calgary, and South) was constructed based on the
forward sortation area of the physician’s practice.4 The intention was to control for any unobserved
e↵ects of the geographic administrative health area where the service was provided. Second, the
number of patient visits each month to each primary care physician was constructed based on the
number of claims for specific visit codes (03.03A or 03.04A). The intention was to control for the
volume of services provided by the physician.
Two binary variables were also created to indicate: (i) any HSC claimed in the ‘post’ period
after the introduction of HSC 03.04J (i.e., after April 1, 2009); and (ii) whether a physician was
in the ‘treatment’ group. A primary care physician is classified as being in the treatment group if
they made at least one claim of HSC 03.04J in 2009/10 or 2010/11.
3.3 Descriptive Statistics
Table 2 presents descriptive statistics for the HSC 03.04J during the first two fiscal years (2009/10
and 2010/11) after the introduction of 03.04J. The base rate for HSC 03.04J in 2009/10 was
$206.70, then increased by 3.4% to $213.80 in 2010/11. In its first year, 1,359 di↵erent primary
care physicians made a total of 86,439 claims for HSC 03.04J costing a total of $17.9 million. There
was a 10.5% increase in the number of claims in 2010/11 over 2009/10. A primary care physician
who claimed at least one HSC 03.04J, on average, claimed 63.6 (in 2009/10) and 68.2 (in 2010/11)
HSC 03.04J.
Table 2: Descriptive Statistics - 03.04J
2009/10 2010/11 % �(YTY)
(1) (2) (3)Base Rate of 03.04J $206.70 $213.80 3.4%# of 03.04J Claims 86,439 95,495 10.5%Amount paid for 03.04J (Millions $) 17.9 20.4 14.0%# of Physicians claiming 03.04J 1,359 1,401 3.1%Avg. # of 03.04J Claims per Physician 63.6 68.2 7.2%
4For clarity, a map of the Alberta Health Service zones is presented in Appendix A1.
7

Table 3 shows how HSC 03.04J became one of the most billed health service codes by primary
care physicians in 2009/10. In 2009/10, primary care physicians billed a total of $915.9 million
dollars. Seven specific health service codes account for approximately 75% of total billings by
primary care physicians. The sixth most billed code (03.04J) accounts for $17.9 million in 2009/10,
and $20.4 million in 2010/11 (or, approximately 2% of total billings). The top two health service
codes (03.03A and 03.04A) are both “visit” codes. There was a 30% increase in the billing of
03.03A from 2008/09 to 2009/10 (from $346.2 million to $452.4 million), and a 28% increase in the
billing of 03.04A from 2008/09 to 2009/10 (from $83.8 million to $107.5 million). Both 03.03A and
03.04A can be billed in conjunction with 03.04J.
Table 3: Most Billed HSC, by Primary Care Physicians, 2008-2011
2008-2009 2009-2010 2010-2011
HSC $ % of HSC $ % of HSC $ % ofTotal Total Total
(1) (2) (3) (4) (5) (6) (7) (8) (9)1 03.03A 346.2 44.3 03.03A 452.4 49.4 03.03A 470.7 48.32 03.04A 83.8 10.7 03.04A 107.5 11.7 03.04A 116.1 11.93 08.19G 37.5 4.8 03.01AA 38 4.1 03.01AA 42.6 4.44 03.03Z 37.4 4.8 08.19G 37.8 4.1 08.19G 41.5 4.35 03.03D 32.8 4.2 03.03D 32 3.5 03.03D 34.6 3.66 03.03L 12.7 1.6 03.04J 17.9 2.0 03.04J 20.4 2.17 03.05DN 12.2 1.6 03.03B 12.5 1.4 03.04C 13.4 1.4
Other 218.8 28 217.8 23.8 235.4 24.2Total 781.3 915.9 974.8Note: Amount Billed ($) is in Millions of $
03.03A: Visit not requiring a complete history or evaluation
03.04A: Comprehensive visit
03.01AA After hours time premium
08.19G: visit (Psychiatric Treatment)
03.03D Hospital visits
03.03Z Short Visit, patient aged 75 and older
Figure 1 shows the average monthly billings by primary care physicians in the treatment (03.04J
billers) and control (03.04J non-billers) groups from April 2008 to March 2011 (one fiscal year
before, and two fiscal years after, the introduction of HSC 03.04J). Primary care physicians in the
treatment group consistently bill $8,000 to $10,000 more per month than physicians in the control
group. The variation in monthly billing is similar across both groups. Interestingly, there appears
8
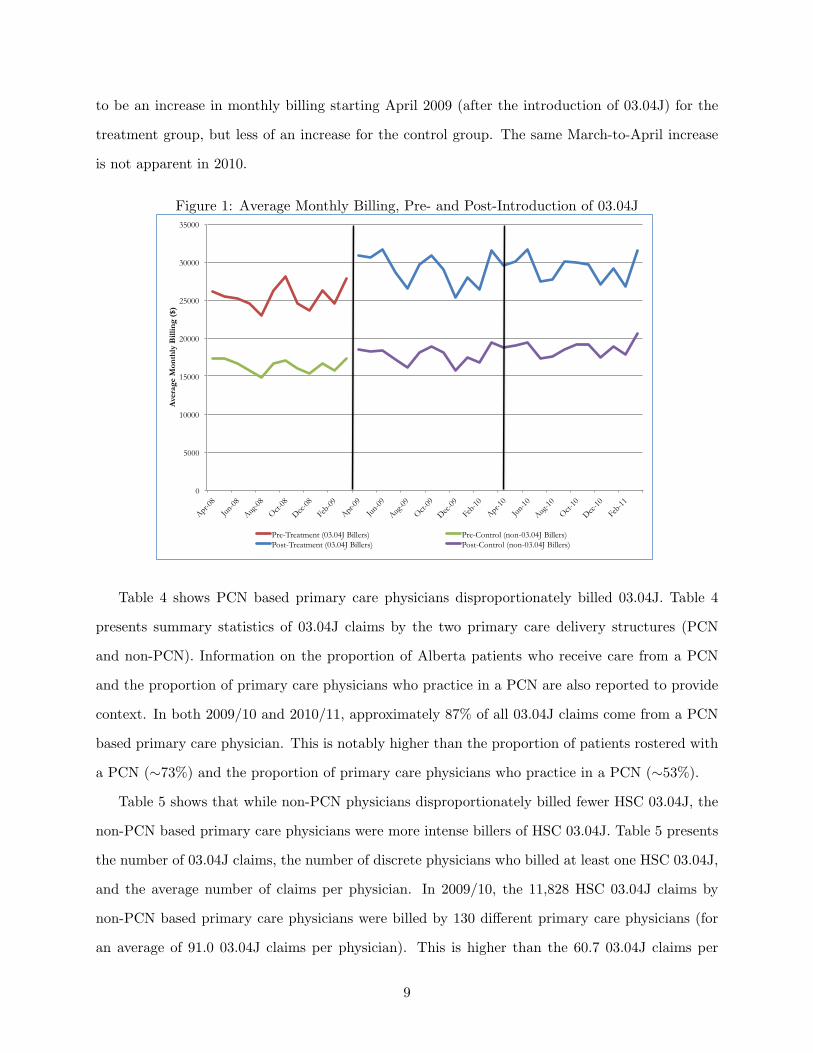
to be an increase in monthly billing starting April 2009 (after the introduction of 03.04J) for the
treatment group, but less of an increase for the control group. The same March-to-April increase
is not apparent in 2010.
Figure 1: Average Monthly Billing, Pre- and Post-Introduction of 03.04J
0
5000
10000
15000
20000
25000
30000
35000
Apr-08
Jun-08
Aug-08
Oct-08
Dec-08
Feb-0
9
Apr-09
Jun-09
Aug-09
Oct-09
Dec-09
Feb-1
0
Apr-10
Jun-10
Aug-10
Oct-10
Dec-10
Feb-1
1
Ave
rage
Mon
thly
Bill
ing
($)
Pre-Treatment (03.04J Billers) Pre-Control (non-03.04J Billers) Post-Treatment (03.04J Billers) Post-Control (non-03.04J Billers)
Table 4 shows PCN based primary care physicians disproportionately billed 03.04J. Table 4
presents summary statistics of 03.04J claims by the two primary care delivery structures (PCN
and non-PCN). Information on the proportion of Alberta patients who receive care from a PCN
and the proportion of primary care physicians who practice in a PCN are also reported to provide
context. In both 2009/10 and 2010/11, approximately 87% of all 03.04J claims come from a PCN
based primary care physician. This is notably higher than the proportion of patients rostered with
a PCN (⇠73%) and the proportion of primary care physicians who practice in a PCN (⇠53%).
Table 5 shows that while non-PCN physicians disproportionately billed fewer HSC 03.04J, the
non-PCN based primary care physicians were more intense billers of HSC 03.04J. Table 5 presents
the number of 03.04J claims, the number of discrete physicians who billed at least one HSC 03.04J,
and the average number of claims per physician. In 2009/10, the 11,828 HSC 03.04J claims by
non-PCN based primary care physicians were billed by 130 di↵erent primary care physicians (for
an average of 91.0 03.04J claims per physician). This is higher than the 60.7 03.04J claims per
9

Table 4: 03.04J claims, by Delivery Structure
2009/10 2010/11 Alberta
# of $ % of # of $ % of (2011)
Claims (Millions) Total Claims (Millions) Total Patients Physicians(1) (2) (3) (4) (5) (6) (7) (8)
Non-PCN 11,828 2.5 13.7 11,958 2.6 12.5 26.6% 47.2%PCN 74,611 15.4 86.3 83,537 17.8 87.5 73.4% 52.8%Total 86,439 17.9 100 95,495 20.4 100
note: Patient and physician data come from Primary Care Initiative (2014). According to the 2011 Census, the populationof Alberta was 3,645,257 (Statistics Canada (2014)). According to Alberta’s administrative physician claims data, there wereapproximately 4,730 primary care physicians.
PCN based primary physician.
In 2010/11, the 11,958 HSC 03.04J claims by non-PCN based primary care physicians were
billed by 140 di↵erent primary care physicians (for an average of 85.4 03.04J claims per physician).
This is a slight decrease from the higher than the 91.0 03.04J claims in 2009/10, but still notably
higher than the 66.2 03.04J claims per PCN based primary physician in 2010/11.
Table 5: Average 03.04J claims per physician, by Delivery Structure
2009/10 2010/11
Delivery # of # of # Claims # of # of # ClaimsStructure Claims Providers Per Provider Claims Providers Per Provider
(1) (2) (3) (4) (5) (6)Non-PCN 11,828 130 91.0 11,958 140 85.4
PCN 74,611 1230 60.7 83,537 1261 66.2Total 86,439 1360 63.6 95,495 1401 68.2
3.4 Descriptive Statistics by Treatment and Control Groups
Table 6 presents descriptive statistics of physician characteristics (age and sex) and practice char-
acteristics (AHS zone, PCN practice) by fiscal year for the treatment and control groups. The
control group tends to be older than the treatment group (48 years old vs. 46 years old). It ap-
pears male physicians make a larger share of the treatment group, however the control group has
approximately 15% of the sample not reporting their sex.
As for practice characteristics, 90% of the treatment group is comprised of physicians based in
10

a PCN compared to about a third (33%) of the control group. This is not surprising given Table
4. It is di�cult to compare di↵erences across practice location (by AHS zone) since more than a
third (33.3%) of the control group has AHS zone unknown.
Overall, the treatment and control groups meaningfully di↵er with respect to physician age (the
treatment group is younger) and practicing in a PCN (the treatment group is predominantly PCN
based).
11

Table 6: Descriptive Statistics, by Treatment/Control Group and Fiscal Year
2008-2009 2009-2010 2010-2011Treatment Control Total Treatment Control Total Treatment Control Total
Physician CharacteristicsAge 45.6 47.9 46.9 45.8 48.1 47.1 46.2 48.1 47.3
(1,479) (2,011) (3,490) (1,582) (2,029) (3,611) (1,656) (2,111) (3,767)Female (%) 38.4 33.8 35.3 38.7 35.4 36.5 39.0 36.4 37.3
(572) (1,016) (1,588) (616) (1,099) (1,715) (650) (1,114) (1,764)Male (%) 61.6 50.9 54.4 61.3 49.7 53.7 61.0 50.9 54.5
(916) (1,531) (2,447) (976) (1,546) (2,522) (1,018) (1,559) (2,577)Sex Unknown (%) 0.0 15.4 10.3 0.0 14.9 9.9 0.0 12.7 8.2
- (463) (463) - (464) (464) - (389) (389)AHS ZoneCalgary (%) 37.2 25.8 29.6 36.5 25.3 29.1 36.6 27.0 30.4
(554) (776) (1,330) (581) (787) (1,368) (610) (826) (1,436)Central (%) 10.8 6.9 8.2 11.0 7.0 8.3 10.9 7.1 8.5
(161) (207) (368) (175) (216) (391) (182) (218) (400)Edmonton (%) 30.2 22.3 24.9 30.4 21.7 24.7 30.4 22.6 25.4
(449) (672) (1,121) (484) (675) (1,159) (507) (693) (1,200)North (%) 10.8 6.5 7.9 11.2 6.3 8.0 10.9 6.6 8.1
(161) (195) (356) (178) (197) (375) (182) (202) (384)South (%) 10.8 3.5 5.9 10.5 3.4 5.8 10.5 3.4 5.9
(160) (106) (266) (167) (107) (274) (175) (103) (278)Unknown (%) 0.2 35.0 23.5 0.4 36.3 24.1 0.7 33.3 21.8
(3) (1,054) (1,057) (7) (1,127) (1,134) (12) (1,020) (1,032)PCN PracticeNo (%) 10.2 67.7 48.6 9.7 67.2 47.7 10.4 65.2 45.9
(151) (2,037) (2,188) (155) (2,089) (2,244) (174) (1,995) (2,169)Yes (%) 89.9 32.3 51.4 90.3 32.8 52.3 89.6 34.9 54.1
(1,337) (973) (2,310) (1,437) (1,020) (2,457) (1,494) (1,067) (2,561)note: Means reported, sample size reported below mean (in brackets).
12
4 Empirical Methodology
As noted above, we exploit the introduction of 03.04J on in April 2009 as a quasi-experiment.
However, two concerns immediately arise regarding: (i) potential bias from non-random selection
of primary care physicians into the treatment group (i.e. primary care physicians who billed at
least one HSC 03.04J); and (ii) confounding by the PCN delivery structure since the PCN delivery
structure di↵ers from solo-practice in meaningful ways other than just the fee-for-service payment
model.
4.1 Di↵erence-in-Di↵erences Methodologies
To estimate the e↵ect of introducing fee code 03.04J on primary care physician billing patterns, we
employ a three di↵erent di↵erence-in-di↵erences (DID) models. The DID approach is a standard
methodology to analyze the e↵ects of a policy change on an outcome of interest (Bertrand et al.
(2004), Donald and Lang (2007), Imbens and Wooldridge (2009), Angrist and Pischke (2009)).
In model 1, we use the standard DID (with parallel trend assumption). In model 2, we include
physician fixed e↵ects to account for any unobserved physician characteristics potentially a↵ecting
non-random selection into the treatment group. Finally, model 3 relaxes the parallel trend assump-
tion of model 1, allowing for di↵erential time trends between the treatment and control groups,
and includes physician fixed e↵ects of model 2.
4.1.1 Standard DID with parallel trend assumption
The standard DID specification is given by:
log yit = �Xit + �Postt + ⇢Di + �(Postt ⇥Di) + ✓t + µit (1)
where yit is the total amount billed in month t by physician i, Xit is a set of observable (time
varying and time invariant) physician/practice characteristics, Postt is a dummy variable equal to
one for observations after and including April 2009 (the post period), Di is a dummy variable equal
to one for physicians who are in the treatment group (i.e., physicians who make at least one 03.04J
claim), Postt⇥Ti is an interaction term that takes the value of one for physicians in the treatment
13

group in the post period (after the introduction of 03.04J), ✓t are month/year fixed e↵ects, and
µit is the idiosyncratic error term. The two parameters of interest are � which captures the DID
e↵ect of 03.04J on primary care physician billings, and �PCN which capture the e↵ect of PCNs on
primary care physician billings. To account for possible autocorrelation in yit, we estimate model
(1) with clustered standard errors.
4.1.2 Physician Fixed E↵ects
While model (1) is a reasonable starting point to estimate the e↵ect of 03.04J’s introduction on
primary care physician billings, it may be the case unobserved physician characteristics could
influence a physician’s decision to claim 03.04J and their overall level of billing. Based on Figure
1, this seems likely since overall billing pre-April 2009 is higher for primary care physicians in the
treatment group than primary care physicians in the control group. To account for the unobserved
physician characteristics, we re-estimate model (1) but include and additional term, �i, to capture
unobserved individual physician fixed e↵ects:
log yit = �Xit + �Postt + �(Postt ⇥Di) + ✓t + �i + µit. (2)
Again, the two parameters of interest are � which captures the DID e↵ect of 03.04J on primary care
physician billings, and �PCN which capture the e↵ect of PCNs on primary care physician billings.
4.1.3 DID with di↵erential trend assumption
One implication of the parallel trend assumption of model (1) is any time e↵ects a↵ect both the
treatment and control groups the same way. Specifically, it also assumes the time trends in April
2009 (when 03.04J was introduced) did not a↵ect the time trends (Bell et al. (1999)). However,
if either: (i) the time trends are di↵erent across the treatment and control groups; or (ii) the
introduction of 03.04J did a↵ect the the time trends; then a parallel trend assumption would likely
underestimate the impact of 03.04J being introduced.
To allow for a di↵erential trend, we use the DID specification proposed by Bell et al. (1999).
This model has also been recently used by Li et al. (2013) in a similar context to ours. The model
14

of Bell et al. (1999) assumes:
eit =
8>><
>>:
�i + kT mt + µit, if Di = 1
�i + kCmt + µit, if Di = 0
where eit captures the unobserved individual physician fixed e↵ects (�i), the idiosyncratic error
term (µit), and an unobserved time trend (mt). The specification of eit allow the trend (mt to
di↵er between the treatment group (kT ) and control group (kC).
The model of Bell et al. (1999) can be estimated using a similar approach as Li et al. (2013) by
incorporating eit into model (2):
log yit = �Xit + �Postt + �(Postt ⇥Di) + ✓t + �i + knmt + (kT � kC)mtDi + µit,
which can be estimated using a standard fixed-e↵ects model with a linear time trend (t) plus an
interaction between the linear time trend and the the treatment group dummy variable (Di):
log yit = �Xit + �Postt + �(Postt ⇥Di) + ✓t + �i + ⌘t + �(t⇥Di) + µit. (3)
5 Regression Results
Two sets of results are presented. The first set of results are for the three primary di↵erence-in-
di↵rences models The second set of results are robustness checks.
Because all three models have a semi-log form (there is a logarithmic transformation of the
dependent variable) the coe�cient (↵) must be transformed in order to interpret the e↵ect of
billing 03.04J on the percentage change in y.5 The transformed coe�cient is interpreted as the
percentage change in billings (y) as a result of the introduction of 03.04J.
Table 7 presents the DID estimates of the introduction of 03.04J on the change in billing by
primary care physicians who billed at least one HSC 03.04J. For each model, we report the coe�cient
estimate (↵) and the transformed coe�cient %�y = (e↵ � 1) for the treatment e↵ect (↵ = �) and
PCN membership (↵ = �PCN ).5Specifically, in a semi-log model where the independent variable is a binary variable, as it is in our case, then the
percentage change in y is given by e↵ � 1 (Kennedy (2008)).
15

Table 7: Coe�cient Estimates - Di↵erence-in-Di↵erences Models
Model (1) (2) (3)↵ %�y ↵ %�y ↵ %�y
Treatment E↵ect (�) 0.052 5.3% 0.082 8.5% 0.099 10.4%(0.017) (0.008) (0.009)
PCN Membership (�PCN ) 0.174 19.0% 0.166 18.1% 0.163 17.7%(0.035) (0.035) (0.035)
Physician/practice characteristics Yes Yes YesMonth/Year fixed e↵ects Yes Yes YesIndividual physician fixed e↵ects Yes YesDi↵erential Trend Yesyit: all HSC Yes Yes YesSample Size (n) 110,042 110,042 110,042Number of Clusters 4,027 4,027 4,027Table reports coe�cient estimates (with standard errors in brackets).
The percentage change in y (= e↵ � 1) is reported next to the coe�cient.
All estimates are significant at p < 0.01.
For model (1), we control for basic physician and practice characteristics and month/year fixed
e↵ects. The estimated coe�cient of the treatment e↵ect is 0.052 and statistically significant at
the 1% level. This suggest a 5.2% increase in total billing for primary care physicians who billed
03.04J. The estimated coe�cient of PCN membership is 0.174 and statistically significant at the
1%; suggesting primary care physicians in a PCN bill 19.0% more than solo-practice primary care
physicians. However, as noted above, it may be the case unobserved physician characteristics could
influence a physician’s decision to claim 03.04J and their overall level of billing.
For model (2), we include physician fixed e↵ects to account for unobserved physician character-
istics that may a↵ect both the decision to bill 03.04J as well as overall billing levels. The inclusion
of physician fixed e↵ects increases the estimated coe�cient of the treatment e↵ect to 0.082 and
statistically significant at the 1% level. This suggest a 8.5% increase in total billing for primary
care physicians who billed 03.04J. The estimated coe�cient of PCN membership is 0.166 and sta-
tistically significant at the 1%; suggesting primary care physicians in a PCN bill 18.1% more than
solo-practice primary care physicians.
For model (3), we now allow for di↵erential trends across the treatment and control group,
but still include physician fixed e↵ects. The di↵erential time trend with the inclusion of physician
fixed e↵ects now increases the estimated coe�cient of the treatment e↵ect to 0.099 and statistically
significant at the 1% level. This suggest a 10.4% increase in total billing for primary care physicians
16

who billed 03.04J. The estimated coe�cient of PCN membership decreases slightly to 0.163 and
statistically significant at the 1%; suggesting primary care physicians in a PCN bill 17.7% more
than solo-practice primary care physicians.
5.1 Robustness Checks
Models (1) to (3) are all estimated on a sample of all primary care physicians, with the log of
all billings as the dependent variable. We look at two specific robustness checks: (i) a sample of
“regular” 03.04J billers (primary care physicians who claimed less than 365 HSC 03.04J) repre-
senting 98% of all 03.04J billers; and (ii) defining yit as billing visit specific codes (rather than
total billings). All robustness checks reported are estimated using model (3).6 Table 8 presents the
results of the robustness checks.
Table 8: Robustness Checks - Di↵erence-in-Di↵erences Model (3)
Model (4) (5) (6)↵ %�y ↵ %�y ↵ %�y
Treatment E↵ect (�) 0.095 10.0% 0.066 6.8% 0.066 6.8%(0.009) (0.009) (0.009)
PCN Membership (�PCN ) 0.160 17.3% 0.186 20.4% 0.183 20.1%(0.035) (0.037) (0.037)
Physician/practice characteristics Yes Yes YesMonth/Year fixed e↵ects Yes Yes YesPhysician fixed e↵ects Yes Yes YesDi↵erential Trend Yes Yes YesExclude top 2% Yes Yesyit: all HSC Yesyit: HSC 03.03A, 03.04A & 08.18G Yes YesSample Size (n) 108,743 100,298 99,002Number of Clusters 3,990 3,678 3,641Table reports coe�cient estimates (with standard errors in brackets).
The percentage change in y (= e↵ � 1) is reported next to the coe�cient.
All estimates are significant at p < 0.01.
The increase in total billings may simply be caused by the primary care physicians who were
high billers of HSC 03.04J. Models (4) restricts the sample to only “regular” billers by excluding
primary care physicians who claimed more than 365 HSC 03.04J (i.e., one claim per day) in either
2009/10 or 2010/11. This represent approximately the top 2% of primary care physicians. Model
(4) is simply model (3) on the sub-set of regular billers. The estimated coe�cient of the treatment6We estimated all robustness checks using models (1), (2), and (3). The results from all specifications are broadly
consistent with the results of the robustness checks using model (3).
17
e↵ect is 0.095 and is statistically significant at the 1% level. This suggest primary care physicians
who are regular billers of 03.04J increase their total billings relative to primary care physicians who
do not claim 03.04J by 10%. The estimated coe�cient of PCN membership is 0.160; suggesting
primary care physicians in a PCN bill 17.3% more than solo-practice primary care physicians.
Models (6) defines the dependent variable to billings of visit specific codes (03.03A, 03.04A and
08.19G), rather than total billings from all fees codes. We focus on the visit specific codes since
these codes are very likely to be billed in conjunction with an 03.04J claim, but also commonly
billed codes in all years. Model (6) is simply model (3) on visit specific codes. The estimated
coe�cient of the treatment e↵ect from model (5) is 0.066 and is statistically significant at the
1% level. This suggest primary care physicians in the treatment group increase their visit specific
billings relative to primary care physicians in the control group by 6.8%. The estimated coe�cient
of PCN membership is 0.186; suggesting primary care physicians in a PCN bill 20.4% more than
solo-practice primary care physicians.
Finally, we estimate a model on the sample of regular billers with the dependent variable being
billings of visit specific codes. Model (6) is estimated using model (3). The coe�cient estimate is
stable at 0.066 (and, again, statistically significant at the 1% level); suggesting regular billers of
03.04J increase their billings of visit codes, relative to primary care physicians who do not claim
03.04J, by 6.8%. The estimated coe�cient of PCN membership is 0.183; suggesting primary care
physicians in a PCN who are “regular” billers of 03.04J bill 17.3% more than solo-practice primary
care physicians.
Overall, the robustness checks suggest the results of model (3) are fairly stable and mainly
generated due to the increase in billing of visit specific codes.
6 Discussion
What can be clearly seen is the introduction of 03.04J had a direct cost $17.9 million in its first
year and $20.4 million in its second year. What can not be easily seen is the indirect costs from
the introduction of 03.04J. Our DID estimates suggest the indirect costs of 03.04J were an ap-
proximately 5% to 10% increase in total primary care physician billings, and an approximately 7%
increase in visit specific billings. This translates into an estimated indirect cost of $81.3 million
18

(10.4% of 781.3 million) increase in total billing, of which $24.3 million (6.8% of $346.2 million +
$83.8 million) is due to an increase in visit specific billings.
At the same time, the interaction between the introduction of 03.04J and the existing primary
care delivery structures (PCN vs. solo practice) also plays an important role in total billings.
Primary care physicians in PCNs appear to bill 18% to 20% more than solo practice primary care
physicians. This may be due to non-random selection of physicians into PCNs, or due to the
increased resources available to a PCN primary care physician for service provision.
The paper has a few limitations. The primary limitation is the paper does not look at the
health outcomes of patients. We are not able to look at health outcomes with this data for two
main reasons. First, and foremost, direct measures of patient health are not contained in the
administrative claims data. Second, the administrative claims data we are using only contains all
fee-for-service primary care physician for three fiscal years (April 1, 2008 to March 31, 2011). We
do not have information on hospitalizations, laboratory tests, or specialist physician care. This
prevents us from being able to estimate patients health outcomes based on health care utilization
patterns. Thus, we have no evidence whether the introduction of CACPs (and HSC 03.04J) actually
improved the health of patients with multiple chronic conditions.
A second limitation relative to other contemporaneous changes to the fee schedule. When 03.04J
was introduced, there was also a substantial increase in the after hours code (03.01AA), the removal
of the 03.03Z (which was replaced with an age modifier for 03.03A7). The other contemporaneous
changes may mean our results are overestimating the impact of introducing 03.04J.
The results suggest the unintended consequences of a well-intentioned policy can be costly.
If health policy makers want to nudge physicians to provide di↵erent types of care in order to
improve patient outcomes by changing the fee schedule (in the context of a predominantly fee-for-
service payment system), they ought to account for both the direct and indirect e↵ect of physicians’
behavioural response to changes in the fee schedule.
7The 03.03A age modifier permits primary care physicians who see a patient 75 years of age or older can be paidfor HSC 03.03A at 20% above the GP rate of $35.91 (Alberta Medical Association (2009)).
19

References
Alberta Health & Wellness (2009, April 1). Comprehensive Annual Care Plan: A fee-for ser-vice model to compensate physicians for coordination of the comprehensive care of patients withcomplex medical needs. AHCIP-Bulletin - SpEd - CACP: Alberta Health & Wellness.
Alberta Health Services (2011). Alberta health services, zone map.http://www.albertahealthservices.ca/ahs-map-ahs-zones.pdf, Last accessed: March 1, 2014.
Alberta Medical Association (2009, March). Billing corner, alberta healthcare insurance plan schedule of medical benefits changes for april 1, 2009.http://www.microquest.ca/news/Billing Corner Mar 09.pdf, Last accessed: May 7, 2014.
Angrist, J. D. and J.-S. Pischke (2009). Mostly Harmless Econometrics. Princeton University Press.
Bell, B., R. Blundell, and J. Van Reenen (1999). Getting the unemployed back to work: the roleof targeted wage subsidies. International Tax and Public Finance 6 (3), 339–360.
Bertrand, M., E. Duflo, and S. Mullainathan (2004, February). How much should we trustdi↵erences-in-di↵erences estimates? Quarterly Journal of Economics 119 (1), 249–275.
Campbell, D. J., P. Sargious, R. Lewanczuk, K. McBrien, M. Tonelli, B. Hemmelgarn, and B. Manns(2013). Use of chronic disease management programs for diabetes: In alberta’s primary carenetworks. Canadian Family Physician 59, e86–e92.
Canadian Institute for Health Information (2011). National Physician Database 2011–2012 – DataRelease. Canadian Institute for Health Information.
Christianson, J. B. and D. Conrad (2011). Provider payment and incentives. In S. Glied and P. C.Smith (Eds.), The Oxford Handbook of Health Economics, pp. 624–648. Oxford University Press.
Donald, S. G. and K. Lang (2007, May). Inference with di↵erence-in-di↵erences and other paneldata. The Review of Economics and Statistics 89 (2), 221–233.
Hemmelgarn, B. R., H. Quan, and L. W. Svenson (2011). Diabetes and hypertension in alberta. InJ. A. Johnson (Ed.), Alberta Diabetes Atlas 2011, Chapter 6, pp. 107–114. Edmonton: Instituteof Health Economics.
Imbens, G. W. and J. M. Wooldridge (2009). Recent developments in the econometrics of programevaluation. Journal of Economic Literature 47 (1), 5–86.
Johnson, J. A. and S. U. Balko (2011). Epidemiological trends of diabetes in alberta. In J. A.Johnson (Ed.), Alberta Diabetes Atlas 2011, Chapter 2, pp. 11–26. Edmonton: Institute of HealthEconomics.
Johnson, J. A., L. McLeod, D. M. Rabi, A. L. Edwards, and S. U. Balko (2011). Diabetes andhealth care utilization in alberta. In J. A. Johnson (Ed.), Alberta Diabetes Atlas 2011, Chapter 4,pp. 35–58. Edmonton: Institute of Health Economics.
Kennedy, P. (2008). A Guide to Econometrics, 6th Edition. Blackwell Publishing Ltd.
Kralj, B. and J. Kantarevic (2013). Quality and quantity in primary care mixedpayment models:evidence from family health organizations in ontario. Canadian Journal of Economics 46 (1),208–238.
20

Leger, P. T. (2008). Physician payment mechanisms. In M. Lu and E. Jonsson (Eds.), FinancingHealth Care: New Ideas for a Changing Society, pp. 149–176. Wiley-VCH.
Li, J., J. Hurley, P. DeCicca, and G. Buckley (2013). Physician response to pay-for-performance:evidence from a natural experiment. Health Economics, DOI: 10.1002/hec.2971.
Manns, B. J., M. Tonelli, J. Zhang, D. J. Campbell, P. Sargious, B. Ayyalasomayajula, F. Clement,J. A. Johnson, A. Laupacis, R. Lewanczuk, K. McBrien, and B. R. Hemmelgarn (2012, February).Enrolment in primary care networks: impact on outcomes and processes of care for patients withdiabetes. Canadian Medical Association Journal 184 (2), E144–E152.
McGuire, T. G. (2011). Physician agency and payment for primary medical care. In S. Glied andP. C. Smith (Eds.), The Oxford Handbook of Health Economics, pp. 602–623. Oxford UniversityPress.
McLeod, L. (2011). A nonparametric vs. latent class model of general practitioner utilization:Evidence from canada. Journal of Health Economics 30 (6), 1261–1279.
Primary Care Initiative (2014). Details of primary care networks (PCNs).https://www.albertapci.ca/AboutPCNs/PCNsInAlberta/Pages/ProvincialPCNDetails.aspx,Last accessed: March 1, 2014.
Statistics Canada (2014). Alberta, focus on geography series, 2011 Cen-sus. http://www12.statcan.gc.ca/census-recensement/2011/as-sa/fogs-spg/Facts-pr-eng.cfm?Lang=eng&GC=48, Last accessed: March 1, 2014.
Van Herck, P., D. De Smedt, L. Annemans, R. Remmen, M. B. Rosenthal, and W. Sermeus (2010).Systematic review: E↵ects, design choices, and context of pay-for-performance in health care.BMC Health Services Research 10 (1), 247.
21

A1 Alberta Health Services Zone Map
1,186,121
Alberta
447,740
453,469
1,408,606
289,661
3,785,597
Population(2011)
Zone
Source: Alberta Health Services (2011).
22