Changing industry dynamics - Philips · Changing industry dynamics ... Pioneer, Toshiba,...
25
Changing industry dynamics Rudy Provoost Senior Vice President Royal Philips Electronics CEO Global Sales and Services Philips Consumer Electronics
Transcript of Changing industry dynamics - Philips · Changing industry dynamics ... Pioneer, Toshiba,...

Changing industry dynamics
Rudy ProvoostSenior Vice President Royal Philips Electronics CEO Global Sales and Services Philips Consumer Electronics

2
Changing industry dynamics
• Trends• Threats• Opportunities

3
Changing industry dynamics
• Trends– Convergence – Content revolution– Globalisation
• Threats• Opportunities

4
Digital versus analogue segments* (in billion €), world excl. Japan
As CE markets become digital…
0
50
100
2000 2003 2006
Source: Philips CE World Market Forecast 2003* Philips served segments. Excluding: camcorder, still picture camera, game console, PDA, home PC, PC peripherals
Digital Analogue
in b
illion
€

5
Telecom PC/IT
Gaming CE
…multiple industries are converging
Telecom PC/IT
Gaming CE
6
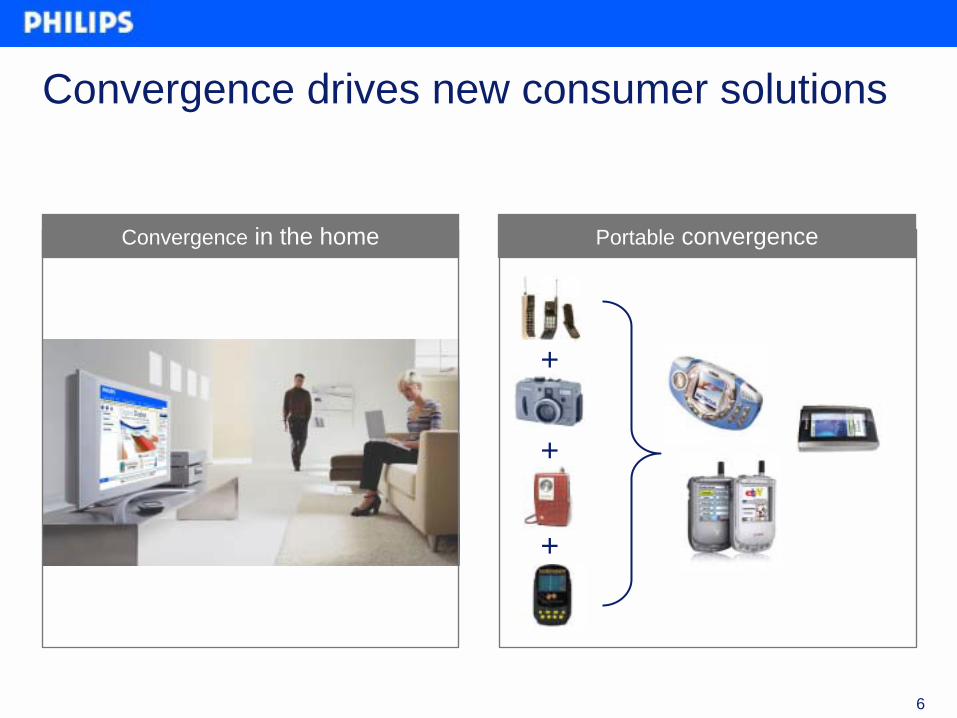
Convergence drives new consumer solutions
+
+
+
Convergence in the home Portable convergence
7
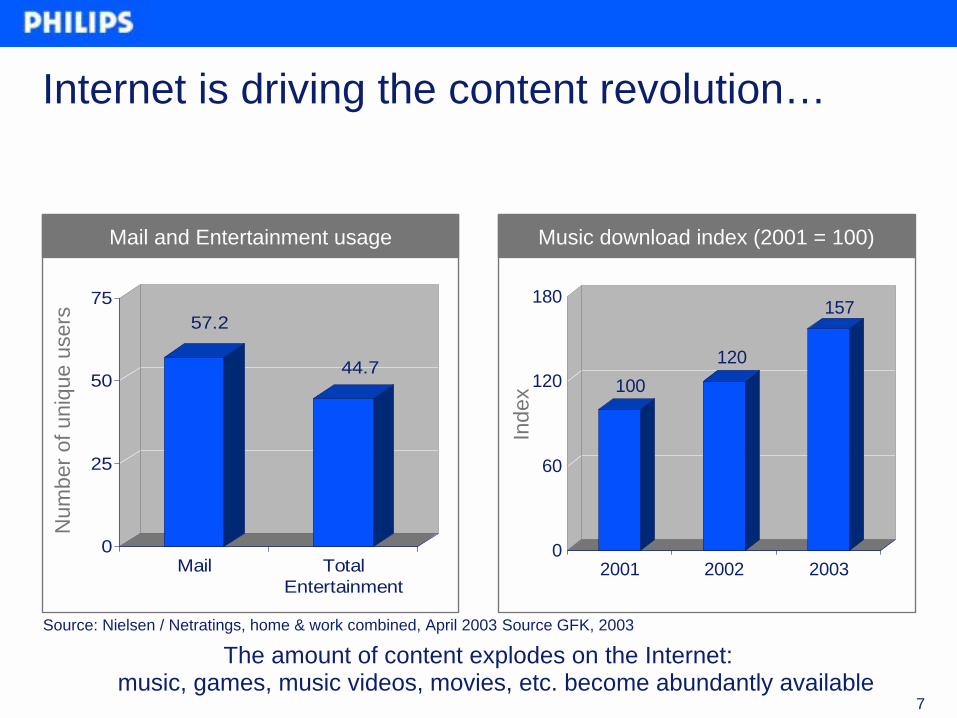
Internet is driving the content revolution…
The amount of content explodes on the Internet: music, games, music videos, movies, etc. become abundantly available
100120
157
0
60
120
180
2001 2002 2003
57.2
44.7
0
25
50
75
Mail TotalEntertainment
Num
ber o
f uni
que
user
s
Inde
x
Source: Nielsen / Netratings, home & work combined, April 2003 Source GFK, 2003
Mail and Entertainment usage Music download index (2001 = 100)

8
CAGR ‘03-’07: 246%
… supported by strong growth in broadband penetration and home networking
Source: Yankee Group, base: all Households, June 2003 Source: IDC, March 2003
0
10
20
30
40
50
2002 2003 2004 2005 2006 2007
Broa
dban
d pe
netra
tion
In m
illion
Hou
seho
lds
South KoreaJapanNetherlands
USAUnited KingdomItaly
China Entertainment networksMultimedia networksPC networks
Broadband penetration in selected countries 2002-2007 US Home networking (in million HH)
CAGR ‘03-’07: 77%CAGR ‘03-’07: 19%
0%
20%
40%
60%
80%
2002 2003 2004 2005 2006 2007

9
Hybrid product-service offerings are emerging
Home Entertainment(products and services)
e.g. • Enjoy music • Excited by playing games• Share a movie
All appliancese.g. Game, PC
and CE equipment
TV / AV* e.g. TV and Audio equipment
10
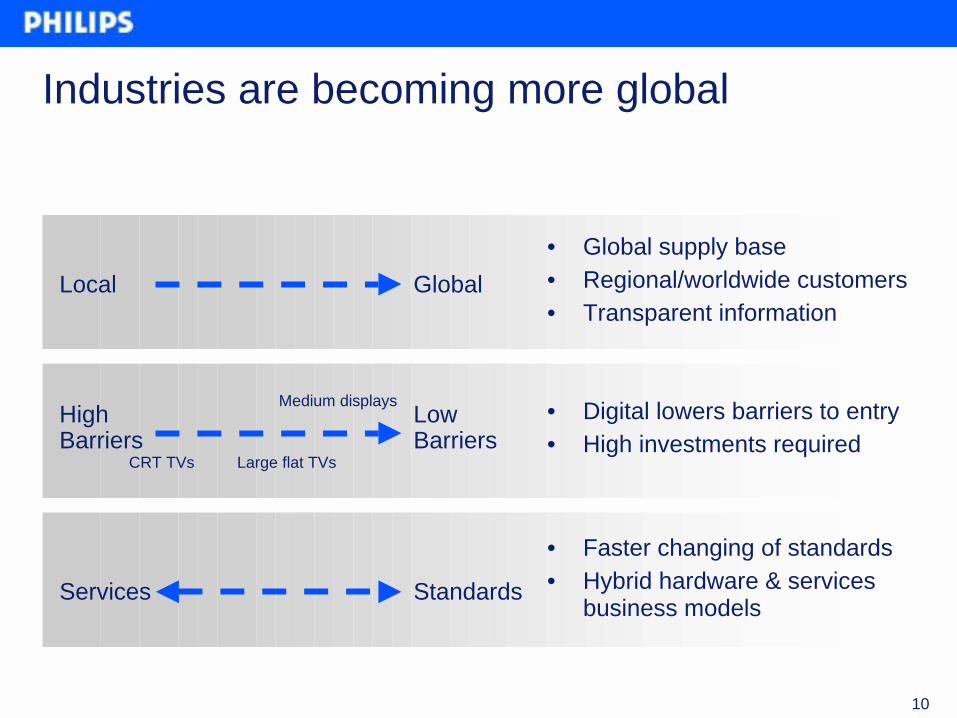
Industries are becoming more global
CRT TVs
Medium displays
Large flat TVs
HighBarriers
Low Barriers
• Digital lowers barriers to entry• High investments required
StandardsServices
• Faster changing of standards• Hybrid hardware & services
business models
Local Global• Global supply base• Regional/worldwide customers• Transparent information

11
International retailers leverage their global presence
0 1 2 3 4 5
Market Share LossesDecline Of National / Local Products
Need For New Layers / RolesFaster Private Label Development
Need For New SkillsNeed For Sophisticated Systems
Downwards Alignment Of Consumer PricesStrategic Vulnerability
Downwards Alignment Of Trade TermsIncreased Retailer 'Muscle'
Challenge Low Challenge High
Source: McKinsey survey of leading FMCG suppliers
Challenges for leading FMCG suppliers

12
Tariffs, duties and trade barriers are still significant
• WTO talks promised tariff cuts/better market access from 2004. Failure at Cancun means delay until ~2005/6
• Europe and USA still willing to lower import duties on CE in exchange for better market access elsewhere.
• Emphasis might shift to sectoral, bilateral or regional trade agreements.
• As tariff barriers fall, standards and non-tariff barriers increase in importance
• Technological convergence blurs distinction between CE (4-30% tariffs) and IT (0% tariffs) products. Planned new system for 2007 of classification
• Chinese competitors become global players

13
Changing industry dynamics
• Trends• Threats
– Increasing retail power– Changing competitive
landscape– Short product lifecycles
and commoditisation• Opportunities
14
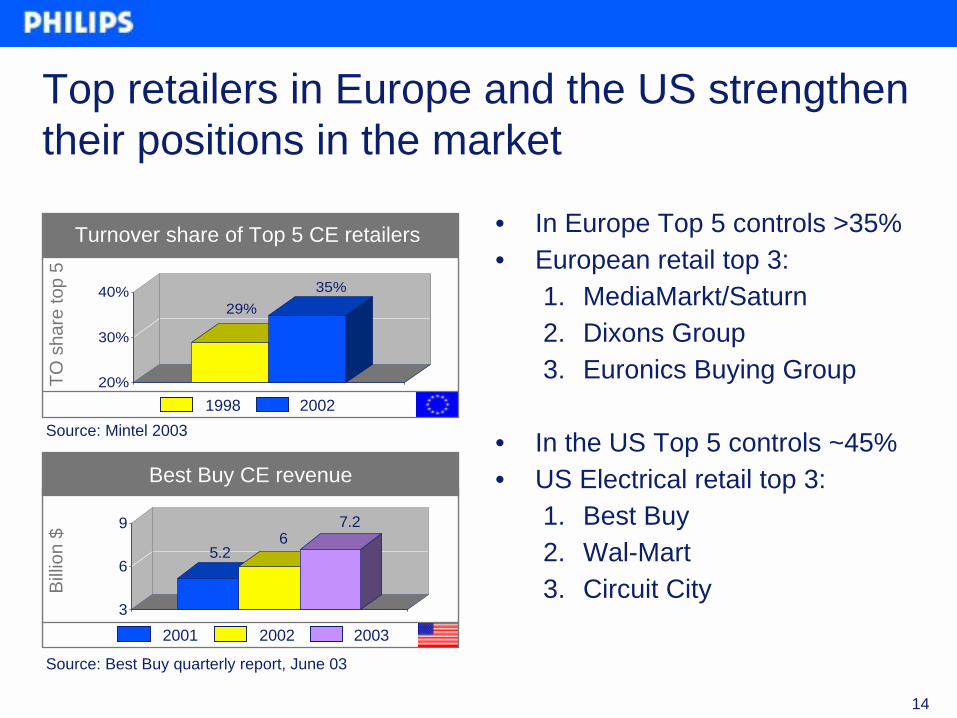
29%35%
20%
30%
40%
Top retailers in Europe and the US strengthen their positions in the market
• In Europe Top 5 controls >35%• European retail top 3:
1. MediaMarkt/Saturn2. Dixons Group3. Euronics Buying Group
• In the US Top 5 controls ~45%• US Electrical retail top 3:
1. Best Buy2. Wal-Mart3. Circuit City
Turnover share of Top 5 CE retailers
Source: Mintel 2003
Best Buy CE revenue
Source: Best Buy quarterly report, June 03
Billio
n $
TO s
hare
top
5
1998 2002
2002 20032001
5.26
7.2
3
6
9

15
Retail power of mass merchants increases due to combination of growth and concentration
Both in Europe and the US, mass merchants realise the fastest growth
Source: GFK, July 2003 Source: NPD Intelect, July 2003, excluding Wal Mart
50
100
150
200
2000 2001 200250
100
150
200
2000 2001 2002
Independents Buying groupsMass MerchantChains
Inde
x
Electronic superstore A/V specialtyMass Merchant
Inde
x
CE growth per retail contact Europe 2000 = 100, cumulative
CE growth per retail contact USA 2000 = 100, cumulative

16
0%
20%
40%
60%
80%
100%
Jan'01
May Sep Jan'02
May Sep Jan'03
May
New entrants change the competitive landscape
Source: GFK, July 2003Established brands (global) are: Philips, Sony, Panasonic, Thomson, JVC, Samsung, Pioneer, Toshiba, Goldstar/LG, Grundig, Toshiba, Aiwa, Kenwood, HitachiC-Brands are: all other brands sold in CE retail
0
30
60
90
1999 2000 2001 2002 2003 2004E
EstablishedKorea
TaiwanesePC
Chinese“Established brands” “C-Brands”
Num
ber
Perc
enta
ge
Source: Philips amalgamation based on annual reports, industry studies and press releases 1998-2003
Number of competitors in CE worldwide ‘99-’04E* DVD player unit sales in Germany (units)
17
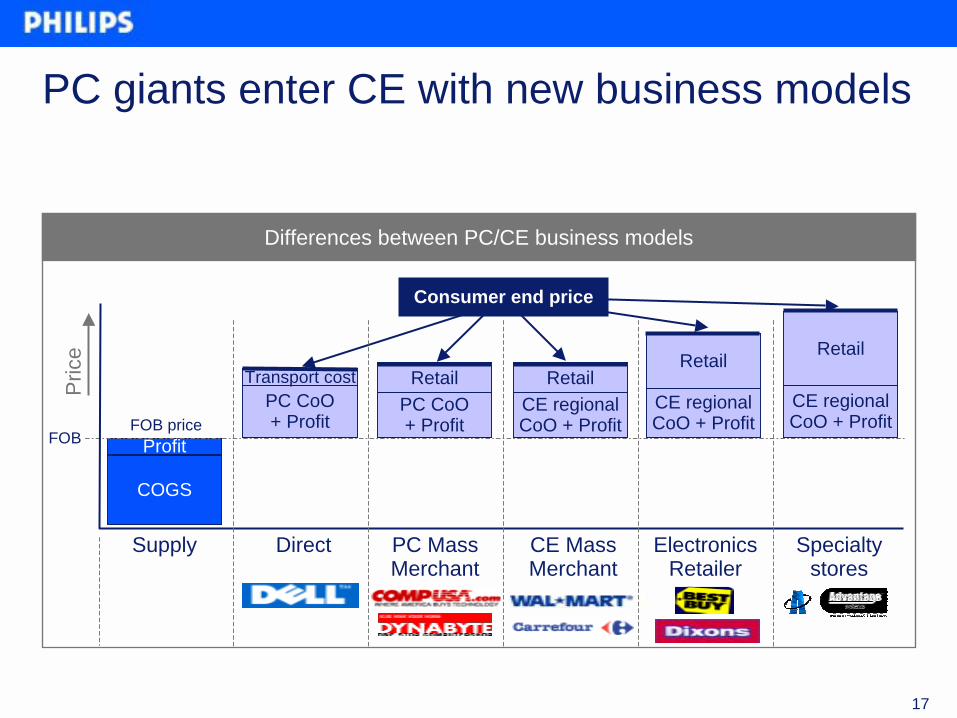
PC CoO+ Profit
Transport cost
Direct PC Mass Merchant
PC CoO+ Profit
RetailCE regionalCoO + Profit
Retail
CE Mass Merchant
CE regionalCoO + Profit
Specialtystores
Retail
PC giants enter CE with new business models
Differences between PC/CE business models
Pric
e
COGS
ProfitFOB price
Supply
CE regionalCoO + Profit
Retail
ElectronicsRetailer
Consumer end price
FOB

18
0
10
20
30
40
50
60
1 2 3 4 5 6 7 8 9 10Years after introduction
Mar
ket i
n m
illion
qua
ntiti
esThe pace of new product adoption is increasing…
Source: Philips CE World Market Forecast 2003 and Philips Semiconductor DVD Recorder Market Forecast
DVD Recorder (PH SC) DVD Player (1997) VCR (1971)
Faster adoption of new products

19
0
20
40
60
80
100
120
1975 1985 1995 2005
Mar
ket i
n m
illion
qua
ntiti
es… while lifecycles are shortening significantly
DVD PlayerVCR
Shorter life cycles – world quantities
Source: Philips CE World Market Forecast 2003

20
Changing industry dynamics
• Trends• Threats• Opportunities
– Growth markets– Value added
partnerships– lifecycle management

21
Focus on growth markets
34
1112
3132
4143
0 20 40
Source: Philips CE World Market Forecast 2003 * Broadband household penetration excluding Latin America and Africa
Net
val
ue
-9
-11
-26
-30 -20 -10 0
CRT monitorsAudio Systems & sep.CRT TV
FlatTVDVD-RecorderPersonal Infotainment
Set Top BoxesPDA / OrganiserDigital CamcorderDigital Still Camera
Broadband penetration*
Worldwide growth segments in net value(CAGR: 2003-2006)
Worldwide mature segments in net value (CAGR: 2003-2006)
Net
val
ue

22
Differentiate through value-added partnerships
0 1 2 3 4 5
Harmonised Consumer Pricing PoliciesTrade Terms Aligned Across Borders
Shares Systems With RetailersHarmonised Global Trade Terms SystemSignigificant Presence In All Key Markets
Tailored Responses For Selected PartnersHighly Qualified Multinational Managers
Full Internal Transparency Of Cost To ServeCategory Management Skills
Strong KAM SkillsStrong European / Global Brands
Retailer’s view ofoverall importance
Retailer’s perception of manufacturer’s performance
Retailer’s view of importance and perception of manufacturer’s performance
Source: McKinsey survey of leading FMCG suppliers

23
Create value through IP and market positions
Value shift in analogue and digital era
High value
Low valueBrandDistributionServices
Set makersAssembly
Analogue
Digital
Create valuetechnologyleadership /
licenses
Create valueeffective
go-to market
Intellectual PropertyChips and softwareProcess technology

24
Conclusions
• The CE environment is very dynamic:– converging industries, a content revolution and globalisation
• Threats:– Increasing retail power, a changing competitive landscape,
shortening product lifecycles and commoditisation
• Opportunities– Focus on growth markets, differentiation through value-
added partnerships and appropriately phased lifecycle management