Changes in the coastal ecosystem of the Cape Verde Archipelago over the period 1981 to 2000: a...
18
Changes in the coastal ecosystem of the Cape Verde Archipelago over the period 1981 to 2000: a simulation model using Ecosim. K.A. Stobberup 1 , V. M. Ramos 2 , and M.L. Coelho 1 1: IPIMAR - Instituto de Investigação das Pescas e do Mar, Portugal 2: INDP - Instituto Nacional de Desenvolvimento das Pescas, Cape Verde Presented at the Symposium on “Marine fisheries, ecosystems, and societies in West Africa: half a century of change”, 24-28 June 2002, Dakar, Senegal.
-
date post
21-Dec-2015 -
Category
Documents
-
view
214 -
download
0
Transcript of Changes in the coastal ecosystem of the Cape Verde Archipelago over the period 1981 to 2000: a...

Changes in the coastal ecosystem of the Cape Verde Archipelago over the
period 1981 to 2000:
a simulation model using Ecosim.
K.A. Stobberup1, V. M. Ramos2, and M.L. Coelho1
1: IPIMAR - Instituto de Investigação das Pescas e do Mar, Portugal2: INDP - Instituto Nacional de Desenvolvimento das Pescas, Cape
Verde
Presented at the Symposium on “Marine fisheries, ecosystems, and societies in West Africa: half a century of change”, 24-28 June 2002, Dakar,
Senegal.

Part 1: Ecosystem characteristics and time series data for Ecopath models
Part 2: Model comparison and simulation results

Geographic location

Mean SST Cape Verde April-May 1997-30°
-30°
-28°
-28°
-26°
-26°
-24°
-24°
-22°
-22°
-20°
-20°
-18°
-18°
-16°
-16°
-14°
-14°
12° 1
2°
14° 1
4°
16° 1
6°
18° 1
8°
20° 2
0°
SST (Degrees C)Land< 101112131415161718192021222324252627282930> 30No Data
Ocean depth (meter)10 - 5051 - 100101 - 500501 - 100020003000
Mean SST Cape Verde September-December 1997-30°
-30°
-28°
-28°
-26°
-26°
-24°
-24°
-22°
-22°
-20°
-20°
-18°
-18°
-16°
-16°
-14°
-14°
12° 1
2°
14° 1
4°
16° 1
6°
18° 1
8°
20° 2
0°
SST (Degrees C)Land< 101112131415161718192021222324252627282930> 30No Data
Ocean depth (meter)10 - 5051 - 100101 - 500501 - 100020003000
Oceanographic conditions
Stronger influence from the Canary Current in the windy season from December to May.
Northeasterly winds and colder sea surface water temperatures.
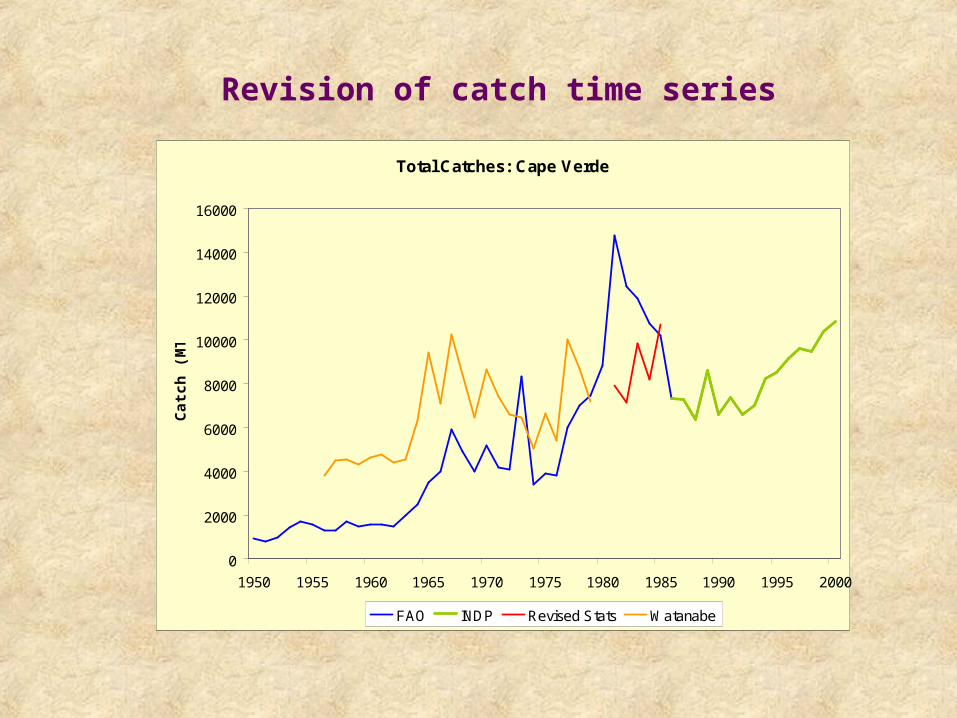
Revision of catch time series
Total Catches: Cape Verde
0
2000
4000
6000
8000
10000
12000
14000
16000
1950 1955 1960 1965 1970 1975 1980 1985 1990 1995 2000
Ca
tch
(M
T)
FAO INDP Revised Stats Watanabe
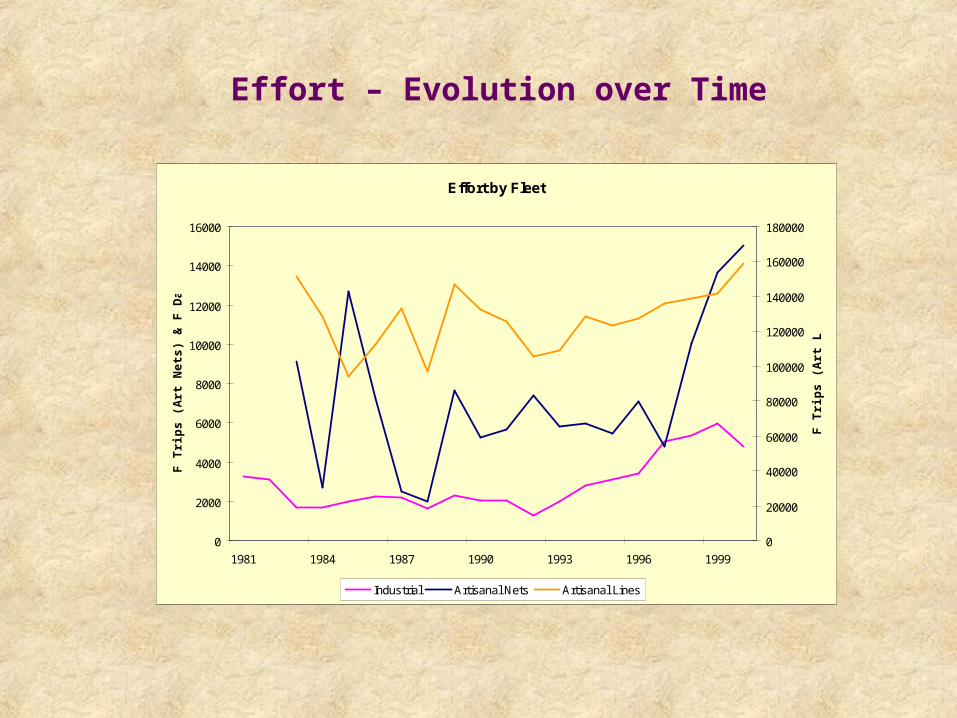
Effort by Fleet
0
2000
4000
6000
8000
10000
12000
14000
16000
1981 1984 1987 1990 1993 1996 1999
F T
rip
s (A
rt N
ets)
& F
Day
s (I
nd
)
0
20000
40000
60000
80000
100000
120000
140000
160000
180000
F T
rip
s (A
rt L
ines
)
Industrial Artisanal Nets Artisanal Lines
Effort – Evolution over Time

0
1,000,000
2,000,000
3,000,000
4,000,000
5,000,000
6,000,000
1986 1989 1992 1995 1998
Ca
tch
(k
g)
Large tuna Pelagic predators Small pelagics Small tuna
Pelagic Catches – Evolution over Time

0
100,000
200,000
300,000
400,000
500,000
600,000
1986 1989 1992 1995 1998
Cat
ch (
kg)
Demersal fish Demersal predators Jacks Sparids
Other important catches

The first preliminary model for the period 1981-1985 (published in the context of SIAP) had several weak points that had to be dealt with:
• Statistics available for the 1981-1985 period were in need of revision in order to assess correctly the impact of fishing on the system.
• Difficulty in delimiting the system and problems in handling the oceanic, migratory groups (e.g. tuna).
• The model “fed heavily on” the Opitz (1993) model for the Caribbean coral reef ecosystem in terms of definition of functional groups and their corresponding diets.
Developments
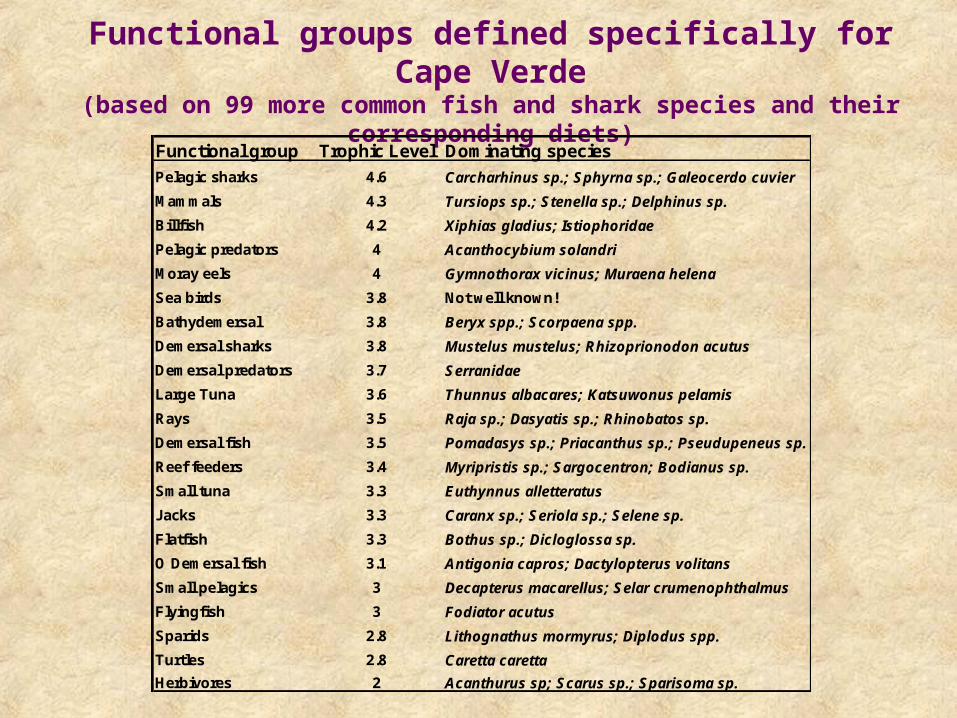
Functional groups defined specifically for Cape Verde
(based on 99 more common fish and shark species and their corresponding diets)
Functional group Trophic Level Dominating species
Pelagic sharks 4.6 Carcharhinus sp.; Sphyrna sp.; Galeocerdo cuvier
Mammals 4.3 Tursiops sp.; Stenella sp.; Delphinus sp.
Billfish 4.2 Xiphias gladius; Istiophoridae
Pelagic predators 4 Acanthocybium solandri
Moray eels 4 Gymnothorax vicinus; Muraena helena
Sea birds 3.8 Not well known!
Bathydemersal 3.8 Beryx spp.; Scorpaena spp.
Demersal sharks 3.8 Mustelus mustelus; Rhizoprionodon acutus
Demersal predators 3.7 Serranidae
Large Tuna 3.6 Thunnus albacares; Katsuwonus pelamis
Rays 3.5 Raja sp.; Dasyatis sp.; Rhinobatos sp.
Demersal fish 3.5 Pomadasys sp.; Priacanthus sp.; Pseudupeneus sp.
Reef feeders 3.4 Myripristis sp.; Sargocentron; Bodianus sp.
Small tuna 3.3 Euthynnus alletteratus
Jacks 3.3 Caranx sp.; Seriola sp.; Selene sp.
Flatfish 3.3 Bothus sp.; Dicloglossa sp.
O Demersal fish 3.1 Antigonia capros; Dactylopterus volitans
Small pelagics 3 Decapterus macarellus; Selar crumenophthalmus
Flyingfish 3 Fodiator acutus
Sparids 2.8 Lithognathus mormyrus; Diplodus spp.
Turtles 2.8 Caretta caretta
Herbivores 2 Acanthurus sp; Scarus sp.; Sparisoma sp.
Part 2: Model comparison and simulation results

1. Construct Ecopath models for two time periods; 1981 - 1985 and 1994 - 1997.
2. Compare models and determine whether important changes have taken place.
3. Simulate (Ecosim) from the first period to the second and determine what are the possible causes of these changes.
4. Compare the model for the 1994 - 1998 period with simulation results.
5. Given the limited data available, consider whether the simulation model fits the observed trends.
Steps undertaken
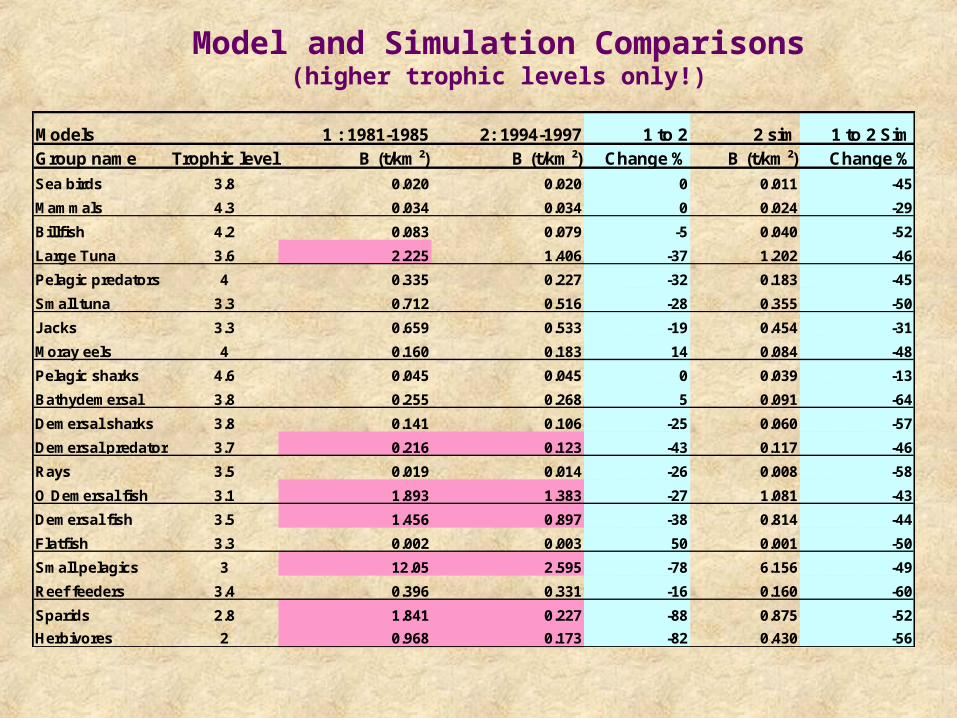
Model and Simulation Comparisons
(higher trophic levels only!)Models 1 : 1981-1985 2: 1994-1997 1 to 2 2 sim 1 to 2 Sim
Group name Trophic level B (t/km²) B (t/km²) Change % B (t/km²) Change %
Sea birds 3.8 0.020 0.020 0 0.011 -45
Mammals 4.3 0.034 0.034 0 0.024 -29
Billfish 4.2 0.083 0.079 -5 0.040 -52
Large Tuna 3.6 2.225 1.406 -37 1.202 -46
Pelagic predators 4 0.335 0.227 -32 0.183 -45
Small tuna 3.3 0.712 0.516 -28 0.355 -50
Jacks 3.3 0.659 0.533 -19 0.454 -31
Moray eels 4 0.160 0.183 14 0.084 -48
Pelagic sharks 4.6 0.045 0.045 0 0.039 -13
Bathydemersal 3.8 0.255 0.268 5 0.091 -64
Demersal sharks 3.8 0.141 0.106 -25 0.060 -57
Demersal predators 3.7 0.216 0.123 -43 0.117 -46
Rays 3.5 0.019 0.014 -26 0.008 -58
O Demersal fish 3.1 1.893 1.383 -27 1.081 -43
Demersal fish 3.5 1.456 0.897 -38 0.814 -44
Flatfish 3.3 0.002 0.003 50 0.001 -50
Small pelagics 3 12.05 2.595 -78 6.156 -49
Reef feeders 3.4 0.396 0.331 -16 0.160 -60
Sparids 2.8 1.841 0.227 -88 0.875 -52
Herbivores 2 0.968 0.173 -82 0.430 -56

Fishing Mortalities estimated for the two time periods
Period 1981 to 1985 Period 1994 to 1997Group Name F estimate F estimateLarge Tuna 0.374 0.351Pelagic predators 0.589 0.494Small tuna 0.024 0.043Jacks 0.052 0.058Bathydemersal 0.043 0.026Demersal sharks 0.014 0.028Demersal predators 0.403 0.392O Demersal fish 0.003 0.029Demersal fish 0.019 0.066Small pelagics 0.035 0.287Reef feeders 0.015 0.021Sparids 0.009 0.093Herbivores 0.007 0.064

Fitting to time series: biomass or CPUE
The fitting process in Ecosim minimizes the SS in relation to absolute or relative biomass.
But biomass estimates always consisted in one point only over a 15 year period.
Thus, the fitting process included the catch time series (fitting by eye!) as well as the available information on absolute and relative biomass.

In order to simulate a general decrease in biomass a decreasing trend in
primary productivity was necessary
Forcing function applied to Primary Producers

Considering the limited data available, Ecosim proved to be a useful tool for time series fitting, but also to identify problems in the base model (e.g. parameters, diet).
The coastal ecosystem of Cape Verde can not be regarded as a closed ecosystem. In order to sustain the system, it is necessary to include the import of food for tuna, in particular.
Changes have occurred over the period under study, seen as a general decrease in biomass.
This change can not be attributed to the effects of fishing and it appears to be a result of a “regime shift” in terms of productivity (consistent with Klyashtorin 1998 – ACI index) causing a consistent decrease overall.
The Small Pelagics group plays a key role in the coastal ecosystem and our findings appear to support the theory of a tropical wasp-waist ecosystem, particularly for the pelagic component.
Given the physical forcing on the system, Ecosim should be used with extreme care as a management tool in Cape Verde.
Conclusions

Small Tuna
Pelagic predators
Demersal predators
Sparids
Large tuna
Jacks
Small pelagics
Demersal fish
An excercise on effects of increasing
fishing effort
Small tuna
Catch Catch End/Start
(t/km2) (Start - 1985) (End - 2015) (factor)
Artisanal Lines 0.76 0.71 0.93
Artisanal Nets 0.33 0.73 2.20
Industrial 0.55 0.61 1.11
Total 1.64 2.04 1.25