Dr. habil. Karen Ziener Alpen-Adria-Universität Klagenfurt 28.11./29.11.2012
ORIGINAL ARTICLE
Changes in land use in South Africa between 1961 and 2006:an integrated socio-ecological analysis based on the humanappropriation of net primary production framework
Maria Niedertscheider • Simone Gingrich •
Karl-Heinz Erb
Received: 18 May 2011 / Accepted: 17 January 2012 / Published online: 5 February 2012
� The Author(s) 2012. This article is published with open access at Springerlink.com
Abstract The interrelation between land-use change and
socioeconomic changes is complex and highly dynamic.
We here present an assessment of the human appropriation
of net primary production (HANPP) in Republic of South
Africa (RSA) between 1961 and 2006. HANPP is an
integrated socio-ecological accounting framework that
traces changes in ecosystems resulting from anthropogenic
activities (harvest and land conversions) and allows to
study ecological, social and economic driving forces and
constraints of long-term land-use changes. We use South
Africa, with its history of the rise and collapse of the
Apartheid regime, as an example for an analysis of HANPP
trajectories in the background of major governance shifts,
and base our analysis on the best available statistical
datasets, specific analyses and model results. Surprisingly,
land cover as well as HANPP in the RSA remained rela-
tively constant between 1961 and 2006, with HANPP
values oscillating between 21 and 25% and of the potential
NPP. However, through our analysis of the components of
HANPP and their interrelations, striking turning points
throughout the last five decades become evident. This
allows us to discern three distinct periods, each of the
phases characterized by distinct HANPP trajectories.
Throughout the entire period, a trend of decoupling of
HANPP from population growth could be achieved through
considerable gains in land-use efficiency. The HANPP
analysis reveals that this prevailing trend of increasing
land-use efficiency, based on technological improvements
and biomass trade, came to a halt in the ‘crisis’ phase and
immediately recovered afterwards.
Keywords HANPP � South Africa � NPP � Land use �Biomass extraction � Agricultural change � Biomass flows
Introduction
Land-use change and socioeconomic change are intrinsi-
cally interlinked. By using the land, societies alter eco-
logical structures and processes in order to optimize the
provision of goods and services by ecosystems. The
resulting changes in ecosystems require adequate social
responses, such as altered management schemes, in order
to warrant the continuous provision of services and to
avoid detrimental ecological effects. This interplay
between socioeconomic drivers, pressures, changes in
ecological states and impacts is highly dynamic and com-
plex (Liu et al. 2007; Turner et al. 2007; Liverman and
Cuesta 2008) and motivated scholars to call for integrated,
interdisciplinary perspectives for studying the various
aspects of the land system and their change over time
(Rindfuss et al. 2004; GLP 2005; Turner et al. 2007).
Empirical information on the complex interactions and
feedbacks driving the land system is essential to improve
the understanding of trajectories and the underlying
mechanisms and constraints of changes in the land system,
as well as their relation to sustainable development
(Ostrom et al. 2007). As sustainability problems relate to
problems of society–nature interactions (Haberl et al.
2004a), accounting systems are required that allow to
Electronic supplementary material The online version of thisarticle (doi:10.1007/s10113-012-0285-6) contains supplementarymaterial, which is available to authorized users.
M. Niedertscheider (&) � S. Gingrich � K.-H. Erb
Institute of Social Ecology,
Alpen-Adria Universitaet,
Schottenfeldgasse 29,
1070 Vienna, Austria
e-mail: [email protected]
123
Reg Environ Change (2012) 12:715–727
DOI 10.1007/s10113-012-0285-6

consistently observe, quantify and monitor interactions
between societies and their natural environment. Many
such indicator systems have been proposed, focussing on
the quantification and evaluation of the interplay between
socioeconomic management, ecosystem services or the
associated social or ecological impacts, for example on
biodiversity (see, e.g. Haberl et al. 2004b; GLP 2005;
Millennium Ecosystem Assessment 2005; Hak and al
2007).
In this context, the indicator framework Human
Appropriation of Net Primary Production (HANPP;
Vitousek et al. 1986; Wright 1990; Erb et al. 2007,
2009b; Haberl et al. 2007) received some attention as a
biophysical indicator of strong sustainability (Martinez-
Alier 1998, 1999; Krausmann et al. 2004; Foley et al.
2007; Erb et al. 2009b). HANPP focuses on a key vari-
able of the coupled socio-ecological system: the annual
flow of biomass, which is a central parameter for eco-
system functioning (Lindeman 1942) as well as an
essential resource of socioeconomic systems, providing
the basis of food and feed (Ayres 2007), and representing
a key component of the global socioeconomic energy
system (Smil 2005).
HANPP quantifies and integrates the effects of two
interlinked processes in one account (Fig. 1): (a) Modifi-
cations of NPP due to land conversions, for example by
converting forested ecosystems into arable land. This
component of HANPP is denoted as DNPPlc (change in
NPP resulting from land conversion) and is calculated as
the difference between the NPP of potential vegetation
(Tuxen 1956) and the NPP of the currently prevailing
vegetation (NPPact). (b) The amount of biomass extracted
or destroyed by human activities, for example through
biomass harvest or grazing of livestock, denoted as NPPh.
Thus, HANPP is a metric for human-induced changes in
the yearly availability of trophic energy in the ecosystems
and can be used as an indicator of land-use intensity
(Haberl 1997; Haberl et al. 2007). HANPP analyses allow
to integrate socioeconomic (harvest of biomass and col-
lateral flows) and ecological perspectives (changes in
energy availability in ecosystems) and allow to assess the
scope of human action or the scale of the human domi-
nation of ecosystems (Vitousek 1997).
However, the concept of HANPP alone is not sufficient
for analysing the complex and manifold changes and tra-
jectories in socio-ecological systems, as it only focuses on
a limited amount of variables and is centred around the
question of ‘domestic extraction’, that is the domestic use
of ecosystems, which does not allow to straightforwardly
link land-use changes to for example consumption of bio-
mass products, a major driver of land-use change (Erb et al.
2009a; Krausmann et al. 2009b). Nevertheless, HANPP
focuses on a key variable of both ecological and socio-
economic systems that renders it a useful starting point of
socio-ecological analyses (Krausmann et al. 2009a).
This study applies the HANPP concept as a means for
empirically analysing land system change in the back-
ground of the socio-economic and political environment of
South Africa from 1961 to 2005. We aim at providing a
socio-ecological analysis of the mechanisms and con-
straints underlying land system change. In this context, we
use the HANPP framework as a starting point and com-
plement this analysis with information and data on the
changes in other, non-HANPP-related aspects of the South
African socio-ecological system. By integrating an empir-
ical HANPP assessment with socio-economic and political
information, we aim to outline an integrated perception of
the trajectories in the socio-ecological system that allows
us to gain insights into patterns and drivers of land system
change in this country.
The Republic of South Africa (RSA) is particularly
suited as an exemplary case study, because it is charac-
terized by a well-known, complex political history: The
period between 1961 and 2006 encompasses globally
ongoing trends such as agricultural modernization (De
Klerk 1984) and increasing embeddedness in global mar-
kets. Moreover, in the last 45 years, South Africa has
undergone a steep growth of its population, which tripled
during this period (FAO 2010). It also underwent a severe
economic and social crisis during the Apartheid regime,
which ended in political collapse and resulted in demo-
cratic re-organizations after 1990 (Von Maltitz and Scholes
1995; Attridge and Jolly 1998; Kirsten et al. 2007; Cou-
libaly 2009).
At the same time, almost all of the South African
ecosystems have been exposed to human land use. Almost
the entire landscape can be considered as grazed by
Fig. 1 Definition of HANPP. HANPP is defined the sum of land-use-
induced NPP changes (DNPPlc) and human harvest (NPPh), or as the
difference between potential NPP (NPP0) and the amount of NPP that
remains in ecosystems after human harvest (NPPt)
716 M. Niedertscheider et al.
123

domestic livestock, and large areas of highly productive
grasslands have been transformed into cropland, which,
together with unsustainable land-use practices places
pressure on the intactness of the prevalent savannah
ecosystems (Von Maltitz and Scholes 1995). All this
renders the RSA an interesting case for empirically
studying the interrelations between land-use change and
socioeconomic change.
Materials and methods
For the assessment of HANPP in a decadal time series, we
here follow the definition proposed by Haberl et al. (2007)
and Erb et al. (2009b). In this definition, HANPP is cal-
culated as the sum of harvested biomass (NPPh) plus the
amount of biomass appropriated through alterations in
productivity due to anthropogenic land use (DNPPlc; see
Fig. 1). As data availability is limited, we here only cal-
culate and model above-ground fractions of HANPP. In
consequence, we denote our results with the prefix ‘a’ (e.g.
aHANPP, aNPP0, etc.).
We collected additional datasets for the socio-ecological
analysis, comprising information on population growth,
international trade of agricultural and forestry products, the
degree of agricultural intensification and modernization
(e.g. fertilizer inputs and agricultural yields) and GDP
development. For all these variables, time series from 1961
to 2006 were compiled by making use of the FAO statis-
tical database (2010) and the world development indicator
database (World Bank 2010).
The empirical part of this study relies on data sets that
have been compiled for the entire country at yearly inter-
vals from 1961 to 2006. Data sets on land cover/land use,
biomass harvest (aNPPh), potential net primary productiv-
ity (aNPP0), productivity changes due to human interven-
tion (DaNPPlc) and actually prevailing net primary
productivity (aNPPact) were established in order to assess
HANPP. Primary data are based on national and interna-
tional statistical records (including data on land use and
crop harvest), as well as on the output of the dynamic
vegetation model LPJ (Sitch et al. 2003; Bondeau et al.
2007; Haberl et al. 2007) for the assessment of the aNPP of
potential vegetation. Many data were assessed on the
grounds of both, country-specific primary data and generic
data or assumptions, such as crop-straw ratios, feed
demand of livestock, or pre-harvest loss factors. The yearly
biomass flows were assessed in tons of carbon per year
(tC/year), assuming a fraction of 50% carbon in dry bio-
mass. The different components of the data set are shortly
described below, detailed information on data sources and
methods used are presented in the electronic supplementary
material (ESM).
Land cover/land use
Yearly data on land cover/land use are a key requirement
for HANPP time series assessments. Unfortunately,
detailed information on land-cover/land-use change in the
RSA is not readily available. Therefore, a mixed approach
was chosen, combining the use of primary data and with
modelling assumptions. First, a consistent set of 13 land-
use/land-cover classes was established which differ in
terms of their typical NPP. These classes can be aggregated
to five land-use types (Table 1).
Harvest (aNPPh)
In our definition, biomass harvest on cultivated areas
consists of the total above-ground biomass of annual crops
(which includes primary crop harvest, recovered and
unrecovered crop residues), permanent crops (e.g. primary
crop harvest and annual increment) and grazed biomass on
fallow land. Data for these items were extracted from the
datasets for cultivated land quoted in Table 1. A detailed
documentation of methods and data sources is available in
the electronic supplementary material (ESM).
No statistics exist for the amount of annually grazed
biomass. Thus, grazed biomass was calculated as the dif-
ference between feed demand and feed supply on an annual
basis (Krausmann et al. 2008). Feed demand was calcu-
lated as a function of animal produce, and market feed
supply was derived from statistics. The amount of non-
market feed was calculated by subtraction (‘grazing gap’).
For the HANPP calculation, the amount of grazing was
then assigned to different land-use/land-cover categories
following the allocation in Table 1, assuming that the share
of grazing consumed on different land-use/land-cover
classes depends on the extent and the potential of above-
ground biomass production of these categories. Assump-
tions on grazing potential of landscapes most severely
affected by grazing could be made through the grazing-
capacity map (Agriculture Research Council–Institute for
Soil Agriculture Maps of South Africa) and spatially
explicit data on livestock densities (FAO 2007).
Harvest in forestry was calculated as the sum of wood
removals reported in the national statistics and felling
losses; the latter was assessed by applying wood-specific
recovery rates (see ESM). Roundwood is assumed to be
extracted from closed forests only.
In contrast, harvest of fuelwood can almost exclusively
be assigned to open forests and thicket and bushland. No
annual statistics on the amount of fuelwood extraction are
available for the RSA, and different assumptions can be
found in the literate (Gandar 1983; Banks et al. 1996; DME
1996; Williams and Shackleton 2002). In line with
Changes in land use in South Africa between 1961 and 2006 717
123

Williams and Shackleton (2002), we applied a constant per
person demand of 0.12 tC/cap/year to calculate fuelwood
demand for the whole period.
Harvest on settlement areas, for example through gar-
dening work and park or infrastructure maintenance, was
assumed to be 50% of aNPPact of these areas (Haberl et al.
2007).
The amount of above-ground biomass appropriated
through human-induced fires would represent a further
aNPPh category (Lauk and Erb 2009), but was not included
in the assessment, due to a lack of data and contradictory
notions in the literature: human activities might have
resulted in increases (spread of clearing fires) or decreases
(fire prevention) of biomass flows related to human-induced
vegetation fires (Erb et al. 2009b; Lauk and Erb 2009).
Ecosystem productivity (aNPP0, aNPPact and DaNPPlc)
Data on the time series of potential above-ground net pri-
mary production (aNPP0) were taken from unpublished
material of the global HANPP study for the year 2000
(Haberl et al. 2007). These data are based on a model
output of the Lund-Potsdam-Jena Dynamic Global Vege-
tation Model (LPJ-DGVM; (Sitch et al. 2003) with an
improved representation of hydrology (Gerten et al. 2004),
using 100-year climate time series as input variables. For
the aNPP0 time series, we calculated 5-year averages for
each time step in order to eliminate fluctuations in the
dataset. For further details on the land-use/land-cover-
specific picture of NPP0, see the ESM.
The amount of NPP in the actually prevailing vegetation
(aNPPact) was calculated the following way. For cropland,
the total above-ground NPP was calculated by applying an
expansion factor (of 1.33) to the NPPh data in order to
calculate the amount of pre-harvest losses (e.g. losses due
to herbivory). ANPPact of settlement areas was assumed to
be one-third of aNPP0. ANPPact of fallow cropland, closed
forests and unused/unproductive land was assumed to be
identical to aNPP0 (i.e. DNPPlc was assumed to be zero on
these land-use types; Haberl et al. 2007).
A particularly relevant component of DaNPPlc are NPP
reductions losses due to soil degradation (Zika and Erb
2009). Soil degradation in South Africa is controversially
discussed. Several studies consider land degradation a
substantial factor for the decline in productivity in South
African ecosystems (Hoffman and Ashwell 1999; Bai and
Dent 2007). Other authors confirm that human land use,
such as overgrazing, plays a crucial role in putting pressure
on the intactness of ecosystems, but simultaneously no
major decrease in ecosystem functions could be detected in
the past for several study sites mapped as degraded
(Wessels et al. 2004; Palmer and Ainslie 2007). Older
accounts of soil degradation assert South Africa to be
severely affected (Oldeman 1988), assumptions that have
meanwhile been revised (JRC 2003). The NLC 1995
(Fairbanks et al. 2000) provides information on the extent
of degraded areas per land-cover type. Degraded areas are
defined as areas suffering from severe vegetation cover and
productivity loss compared to their surrounding areas
(Fairbanks et al. 2000). On the basis of a study on soil
degradation in drylands using this information (Zika and
Erb 2009), we assume that areas suffering from severe
degradation (degree 3 and 4) experience a mean produc-
tivity loss of 56% of aNPP0. We thus apply a DaNPPlc level
of 56% of the original aNPP0 for areas mapped as degraded
in the NLC 1995. Unfortunately, no datasets or appropriate
methods are available that would allow to infer the
Table 1 Land-use and land-
cover classes with their main
sources occurring in this study
Land-use class Land-cover category Sources
Cultivated land Fallow land Own calculations
Annual cropland STATSA, Daff
Permanent cropland FAO, Daff, authors’ calculations
Settlement area Settlement area FAO, NLC 1995, authors’
calculations
Forest land Closed forests STATSA, Daff
Open forests NLC 1995
Grazing land Grassland NLC 1995
Shrub cover NLC 1995, authors’ calculations
Sparse herbaceous and sparse shrub
cover
NLC 1995, GLC 2000
Low fynbos NLC 1995, Acocks (1953)
Undefined grazing land Authors’ calculations
Thicket and bushland NLC 1995
Unused/unproductive
land
Unused/unproductive land (Erb et al. 2007), authors’
calculations
718 M. Niedertscheider et al.
123

dynamics of soil degradation-induced NPP losses appro-
priately in a 45-year time series, neither on the changes in
extent nor on changes in the degree of degradation. Thus,
in our approximation, we consider degradation-induced
DaNPPlc/m2 on all land classes used for grazing and on
open forests (which are also subjected to human-induced
degradation; Fairbanks et al. 2000) constant over the whole
period under investigation. As a result, it is important to
note that the effect of soil degradation in the RSA remains
only roughly addressed in this HANPP study.
Data integration
In a next step, we integrate the findings of the HANPP
assessment with information on socio-economic develop-
ments, such as political shifts, population growth, GDP and
trade developments recorded for the RSA in the investi-
gated time span. We develop a socio-ecological time line
that covers the whole period under investigation and allows
to identify interrelations between different developments in
the socio-ecological system of South Africa.
Results
HANPP
Figure 2 illustrates changes in land use and land cover in
the RSA between 1961 and 2006. Throughout the entire
time period, land not used for forestry, for cultivation, for
settlement, and land not identified as unused/unproductive
dominated the land surface, making up between 72 and
76% of total land area. This land bears ecosystems like
savannahs, semi-deserts and grasslands, and most of this
land is used for grazing, although sometimes very exten-
sively (Erb et al. 2007; therefore, we denoted it grazing
land). Cultivated land was the second most important land-
use category, followed by forest land. Unused/unproduc-
tive land and settlement areas were of minor importance in
terms of land-use extent.
Cropland expansion and decline, the spread of settle-
ment areas and the spread of forest plantations had the
strongest effects on land-use/land-cover change in South
Africa in the observed period. However, the relatively
small share of these land-use types (around 12% in most
years), as well as the low rates of change, resulted in rel-
atively stable land-cover conditions throughout the time
period. In 1988, the sum of settlement areas, cultivated land
and forest plantations peaked at almost 16% of the total
land area, mainly due to expanding cropland. Grassland
was the land-cover class that exhibited the most pro-
nounced changes. In the period from 1961 to 1988, grass-
land areas declined from 270,000 to 250,000 km2, mainly
due to the expansion of cultivated areas. Due to a decrease
in cultivated areas from 1988 onwards, grassland reached
the initial level of 1961 again in recent years, with values
around 270,000 km2. All other land-cover classes only
show slight changes in area extent.
Figure 3 displays the development of the different
HANPP components over time, the three components
aNPPt, DaNPPlc and aNPPh summing up to aNPP0.
According to the results of the LPJ global dynamic vege-
tation model, total aNPP0 (the potential above-ground net
primary productivity) shows a pronounced dynamic over
the investigated time period. It declined from 304 to 288
million tons carbon per year (MtC/year) over the entire
period between 1961 and 2006, with a decrease in the first
decade, a steep increase until the year 2000, and a decline
afterwards. In the year 2000, aNPP0 peaked at 379 MtC/
year. This high value can be attributed to unusual high
precipitation on large areas of Northern and Eastern South
Africa, which boosted productivity of many ecosystems.
This period was followed by a much drier period (Laing
1994; Dyson and Van Heerden 2001; Alexander 2002;
Rouault and Richard 2005) that resulted in a steady decline
Fig. 2 Land-cover/land-use change in South Africa from 1961 to
2006
Fig. 3 HANPP trajectories 1961–2006, breakdown to main compo-
nents. aHANPP as percentage of aNPP0 (solid black line) is drawn
against the secondary axis
Changes in land use in South Africa between 1961 and 2006 719
123
in aNPP0 after 2000. However, as the HANPP approach we
follow here is optimized in assessing differences between
aNPP0 and single HANPP components, this data uncer-
tainty of NPP0 is to a large extent cancelled out in the
aHANPP assessment. As a result, aNPPt closely follows the
aNPP0 trend, and HANPP, expressed in % of NPP0, does
not show this particular pattern.
The development of aNPPh and DaNPPlc was not very
pronounced over the last four decades, it remained at levels
of around 41–53 mio tC/year (around 15% of aNPP0) and
20–32 mio tC/year (around 10% of aNPP0), respectively.
In consequences, aHANPP fluctuated between 21 and 25%
over the whole period under investigation, with a minimum
around the year 2000, which is a result of extraordinarily
high productivity levels in this year.
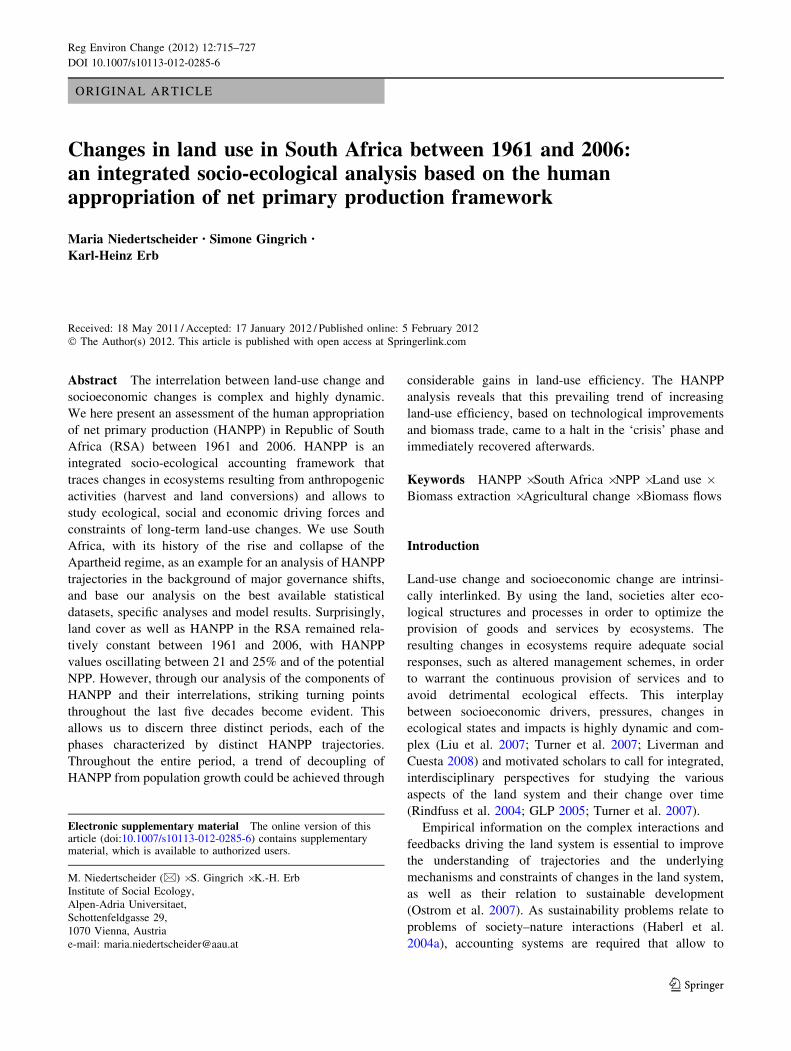
Biomass extraction through anthropogenic harvest
(aNPPh) rose by 28% between 1961 and 2006, from around
40 mio tC/year to more than 51 mio tC/year (Fig. 4a). A
peak of 46 mio tC/year was observed in 1978, which was
the result of above average production on cultivated land.
Harvest on cultivated land contributes the lion’s share to
total harvest; it increased continuously from 15 mio
tC/year in 1961 to around 27 mio tC/year (41% of total
aNPPh) in 1978 with a decline until 1984 and a slight rise
afterwards. Due to a smaller share of crop residues, market
feed and non-market feed (fodder crops) to total feed
supply, the amount of grazed biomass was higher in the
1960s, compared to the following decades. Declining
amounts of grazed biomass per year can also be interpreted
as the result of rising commercialisation and modernisation
of the livestock industry, associated with gains in input–
output efficiency. From the mid-1980s onwards, grazing
increased again. Harvest on forest land increased from
around 4 MtC/year in 1961 to around 10 MtC/year in 2006.
Harvest per square metre of cultivated land increased
from 130 gC/m2/year in 1961 to around 210 MtC/year at the
end of the investigated time period (Fig. 4b). A peak of
200 gC/m2/year was observed in 1979, followed by a drastic
decline afterwards. Harvest per m2 of forest land continu-
ously rose from 60 gC/m2/year in 1961 to around 140 gC/
m2/year in 1997 and slightly declined afterwards (Fig. 4b).
Dynamics of grazing land are much smaller, with values
remaining between 13 and 21 gC/m2/year. Harvest on set-
tlement areas continuously rose from 30 to 34 gC/m2/year.
Much more pronounced was the development of
DaNPPlc in the period of regard (Fig. 4c). Values declined
from 31 to 22 mio tC/year in the period from 1961 to 1978
and afterwards rose again to its highest level of 33 mio tC/
year in 1984. After 2000, a steep characterizes the devel-
opment of DaNPPlc. Cultivated land accounted for most of
the temporal trends of DaNPPlc, both due to fluctuations in
annual crop yields and land-use change. DaNPPlc values on
cultivated land were around 16 MtC/year in the early 1960s
and dropped to around 8 MtC/year in 1979, reached a
maximum of 18 MtC/year in the early 1980s and reached a
minimum in 1994 with 3 MtC/year at the end of the
investigated time period. DaNPPlc on grazing and forest
land is attributed only to land degradation and is fairly
constant at 11 and 2 MtC/year, respectively. DaNPPlc on
settlement area increased fourfold, from around 1 to 4 MtC/
Fig. 4 Development of
aHANPP components between
1961 and 2005, break down to
land-use types. a aNPPh in
mio tC/year, b aNPPh in gC/m2/
year, c aDNPPlc in mio tC/year,
d aDNPPlc in gC/m2/year
720 M. Niedertscheider et al.
123

year, but plays a minor role. This land-use class, however,
shows the highest values of DaNPPlc per land unit (Fig. 4d)
(between 280 and 370 gC/m2/year), closely following the
aNPP0 dynamics (Fig. 3: HANPP trajectories 1961–2006,
breakdown to main components.). DaNPPlc/m2/year fluc-
tuates between 125 and 28 gC/m2/year, with a steep decline
after 1998. As noted in the method section, DaNPPlc/m2 due
to soil degradation (accounted for in the various categories
of grazing land forest land) was assumed to be constant.
Therefore, forest land and grazing land remained at steady
levels of around 20 and 12 gC/m2/year respectively
throughout the whole period under investigation.
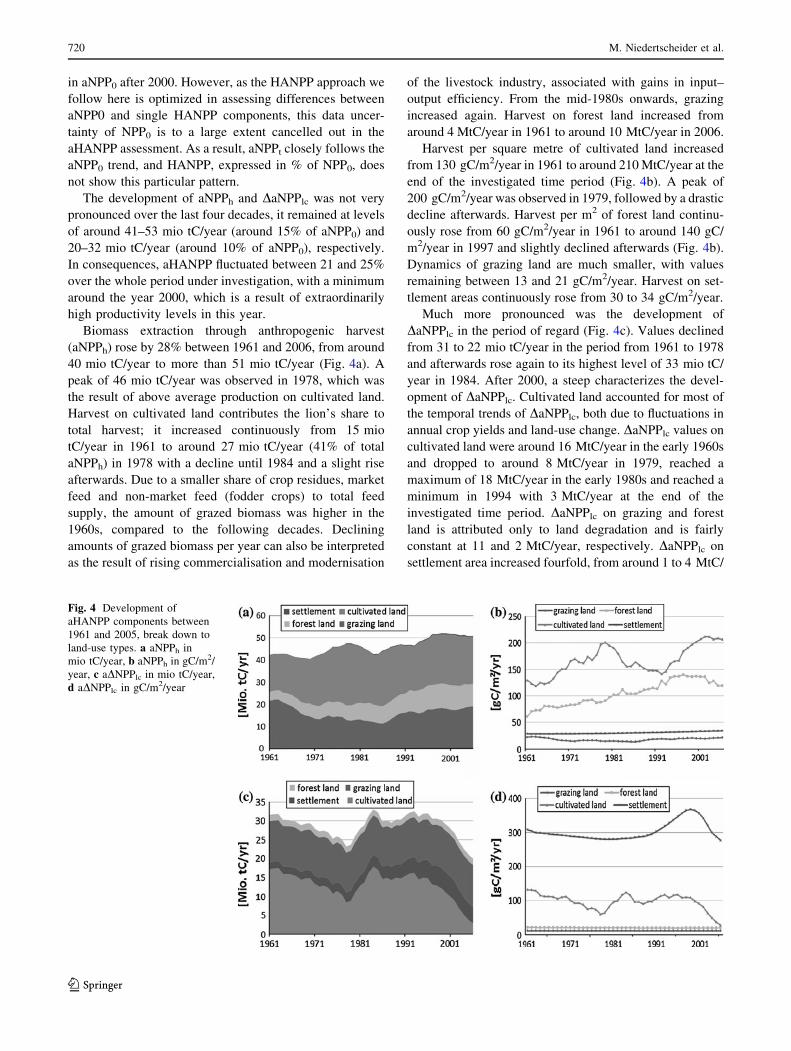
Socio-ecological analysis
Scrutinizing the patterns of HANPP, three different phases
of development can be distinguished. These phases appear
to be well in line with major periods of socioeconomic and
political development in the RSA. We define these periods
in their chronological order as ‘Green Revolution’,
‘economic and political crisis’ and ‘democratic opening’.
Figure presents a synoptic view on the developments of
various socio-ecological parameters. This allows for
studying the incidence of shifts of aHANPP and its
parameters with socio-economic developments and mile-
stones. All the findings discussed below have to be con-
sidered in the light of an enormous increase of societal
biomass demand, driven by an almost threefold population
growth from 18 to 49 million people in the observed time
period (FAO 2010).
Green revolution
The first ‘Green Revolution’ period between 1961 and
1980 was characterized by growth of agricultural produc-
tivity, due to fast modernization of cultivation practices.
State subsidies on the cultivation of land (Kirsten et al.
2007) allowed for an expansion of cultivated land into
marginal areas and for increasing agricultural output per
unit of cropped area (FAO 2005). This led to an increasing
share of biomass harvest (aNPPh) to total aHANPP and a
simultaneous decrease in the share of DaNPPlc, resulting in
a moderate rise in land-use efficiency until 1978 (Fig. 5a).
The rise in average crop yields (Fig. 5c) can be attributed
to the accelerating intensity of agricultural land use.
Annual fluctuations in crop yields can be attributed to
climatic variability as well (Rouault and Richard 2005).
Consumption of fertilizers per land unit (Fig. 5c) was about
five times higher in the late 1970s than in 1961. The use of
agricultural machinery increased considerably, thus
replacing draft animals for agricultural purposes to a large
extent (not displayed in the figure). In the late 1960s, the
introduction of combined harvesters triggered a decrease in
demand for agricultural labour and thus reduced the
number of farm employees from the mid 1970s onwards
(Kirsten et al. 2007).
In this phase of agricultural and economic growth, the
nutritional situation of the South African population
improved significantly (not shown). Kcal/cap/day intake of
vegetable and animal products increased from 2,800 to
3,000 kcal in the mid 1970s (own calculations; FAO 2010,
Fig. 5b), accompanied with a transition towards more
protein- and fat-based alimentation (Bourne et al. 2002).
The major economic positions of the Apartheid regime,
economic independency and antitrade strategy, were
pursued by a complex system of import substitution and
export taxation (Kirsten et al. 2007). During the 1960 and
1970s, South Africa was an exporting country of forestry
and agricultural biomass, while imports remained at very
low levels (Fig. 5d). Annual GDP growth rates, extremely
high at the beginning of the period, started to decline
from the early 1970s onwards and by 1976, the economy
moved into a state of recession with annual growth rates
below 1 per cent (Kirsten et al. 2007). In this period, the
share of agriculture to GDP declined from 12% in 1961
to 6% in 1978 (Fig. 5c), values that can be found in
countries of the Industrial world, indicating a period of
strong agricultural modernization and the development of
off-farm employment.
Political and economic crisis
In 1980, the period of agricultural growth was brought to
an immediate halt, and a period of instability and complex
fluctuations followed until 1995 (Fig. 5). ANPPh decreased
after a peak in 1978 and simultaneously, DaNPPlc
increased, resulting in a considerable drop of land-use
efficiency in 1984, back to the levels of the early 1960s
(Fig. 5a). This reduction of land-use efficiency was, how-
ever, not associated with a reduction in the use of means of
production. In contrast, a peak in mineral fertilizer con-
sumption was accompanied with shrinking cropland yields
(Fig. 5c). Biomass imports started to increase in this per-
iod, and for two points in time (1982 and 1992), the RSA
turned into a net import country of biomass (Fig. 5d). This
can be interpreted as the combined effect of the steep
population increase from 29 to 40 million people within
this period (Fig. 5b), and the disability of the RSA to
maintain self-sufficiency at times of the two extreme
drought events of 1982 and 1992 (Laing 1994; Rouault and
Richard 2005). In this phase, kcal intake per person
remained at around 3,000 kcal/cap/day (own calculations;
FAO 2010; Fig. 5b).
The political crisis in the period from 1979 until 1994
(the year of the official end of Apartheid), characterised by
a slow-down in economic performance (Fig. 5e),
Changes in land use in South Africa between 1961 and 2006 721
123
Fig. 5 Time line for main trajectories of aHANPP, population, trade of biomass, climatic extreme events and governance implementations
722 M. Niedertscheider et al.
123

experienced a stagnation of agricultural development
which is reflected by a rise in DaNPPc and a decrease in
land-use efficiency. It is argued in the literature (Kirsten
et al. 2007) that the combination of agricultural state sup-
port and the high costs of the distortive price system of
Apartheid made the agricultural sector inflexible and vul-
nerable, in particular from the 1980s onwards. After a peak
of state support in the early 1980s, subsidies on agricultural
production started to decline rapidly, as the government
was no longer able to maintain the high expenditures for
overregulation of the agricultural price system (Kirsten
et al. 2007). The reduction of governmental subsidies, the
removal of the rebate on diesel (Simbi and Aliber 2000), as
well as decelerated effects of the oil embargo (Levy 1999),
boosted agricultural production costs for farmers and
reduced agricultural performance. This is well illustrated
by the reduction in agricultural performance (Fig. 5c;
reduction of fertilizer consumption and agricultural yields
after 1981), as well as by the decrease of the area under
cultivation, which began in the early 1990s (see Fig. 2).
The share of grazing to total aHANPP increased in the
crisis period; this may be attributed to a declined avail-
ability of crop residues for animal feed which was com-
pensated by grazing (Fig. 4).
The slowdown of agricultural performance coincided
with the onset of international sanctions against the
Apartheid regime. South Africa’s international offside
position and domestic political unrest (Ndlovu 1998; Levy
1999; Kirsten et al. 2007) made it an unappealing country
for foreign investment (Lundahl 1984). Economic perfor-
mance slowed down considerably and GDP growth drop-
ped to below zero in 1982. The South African debt crisis in
1985 (Michie and Padayachee 1998; Habib and Padaya-
chee 2000) contributed to the collapse of the economic and
political system in the late 1980s and to the democratic
transition, starting in the early 1990s.
Democratic opening
Rising international pressure (Coulibaly 2009), resistance
movements within the country and the economic catastro-
phe finally led to the ‘democratic opening’ in the early
1990s. The first democratic elections were overwhelmingly
won by the ANC (African National Congress) in 1994.
Immediately afterwards, South Africa re-entered the global
market and joined the World Trade Union. The ANC
committed to a neo-liberal growth strategy with new leg-
islations on privatisation and liberalisation of the financial
and trade sector as part of the GEAR strategy (Habib and
Padayachee 2000).
Analysing the development of HANPP and its compo-
nents reveals that this period is characterized by resuming
trajectories that prevailed in the ‘green revolution’ phase
and characterize the development of land use also in other
parts of the world, for example the UK, Spain, Austria
(Krausmann et al. 2004; Schwarzlmuller 2009; Musel
2009). A similar trajectory is described for Hungary, a
country that also experienced the collapse of the economic
and governance structures during the collapse of the
planned economy of the socialist period (Kohlheb and
Krausmann 2009). From the mid 1990s onwards, agricul-
tural production intensified again, inputs of mineral fertil-
izers as well as agricultural output per unit of cropped land
increased again (Fig. 5c). This relaxation of the economic
and political crisis was accompanied with increases in GDP
growth that reached a level of 3% in 1995 (e). Harvest, in
particular on cropland, increased, accompanied by declin-
ing DaNPPlc, leading to increasing land-use efficiency
(Fig. 5a).
However, the continuously rising demand for agricul-
tural products within the country, as a result of the popu-
lation increases to around 49 million people in 2006
(Fig. 5b) by far, outgrew the only slightly increasing har-
vest levels on cropland. Thus, after a slight decline in the
first years of the post-Apartheid era, imports of biomass
further increase, reaching levels in 2006 around 14 times as
high as in 1961 (Fig. 5c). The Biomass exports accelerated
as well, in particular of the forestry sector. Also kcal intake
per person and year started to increase again shortly after
the democratic opening and reached 3,300 kcal/cap/day in
the year 2006 (own calculations; FAO 2010; Fig. 5b).
The agricultural sector could not fully recover from the
crisis phase: the area under crop production continued to
decline further until 2006 (Fig. 2). A reason for this can be
found in the still prevailing price distortions caused by the
complex trade system of Apartheid, and the insufficient
programs that aimed at redistributing land and supporting
rural development (Kirsten et al. 2007; Herault and Thur-
low 2009). Furthermore, the removal of state supports on
agricultural production still remained an obstacle for the
development of a sufficient small holder sector (Lahiff and
Cousins 2005). New labour legislations increased the costs
of agricultural employment and thus triggered a drastic
decline of the number of regular farm employees after 1990
(Sparrow et al. 2008).
Regardless of the phases of development, per capita
values of aHANPP steadily declined, from 4.1 tons of
Carbon per capita and year in 1961 to 1.5 tC/cap/year in
2006. This steep decrease by 60% (Fig. 5b) can be attrib-
uted to the relatively constant level of aHANPP compared
to steep population growth from 18 to 49 millions of people
between 1961 and 2006. Apparently, South Africa fol-
lowed a different trajectory than the Philippines, where
similar rates of population growth lead to steep increases of
HANPP, deforestation, and triggered surges in land-use
efficiency (Kastner 2009). However, the South African
Changes in land use in South Africa between 1961 and 2006 723
123

HANPP assets do not necessarily indicate that human
impacts on South African ecosystems were low and did not
change over the last decades, for the HANPP approach
does not allow for analysing changes of biophysical con-
ditions (e.g. ecosystem functions and biodiversity) in
detail.
Discussion
Between 1961 and 2006, humans appropriated around
21–25% of the potential above-ground biomass produc-
tivity in South African ecosystems, which equals a value
between 72 and 83 MtC/year. This result is low compared
to the global average of 29% in the year 2000, calculated
by Haberl et al. (2007) for above-ground NPP, and par-
ticularly low when compared to European, and especially
Western European countries: average Western European
aHANPP values are around 46.5%, and for Spain, a
country also bearing dryland ecosystems, aHANPP level of
61% are found (Schwarzlmuller 2009).
DaNPPlc values in the RSA are found to be between 7
and 11% of total aNPP0 and are thus well in line with the
global average of 5.2%. Compared with 24% in Spain,
however, the South African DaNPPlc level seems rather
low.
We can, however, not completely rule out an underes-
timation of total biomass appropriation in this study,
because we strictly followed a conservative approach in the
light of the many data uncertainties and thus could not
assess the effects of land degradation and human-induced
fires as precisely as desired. The availability of quantitative
degradation data is probably better in South Africa than in
other parts of the world (Zika and Erb 2009); however, the
lack of inter-comparable historic data on degradation lim-
ited our ability to trace back DaNPPlc on grazing areas.
Nevertheless, it can be concluded that the overall trends of
aHANPP will not severely be affected by this underesti-
mation: The contribution of DaNPPlc to HANPP on graz-
ing lands remains moderate throughout the time period
(14% of total aHANPP in 2000, the year with the best data
availability), and the probable data uncertainties are thus
unlikely to significantly alter the observed overall trends.
Hence, we are confident that the conclusions we can draw
out of the results for the socio-ecological analysis pre-
sented here are still reliable, and the trends and patterns of
change we discerned can provide a pivotal contribution to
the land system science.
In addition, data availability did not allow for tracing
back biomass flows related to human-induced fires, and
there is no empirical information available that would even
allow to determine whether this biomass flow increased or
decreased with population growth and agricultural
development (Erb et al. 2009b). This aspect of land use
represents an important subject for further research in order
to improve our understanding of this global sustainability
challenge (Verstraete et al. 2009).
Although aHANPP as percentage of aNPP0 does not
show noticeable fluctuations over time, but was rather low
and stagnant, this does not serve as evidence for negligible
changes in the land system of the RSA. In contrast,
aHANPP trajectories show some striking turning points
during the last decades. These patterns become evident
when calculating proportional changes of related HANPP
parameters. In particular, the ratio of NPPh to DaNPPlc,
which can be interpreted as an efficiency measure of land
use (Erb et al. 2009b), shows a remarkable pattern and
significant fluctuations during the period under investiga-
tion. The trend in land-use efficiency is a stringent indi-
cator for the state of the land system, which in the South
African case was influenced chiefly by the political and
economic circumstances in the past four decades. The
growth in land-use efficiency in the ‘Green Revolution’
period was disrupted abruptly with the onset of the politi-
cal and economic crisis of Apartheid. However, after
the democratic opening, patterns of land system change
exhibited similarities to the former growth period, and
land-use efficiency experienced a historic increase by 66%
from 1994 to 2005. This was mainly a result of declining
DaNPPlc levels and rising harvest per m2 on cropland
through increased fertilizer application (Fig. 5c).
The stagnant aHANPP trend compared to the drastic
surges in population and thus biomass demand is only to
a small extent based on a dislocation of environmental
pressures to other, distant locations of the world. Biomass
imports indeed increased throughout the whole period under
investigation, thus relocating aHANPP to other countries.
In particular, meat imports, which imply huge embodied
HANPP flows in the exporting countries (Erb et al. 2009a;
Haberl et al. 2009), drastically accelerated until 2006 (not
shown), thus reducing environmental pressure due to meat
production within the country boarders. However, trade
involves only modest flows compared to overall NPPh, and
thus these ‘problem-shifting’ effects of trade only can
provide a partial explanation. Analysing the effects of
biomass trade on aHANPP in the RSA in detail is beyond
the scope of this paper, but the empirical results call for
methodologies that are able to consistently grasp this aspect
of global land-use change (Erb et al. 2009a; Haberl et al.
2009; Kastner et al. 2011). Neither can a ‘pauperization’,
that is a decreasing provision with nutritional energy, be
held responsible for this steep reduction in per capita
aHANPP, as caloric intake per capita is even increasing in
the period of regard (Bourne et al. 2002) (with a stagnation
only in the collapse phase). This all pinpoints to increases of
land use and conversion efficiencies as a major driver of the
724 M. Niedertscheider et al.
123

‘decoupling’ between HANPP, population growth and
biomass consumption in the RSA.
In order to assess the impact of human land use on South
African ecosystems more precisely, the findings presented
here could be considerably enriched by further research on
the interrelations between our HANPP findings and the rich
body of empirical research regarding natural conservation
issues that has already been conducted for South Africa
(Rouget et al. 2003; Scholes and Biggs 2005; VanJaarsveld
et al. 2005).
Conclusion
The consistent and stringent framework of the HANPP
assessments, when consistently combined with socio-eco-
nomic information, allows for empirical analyses of the
mutual links between resource systems, the resources they
provide and the socioeconomic system, and so allows
studying drivers and impacts of technological and global
environmental changes. The stringency and consistency of
the HANPP framework allows generating robust insights
into the interlinkages between social and ecological sys-
tems, even in the light of the large uncertainties related to
some of the datasets.
Whereas land-cover changes in the RSA have not been
very pronounced in the last four decades, the HANPP
framework helps to detect subtle changes in the land sys-
tem and provides a tool to link developments in social,
political and economic factors with land system change.
Examinations of the development of land-use efficiency
(i.e. the ratio between overall aHANPP and harvest) viv-
idly illustrate the effects of a political crisis on the land
system. As neither shifts towards dependency on foreign
land resources, nor pauperization holds as an explanation
for the decline in aHANPP per person trend, this entails
that noteworthy increases of biomass use efficiency are the
predominant mechanism underlying this development.
Apparently, large potentials exist to ‘decouple’ the use of
ecosystem services from ecological impacts, for example
by technological improvements. For avoiding rebound
effects, however, strategies that aim at technological
developments have to rely on integrated perspectives,
aimed at optimizing production and consumption systems
at the same time. Integrated indicator frameworks, such as
the HANPP framework, can provide a useful starting point
for such integrated analyses. Combinations of robust
quantitative information with more qualitative information
can so represent a valuable contribution to sustainability
science (Kates et al. 2001; Ostrom 2007).
Acknowledgments Our special thanks go to Helmut Haberl from
the Institute of Social Ecology in Vienna for his supportive help and
useful comments concerning the empirical work as well as the writing
of this paper. Many thanks to Bob Scholes for his hospitality, the
many discussions and insightful comments, to Marna van der Merve,
Sally Archibald, Toni Palmer, Tim Hoffman and Graham von Maltitz
for the help with data and their inputs. This work has benefited from
the Global Land Project (http://www.globallandproject.org), as well
as from research funded by the Austrian Science Fund (project
P20812-G11). Funding from the ERC Project LUISE (263522) is
gratefully acknowledged.
Open Access This article is distributed under the terms of the
Creative Commons Attribution License which permits any use, dis-
tribution, and reproduction in any medium, provided the original
author(s) and the source are credited.
References
Acocks JP (1953) Veld types of South Africa. In: Memoirs of the
Botanical Survey of South Africa 28, p 192
Alexander WJR (2002) Statistical analysis of extreme floods. J S Afr
Inst Civil Eng 44(1):20–25
Attridge D, Jolly RJ (1998) Writing South Africa: literature,
apartheid, and democracy 1970–1995. Cambridge University
Press, Cambridge
Ayres RU (2007) On the practical limits to substitution. Ecol Econ
61:115–128
Bai ZG, Dent DL (2007) Land degradation and improvement in South
Africa 1. Identification by remote sensing. Report 2007/03. I.-W.
S. Information, Wageningen
Banks DI, Griffin NJ et al (1996) Wood supply and demand around
two rural settlements in a semi-arid Savanna, South Africa.
Biomass Bioenergy 11:319–331
Bondeau A, Smith PC et al (2007) Modelling the role of agriculture
for the 20th century global terrestrial carbon balance. Glob
Change Biol 13(3):679–706
Bourne LT, Lambert EV et al (2002) Where does the black population
of South Africa stand on the nutrition transition? Public Health
Nutr 5(1A):157–167
Coulibaly B (2009) Effects of financial autarky and integration: the
case of the South Africa embargo. J Int Money Finance 28:454
De Klerk W (1984) Seasons that will never return: the impact of farm
mechanization on employment, incomes and population distri-
bution in the western transvaal. J South Afr Stud 11(1):84–105
DME (1996) Energy in South Africa. Department of Minerals and
Energy, Pretoria
Dyson LL, Van Heerden J (2001) The heavy rainfall and floods over
the northeastern interior of South Africa during February 2000.
S Afr J Sci 97(3 & 4):80–86
Erb KH, Gaube V et al (2007) A comprehensive global 5 min
resolution land-use data set for the year 2000 consistent with
national census data. J Land Use Sci 2(3):191
Erb K-H, Krausmann F et al (2009a) Embodied HANPP: mapping the
spatial disconnect between global biomass production and
consumption. Ecol Econ 69(2):328–334
Erb KH, Krausmann F et al (2009b) Analyzing the global human
appropriation of net primary production—processes, trajectories,
implications. An introduction. Ecol Econ 69(2):250–259
ESRI map books. Agriculture Maps of South Africa, Grazing
Capacity Map. Map Book Gallery Volume 19. Available at:
http://www.esri.com/mapmuseum/mapbook_gallery/volume19/
agriculture3.html. Downloaded on 12 May 2011
Evans L (1993) Harvest index. Crop evolution, adaption and yield.
L. Evans, Cambridge, pp 238–260
Changes in land use in South Africa between 1961 and 2006 725
123
Fairbanks DHK, Thompson MW et al (2000) The South African land-
cover characteristics database: a synopsis of the landscape. S Afr
J Sci 96:69
FAO (2005) Fertilizer use by crop in South Africa. FAO, Rome
FAO (2007) Gridded livestock of the world 2007. In: Wint GRW,
Robinson T (eds), Rome, Food and Agricultural Organisation of
the United Nations (FAO), p 131
FAO (2010) FAOSTAT 2010, Food and Agriculture Organization of
the United Nations (FAO)
Foley JA, Monfreda C et al (2007) Our share of the planetary pie.
Proc Natl Acad Sci 104(31):12585–12586
Gandar MV (1983) Wood as a source of fuel in South Africa.
Pietermaritzburg
Gerten D, Schaphoff S et al (2004) Terrestrial vegetation and water
balance—hydrological evaluation of a dynamic global vegeta-
tion model. J Hydrol 286:249
GLP (2005) Science plan and implementation strategy. Global Land
Project, Stockholm
Haberl H (1997) Human appropriation of net primary production as
an environmental indicator: implications for sustainable devel-
opment. Ambio 26:143
Haberl H, Fischer-Kowalski M et al (2004a) Progress towards
sustainability? What the conceptual framework of material and
energy flow accounting (MEFA) can offer. Land Use Policy
21:199–213
Haberl H, Wackernagel M et al (2004b) Land use and sustainability
indicators. An introduction. Land Use Policy 21(3):193–198
Haberl H, Erb KH et al (2007) Quantifying and mapping the human
appropriation of net primary production in earth’s terrestrial
ecosystems. PNAS 104(31):12942–12947
Haberl H, Erb K-H et al (2009) Using embodied HANPP to analyze
teleconnections in the global land system: conceptual consider-
ations. Dan J Geogr 109(2):119–130
Habib A, Padayachee V (2000) Economic policy and power relations
in South Africa’s transition to democracy. World Dev
28(2):245–263
Hak T, Moldan B et al (2007) Sustainabiltiy indicators: a scientific
assessment. Island Press, Washington
Herault N, Thurlow J (2009) Agricultural distortions, poverty and
inequality in South Africa. Agricultural distortion working paper
104. World Bank
Hoffman T, Ashwell A (1999) Nature divided: land degradation in
South Africa. Cape Town
JRC (2003) Global land cover 2000 database, European Commission,
Joint Research Centre
Kastner T (2009) Trajectories in human domination of ecosystems:
Human appropriation of net primary production in the Philip-
pines during the 20th century. Ecol Econ 69(2):160–169
Kastner T, Erb K-H et al (2011) International wood trade and forest
change: a global analysis. Glob Environ Change 21(3):947–956
Kates RW, Clark WC et al (2001) Sustainability science. Science
292(5517):641–642
Kirsten J, Edwards L et al (2007) Distortions to agricultural incentives
in South Africa. Agricultural distortion working paper 38. World
Bank
Kohlheb N, Krausmann F (2009) Land use change, biomass
production and HANPP: the case of Hungary 1961–2005. Ecol
Econ 69(2):292–300
Krausmann F, Haberl H et al (2004) Resource flows and land use in
Austria 1950–2000: using the MEFA framework to monitor
society-nature interaction for sustainability. Land Use Policy
21(3):215–230
Krausmann F, Erb KH et al (2008) Global patterns of socioeconomic
biomass flows in the year 2000: a comprehensive assessment of
supply, consumption and constraints. Ecol Econ 65:471
Krausmann F, Haberl H et al (2009a) What determines geographical
patterns of the global human appropriation of net primary
production? J Land Use Sci 4:15–33
Krausmann F, Gingrich S et al (2009b) Growth in global materials
use, GDP and population during the 20th century. Ecol Econ
68(10):2696–2705
Lahiff E, Cousins B (2005) Smallholder agriculture and land reform
in South Africa. IDS Bull 36(2):127–131
Laing MV (1994) Drought monitoring and advisory services in South
Africa. Drought network news (1994–2001), National Drought
Mitigation Center—University of Nebraska, Lincoln
Lauk C, Erb K-H (2009) Biomass consumed in anthropogenic
vegetation fires: Global patterns and processes. Ecol Econ 9
Levy PI (1999) Sanctions on South Africa: what did they do? Am
Econ Rev 89(2):415
Lindeman RL (1942) The trophic-dynamic aspect of ecology.
Ecology 23:399–417
Liu J, Dietz T et al (2007) Complexity of coupled human and natural
systems. Science 317(5844):1513–1516
Liverman DM, Cuesta RMR (2008) Human interactions with the
Earth system: people and pixels revisited. Earth Surf Process
Landf 33(9):1458–1471
Lundahl M (1984) Economic Effects of a trade and investment
Boycott against South Africa. 86(1): 68–83. http://www.jstor.
org/stable/3439404. Accessed 13 Oct 2010
Martinez-Alier J (1998) Ecological economics as human ecology.
Fundacion Cesar Manrique, Madrid
Martinez-Alier J (1999) The socio-ecological embeddedness of
economic activity: the emergence of a transdisciplinary field.
In: Becker E, Jahn T (eds) Sustainability and the social sciences.
Zed Books, London, pp 112–139
Michie J, Padayachee V (1998) Three years after apartheid: growth,
employment and redistribution? Camb J Econ 22(5):623–636
Millennium Ecosystem Assessment (2005) Ecosystems and human
well-being—our human planet. Summary for decision makers.
Washington
Musel A (2009) Human appropriation of net primary production in
the United Kingdom, 1800–2000: changes in society’s impact on
ecological energy flows during the agrarian-industrial transition.
Ecol Econ 69(2):270–281
Ndlovu SM (1998) The Soweto uprisings: counter-memories of June
1976. Ravan Press, Randburg
Oerke EC, Dehne HW et al (1994) Crop production and crop
protection: estimated losses in major food and cash crops.
Elsevier, Amsterdam
Oldeman LR (1988) Guidelines for general assessment of the status of
human-induced soil degradation. ISRIC, Wageningen
Ostrom E (2007) A diagnostic approach for going beyond panaceas.
Proc Natl Acad Sci 104(39):15181–15187
Ostrom E, Janssen MA et al (2007) Going beyond panaceas. Proc Natl
Acad Sci 104(39):15176–15178
Palmer AR, Ainslie A (2007) Using rain-use efficiency to explore
livestock production trends in rangelands in the Transkei, South
Africa. Afr J Range Forage Sci 24(1):43–49
Rindfuss RR, Walsh SJ et al (2004) Developing a science of land
change: challenges and methodological issues. Proc Natl Acad
Sci USA 101(39):13976–13981
Rouault M, Richard Y (2005) Intensity and spatial extent of droughts
in southern Africa. Geophys Res Lett 32(15):L15702
Rouget M, Richardson DM, Cowling RM, Lloyd JW, Lomard AT
(2003) Current patterns of habitat transformation and future
threats to biodiversity in the terrestrial ecosystems of the Cape
Floristic Region, South Africa. Biol Conserv 112(1–2):63–85
Scholes RJ, Biggs R (2005) A biodiversity intactness index. Nature
434(7029):45–49
726 M. Niedertscheider et al.
123

Schwarzlmuller E (2009) Human appropriation of aboveground net
primary production in Spain, 1955–2003: an empirical analysis
of the industrialization of land use. Ecol Econ 69(2):282–291
Simbi T, Aliber M (2000) Agricultural employment crisis in South
Africa
Sitch S, Smith B et al (2003) Evaluation of ecosystem dynamics, plant
geography and terrestrial carbon cycling in the LPJ dynamic
global vegetation model. Glob Change Biol 9:161
Smil V (2005) Energy at the crossroads: global perspectives and
uncertainties. The MIT Press, Massachusetts Institute of
Technology
Sparrow GN, Ortmann GF et al (2008) Determinants of the demand
for regular farm labour in South Africa, 1960–2002. Agrekon
47(1):52–75
Turner BL, Lambin EF et al (2007) The emergence of land change
science for global environmental change and sustainability. Proc
Natl Acad Sci 104(52):20666–20671
Tuxen R (1956) Die heutige potentielle naturliche Vegetation als
Gegenstand der Vegetationskartierung. Angewandte Pflanzensoz-
iologie 13:5–42
VanJaarsveld AS, Biggs R, Scholes RJ, Bohensky E, Reyers B,
Lyman T, Musvoto C, Fabricius C (2005) Measuring conditions
and trends of ecosystem services at multiple scale: the Southern
African Millennium Ecosystem Assessment (SAfMA) experi-
ence. Phil Trans R Soc B 360:425–441
Verstraete MM, Scholes RJ et al (2009) Climate and desertification:
looking at an old problem through new lenses. Front Ecol
Environ 7(8):421–428
Vitousek PM (1997) Human domination of Earth’s ecosystems.
Science 277(5325):494–499
Vitousek PM, Ehrlich PR et al (1986) Human appropriation of the
products of photosynthesis. Bioscience 36:363
Von Maltitz G, Scholes RJ (1995) The burning of fuelwood in South
Africa: when is it sustainable? Environ Monit Assess
38:243–251
Wessels KJ, Prince SD et al (2004) Assessing the effects of human-
induced land degradation in the former homelands of northern
South Africa with a 1 km AVHRR NDVI time-series. Remote
Sens Environ 91:47
Williams A, Shackleton CM (2002) Fuelwood use in South Africa:
where to in the 21st century? S Afr For J 1–8
World Bank (2010) World development indicators, University of
Manchester, ESDS International
Wright DH (1990) Human impacts on energy flow through natural
ecosystems, and implications for species endangerment. Ambio
19(4):189–194
Zika M, Erb KH (2009) The global loss of net primary production
resulting from human-induced soil degradation in drylands. Ecol
Econ 69:310
Changes in land use in South Africa between 1961 and 2006 727
123