
CHANGES IN FISHING CAPACITY AND OWNERSHIP … · The divers prefer "Hookah gear" which ... On...
27
124 CHANGES IN FISHING CAPACITY AND OWNERSHIP OF HARVESTING RIGHTS IN THE NEW SOUTH WALES ABALONE FISHERY A. McIlgorm and A. Goulstone 1 Dominion Consulting Pty Ltd, Suite 7&8, 822 Old Princess Highway, Sutherland NSW 2232, Australia <[email protected]> and NSW Fisheries, Cronulla Fisheries Centre, PO Box 21, Cronulla NSW 2230, Australia <[email protected]> 1. INTRODUCTION The abalone (Haliotis rubra) fishery is a single-species high-value fishery fished by divers exploiting a gastropod mollusc, which lives on the seabed among seaweed adjacent to shore, generally in water depths of less than 20 metres. The divers prefer "Hookah gear" which enables them to breathe using airlines, from small boats whose length is generally not in excess of 8m. A diver would have a crew member assisting him, though there are strict rules over who is entitled to dive in the fishery. The fishery is driven by overseas demand for abalone with Australia supplying approximately 60-70% of the world market for this species. The abalone sector across Australia has approximately 300 licensed divers and had a value of $A181 million (price at first sale) in 1997-98, being approximately 12% of the total value of Australian fisheries (McIlgorm and Tsamenyi 2000). The NSW abalone fishery is small, producing 333 tonnes in the 1997-98 fishing season and having a value at first sale of $11m for the 1997-98 season. International demand plays a crucial part in keeping the NSW abalone fishery profitable. The fishery commenced in the 1960s. The largest catches were in the early 1970s, though prices were low until the development of exports to Japan in the late 1970s. Regulations changed causing the shucking of shellfish at sea to be moved: first to wharfs, and then to within processing premises. A minimum shell-size limit of 100mm was introduced in 1977 to curtail over-exploitation, and at that time many transient fishers moved to dive in the neighbouring state of Victoria. By the end of the 1970s the impact of good markets in Japan was being felt by the fishery, and many enthusiasts and amateur dive- club members decided to become specialised abalone divers. Many divers bought fast “sharkcat” vessels giving the industry a glamorous image. The abalone fishery is the oldest managed fishery in NSW, and access was first restricted in 1980. Since then the fishery has seen a reduction in numbers of diver/operators due to a combination of regulations, restructuring, and further development of fishing-rights regimes. This case study examines the changes in fishering-capacity as the fishery has moved from being managed through a general fishing licence, to species- specific limited-entry licensing, going through several adjustment-schemes and the eventual introduction of Individual Transferable Quotas (ITQs). In NSW limited-entry and ITQ-management has been followed by the share-management system, which augments quota-holdings with recognised and compensatable fishing-rights under the NSW Fisheries Management Act 1994 (Watkins 2000). 1 The paper should not be taken as representing the policy of NSW Fisheries. Abalone (Haliotis rubra) Photo credit: Dianna Watkins, NSW Fisheries
Transcript of CHANGES IN FISHING CAPACITY AND OWNERSHIP … · The divers prefer "Hookah gear" which ... On...

124
CHANGES IN FISHING CAPACITY AND OWNERSHIP OF HARVESTING RIGHTS IN THE NEW SOUTH WALES ABALONE FISHERY
A. McIlgorm and A. Goulstone1 Dominion Consulting Pty Ltd,
Suite 7&8, 822 Old Princess Highway, Sutherland NSW 2232, Australia <[email protected]>
and NSW Fisheries, Cronulla Fisheries Centre, PO Box 21, Cronulla NSW 2230, Australia
1. INTRODUCTION The abalone (Haliotis rubra) fishery is a single-species high-value fishery fished by divers exploiting a gastropod mollusc, which lives on the seabed among seaweed adjacent to shore, generally in water depths of less than 20 metres. The divers prefer "Hookah gear" which enables them to breathe using airlines, from small boats whose length is generally not in excess of 8m. A diver would have a crew member assisting him, though there are strict rules over who is entitled to dive in the fishery.
The fishery is driven by overseas demand for abalone with Australia supplying approximately 60-70% of the world market for this species. The abalone sector across Australia has approximately 300 licensed divers and had a value of $A181 million (price at first sale) in 1997-98, being approximately 12% of the total value of Australian fisheries (McIlgorm and Tsamenyi 2000). The NSW abalone fishery is small, producing 333 tonnes in the 1997-98 fishing season and having a value at first sale of $11m for the 1997-98 season. International demand plays a crucial part in keeping the NSW abalone fishery profitable.
The fishery commenced in the 1960s. The largest catches were in
the early 1970s, though prices were low until the development of exports to Japan in the late 1970s.
Regulations changed causing the shucking of shellfish at sea to be moved: first to wharfs, and then to within processing premises. A minimum shell-size limit of 100mm was introduced in 1977 to curtail over-exploitation, and at that time many transient fishers moved to dive in the neighbouring state of Victoria. By the end of the 1970s the impact of good markets in Japan was being felt by the fishery, and many enthusiasts and amateur dive-club members decided to become specialised abalone divers. Many divers bought fast “sharkcat” vessels giving the industry a glamorous image.
The abalone fishery is the oldest managed fishery in NSW, and access was first restricted in 1980. Since then the fishery has seen a reduction in numbers of diver/operators due to a combination of regulations, restructuring, and further development of fishing-rights regimes. This case study examines the changes in fishering-capacity as the fishery has moved from being managed through a general fishing licence, to species-specific limited-entry licensing, going through several adjustment-schemes and the eventual introduction of Individual Transferable Quotas (ITQs). In NSW limited-entry and ITQ-management has been followed by the share-management system, which augments quota-holdings with recognised and compensatable fishing-rights under the NSW Fisheries Management Act 1994 (Watkins 2000).
1 The paper should not be taken as representing the policy of NSW Fisheries.
Abalone (Haliotis rubra) Photo credit: Dianna Watkins, NSW Fisheries

McIlgorm and Goulstone
125
NSW abalone diver’s boat Photo credit: Dianna Watkins, NSW Fisheries
As a fishery with low numbers of divers and significant biological and management data, the NSW abalone fishery provides an opportunity for a study of capacity over a 20-year period. The change in the fishery has been in adjusting the human-capacity, as opposed to vessel-capacity, and in this way may be in contrast to other studies. It may provide useful information for fishery managers wishing to augment rights-based fishery management, and in understanding the people-element in fishing-capacity issues.
2. THE NATURE OF THE HARVESTING RIGHT In the 1970s the fishery was administered by the requirement of a general fishing licence that enabled abalone to be taken by any commercial fisher in NSW, i.e. a general access-right to the fisheries of NSW. At that time abalone prices were low and the fishery undeveloped. Market prices increased in the late 1970s and the potential to export into the Japanese market led to greater interest in abalone harvesting. By the late 1970s some concerned fishers were calling for control of the fishery due to its rapid development and diminished catch-rates.
In 1980 a more restricted licence was introduced, enabling fishers who had evidence of previous abalone fishing involvement to hold a fishing endorsement specifying access to the abalone; holders of general licences could no longer harvest abalone. This abalone licence was not transferable except under exceptional circumstances such as sickness, and at the discretion of the Director of Fisheries.
In 1985 saleability was brought in with the “2 for 1” buy-back programme. Under this system an entrant had to buy two licences to get one new consolidated licence in the fishery. This forced divers to discuss the price of the right (which was $A60 000 each), representing an entry price to the fishery of $A120 000 in 1985. For this the divers had an expectation of catches of 15-20 tonnes at $A3-4/kg (Smythe, pers comm.). The floating of the Australian dollar in 1985 led to prices of $8-$9/kg by the end of 1985. This affected the levels of effort by new divers who had to work harder to repay debts incurred in entering the fishery, and it gave incentives for existing divers too, to work harder. This led to new concerns about levels of effort and over-exploitation of the resource.
In this period the licence was technically an annual permit and was renewed each year by the Director of Fisheries. Banks did not recognise licences as collateral and loans were made against divers’ assets (e.g. houses, etc.). Several interstate divorce settlement cases (such as Kelly v Kelly 1990), led to licences being regarded as an asset having “a proprietary interest”. Subsequently the attitude of banks in recognising licences as collateral was mixed “depending on the bank and the different personalities involved” (Smythe, pers. comm.)2.
In 1988 as a result of over-exploitation concerns, an Individual Quota (IQ) was allocated equally at 10 tonnes of abalone per diver, an initial equal allocation at which fishers were all financially viable. In 1990 a minimal transfer provision of being able to receive 4 tonnes of abalone from other divers, or to sell 2 tonnes, was implemented. For example a diver could trade-up to holding 14 tonnes of abalone, or
trade-down to holding only 8 tonnes. Further quota-transfer was implemented to stem “year end arrangements” between fishers who had caught less quota than envisaged and thus arranged figures to keep within the minimal transfer provisions.
The IQs were subsequently reduced to 9 tonnes per diver in 1992 and were made into fully transferable ITQs in 1994. By this time the banks were more comfortable with lending against ITQs, though lending practices varied between banks and with the financial circumstances of the client. The ITQ per diver was reduced to 8.24 tonnes per diver in 2000.
2 NSW Abalone Management Advisory Committee.

Changes in Capacity and Ownership - NSW Abalone
126
In the mid-1990s, as a result of the property-rights working-groups and subsequent developments (see Young 1995, Goulstone 2000 and Waktins 2000) the NSW share-management regime was introduced. Provisional share allocations were made in 1996 with a fixed number of shares in proportion to the ITQ being allocated. This was equivalent to 100 provisional shares per diver.
The shares are recognised under the Fisheries Management Act 1994, are transferable, are perpetual in duration, with guaranteed renewal every 10-year period. The management plan is current for a 5-year period. The share-right entitles fishers to compensation under the Fisheries Management Act 1994 if the government decides to close the fishery.
The NSW Fisheries Department has been responsible for maintaining the ownership records under each of the schemes of management e.g. general fishing-licence, restricted abalone-entry license, ITQs and share ownership registries. However there is no obligation on the Department to record financial arrangements such as liens against entitlements. Sale of rights was limited under the original pre-1980 fishing licence, but possible under the restricted abalone-licence after 1985, although requiring the approval of the Director of Fisheries.
In moving to share-management from a restricted fishery, there was a provisional share-management period to confirm initial allocations, settle appeals and develop a management plan before full share-management commenced. Under provisional share-management, transfers required the Director’s approval and only complete bundles of 100 shares could be sold. On introduction of full share-management and the management plan in the year 2000, shares could be sold in lots of 10.
Under full share-management, 100 shares were issued to each of the 37 divers, making 3700 shares available in the fishery. If the Total Allowable Catch (TAC) was to increase there are still only 3700 shares, thus this is the incentive to steward the resource. The permission of the Director is not required to transfer shares, though the management plan specifies the conditions for holding shares. A new entrant diver must have 70 shares to dive and no one entity can hold over 210 shares. This was a design feature of the rights-regime to prevent concentration of ownership (Young 1995).
Under the share-management scheme shares can be sold to anyone who is an Australian citizen, foreign ownership being limited to 20% of a body corporate. The abalone must be taken from the water by a nominated diver holding 70 shares. Under the share-scheme greater third-party ownership of shares is possible than under previous management arrangements.
In 1999 when the management plan was being developed the divers discussed transferability in the consultative draft plan. Greater third-party investment through de-regulated ownership was seen as potentially increasing share value, but it was feared that this would lead to more divers being in the fishery. At a mimimum share-holding of 50 shares per diver, up to 74 divers could be in the fishery. Industry representatives feared that should prices fall then harvests may illegally exceed the quota, in proportion to the number of divers, and threaten the viability of the resource. Divers on the Management Advisory Committee recommended that the minimum provision should be 70 shares per diver. Conversely if the trade led to maximum holdings of 210 shares, the current TAC could be taken by 18 divers. The Management Plan addresses capacity-concerns through having triggers to initiate a review if diver numbers increase or decrease substantially.
In summary, tradeability has on occasions been restricted at the request of industry in order to prevent potential resource depletion. Under share-management trading happens within guidelines that protect the resource and yet release the economic benefits of rights-management.
3. MEASUREMENT OF FLEET-CAPACITY 3.1 Characterizing fleet-capacity The measurement of capacity in fisheries is proposed as having three elements (Kirkley and Squires 1999):
i. Capacity - potential output ii. Capacity utilization - observed output to capacity output and
iii. Capital utilization - desired stock of capital and the observed capital stock.
As such, these measures give "...cursory consideration of the role of labour or crew...." (Kirkley and Squires 1999). The abalone fishery’s "fleet-capacity" is not best measured in boat numbers or capital equipment. This makes it representative of many small boat fisheries in Australia where diving and netting from small-boats in estuaries represents approximately 20% of all licensed commercial fishing activity by number of licence-holders (McIlgorm and Tsamenyi 2000). Management experience has shown that dealing with the fishers in such fisheries involves fisher/diver-based capacity-measures, and will also involve catch, effort, regulations and capital values of fishing-rights.

McIlgorm and Goulstone
127
The biology and catch trends with management controls have been plotted over time by Worthington et al. (1998) and are shown in Figure 1. The largest catches were at over 1,200t in the early 1970s prior to regulations on size-limits. The impacts of restricting licences, and of several size-limit regulations are also noted. In 1988 a quota of 10 tonnes per diver was introduced and this was reduced in 1992 to 9 tonnes per diver.
Figure 1 Impacts of regulation and rights changes on annual catch in the NSW abalone fishery
(Source: NSW Fisheries records, and after Worthington et al.1998)
Capacity in terms of catch taken, can be seen to have been adjusted by biological size limits, limited entry, restructuring, and subsequent rights developments.
3.2 Changes in fleet-capacity arising from the introduction of transferable property-rights The number of divers is proposed as representing a measure of fishing-capacity in this fishery. The historical trend in number of divers (1970- 2000) is shown in Figure 2.
Figure 2 The historical trend of numbers of divers in the NSW abalone fishery.
Timing of management measures are indicated (Source: NSW Fisheries records)
0
50
100
150
200
250
300
350
1970
1971
1972
1973
1974
1975
1976
1977
1978
1979
1980
1981
1982
1983
1984
1985
1986
1987
1988
1989
1990
1991
1992
1993
1994
1995
1996
1997
1998
1999
2000
Years
No.
of D
iver
s .
Limited entry IQs
start
100mm minsize limit
IQ 9 tonne ITQs
2 for 1 scheme
BuyBack scheme
0
200
400
600
800
1,000
1,200
1,400
1965
1967
1969
1971
1973
1975
1977
1979
1981
1983
1985
1987
1989
1991
1993
1995
1997
1999
Years
Annu
al c
atch
in to
nnes
. Limited entry
10 tonne IQ
ITQs 9 tonne IQ
100 mm min. Size limit

Changes in Capacity and Ownership - NSW Abalone
128
In the period 1970 to 1975, the year of peak activity under open-access was 1971 with 290 divers, dropping to 257, 187, and 140 in 1972, 1973 and 1974 respectively due to size-limit restrictions and depleted catch-rates. Fishers were all part-time participants. Groups of divers would arrive in winter, fish and then moved on to other states when previous catch-rates were not achieved (Smythe, pers. comm.).
Figure 2 illustrates the drop in divers from 100 to 59 at the onset of limited-entry to the abalone fishery in 1980. In 1990 a buy-back scheme cost $A1.32 million to remove 5 entitlements. The number of divers stabilised in the period 1993-2000 at 37.
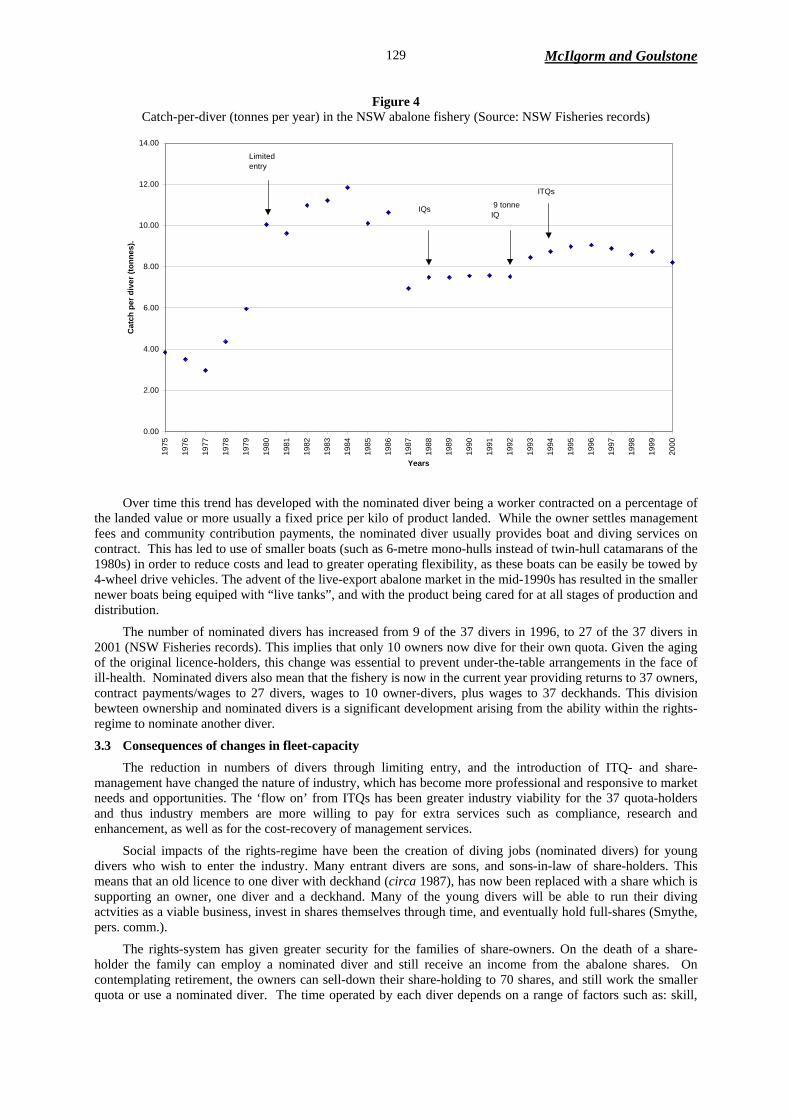
While the number of fishers is the most significant measure of capacity in this fishery, other indices of capacity are effort (Figure 3) and catch-per-diver (Figure 4). Effort trends across the fishery are reported in Figure 3 and show the reduction in effort with advances in management from 29 000 hours in 1979, prior to limited-entry, down to 16 000 hours in the late 1990s. Figure 4 reports the catch-per-diver and indicates how greatest total catch was taken by many divers at low rates of catch-per-diver in the early 1970s. Catch-per-diver increased with limited-entry and reduced with ITQs, a measure to contain capacity.
Figure 3 Effort in hours fished per year in the NSW abalone fishery (Source: NSW Fisheries records)
In 1992 there was discussion on the basis for ITQ allocations. Those fishers who had bought into the fishery under the “2 for 1” scheme, gaining a consolidated licence, reasoned that each original licence should have an initial quota-allocation. This eventually led to a legal challenge which did not uphold this view, and was only resolved in 1998. This caused much uncertainty in ITQ quota-trading.
A measure of potential capacity may be the current capacity (37 divers each harvesting 9 tonnes for a total of 333 tonnes of abalone), divided by the highest annual average catch-per-diver (in Figure 4, approximately 12 tonnes). This would indicate that the catch in the year 2000 could be taken by 27 divers. Under share-holding rules the industry indicated that as few as 18 divers could potentially take the current total allowable catch.
Capital measures of capacity in the abalone fishery are more difficult to measure because the boats have altered since the 1970s when they were larger as the fishers traversed the coastline by boat (Waugh 1977). the numbers of boats have in fact fallen in proportion to the reduction in numbers of divers: although many of the longer-term divers have kept larger boats, through time, smaller boats that can be towed by trailer have become more common place. This has been the case with the nominated divers who have tended to minimise catching costs and have preferred to tow smaller vessels, travelling along the improved roads rather than travelling long distances at sea (Smythe, pers. comm.).
Boat-capacity has been altered subtly by the development of the ‘nominated diver’. As the original divers from the 1970s became older, they often found the physical nature of diving led to ill health. Nominated divers are now permitted under the Fisheries Management Act 1994 and so enable sons, relatives and other persons to be employed by the original licencee.
0
5,000
10,000
15,000
20,000
25,000
30,000
35,000
1975
1976
1977
1978
1979
1980
1981
1982
1983
1984
1985
1986
1987
1988
1989
1990
1991
1992
1993
1994
1995
1996
1997
1998
1999
2000
Years
Hou
rs fi
shed
per
yea
r .
IQs 9 tonneIQ
Limted entry
ITQs
McIlgorm and Goulstone
129
Figure 4 Catch-per-diver (tonnes per year) in the NSW abalone fishery (Source: NSW Fisheries records)
Over time this trend has developed with the nominated diver being a worker contracted on a percentage of the landed value or more usually a fixed price per kilo of product landed. While the owner settles management fees and community contribution payments, the nominated diver usually provides boat and diving services on contract. This has led to use of smaller boats (such as 6-metre mono-hulls instead of twin-hull catamarans of the 1980s) in order to reduce costs and lead to greater operating flexibility, as these boats can be easily be towed by 4-wheel drive vehicles. The advent of the live-export abalone market in the mid-1990s has resulted in the smaller newer boats being equiped with “live tanks”, and with the product being cared for at all stages of production and distribution.
The number of nominated divers has increased from 9 of the 37 divers in 1996, to 27 of the 37 divers in 2001 (NSW Fisheries records). This implies that only 10 owners now dive for their own quota. Given the aging of the original licence-holders, this change was essential to prevent under-the-table arrangements in the face of ill-health. Nominated divers also mean that the fishery is now in the current year providing returns to 37 owners, contract payments/wages to 27 divers, wages to 10 owner-divers, plus wages to 37 deckhands. This division bewteen ownership and nominated divers is a significant development arising from the ability within the rights-regime to nominate another diver.
3.3 Consequences of changes in fleet-capacity The reduction in numbers of divers through limiting entry, and the introduction of ITQ- and share-management have changed the nature of industry, which has become more professional and responsive to market needs and opportunities. The ‘flow on’ from ITQs has been greater industry viability for the 37 quota-holders and thus industry members are more willing to pay for extra services such as compliance, research and enhancement, as well as for the cost-recovery of management services.
Social impacts of the rights-regime have been the creation of diving jobs (nominated divers) for young divers who wish to enter the industry. Many entrant divers are sons, and sons-in-law of share-holders. This means that an old licence to one diver with deckhand (circa 1987), has now been replaced with a share which is supporting an owner, one diver and a deckhand. Many of the young divers will be able to run their diving actvities as a viable business, invest in shares themselves through time, and eventually hold full-shares (Smythe, pers. comm.).
The rights-system has given greater security for the families of share-owners. On the death of a share-holder the family can employ a nominated diver and still receive an income from the abalone shares. On contemplating retirement, the owners can sell-down their share-holding to 70 shares, and still work the smaller quota or use a nominated diver. The time operated by each diver depends on a range of factors such as: skill,
0.00
2.00
4.00
6.00
8.00
10.00
12.00
14.00
1975
1976
1977
1978
1979
1980
1981
1982
1983
1984
1985
1986
1987
1988
1989
1990
1991
1992
1993
1994
1995
1996
1997
1998
1999
2000
Years
Cat
ch p
er d
iver
(ton
nes)
.
Limited entry
IQs 9 tonneIQ
ITQs

Changes in Capacity and Ownership - NSW Abalone
130
experience, and the area being fished. However the quota-system has given more flexibility to the choice of when fishers fish.
4. CONCENTRATION OF OWNERSHIP 4.1 Status prior to programme In the late-1970s there were many divers operating under a licence open for any fishery in NSW. Figure 2 reports the large number of fishers prior to the introduction of limited-entry in 1980, and Figure 4 confirms the average catch of 3-6 tonnes per diver.
With the advent of limited entry from 1980 to 1988 there was a downward movement in numbers of divers, but with no aggregation of licence-ownership. On the introduction of ITQs, several transfers have had the potential for businesses to hold two permits, but this is rare. The cost of entitlements may be a barrier to entry and aggregation. The share-management system has led to one owner operating three divers within the limit of 210 shares. This is not regarded as a significant concentration of ownership across the 37 blocks of shares.
4.2 Restriction in the transfer of ownership The original licence system restricted ownership of allocations to those with evidence of previous involvement. On commencement of limited-entry, licences were not transferable - unless under exceptional circumstances and subject to permission of the Director of Fisheries. Licences were made transferable as of 1985. With the introduction of IQs in 1988 the transferability of quota was not possible, until in 1992 limited transferability, and then in 1994 full-transferability, were authorized.
Under the new share-rights regime, in 1996 the provisional shares were transferable in total packages of 100 and with the permission of the Director. On full share-management in the year 2000, the shares could be transferred in lots of 10, though within the holding limits of the management plan and eligibility criteria (a diver must have at least 70 shares, and a business entity can have a maximum holding of only 210 shares.).
4.3 Prices received Beach-prices (the price at first-sale received by the diver from the processors), are recorded by the Abalone Divers Association. Beach-prices are also monitored by government as they are used in estimating the community contribution due from share-holders under the Fisheries Management Act 1994. Figure 5 shows the average beach-prices in Australian dollars each year over over the last twenty.
Figure 5 Average beach-prices for the 1974-2000 period in the NSW abalone fishery
(Source: NSW Abalone Divers Association)
$-
$10.00
$20.00
$30.00
$40.00
$50.00
1979
1980
1981
1982
1983
1984
1985
1986
1987
1988
1989
1990
1991
1992
1993
1994
1995
1996
1997
1998
1999
2000
Year
Ave
Pric
e
McIlgorm and Goulstone
131
The annual rise in price has been at 14% over the 20-year period 1979-2000 and at 10% per annum since 1985. The reasons were: strong demand in Japan and the floating of the Australian currency as of 1985 and its depreciation against the Yen. With this demand and sound management, beach-price have resulted in higher values for licences, ITQs and now shares. Prices for licences, quotas and shares are not generally public knowledge, other than prices appearing in sales adverts etc., but are recorded by industry, and monitored by government who must approve the transfer ensuring stamp duties are paid to Treasury. Transaction records of licences prior to ITQs, of ITQ and of share transfers are available from industry. As of 1999, a package of 100 provisional shares, based on an ITQ of 9 tonnes, was selling for approximately $A1.45 million.
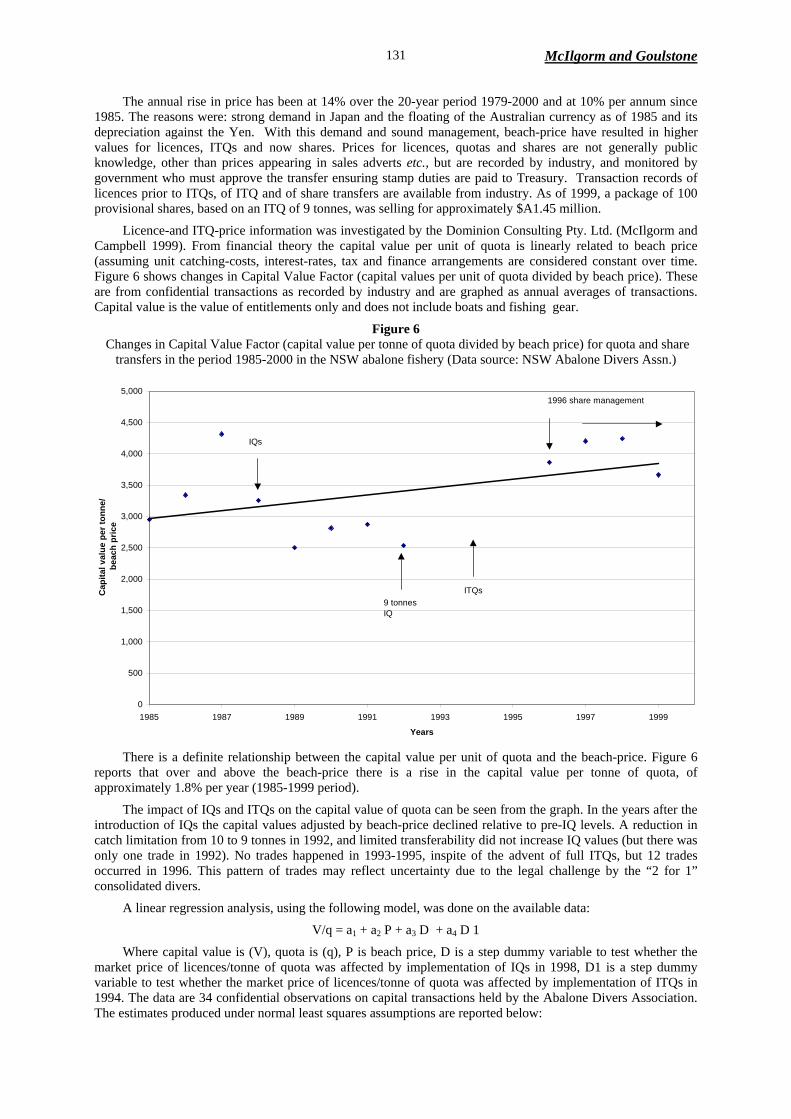
Licence-and ITQ-price information was investigated by the Dominion Consulting Pty. Ltd. (McIlgorm and Campbell 1999). From financial theory the capital value per unit of quota is linearly related to beach price (assuming unit catching-costs, interest-rates, tax and finance arrangements are considered constant over time. Figure 6 shows changes in Capital Value Factor (capital values per unit of quota divided by beach price). These are from confidential transactions as recorded by industry and are graphed as annual averages of transactions. Capital value is the value of entitlements only and does not include boats and fishing gear.
Figure 6 Changes in Capital Value Factor (capital value per tonne of quota divided by beach price) for quota and share
transfers in the period 1985-2000 in the NSW abalone fishery (Data source: NSW Abalone Divers Assn.)
There is a definite relationship between the capital value per unit of quota and the beach-price. Figure 6 reports that over and above the beach-price there is a rise in the capital value per tonne of quota, of approximately 1.8% per year (1985-1999 period).
The impact of IQs and ITQs on the capital value of quota can be seen from the graph. In the years after the introduction of IQs the capital values adjusted by beach-price declined relative to pre-IQ levels. A reduction in catch limitation from 10 to 9 tonnes in 1992, and limited transferability did not increase IQ values (but there was only one trade in 1992). No trades happened in 1993-1995, inspite of the advent of full ITQs, but 12 trades occurred in 1996. This pattern of trades may reflect uncertainty due to the legal challenge by the “2 for 1” consolidated divers.
A linear regression analysis, using the following model, was done on the available data:
V/q = a1 + a2 P + a3 D + a4 D 1
Where capital value is (V), quota is (q), P is beach price, D is a step dummy variable to test whether the market price of licences/tonne of quota was affected by implementation of IQs in 1998, D1 is a step dummy variable to test whether the market price of licences/tonne of quota was affected by implementation of ITQs in 1994. The data are 34 confidential observations on capital transactions held by the Abalone Divers Association. The estimates produced under normal least squares assumptions are reported below:
0
500
1,000
1,500
2,000
2,500
3,000
3,500
4,000
4,500
5,000
1985 1987 1989 1991 1993 1995 1997 1999
Years
Cap
ital v
alue
per
tonn
e/ b
each
pric
e
IQs
9 tonnesIQ
1996 share management
ITQs

Changes in Capacity and Ownership - NSW Abalone
132
Variable Constant Price D D 1 Estimate –5,620.2 4,253.9 -20,799 16,221 t ratio (-1.56) (13.43)* (-4.1)* (3.1)* n= 34, √2 = 0.96, * significant at a 1% level. The results confirm a strong relationship between the capital values of quota and beach price. The change to IQ-management caused a significant decline in capital value per tonne of quota, whereas the change to full ITQs after 1994 raised capital values per tonne significantly.
The analysis is preliminary, subject to the assumptions of the model, and is made more complicated by the introduction of a community contribution charge to industry in 1996. As a form of tax this would be expected to reduce the capital value per tonne of the beach price (McIlgorm and Campbell 1999). It is also unclear to what extent the post-1994 results reflect the changes to share-management in 2000, announced in 1995. We would expect the new right to have more innate value than previous licences, IQs, or ITQs, as the share would reflect benefits from a recovering stock.
The clearest message is in the relationship between capital values of quota and beach price under a range of management regimes. The fishery has been kept profitable by rising beach-prices, and rights-management initiatives have contributed to this being capitalised in share values.
4.4 Effectiveness of regulations governing ownership of rights Several issues have arisen as the rights-regime has evolved. The ownership rules were first devised in 1980 with divers as owner-operators only. In the course of time ill-health or old age meant that under original rules the licences could not be operated.
For consolidated licences, from the “2 for 1” scheme, there was an incentive to make legal arrangements, usually through a solicitor, to have ownership changed in practice, but without altering the records held by the Fisheries Department. This happened in several cases, but in the event of a fishing offence by the diver this arrangement could lead to cancellation of a licence.
However, the Fisheries Department recognised that the motivation for such arrangements was to let sons, other family members and contract divers into the fishery, and the advent of the ‘nominated diver’ provisions this informal practice. The message is that as fishers get older, the transfer of their rights to relatives is an important social consideration for the fishers.
4.5 Affects of programme Through the move from licences to ITQs and shares there has been little concentration of ownership. Under share-management, entities are limited to 210 shares and only one investor has three divers. The family-nature of diving, the cost of entitlements, and the transfer provisions have limited the concentration of ownership to date. The rise in beach prices has also prevented restructuring caused by poor financial viability.
5. DISCUSSION 5.1 Reduction in fishing-capacity The analysis of fishing-capacity shows that limited-entry and quotas have reduced catch and effort, and hence capacity in this fishery towards more sustainable levels. However the development of ITQs and the share-management rights-system has enabled significant rises in the price of abalone to benefit the share-holders. The licence- and ITQ-systems have enabled 37 divers to remain in the fishery, but limiting fishing-effort. However original owner-operators have been able to use nominated divers, with 9 doing so in 1996 and 27 in 2001. Ten years ago there were 37 owner-operators with deckhands. There are now 10 owner-operators, 27 owners, 27 nominated divers and 37 deckhands. The division of owners and nominated divers does not increase fishing-capacity, and illustrates the diversity in outcomes that may follow rights-management – the same catch now supports more people.
There is currently no lack of profitability that might cause further restructuring. When in 2001 the ITQs were reduced from 9 to 8.25 tonnes per diver, the price rises associated with the fall in the Australian dollar more than compensated operators in terms of their overall revenue. Share-holders see this as an opportunity to rebuild the stock levels of abalone following scientific advice and potential economic returns. The situation would be different if prices were falling and it indicates that commercial viability and capacity in a “post-ITQ” fishery are essential for future management.

McIlgorm and Goulstone
133
5.2 Concentration of ownership In the post-ITQ fishery there have been concerns about the potential for concentration of ownership. To date these have not been realised due to the design limits of the share-management scheme and the position of industry in wanting to limit the number of divers in order to maximise the legal catch. Industry owners consider that they pay divers at rates which encourage the divers to comply with the harvesting regulation and not undertake illegal harvesting and marketing practices.
6. DISCUSSION The price rises in this fishery have led to illegal fishing outside the quota- or share-system. This has been estimated as high as 50% of the current legal TAC, and is a major capacity-issue (Worthington et al. 1998). This is the major risk in the management of capacity in this fishery where sustained price rises and the markets for abalone also give strong incentives to illegal fishers.
Rights-holders are aware of this and have funded additional compliance staff within government to protect their fishing interests. It remains to be seen whether this will be sufficient to reduce the illegal fishery.
7. ACKNOWLEDGEMENTS We acknowledge the information provided by the staff of the NSW Fisheries department, and by Mr John Smythe of the Abalone Management Advisory Committee and the NSW Abalone Divers Association.
8. LITERATURE CITED Goulstone, A.R. 2000. Rights-based Fisheries Management in New South Wales, Australia. In: Shotton, R. (Ed.)
Use of property rights in fisheries management. Proceedings of the FishRights99 Conference. Fremantle, Western Australia, 11-19 November 1999. Workshop presentations. FAO Fisheries Technical Paper. No.404/2. Rome, FAO. pp78-83.
Kelly v Kelly 1990. 64 ALJR 234. Kirkley, J.E. and D. Squires 1988. A limited information apporach for determining Capital Stock and
Investment in a fishery. Fishery Bulletin, 2, No. 2, pp 339-349. Kirkley, J.E. and D.E. Squires 1999. Measuring Capacity and Capacity Utilization in Fisheries. In: Gréboval, D.
(Ed.) Managing Fishing Capacity: selected papers on uderlying concepts and issues. FAO Fisheries Technical Paper No. 386, Rome., FAO, pp 75-116.
McIlgorm, A. and H.F. Campbell 1999. An Independent Appraisal of the Report by Hassall and Associates, and Reappraisal of the Community Contribution in NSW. A Report to NSW Abalone Management Committee and NSW Fisheries. Un-published Document by Dominion Consulting Pty. Ltd.
McIlgorm, A. and M. Tsamenyi 2000. Rights-based fisheries development in Australia; has it stalled? In: Shotton, R. (Ed.) Use of property rights in fisheries management. Proceedings of the FishRights99 Conference. Fremantle, Western Australia, 11-19 November 1999. FAO Fisheries Technical Paper. No.404/2. Rome, FAO. pp148-154.
Watkins, D. 2000. Abalone and the implementation of a share-based property rights in New South Wales, Australia. In: Shotton, R. (Ed.) Use of property rights in fisheries management. Proceedings of the FishRights99 Conference. Fremantle, Western Australia, 11-19 November 1999. FAO Fisheries Technical Paper. No.404/2. Rome, FAO. pp234-238.
Waugh, G. 1977. Costs and Incomes in the NSW Abalone Fishery: The First Year of Licence Limitation. Unisearch Ltd.
Worthington D.G., R.C. Chick, C. Blount, P.A. Brett and P.T. Gibson 1998. A Final Assessment of the NSW Abalone Fishery in 1997. Fisheries Research Institute, NSW Fisheries.
Young, M.D. 1995. The Design of Fishing-right Systems – the New South Wales Experience. Ocean and Coastal Management, Elsevier Science Ltd. Vol. 28, Nos 1-3, pp45-61.

134
CHANGE IN FLEET CAPACITY AND OWNERSHIP OF HARVESTING RIGHTS IN THE AUSTRALIAN SOUTHERN BLUEFIN TUNA FISHERY
D. Campbell
David Campbell and Associates PO Box 228 Kippax Act 2615 Australia
1. INTRODUCTION 1.1 Resource biology The Australian southern bluefin tuna fishery is part of a larger international fishery targeting southern bluefin tuna (SBT, Thunnus maccoyii). A single highly migratory ‘straddling’ stock exists in the Indian and Southern Ocean and individuals may live up to 40 years in age and weigh over 200kg. The juvenile phase begins in the spawning grounds south of Java with most of the two- to eight-year-old fish forming large surface schools that migrate anti-clockwise over the southern Australian continental shelf. At eight years of age, mature fish leave these Australian continental waters for the Southern and Indian Oceans (Figure 1).
Figure 1
Distribution of bluefin tuna catch off the Australian coast
1.2 The global fishery The highest reported annual global landings of SBT (more 81 200t) occurred in 1961. The Japanese fishery landing 7800t or approximately 95% of global landings and the Australian fishery landing 3700t, or approximately 5% of the total. In 1983, the year before individual, transferable catch quotas (ITCQ) were

Campbell 135
introduced into the Australian fishery, the reported global catch was 42 800t, or about half the record catch taken 22 years earlier. Of this, Australian landings were 17 700t (41%) and Japanese landings were 24 900t (58%). The reported landings by New Zealand and ‘others’ made up the remaining 1% of the reported total global landings. Since the 1989-90 fishing season, Australia’s national quota has been 5262t; Japan, 6065t; and New Zealand, 420t, or 11 747t in total. From 1989-90 to 1998, the total landings of these three fisheries remained at around 11 300t. As a result of increased catch by ‘others’ and 1464t taken by Japan outside of its quota, global landings in 1998 were 1924t (Figure 2).
Figure 2SBT global landings: 1966 to 1998
1
10
100
1000
10000
100000
1966
1970
1980
1990
1998
Years
Land
ings
(ton
nes)
Australia Japan New Zealand Others
Note: ‘Others’ is primarily the catch of: the Republic of Korea, Indonesia and Taiwan (Province of China). There are a number of other fishing nations that catch and retain SBT: for instance, figures from the Japanese Department of Finance show Japanese imports of SBT from 19 national sources for the year 1997, and from 15 national sources in 1998.
Prior to the introduction of ITCQ, the Australian fishery relied on pole-and-line and purse-seine methods to catch immature surface-swimming fish within the Australian fishing zone. Much of this catch went into the low- valued Australian canning market, although an increasing proportion was exported to the higher-valued Italian and Japanese markets1. The Japanese fishery used long-lines to target deep-swimming mature fish for the Japanese sashimi market, while a large part of the relatively small New Zealand hand-line fishery went to the high-value Japanese sashimi market (Wesney, Scott and Franklin 1985).
1.3 A collapsing stock Global stocks of SBT began to fall in the 1960s as a result of over-fishing, and continued to do so through the 1970s and the 1980s. In Australia, increasing fishing-effort, cooperative fishing between purse-seine and pole-vessels, increased use of aerial searching and expanded Western Australian fishing effort, culminated in a record Australian SBT catch of 2100t in 1982-83 (Majkowski and Caton 1984). This increase in Australian catch and increasing Japanese fishing-effort led to continuing falls in estimated levels of the parent-stock (Hampton and Majkowski 1986).
In the early 1980s, concern about a declining parent-stock triggered a series of trilateral consultations involving Australia, Japan and New Zealand. It was recognised that while parent-stocks were then depressed to about one-third of their pre-fishing levels, throughout 1975-80, the stock-levels had been reasonably stable. The participants agreed that stocks had been further reduced more recently as a result of high exploitation-rates. In response, they agreed on the need to implement fishing constraints to protect stock-biomass, and set as a conservation objective the return by 2020 of the biomasses of the parent-stocks to their 1975-1980 levels.
1 In 1982-83 Australian exports to Italy and Japan were, respectively, 8900 and 2300t, valued at $A9.4 and $A3 million. In 1983-84 exports to were respectively: 2000 and 3000t, valued at $A3.2 and $A3.4 million (Smith 1986).
Australian Southern Bluefin Tuna
136
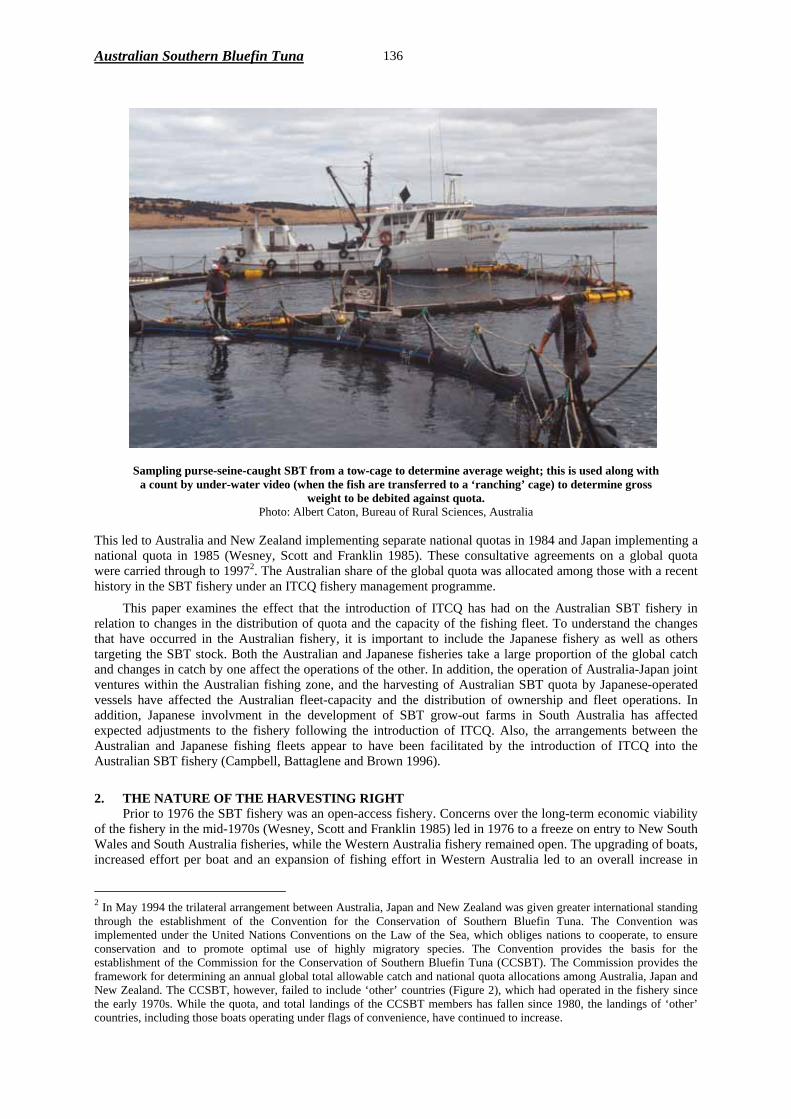
Sampling purse-seine-caught SBT from a tow-cage to determine average weight; this is used along with
a count by under-water video (when the fish are transferred to a ‘ranching’ cage) to determine gross weight to be debited against quota.
Photo: Albert Caton, Bureau of Rural Sciences, Australia
This led to Australia and New Zealand implementing separate national quotas in 1984 and Japan implementing a national quota in 1985 (Wesney, Scott and Franklin 1985). These consultative agreements on a global quota were carried through to 19972. The Australian share of the global quota was allocated among those with a recent history in the SBT fishery under an ITCQ fishery management programme.
This paper examines the effect that the introduction of ITCQ has had on the Australian SBT fishery in relation to changes in the distribution of quota and the capacity of the fishing fleet. To understand the changes that have occurred in the Australian fishery, it is important to include the Japanese fishery as well as others targeting the SBT stock. Both the Australian and Japanese fisheries take a large proportion of the global catch and changes in catch by one affect the operations of the other. In addition, the operation of Australia-Japan joint ventures within the Australian fishing zone, and the harvesting of Australian SBT quota by Japanese-operated vessels have affected the Australian fleet-capacity and the distribution of ownership and fleet operations. In addition, Japanese involvment in the development of SBT grow-out farms in South Australia has affected expected adjustments to the fishery following the introduction of ITCQ. Also, the arrangements between the Australian and Japanese fishing fleets appear to have been facilitated by the introduction of ITCQ into the Australian SBT fishery (Campbell, Battaglene and Brown 1996).
2. THE NATURE OF THE HARVESTING RIGHT Prior to 1976 the SBT fishery was an open-access fishery. Concerns over the long-term economic viability of the fishery in the mid-1970s (Wesney, Scott and Franklin 1985) led in 1976 to a freeze on entry to New South Wales and South Australia fisheries, while the Western Australia fishery remained open. The upgrading of boats, increased effort per boat and an expansion of fishing effort in Western Australia led to an overall increase in
2 In May 1994 the trilateral arrangement between Australia, Japan and New Zealand was given greater international standing through the establishment of the Convention for the Conservation of Southern Bluefin Tuna. The Convention was implemented under the United Nations Conventions on the Law of the Sea, which obliges nations to cooperate, to ensure conservation and to promote optimal use of highly migratory species. The Convention provides the basis for the establishment of the Commission for the Conservation of Southern Bluefin Tuna (CCSBT). The Commission provides the framework for determining an annual global total allowable catch and national quota allocations among Australia, Japan and New Zealand. The CCSBT, however, failed to include ‘other’ countries (Figure 2), which had operated in the fishery since the early 1970s. While the quota, and total landings of the CCSBT members has fallen since 1980, the landings of ‘other’ countries, including those boats operating under flags of convenience, have continued to increase.

Campbell 137
fishing effort and decreasing operator-returns. As a result, the freeze was terminated in April 1981 and the fishery returned to an open-access fishery.
Prior to the introduction of ITCQ in 1984, three fishing methods were used in the Australian southern bluefin fishery. The most widely used method was pole-and-line, which was carried out on boats of 10 to 30m in length. Larger boats were used to purse-seine, while a small amount of catch was taken using small (mostly inshore) boats trolling for surface-swimming fish. Some characteristics of the state-based fleets as they were in 1981-82 are presented in Table 1.
Table 1 Characteristics of the Australian southern bluefin tuna fleet 1981-82
New South Wales - South Australia
Western Australia
Australian fleet (total)
Number: Pole boats 49 68 117 Number: Purse-seiners 5 - 5 Length (m): Pole boats 21.8 (4) 11.5 (3) 16.4 (2) Length (m): Purse-seiners 31.0 - 31.0 Age: Pole boats 8 (18) 16 (12)- Age: Purse-seiners 11 -
12 (9)
Refrigerated 49 16 65 Note: Figures in parentheses are relative standard errors. Source: Bureau of Agricultural Economics (1986).
In October 1983 a twelve-month interim management-programme involving a national total allowable catch (TAC) of 1900t, was put in place. Under the interim management-programme, the western sector (Western Australia) received an allocation of 400t (a reduction of 200t on the previous year’s landings) and the eastern sector (New South Wales and South Australia) was allocated 1500t (100t below the sector’s previous record landings). To ensure access to the resource by pole-and-line vessels, a 500t catch-limit was placed on purse-seiner catch with the additional requirement of no transhipment of catch to carrier boats. A minimum size for landed tuna was imposed to reduce the number of small fish caught3. Aside from these limitations, there were no constraints on boats’ operations.
Following a review and recommendations by the Industries Assistance Commission (1984), a long-term management programme based on ITCQ, was introduced into the fishery in October 1984. The essential element of the programme was the allocation on a boat-by-boat basis of a fixed proportional entitlement of a national total allowable catch, where the national total allowable catch could be varied. Other than a restriction on the taking of SBT off the Western Australia west coast4, entitlements could be freely sold, or leased in whole or in part, between existing or new operators and between different regions of the Australian fishery, irrespective of fishing method used.
The joint industry-government SBT Management Advisory Committee used two criteria as a basis to allocate quota. These were: the best annual catch over the three seasons 1980-81 to 1982-83, and the assessed market value of the SBT boat and fishing gear in August to September 1984. In allocating quota-units, a weighting of three-quarters was given to the best catch, and a weighting of one-quarter was given to the assessed market value. The quota-units provided the quota-holder a proportion of the national annual quota thus allowing a smooth transition in the allocation of individual allowable catch with any change in national quota. The total allowable catch for the first year of operation was set at 14 500t, with 14 050t allocated; the difference being held back pending appeals. This was a substantial reduction on the average of 18 900t taken over the period 1981-82 to 1983-84 (ABARE 1989).
Initially, 136 boats were allocated quota-units equivalent to more than 5t of quota. Seventy, or slightly over half of these boats operated in the Western Australia fishery, which received 27 500t (20%) of the allocated quota. South Australia’s 40 boats, which made up 29% of the fleet, accounted for 9300t (64%) of the initial quota allocation and the largest allocation of quota on a per boat basis. The 26 boats from New South Wales made up 19% of the national fleet, while their quota allocation made up 14% of the total allocation (Table 2).
3 225 t of undersized southern bluefin tuna were dumped in 1982-83 during the interim management-plan. 4 This constraint is unlikely to have had a substantial affect on the distribution of quota holdings or in the distribution of fishing effort as the value of holding quota can be increased by targeting on larger SBT, which have a larger value per unit of weight.

Australian Southern Bluefin Tuna
138
Table 2 ‘Leavers’ and ‘stayers‘ in the fishery 1983-84 to 1985-86a
New South Wales South Australia Western Australia Total No. Average
quota (tonnes)
No. Average quota
(tonnes)
No. Average quota
(tonnes)
No. Average quota
(tonnes) Leavers - fished 1983-84 7 107.0 7 101.7 41 39.0 55 55.7 - did not fish 1983-84 16 55.3 3 145.0 8 17.7 27 54.1 - total 23 71.3 10 116.1 49 35.5 82 55.2 Stayers
3 128.1 30 270.4 21 48.2 54 176.3
Stayers & leavers 26 77.7 40 231.8 70 39.3 136 103.2 a Boats allocated 5t or less of quota in 1984 are not included. The Department of Primary Industry, of which the Australian Fisheries Service was part, retained 455t to accommodate the need for additional quota allocation. Leavers are defined as those boats for which quota was reduced to 5t or less as at 30 June 1986. b Because only three owner-operators left the South Australian fishery, no personal data were collected for that state, for reasons of confidentiality. Source: Australian Fisheries Service. 3. MEASUREMENT OF FLEET-CAPACITY 3.1 Characterising fleet-capacity and their operational environment By the early 1980s, the biological and economic status of the fishery was undergoing increasing pressure. The Bureau of Agricultural Economics5 (1983, 1986) published survey data showing the average per boat return to capital and management had fallen from $A49 000 in 1980-81 to $A8285 in 1981-82 and an average per boat debt level of $A57 733 in 1981-82. In the same paper, the Bureau of Agricultural Economics (1983) presented CSIRO findings that the estimated global sustainable catch of 3300t had been exceeded by approximately 700t in 1982.
In setting a global quota, the objective was to return the parent biomass of SBT to the 1980 level by 2020. The recommendation by the Bureau of Agricultural Economics (1983) and the Industries Assistance Commission (1984)6, for the use of ITCQ to manage the fishery within the national quota, was to achieve an economic objective.
At the time of the introduction of the ITCQ-based management plan into the Australian SBT fishery, it consisted of three fleets located in southern New South Wales, Port Lincoln in South Australia, and the Western Australian south coast. Not accounted for in this was a small amount of bycatch taken off Tasmania by local fishers with some Tasmanian boats receiving quota of less than 5t. The fleets differed in the nature of their operations and in their access to SBT stocks. Differences also existed in the relative opportunities to participate in other fisheries, in the non-fishing skills of owner-operators, and in opportunities to participate in non-fishing employment. These differences could be expected to have resulted in relative regional differences in the opportunity-cost for owner-operators to remain in or leave the SBT fishery.
In most part, the New South Wales fleet consisted of multi-purpose vessels that combined poling of 3-8 year old tuna from October to January with trawling in the southeast trawl fishery during the SBT off-season. By 1983-84, as a result of increases in catches in South Australia and Western Australia, and a decrease in SBT breeding stocks, the New South Wales catch had fallen to less than 1000t. While alternative employment skills and opportunities were limited, fleet operations were readily redirected on a full-time basis to the southeast trawl fishery, which had a developing catch of orange roughy (Hoplostethus atlanticus).
The South Australia fleet targeting 3- to 5-year-old fish in January through May, consisted of larger specialist vessels including five purse-seine vessels. In 1968-69 landings were just over 3000t, but had increased 10 600t, or almost 2/3 of the national landings in 1983-84, the season prior the introduction of ITCQ-based management. Unlike New South Wales, there were few, if any, alternative fisheries to which the boats or operators could move, while alternative employment skills and opportunities were limited.
The newly-developed Western Australian fishery was dominated by small multi-purpose boats that used pole-and-line to target 2-to 3-year-old fish during November through May. When not poling for SBT, these
5 Superseded by the Australian Bureau of Agricultural and Resource Economics (ABARE). 6 Quantitative work by Kennedy and Watkins (1984, 1985) was important to this. Campbell (1984) and Wesney, Scott and Franklin (1985) reviewed some of the issues involved in considering the application of individual transferable catch quota to the southern bluefin tuna Fishery.

Campbell 139
vessels were used in a multi-species wet fish fishery. Just over 4000t of SBT was landed in 1983-84. Alternative employment opportunities were no better than those for southern New South Wales or for Port Lincoln. However, many of those who had entered the recently established Western Australia SBT fishery had working skills aside from fishing, and as a result, had more employment options available to them.
Larger SBT, whether for canning or the sashimi market, normally fetch a higher price per kilogram. As a result, SBT in New South Wales could be expected to be more valuable than the same volume of catch taken in South Australia or Western Australia. However, because of the regional differences discussed above, it could be expected that at the time of the introduction of ITCQ there would be region-by-region differences in the opportunity-cost of remaining in the SBT fishery consistent with such that: those in New South Wales > Western Australia > South Australia. These differences in opportunity-cost appear to have been important in the consequent restructuring of the fishery and the concentration of quota-ownership and fishing-effort in South Australia (Campbell, Brown and Battaglene 2000).
3.2 Changes in fleet-capacity: initial adjustment 1983-84 to 1985-86 3.2.1 Fleet-reduction By introducing ITCQ, it was expected that, because of higher unit-value, profit maximising quota-holders would maximise the value of their rights by targeting larger fish, which receive a higher price on the Sashimi market. As a result, it was expected that the fishery would move towards the use of long-lines and the operational focus would move eastwards as stocks return to the New South Wales coast.
A rapid and substantial restructuring of the tuna industry fleet followed the allocation of quota in 1984: over half of the boats that were allocated quota left7 the fishery in the first twelve months of the scheme, with quota from two-thirds of the boats being sold by the end of the 1985-86 financial year. This two-thirds-reduction in the number of boats accounted for one-third of the quota, as the boats taken out of the fishery had, on average, less quota and were likely to be older and smaller than those vessels retained in the fishing fleet (compare Tables 1 and 3).
More than half of the boats taken out of the fishery were from the Western Australia fleet, while the largest proportion of within-state adjustment was in New South Wales, where nearly all of the vessels allocated quota had left the fishery by the end of June 1986 (Table 2).
Table 3 Characteristics of ‘leaver’ boats from the southern bluefin tuna fishery
Details New South Wales
South Australia
Western Australia
Australia
Number of boats a 23 10 49 82 Average quota sold b (t)
71.8 (8.9)
107.1 (16.91)
36.9 (6.35)
55.5 (5.76)
Average value of quota sold b ($)
114 200 (8.90)
143 800 (18.13)
63 200 (7.97)
87 600 (6.11)
Average price received b ($/t)
1 590 (4.48)
1 342 (10.54)
1 712 (3.50)
1 579 (2.74)
Average assessed boat value b ($)
373 926 494 160 75 615 211 993
Average age, October 1984 a 11 12 13 12 Average length b (m)
21 (1.38)
19.3 (1.88)
12.8 (5.22)
15.92 (1.89)
Note: Numbers in parentheses are relative standard errors expressed as percentages of the estimates. Source: a Australian Fisheries Service. b Campbell and Wilkes 1988.
3.2.2 The nature of boats leaving the fishery The main characteristics of the SBT ‘leaver’ boats are summarized in Table 3. All boats were pole-boats and, on average, were built in 1972 with a hull length of about 16m. Vessels taken out of the New South Wales fishery were constructed more recently and were larger than the Western Australia boats. As most were non-specialist vessels, only minor modifications were required to make them serviceable in other fisheries.
Many of the boats that had not operated in the SBT fishery in 1983-84 had already left the fishery and were unlikely to have returned to the fishery in the near future. Therefore, the following discussion is confined to
7 Boats allocated more than 5 t of quota were assumed to have left the fishery once the quota allocated to the boat had been reduced through sale or lease to 5 t or less.

Australian Southern Bluefin Tuna
140
those 55 boats which had operated in the fishery 1983-84, had received an initial allocation of quota, and for which quota was sold (or at least reduced to below the threshold 5t by the end of June 1986).
Overall, there was little difference between the boats exiting the fishery, in terms of the average amount of quota, according to whether they had or had not operated in the SBT fishery in 1983-84 (Table 2). On a state basis, however, there were substantial differences: in South Australia, the small number of ‘leaver’ boats that had not fished for SBT in 1983-84 had on average been allocated almost half as much again as those that had operated in the fishery in 1983-84. The New South Wales and Western Australia boats exiting the fishery, which had not been used to fish for SBT in 1983-84, had received only half as much quota as those that had fished.
Although boats taken out of the fishery constituted two-thirds of the boats to which quota had been allocated, these boats were only allocated 4500t, or one-third of the total available quota. On average, boats for which quota were sold and taken out of the fishery, were allocated 55t of quota compared with the average of 176t allocated to boats which remained in the fishery. On average, the former Western Australia boats received 36t, which was substantially less quota than the quota allocated for the New South Wales and South Australia boats leaving the fishery, which were respectively 71t and 116t.
3.2.3 Impact on adjoining fisheries The effect of restructuring on other fisheries in the area differed between states. According to the estimates based on survey results (Campbell and Wilkes 1988), by July 1986 almost half the departing boats operating in the SBT fishery in 1983-84 had been sold (Table 4). Other than two boats from South Australia, all of the boats that had been sold were from Western Australia. The latter were sold for use in other local fisheries such as wet fish, shark, for use outside of fishing, or into fisheries outside of southern Western Australia. Owners of some of the Western Australian boats whichhad been sold replaced them with other boats for use in another local fishery aside from SBT. That is, of the 41 boats in Western Australia which had operated in the SBT fishery in 1983-84, 12 boats, or nearly 1/3, were removed from local fisheries.
All of the boats sold into another fishery either moved into one in which constraints on entry existed (therefore to replace existing boats) or into a fishery that was considered to be under-developed. This, in addition to the decrease in the number of fishing boats, implied that there is likely to have been an overall decrease in fishing effort rather than an increase of fishing effort.
In New South Wales and South Australia most departing boats that had operated in the SBT fishery in 1983-84 moved to a local fishery (Table 4). In many cases these boats had already operated in these same local fisheries on a part-time basis prior to leaving the SBT fishery. This most likely resulted in increased fishing effort in New South Wales and South Australia, although the lack of availability of SBT off New South Wales would have resulted in the movement of New South Wales vessels to full-time operations in the south-east trawl fishery, irrespective of the change in management.
Table 4 Use of ‘leaver’ boats which had fished in 1983-84 a
State Sold to other local fishery
Sold to non local fishery or non-fishing use
Total sold
Replaced and used in local
fishery
‘Leaver’ boat or replacement in local fishery
Left SBT
fishery New South Wales
0 0 0 0 7 7
South Australia
1 (81)
1 (81)
2 (57)
0 4 (23)
7
Western Australia
9 (16)
13 (12)
22 (10)
10 (8)
29 (6)
41
Total 10 (16)
14 (13)
24 (10)
10 (8)
40 (5)
55
a As at the end of June 1986. Numbers in parenthesis are relative standard error. Source: Campbell and Wilkes (1986)
3.2.4 Economic impact 3.2.4 .1 Change in fleet capitalisation Based on the 1984 assessed market value, the value of the boats exiting from the SBT fishery was approximately $A17.4 million. However not all of this amount is attributable to the 1984 management changes as one-third of the boats for which quota was sold did not operate in the fishery in 1983-84. Most of these boats, especially the 60% of the boats from New South Wales, would probably not have returned to the fishery, as a result of the decline in SBT availability on the east coast. Excluding these 27 boats, the value of the 55 boats exiting the fishery that had operated in the fishery in 1983-84 was $A9.15 million.

Campbell 141
There were two other difficulties in estimating how much of the capital-value of the exiting boat’s value should be apportioned to the SBT fishery. Other than in South Australia, the boats used to catch tuna were regularly used to catch other fish species. Therefore, the costs of the vessels were jointly shared between the different fishing operations. To measure the change in capitalisation following the exit of vessels it would be necessary to apportion the total boat-costs between the SBT and the other fisheries in which the boats were operated. However, while the quota for ten of the South Australia ‘leaver’ boats was sold, the capital-value of an additional six boats taken out of the South Australian fleet as a result of owners amalgamating their quota, was not included in the survey.
Of the 55 exiting boats used to fish for SBT in 1983-84, 48 did so on a part-time basis in conjunction with other fishing activities. The remaining seven boats exiting the fishery that had operated full-time in the fishery were from South Australia.
3.2.4.2 Economic impact on leavers Only two boats were sold in South Australia and none in New South Wales, and for reasons of confidentiality, it is not possible to properly assess any change in market value of exiting boats in South Australia. In Western Australia, the average value of exiting boats apparently dropped by $A32 000 or 40% (Table 5). While a number of elements may have been important in explaining this fall, the sudden increase in the number of boats on the market, and the decline in demand for vessels arising from the cutback in the Western Australian SBT fishery, would have been important.
In Western Australia most exiting vessels had fished for SBT in the year prior to the introduction of the quota-based management-plan. By comparison, most of the New South Wales boats had stopped fishing prior to the 1983-84 season, as a result of the reduced availability of SBT off the east coast.
Table 5 Change in average asset-value of Western Australia exiting boats - 1984-85 to 1985-86
Assessed value of boat ($A)
Sale value of boat ($A)
Sale value of quota ($A)
Sale value of boat plus quota ($A)
Increase in asset value ($A)
82 223 50 049 (10.25)
65 022 (7.65)
115 071 (10.02)
32 848 (35.55)
Source: Campbell, Brown and Battaglene (2000). Note: values in brackets are standard errors.
There appears to have been some variation in the price received for quota between the various state fisheries. In Western Australia, the estimated average price received was approximately $A1770/t, while in New South Wales and South Australia the respective average prices were around $A1600 and $A1300/t. For the fleet as a whole, the estimated average payment received per departing boat was approximately $A87 600. Anecdotal evidence indicates that the price received for quota early in the first weeks of the new management plan was much lower than the average price8. The fall in boat-value was more than offset by the sale of the associated SBT quota. Thus, the estimated average change in asset-value per boat was an increase of $A33 000, or 40%. Because most of the boats were sold within twelve months of their assessed valuation, no allowance is made for depreciation; otherwise the estimated improvement in asset-value would have been greater.
The impact on the income of those owner-operators, who had left the SBT fishery after the introduction of individual transferable quota, but had not retired, was estimated by comparing the 1983-84 combined taxable income of the leavers and their spouses with their 1985-86 income (Table 6).
The average taxable family-income for the New South Wales and Western Australia owner-operators was estimated to have increased in real terms, on a per boat basis, by 13%. The average family-income per boat in New South Wales was estimated to have increased by 23%, and that in Western Australia by 8%. In this latter state, not only is the average increase in taxable-income less, but the standard error is also greater. These two statistics indicate that, when compared with New South Wales, a higher proportion of Western Australian owner-operators were likely to have been worse off following the introduction of ITCQ.
3.3 Further reductions in global and national quota Research by Hampton and Majkowski (1986) indicated that in spite of the restrictions on allowable catch in 1984-85 and 1985-86 the parent-stocks continued to fall. Further national quota-reductions were introduced in the 1986-87 season for both Australia and Japan. The Japanese quota was reduced from 23 150t to 19 500t (Table 7). While the nominal Australian quota was retained at 14 500t, the Japanese industry provided funds to enable the Tuna Boat Owners Association of Australia to lease and withhold from capture 3000t of Australian
8 Some banks, uncertain of the affects of the new management plan, withdrew loan facilities to operators in the SBT fishery in Western Australia. This apparently led to forced sales by some quota holders. The Western Australian Government, by acting as guarantor to these loans, provided short-term stability to the Western Australian quota market.
Australian Southern Bluefin Tuna
142
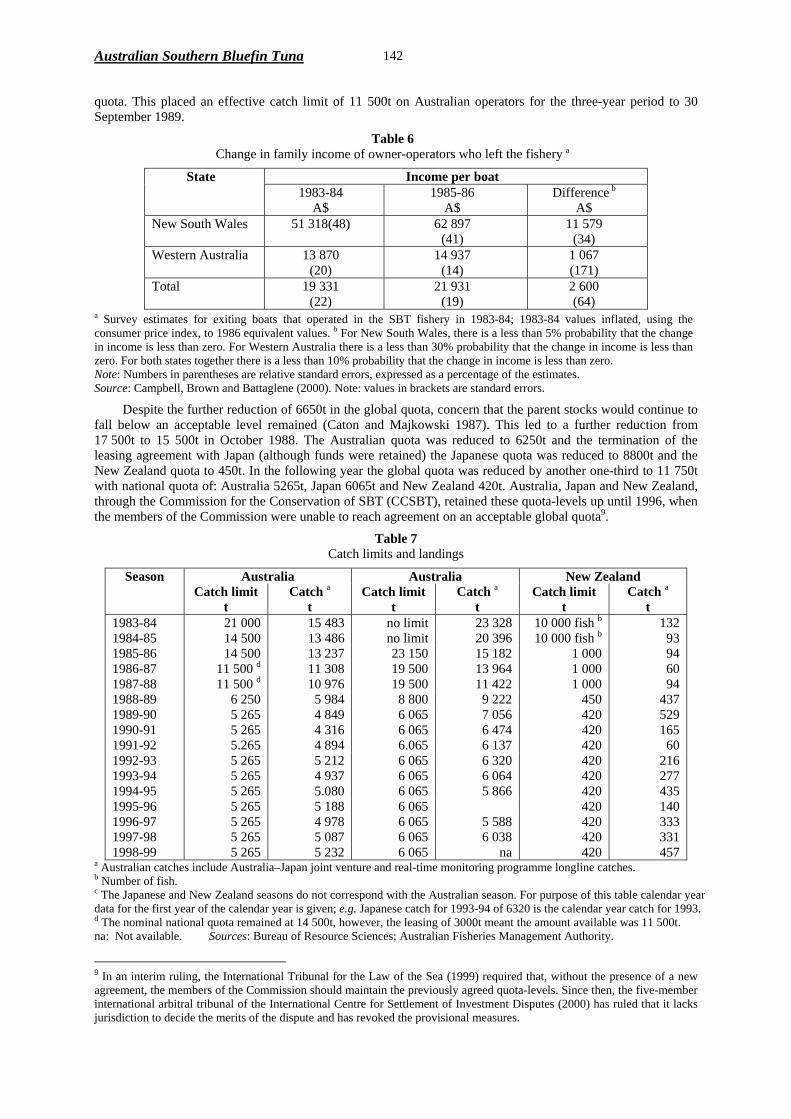
quota. This placed an effective catch limit of 11 500t on Australian operators for the three-year period to 30 September 1989.
Table 6 Change in family income of owner-operators who left the fishery a
State Income per boat 1983-84
A$ 1985-86
A$ Difference b
A$ New South Wales 51 318(48) 62 897
(41) 11 579
(34) Western Australia 13 870
(20) 14 937
(14) 1 067 (171)
Total 19 331 (22)
21 931 (19)
2 600 (64)
a Survey estimates for exiting boats that operated in the SBT fishery in 1983-84; 1983-84 values inflated, using the consumer price index, to 1986 equivalent values. b For New South Wales, there is a less than 5% probability that the change in income is less than zero. For Western Australia there is a less than 30% probability that the change in income is less than zero. For both states together there is a less than 10% probability that the change in income is less than zero. Note: Numbers in parentheses are relative standard errors, expressed as a percentage of the estimates. Source: Campbell, Brown and Battaglene (2000). Note: values in brackets are standard errors.
Despite the further reduction of 6650t in the global quota, concern that the parent stocks would continue to fall below an acceptable level remained (Caton and Majkowski 1987). This led to a further reduction from 17 500t to 15 500t in October 1988. The Australian quota was reduced to 6250t and the termination of the leasing agreement with Japan (although funds were retained) the Japanese quota was reduced to 8800t and the New Zealand quota to 450t. In the following year the global quota was reduced by another one-third to 11 750t with national quota of: Australia 5265t, Japan 6065t and New Zealand 420t. Australia, Japan and New Zealand, through the Commission for the Conservation of SBT (CCSBT), retained these quota-levels up until 1996, when the members of the Commission were unable to reach agreement on an acceptable global quota9.
Table 7 Catch limits and landings
Season Australia Australia New Zealand Catch limit
t Catch a
t Catch limit
t Catch a
t Catch limit
t Catch a
t 1983-84 21 000 15 483 no limit 23 328 10 000 fish b 132 1984-85 14 500 13 486 no limit 20 396 10 000 fish b 93 1985-86 14 500 13 237 23 150 15 182 1 000 94 1986-87 11 500 d 11 308 19 500 13 964 1 000 60 1987-88 11 500 d 10 976 19 500 11 422 1 000 94 1988-89 6 250 5 984 8 800 9 222 450 437 1989-90 5 265 4 849 6 065 7 056 420 529 1990-91 5 265 4 316 6 065 6 474 420 165 1991-92 5.265 4 894 6.065 6 137 420 60 1992-93 5 265 5 212 6 065 6 320 420 216 1993-94 5 265 4 937 6 065 6 064 420 277 1994-95 5 265 5.080 6 065 5 866 420 435 1995-96 5 265 5 188 6 065 420 140 1996-97 5 265 4 978 6 065 5 588 420 333 1997-98 5 265 5 087 6 065 6 038 420 331 1998-99 5 265 5 232 6 065 na 420 457
a Australian catches include Australia–Japan joint venture and real-time monitoring programme longline catches. b Number of fish. c The Japanese and New Zealand seasons do not correspond with the Australian season. For purpose of this table calendar year data for the first year of the calendar year is given; e.g. Japanese catch for 1993-94 of 6320 is the calendar year catch for 1993. d The nominal national quota remained at 14 500t, however, the leasing of 3000t meant the amount available was 11 500t. na: Not available. Sources: Bureau of Resource Sciences; Australian Fisheries Management Authority.
9 In an interim ruling, the International Tribunal for the Law of the Sea (1999) required that, without the presence of a new agreement, the members of the Commission should maintain the previously agreed quota-levels. Since then, the five-member international arbitral tribunal of the International Centre for Settlement of Investment Disputes (2000) has ruled that it lacks jurisdiction to decide the merits of the dispute and has revoked the provisional measures.
Campbell 143
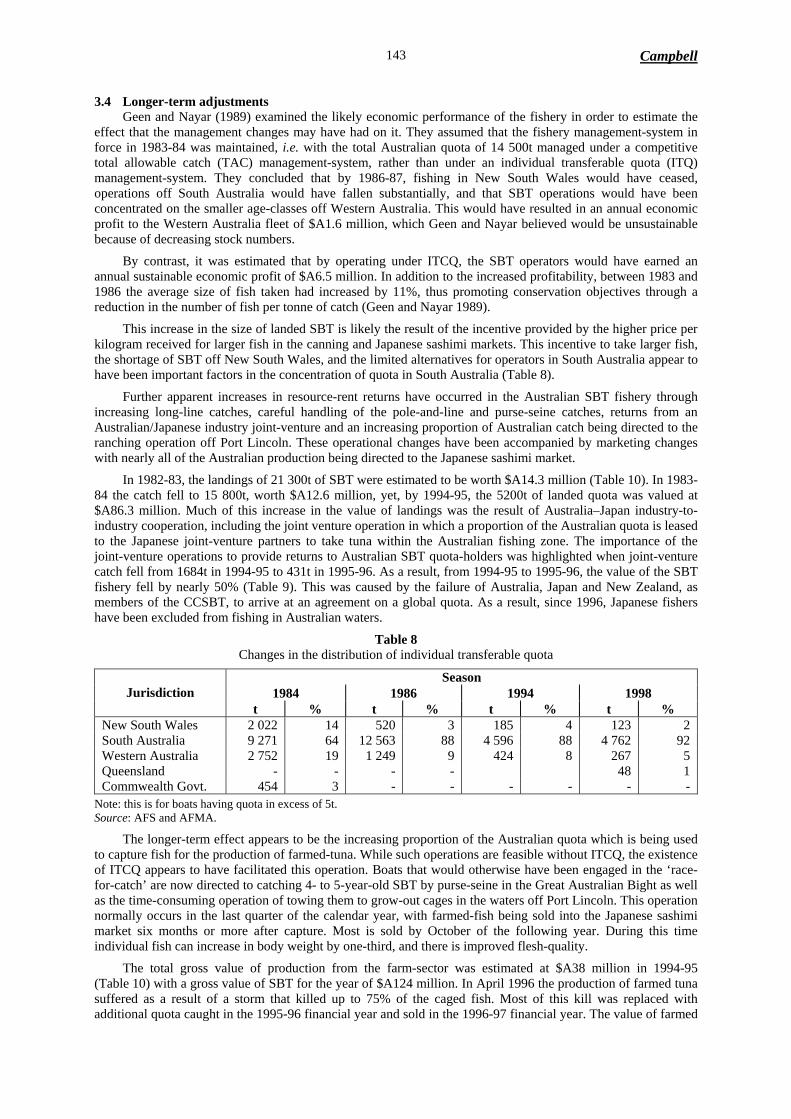
3.4 Longer-term adjustments Geen and Nayar (1989) examined the likely economic performance of the fishery in order to estimate the effect that the management changes may have had on it. They assumed that the fishery management-system in force in 1983-84 was maintained, i.e. with the total Australian quota of 14 500t managed under a competitive total allowable catch (TAC) management-system, rather than under an individual transferable quota (ITQ) management-system. They concluded that by 1986-87, fishing in New South Wales would have ceased, operations off South Australia would have fallen substantially, and that SBT operations would have been concentrated on the smaller age-classes off Western Australia. This would have resulted in an annual economic profit to the Western Australia fleet of $A1.6 million, which Geen and Nayar believed would be unsustainable because of decreasing stock numbers.
By contrast, it was estimated that by operating under ITCQ, the SBT operators would have earned an annual sustainable economic profit of $A6.5 million. In addition to the increased profitability, between 1983 and 1986 the average size of fish taken had increased by 11%, thus promoting conservation objectives through a reduction in the number of fish per tonne of catch (Geen and Nayar 1989).
This increase in the size of landed SBT is likely the result of the incentive provided by the higher price per kilogram received for larger fish in the canning and Japanese sashimi markets. This incentive to take larger fish, the shortage of SBT off New South Wales, and the limited alternatives for operators in South Australia appear to have been important factors in the concentration of quota in South Australia (Table 8).
Further apparent increases in resource-rent returns have occurred in the Australian SBT fishery through increasing long-line catches, careful handling of the pole-and-line and purse-seine catches, returns from an Australian/Japanese industry joint-venture and an increasing proportion of Australian catch being directed to the ranching operation off Port Lincoln. These operational changes have been accompanied by marketing changes with nearly all of the Australian production being directed to the Japanese sashimi market.
In 1982-83, the landings of 21 300t of SBT were estimated to be worth $A14.3 million (Table 10). In 1983-84 the catch fell to 15 800t, worth $A12.6 million, yet, by 1994-95, the 5200t of landed quota was valued at $A86.3 million. Much of this increase in the value of landings was the result of Australia–Japan industry-to-industry cooperation, including the joint venture operation in which a proportion of the Australian quota is leased to the Japanese joint-venture partners to take tuna within the Australian fishing zone. The importance of the joint-venture operations to provide returns to Australian SBT quota-holders was highlighted when joint-venture catch fell from 1684t in 1994-95 to 431t in 1995-96. As a result, from 1994-95 to 1995-96, the value of the SBT fishery fell by nearly 50% (Table 9). This was caused by the failure of Australia, Japan and New Zealand, as members of the CCSBT, to arrive at an agreement on a global quota. As a result, since 1996, Japanese fishers have been excluded from fishing in Australian waters.
Table 8 Changes in the distribution of individual transferable quota
Season 1984 1986 1994 1998
Jurisdiction
t % t % t % t % New South Wales 2 022 14 520 3 185 4 123 2 South Australia 9 271 64 12 563 88 4 596 88 4 762 92 Western Australia 2 752 19 1 249 9 424 8 267 5 Queensland - - - - 48 1 Commwealth Govt. 454 3 - - - - - -
Note: this is for boats having quota in excess of 5t. Source: AFS and AFMA.
The longer-term effect appears to be the increasing proportion of the Australian quota which is being used to capture fish for the production of farmed-tuna. While such operations are feasible without ITCQ, the existence of ITCQ appears to have facilitated this operation. Boats that would otherwise have been engaged in the ‘race-for-catch’ are now directed to catching 4- to 5-year-old SBT by purse-seine in the Great Australian Bight as well as the time-consuming operation of towing them to grow-out cages in the waters off Port Lincoln. This operation normally occurs in the last quarter of the calendar year, with farmed-fish being sold into the Japanese sashimi market six months or more after capture. Most is sold by October of the following year. During this time individual fish can increase in body weight by one-third, and there is improved flesh-quality.
The total gross value of production from the farm-sector was estimated at $A38 million in 1994-95 (Table 10) with a gross value of SBT for the year of $A124 million. In April 1996 the production of farmed tuna suffered as a result of a storm that killed up to 75% of the caged fish. Most of this kill was replaced with additional quota caught in the 1995-96 financial year and sold in the 1996-97 financial year. The value of farmed

Australian Southern Bluefin Tuna
144
tuna was maintained through 1995-96 to 1996-97, but it more than doubled in 1997-98, and doubled again in 1998-99, to $A167 million.
Table 9 Changes in gross value of the Australian southern bluefin tuna fisherya
Wild caught Farmed Gross totala Year Value
$A m Quantity
t Value $A m
Quantity t
Value $A m
Quantity t
1982-83 14.3 21 300 14.3 21 300 1983-84 12.6 15 800 12.6 15 800 1984-85 16.2 13 500 16.2 13 500 1986-87 23.0 b 11 800 23.0 b 11 800 1987-88 18.1 b 10 100 18.1 b 10 100 1988-89 20.3 6 000 20.3 6 000 1989-90 60.4 c 5 000 60.4 c 5 000 1990-91 55.5 4 300 55.5 4 300 1991-92 63.4 5 100 1.8 100 65.2 5 200 1992-93 98.0 4 900 10.2 500 108.2 15 100 1993-94 80.3 4 700 24.2 1 300 104.5 6 000 1994-95 86.3 5 200 38.0 1 900 124.0 7 100 1995-96 45.9 5 100 39.9 2 000 85.8 7 100 1996-97 40.9 5 900d 40.2 2 100 81.1 8 000 1997-98 40.9 4 800 87.2 5 100 128.1 9 900 1998-99 56.8 5 600d 166.7 6 400 223.5 12 000
a No allowance is made in these figures for wild caught catch that goes into the cage-raising operation at Port Lincoln. b Includes $A7.57 million paid by Japanese industry to the Australian industry to reduce the annual catch of SBT by 3000t for three years. As the Australian quota, along with the global quota was substantially reduced in 1988-89, and there was no additional annual 3000t decrease of Australian catch in that year, the payment is distributed over two rather than three years. c The Australia–Japan joint venture commenced this year. The value of Australian quota taken by the joint venture is based on the price received in Japan less transport and marketing cost. d The apparent discrepancy between catch and quota limits is because the fishing season is not synchronous with the financial year. Source: ABARE (2000) and earlier editions.
3.5 International co-operative fishing arrangements under ITCQ In 1986 an agreement was made between Japanese industry and South Australia quota-holders for the South Australian industry to forgo catching 3000t of its quota in the 1986-87, 1987-88 and 1988-89 seasons. In return, those forgoing catching quota received a total compensation of $A7.57 million from the Japanese industry. The pay-off to the Japanese tuna long-liners was: that tuna not taken by Australian operators would later become accessible to Japanese long-line operators.
In 1988-89, continuing concern over parent stock levels led to a reduction in global and in national quota levels. As a result the Australian quota was reduced to 6250t and the industry-to-industry agreement was suspended. Australian operators did not forgo catching any of their quota in 1988-89, the third year of the agreement, although the initial payment was retained.
The 1988-89 season saw the introduction of a new element into the fishery, namely the use of Australian quota by Japanese owned and crewed long-line boats to take SBT in the Australian fishing zone in a joint-venture with Australian industry. This operation peaked in 1992-93, when more than 50% of quota was taken by the joint-venture operators. A further change was the use of Australian quota by the Japanese fleet operating on the high-seas beyond the Australian fishing zone. This was part of a programme using Japanese as well as Australian quota to take catch as part of a real-time monitoring-programme10. As a result of these two programmes, Japanese vessels took 65% of the Australian quota in 1992-93.
10 The Real Time Monitoring Programme (RTMP) was used to provide data on catch, effort and size composition for a small component of the Japanese long-line fleet operating on the high-seas. The availability of this programme did improve the data-access and timeliness in provision of the data.

Campbell 145
These changes resulted in a substantial increase in the net-returns enjoyed by the Australian quota-holders involved in these operations11. The conditions of this agreement also included $A500 000 over three years for SBT research, an annual levy of $A1.4 million for monitoring and enforcement, training of Australian crew in long-lining, and funds for research on SBT farming. In addition to the Australian quota used in the joint-venture, some additional Australian quota was used by Japanese vessels to catch SBT outside the Australian fishing zone for purposes of real time monitoring of fish stocks. The value of the catch taken under the Joint Agreement and the Real-Time Monitoring-Programme is presented in Table 10.
The last year of real-time monitoring and joint-venture operations was 1994-95, when Japanese boats took 37% of the Australian quota. The reason for the cessation of these co-operative operations was the failure of Japan and Australia to come to an agreement on the global quota. In the meantime, Australia has continued to operate according to the Australian national quota arrived at within the CCSBT.
Table 10 Catch under Joint-venture and the Real-Time Monitoring programmes
Operations 1988-89 1989-90 1990-91 1991-92 1992-93 1993-94 1994-95 t a 684 400 881 2057 2735 2299 1295 Joint
venture $A b 37 620 22 000 28 190 37 643 74 726 17 128 35 379 t a 300 800 650 270 650 RTMP c
$A b 9893 14 640 17 759 7377 17 759 t a 684 400 1181 2857 3385 2569 1945 Total
$A b Source: a Landings are provided by Agriculture, Forests and Fisheries Australia. b Unit values used to estimate total values are from ABARE (1996) and previous years. Note that as ABARE
volume values are for financial year not fishing season, they have not been used in the table. c Real Time Monitoring programme.
While not directly related to the SBT fishery ITCQ management programme, Japanese fishers have been able to take SBT within the Australian fishing zone (Table 11). This access has been particularly important as it has enabled Japanese operators to target large fish off south-east Tasmania.
Table 11 Catch and value of Japanese quota taken by Japanese operators in the Australian fishing zone
1986-87 1987-88 1988-89 1989-90 1990-91 1991-92 1992-93 1993-94 1994-95 1995-96 Catch (t)
1134.4 1026.6 2308.2 1693.1 660.6 386.8 804.4 436.3 410.7 358.8
Value ($m)
62.5 61.7 126.3 72.9 25.3 12.2 31.6 17.9 15.7 13.1
Source: Hogan, Van Landegham and Topp (1997).
Japanese fishers were excluded from fishing within the Australian fishing zone in 1984-85 as well as since 1995-96 as a result of the failure to agree on the amount of global quota. Acting outside of the Commission for the Conservation of Southern Bluefin Tuna, the Japanese fishery took an additional 2000t of SBT in 1999 and as a result, Australia and New Zealand took Japan to the International Tribunal for the Law of the Sea. In 1999, the tribunal placed an interim injunction on Japan taking additional SBT, even if the catch were to be part of an experimental fishing programme. The Tribunal ruled that the members of the CCSBT ensure they maintain their annual catch at the quantities last agreed to within the Commission. The Tribunal ruling requires Japan to treat the ‘experimental’ catch as part of its national quota of 6065 t. The 714t from the ‘experimental fishing programme’ was counted against the 1999 allocation of 6065t, with the remaining 1484t counted against the 2000 allocation of 6065t.
On 7 August 2000, a five-member international arbitral tribunal invoked the interim provisional measures imposed on Japan by the International Tribunal for the Law of the Sea. The Tribunal noted that the successful settlement of the dispute would be promoted by the parties abstaining from any unilateral act that may aggravate it (International Centre for Settlement of Investment Disputers 2000). Since the interim decision, the members of the CCSBT have moved closer to resolving the issues on which the original dispute was based.
11 It is also likely that these transfers in access to quota resulted in an improvement in the economics of the over-capitalised Japanese fleet.

Australian Southern Bluefin Tuna
146
4 CONCENTRATION OF OWNERSHIP 4.1 Status prior to the programme In 1981-82, the Australian SBT fishery consisted of 117 operators, although, on the 1 October 1984, 136 boats were allocated SBT quota allocation in excess of 5t. Of these 136 quota-holding boats, 26 (19%) were in New South Wales, 40 (29%) in South Australia, and 70 (52%) in Western Australia. In the three years prior to the programme the average seasonal catch by the Australian fleet was 18 700t, with an average global catch of 43 600t.
Without action being taken in Australia, the focus of operation for the Australian SBT fleet is likely to have moved to targeting of the 2- to 3-year-old (juvenile) fish off Western Australia This would have likely lead to declining catch, reduced gross returns and the eventual collapse of the fishery. At the global level, it was recognised that the global catch would have to be reduced, and researchers proposed that the parent stocks be allowed to recover to their 1980 levels by the year 2020.
4.2 Restrictions on transfer of ownership While there are no restrictions on the lease or sale of Australian SBT quota within Australia, quota can only be used by a boat operator who either holds, or is operating on behalf of the holder of, a Commonwealth fishing permit. However, the Australian Fisheries Management Authority (AFMA) has placed a requirement on the long-liners (operating in waters off southeastern Australia during those periods of the year when southern bluefin tuna are likely to be taken) to hold a minimum SBT-quota of 500kg (AFMA 2000).
4.3 Effects of the programme A number of changes occurred following the introduction of ITCQ into the SBT fishery. These included structural changes to the national fishery, to fishing technology, and changes in market provision and product. While many of these changes may not have been the direct result of the introduction of ITCQ, it is likely that the management-changes facilitated these outcomes. In addition, without changes in the management of the fishery, the fishery would have collapsed. Without an ITCQ programme, the benefits received by leavers on exiting the fishery would not have been possible.
The major structural changes observed in the fishery were the immediate concentration of quota-ownership and fishing operations to South Australia, the cooperation between Australian and Japanese fishing operations, and the later return of SBT to waters off the coast of New South Wales. The cooperation between Australia and Japan included the leasing and withdrawal from the global fishery of Australian quota by the Japanese fishing industry in the 1986-87 and 1987-88 Australian fishing seasons, the use of Australian quota by the Japanese high-seas fleet for the purpose of real-time monitoring of catch and the Australia-Japan joint-venture long-line fishery. The closure of the real-time monitoring and the Australia-Japan joint-venture programmes has seen most of Australia’s quota shift to the SBT grow-out ranching operations off Port Lincoln in South Australia. These farm operations were assisted by Japanese finance and technology.
Changes in the use of fishing technology included the use of long-line fishing methods off the New South Wales coast, with the quantity of landings taken by long-line increasing from 15t in 1990-91, to 648t in 1997-98 (Table 12), or 12% of SBT quota. The use of purse-seine to capture and transport live fish to the fish-farms off Port Lincoln, and the use of sea cages to grow out and improve the quality (intra-muscle marbling) of juvenile fish. These changes in fishing technology included changes in product and in marketing. Wild-caught landings are no longer being directed to canning in Australian, or shipment to Italy, rather now to the Japanese sashimi market either directly, or following grow-out activities.
In addition to a gross increase in the value of SBT product (Table 9), there has been an increase in realised rent-returns to the fishery to the benefit of fishers, tuna farmers and society as a whole. The expected rent-returns at the introduction of the management plan were important in affecting the price paid to those owner-operators leaving the fishery, and assisted the structural adjustments that occurred in the fishery. While there has been a recovery of SBT stocks off eastern Australia, the rate of recovery in fishing operations is not as great as was expected. The degree to which landings increase off eastern Australia under the current management plan will depend on the relative profitability of east coast operations compared to elsewhere. To-date, SBT quota-holdings and operations continue to be concentrated off South Australia. A possible factor in that this is the high growth-rates obtained from 4- to 5-year-old SBT in the grow-out cages more than compensates for any improvement in the return on quota-holdings from taking larger fish.
5. DISCUSSION 5.1 Reduction in fleet-capacity 5.1.1 Objectives The purpose of the 1984 ITCQ-based management plan was to (a) conserve fish stocks while (b) meeting an economic efficiency objective and to move closer to optimal resource. The introduction of the 1984
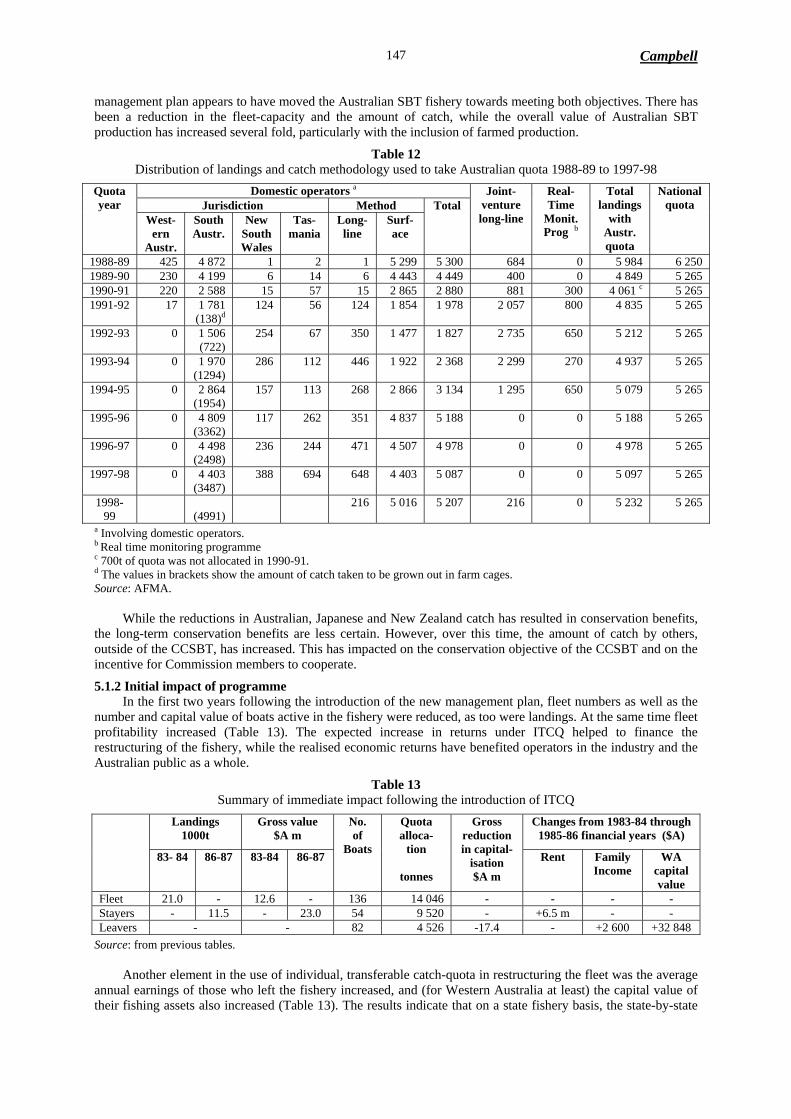
Campbell 147
management plan appears to have moved the Australian SBT fishery towards meeting both objectives. There has been a reduction in the fleet-capacity and the amount of catch, while the overall value of Australian SBT production has increased several fold, particularly with the inclusion of farmed production.
Table 12 Distribution of landings and catch methodology used to take Australian quota 1988-89 to 1997-98
Domestic operators a Jurisdiction Method
Quota year
West-ern
Austr.
South Austr.
New South Wales
Tas- mania
Long- line
Surf-ace
Total Joint-
venture long-line
Real-Time
Monit. Prog b
Total landings
with Austr. quota
National quota
1988-89 425 4 872 1 2 1 5 299 5 300 684 0 5 984 6 250 1989-90 230 4 199 6 14 6 4 443 4 449 400 0 4 849 5 265 1990-91 220 2 588 15 57 15 2 865 2 880 881 300 4 061 c 5 265 1991-92 17 1 781
(138)d 124 56 124 1 854 1 978 2 057 800 4 835 5 265
1992-93 0 1 506 (722)
254 67 350 1 477 1 827 2 735 650 5 212 5 265
1993-94 0 1 970 (1294)
286 112 446 1 922 2 368 2 299 270 4 937 5 265
1994-95 0 2 864 (1954)
157 113 268 2 866 3 134 1 295 650 5 079 5 265
1995-96 0 4 809 (3362)
117 262 351 4 837 5 188 0 0 5 188 5 265
1996-97 0 4 498 (2498)
236 244 471 4 507 4 978 0 0 4 978 5 265
1997-98 0 4 403 (3487)
388 694 648 4 403 5 087 0 0 5 097 5 265
1998- 99
(4991)
216 5 016 5 207 216 0 5 232 5 265
a Involving domestic operators. b Real time monitoring programme c 700t of quota was not allocated in 1990-91. d The values in brackets show the amount of catch taken to be grown out in farm cages. Source: AFMA. While the reductions in Australian, Japanese and New Zealand catch has resulted in conservation benefits, the long-term conservation benefits are less certain. However, over this time, the amount of catch by others, outside of the CCSBT, has increased. This has impacted on the conservation objective of the CCSBT and on the incentive for Commission members to cooperate.
5.1.2 Initial impact of programme In the first two years following the introduction of the new management plan, fleet numbers as well as the number and capital value of boats active in the fishery were reduced, as too were landings. At the same time fleet profitability increased (Table 13). The expected increase in returns under ITCQ helped to finance the restructuring of the fishery, while the realised economic returns have benefited operators in the industry and the Australian public as a whole.
Table 13 Summary of immediate impact following the introduction of ITCQ
Landings 1000t
Gross value $A m
Changes from 1983-84 through 1985-86 financial years ($A)
83- 84
86-87
83-84
86-87
No. of
Boats
Quota alloca-
tion
tonnes
Gross reduction in capital-
isation $A m
Rent
Family Income
WA capital value
Fleet 21.0 - 12.6 - 136 14 046 - - - - Stayers - 11.5 - 23.0 54 9 520 - +6.5 m - - Leavers - - 82 4 526 -17.4 - +2 600 +32 848
Source: from previous tables. Another element in the use of individual, transferable catch-quota in restructuring the fleet was the average annual earnings of those who left the fishery increased, and (for Western Australia at least) the capital value of their fishing assets also increased (Table 13). The results indicate that on a state fishery basis, the state-by-state

Australian Southern Bluefin Tuna
148
differences in the rates at which quota-holders left the fishery, is consistent to the relative differences in the opportunity-cost of remaining in the fishery. It could be expected that if the same economic incentive would have existed for operators within each state fishery and, as a result, the same relative behavioural responses would have been observable within each state. The increase in the average family-income observed for Western Australian ‘leavers’ is consistent with this.
In spite of these benefits, the management changes introduced in 1984 did cause stress and disruption to individuals and their families involved with the SBT fishery. However, compared to the possible impact of other alternatives, such as input-controls or use of a total-quota (see Section 3.4.1), the disruption and economic loss to operators and their families is likely to have been less. In Western Australia, the Commonwealth government also provided financial assistance for restructuring.
5.1.3 Ongoing effects There have been a number of changes in the Australian SBT fishery following the introduction of ITCQ on 1 October 1984, in particular the restructuring and the reduction of annual landings to around 5000t and the substantial increase in returns to individual operators and to the fishery as a whole. This has come about due to: a bilateral agreement between Australian and Japanese operators in the use of Australian quota both within the Australian fishing zone and on the high seas; the development and growth of tuna-farming; and changes in marketing. The institutional structure provided by ITCQ is likely to have been important in facilitating these outcomes. The fall of the Australian dollar over this time against the Japanese yen has also been important in the improvement of the value of SBT product.
In addition, under their bilateral agreement, Japan provided expert input to the Australian long-lining operations and to the growing-out, or farming, of juvenile SBT. The withdrawal of the Japanese SBT fishing industry from the joint Australia-Japan SBT operations in 1996, saw the value of the SBT production fall from $A128 million in 1995-95, to $A85.8 and $A81.1 million in 1995-96 and 1996-97. However, by 1997-98 and 1998-99, the value of Australian SBT production had increased to $A128.1 and $A223.5 million respectively. The reason for this recovery has been the transfer of over 90% of the quota-catch to the grow-out ponds in South Australia. As a result, the assumed value of SBT landings were, respectively, $A40.9 million and $A56.8 million12.
At the global level, there were further reductions in the global quota in 1986-87 from 38 650t to 19 500t, and finally to 11 750t (the current level) in 1989-90. Questions remain in regard to whether the CCSBT’s conservation objective, that parent stocks be allowed to recover to the 1980 level by 2020, will be achieved. While the substantial catch reductions by CCSBT members would have had a positive long-term effect on SBT stocks, it is questionable whether the stock will achieve the agreed performance objectives. While there is a general agreement among the members of the CCSBT on the current status of stocks, the members disagree on future stock-projections, with projections ranging from significant stock-rebuilding to further declines in stocks under current harvest-levels. Australian estimates indicate that a 15% reduction in catch would provide a 50% probability of recovery, and a 35% reduction would give a 75% probability of recovery (Hayes 1997, pp. 16-17).
Globally, there was a two-thirds reduction in reported southern bluefin tuna landings to 17 700t between 1983 and 1987. However, the build-up in stock numbers and the limitation of the make-up of the membership of the CCSBT has provided an incentive for others to enter and to increase their effort in the SBT fishery. As a result, the estimated global catch of SBT in 1998 was 19 240t, with an additional 1460t catch by the Japanese fleet beyond their national quota. This is a one-third increase in the global quota set by the CCSBT.
Kennedy (1999) found there is little incentive for Australian, Japan and New Zealand to co-operate as members of the CCSBT in setting global TAC-levels as long as SBT fishers outside of the CCSBT are taking catch in addition to the CCSBT global quota. Bioeconomic modelling by Kennedy, Davies and Cox (1999) indicates that reductions in present catch can lead to an increase in future catch and an increase in the future value of the fishery.
5.2 Concentration of ownership The introduction of ITCQ into the Australian SBT fishery in October 1984 has been followed by a number of structural and operational changes. In October 1984, 64% of the quota allocation went to operators in South Australia, with 19% to those in Western Australia, and 14% to those in New South Wales. In 1998, South Australia operators had increased their proportion of quota by almost 50% to 92% of the national quota. In spite of the increasing availability of catch off the New South Wales coast and the expected shift in quota to the Australian east coast, only 2% of the quota was held in that State. The retention of quota appears to be the result of the quantum jump in the value of sales of farmed-tuna over what would have been received for quota-catch.
12 This raises an interesting question in regard to the distribution of resource-rent, whether it is attributable to the scarcity of SBT or the scarcity of suitable farming areas. It is probable that ABARE’s assumed value is an under estimate.

Campbell 149
In operational terms, there has been a reduction in landings to one-third of what they were in the season prior to the introduction of quota, there has been a reduction in the capitalisation of the fleet and there have been substantive change in the technology used to catch and produce sashimi-quality SBT products (Table 14). These changes on the production-side were also accompanied by a shift on the demand-side with the diversion of product from canning to the high value Japanese sashimi market.
Table 14 The distribution of Australian SBT quota at October 1988, November 1999
New South Wales
South Australia Western Australia Queensland
Quota distribution October ‘84
2 022t (14%) 9 271t (64%) 2 752t (19%) -
Quota distribution November ‘99
123t (2.4%) number of owners
4
4762 (91.6%) number of owners
33
267 (5.1%) number of owners
13
48 (0.9%) number of owners
3 Note, this is for quota-holders holding in excess of 5t, seven boats having received 5t or less. While the statistics presented in this paper have been on the basis of those holding in excess of 5 tonne of quota, at November 1999, 44 owners held 5t or less of quota, which accounted for 65t. Source: AFMA
6. LITERATURE CITED ABARE – Australian Bureau of Agricultural and Resource Economics 1994. Commodity Statistical Bulletin,
ABARE, AGPS, Canberra. ABARE – Australian Bureau of Agricultural and Resource Economics 1996. Fishery Statistics 1996, ABARE,
AGPS, Canberra. ABARE – Australian Bureau of Agricultural and Resource Economics 1999. Commodity Statistical Bulletin,
ABARE, AGPS, Canberra. AFMA - Australian Fisheries Management Authority 2000. New management arrangements for east coast tuna
to minimise the incidental catch of SBT, AFMA News, 4, issue 3, pp 1 and 8. BAE – Bureau of Agricultural Economics 1983. BAE warning on ‘commercial extinction’ of tuna, Australian
Fisheries, 8, pp. 12-13, AGPS, Canberra. BAE – Bureau of Agricultural Economics 1986. Southern Bluefin Tuna Survey 1980-81 and 1981-82, Project
no. 62300, Bureau of Agricultural Economics, Canberra. Campbell, D. 1984. Individual Transferable Catch Quotas, their Role use and Application, Fishery Report no.
11, Northern Territory Department of Primary Production, Darwin. Campbell, D. and L. Wilkes 1988. Report to the Australian fisheries Service on those leaving the southern
bluefin tuna fishery. ABARE, Canberra. Campbell, D., T. Battaglene and D. Brown 1996. Use of individual transferable quotas in Australian fisheries.
Paper presented at the International Institute of Fisheries Economics and Trade International Workshop on Assessment and distribution of Harvest Quotas in Fisheries, Aalesund, Norway, 8-11 July, 1966.
Campbell, D., D. Brown and T. Battaglene 2000. Individual transferable catch quotas: Australian experience in the southern bluefin tuna fishery, Marine Policy 24(2):109–117.
Caton, A. 1987. Australia fills SBT quota in 1986-s87 season, Australian Fisheries 46(12):12-14. Caton, A. and J. .Majkowski 1987. Warning issued on global catch limits, Australian Fisheries 42(3):278-91. Geen, G. and M. Nayar 1989. Individual Transferable Quotas and the Southern Bluefin Tuna Fishery, ABARE
Occasional Paper no. 105, AGPS, Canberra. Grainger, G. 1988. Australian Fisheries and Administrative Appeals Tribunal, Department of Primary Industries
and Energy, AGPS, Canberra. Hayes, E.A. 1997. A Review of the Southern Bluefin Tuna Fishery: Implications for Ecologically Sustainable
Management, Traffic Oceania, Sydney. Hampton, J. and J. Majkowski 1986. Scientists fear SBT problems worsening, Australian Fisheries, 45(12):6-9. Hogan, L., K. Van Landegham and V. Topp 1997. Access Fee Arrangements for Japanese Fishing Vessels in the
Australian Fishing Zone, ABARE report to the Fisheries Resources Research Fund, Canberra. Industries Assistance Commission 1984. Southern Bluefin Tuna, Industries Assistance Commission Report,
AGPS, Canberra. International Tribunal for the Law of the Sea 1999. Southern Bluefin Case (New Zealand v. Japan; Australia v.
Japan), Requests for provisional measures (nos. 3 and 4). Rendered under Annex VII of the United Nations Convention on the Law of the Sea.

Australian Southern Bluefin Tuna
150
International Centre for the Settlement of Investment Disputes 2000. Southern Bluefin Tuna Case (Australia and New Zealand v. Japan), Awarded on jurisdiction and admissibility. Rendered under Annex VII of the United Nations Convention on the Law of the Sea; www.worldbank.org/icsid.
Kennedy, J. 1999. A dynamic model of co-operative and non-co-operative harvesting of southern bluefin tuna with an open access fringe, 1999 World Conference on Natural Resource Modelling, Saint Mary’s University, Halifax, Canada, 23-25 June.
Kennedy, J.O.S. and J.W. Watkins 1984. Optimal Quotas for the Southern Bluefin Tuna Fishery, Economic Discussion Papers no. 4/84, Latrobe University.
Kennedy, J.O.S. and J.W. Watkins 1985. Modelling the economic returns of SBT, Australian Fisheries, 44. no. 7, pp. 37-40.
Kennedy, J.O.S., L. Davies, and A. Cox 1999. Joint rent maximisation and open access competition in the southern bluefin tuna fishery. ABARE paper presented at the Combined 43rd Annual Australian and 6th Annual New Zealand Agricultural and Resource Economics Society Conference Christchurch, New Zealand, 20-22 January.
Majkowski, J. and A. Caton 1984. Scientist’s concerns behind tuna management, Australian Fisheries, 43(3) 371-82.
Smith, P. 1986. Tuna. In: Haynes, J. and P. Smith. Market Trends for Australian Fisheries Products, BAE (now ABARE) report no.86.3, AGPS Canberra, pp. 54-64.
Wesney, D., B. Scott and P. Franklin 1985. Recent developments in the management of major Australian fisheries: Theory and practice. In Proceedings of the Second Conference of the Institute of Fisheries Economics and Trade. Vol.1: Christchurch, New Zealand, August 20-23, 1984. pp. 289-303.