Changes in Economic Sentiment Indicators before and after ... · The publishers of the...
31
Volume 8 | Issue 4 | 2019 https://doi.org/10.18267/j.cebr.220 CENTRAL EUROPEAN BUSINESS REVIEW 55 CHANGES IN ECONOMIC SENTIMENT INDICATORS BEFORE AND AFTER ECONOMIC CRISIS (POSITION OF VISEGRAD GROUP AND GERMANY IN EU) ——————————————————————————————————————— Necadova, M. ——————————————————————————————————————— Marta Necadova / University of Economics, Prague, Faculty of Business Administration, Department of Managerial Economics, W. Churchill Sq. 4, Prague, Czech Republic. Email: [email protected]. Abstract Confidence factors play an important role not only in the assessment of business cycles but also in the evaluation of national competitiveness (e.g. the Global Competitiveness report published by the World Economic Forum) due to both using soft data obtained from opinion surveys. The subjective nature of confidence leads to questions about the soundness of such findings. Since the answers from opinion surveys are subjective, the empirical relationship between sentiment indicators and economic variables is not unambiguously established. In these conditions, the results of business surveys and the findings published by competitiveness rankings should not be accepted unconditionally. This paper starts with the comparison of soft data (respondents' sentiment) assessing the quality of institutions among world regions in the Global Competitiveness Report 2017-18. The aim of this paper is to offer a more precise view of the development of economic sentiment in the EU countries, especially in Germany and the Visegrad group countries (the V4). As tools for this description, a business sentiment indicator (ESI) and confidence indicators were applied. For analysis of changes in business sentiment and respondents' confidence, a graphical examination of variables, correlation analysis, changes in standard deviation, changes in countries' ranking, and the comparison of average sentiment (confidence) in the pre-crisis and the post-crisis period were used. Our analysis indicates the equivalent of the so-called halo effect in the pre-crisis period for the V4 (the positive expectation connected with the EU accession) and the deterioration in sentiment and confidence indicators in the post-crisis period. Keywords: animal spirits, business sentiment, confidence indicators, economic sentiment indicator, Executive Opinion Survey, Global Competitiveness report, hallo effect, World Economic Forum JEL Classification: E21, E32, M20
Transcript of Changes in Economic Sentiment Indicators before and after ... · The publishers of the...

Volume 8 | Issue 4 | 2019
https://doi.org/10.18267/j.cebr.220
CENTRAL EUROPEAN BUSINESS REVIEW
55
CHANGES IN ECONOMIC SENTIMENT INDICATORS BEFORE AND AFTER ECONOMIC CRISIS (POSITION OF VISEGRAD GROUP AND GERMANY IN EU)
———————————————————————————————————————
Necadova, M. ——————————————————————————————————————— Marta Necadova / University of Economics, Prague, Faculty of Business Administration, Department of
Managerial Economics, W. Churchill Sq. 4, Prague, Czech Republic. Email: [email protected].
Abstract
Confidence factors play an important role not only in the assessment of business cycles but
also in the evaluation of national competitiveness (e.g. the Global Competitiveness report
published by the World Economic Forum) due to both using soft data obtained from opinion
surveys. The subjective nature of confidence leads to questions about the soundness of
such findings. Since the answers from opinion surveys are subjective, the empirical
relationship between sentiment indicators and economic variables is not unambiguously
established. In these conditions, the results of business surveys and the findings published
by competitiveness rankings should not be accepted unconditionally. This paper starts with
the comparison of soft data (respondents' sentiment) assessing the quality of institutions
among world regions in the Global Competitiveness Report 2017-18. The aim of this paper
is to offer a more precise view of the development of economic sentiment in the EU
countries, especially in Germany and the Visegrad group countries (the V4). As tools for
this description, a business sentiment indicator (ESI) and confidence indicators were
applied. For analysis of changes in business sentiment and respondents' confidence, a
graphical examination of variables, correlation analysis, changes in standard deviation,
changes in countries' ranking, and the comparison of average sentiment (confidence) in the
pre-crisis and the post-crisis period were used. Our analysis indicates the equivalent of the
so-called halo effect in the pre-crisis period for the V4 (the positive expectation connected
with the EU accession) and the deterioration in sentiment and confidence indicators in the
post-crisis period.
Keywords: animal spirits, business sentiment, confidence indicators, economic sentiment
indicator, Executive Opinion Survey, Global Competitiveness report, hallo effect, World
Economic Forum
JEL Classification: E21, E32, M20

Volume 8 | Issue 4 | 2019
https://doi.org/10.18267/j.cebr.220
56 CENTRAL EUROPEAN BUSINESS REVIEW
Introduction – cultural bias in survey data
The publishers of the internationally respected rankings of national competitiveness (e.g.,
World Economic Forum – publisher of the Global Competitiveness Report) evaluate
countries using composite indicators (the CI). For the construction of the final indicator, both
hard and soft data are used1. The sensitivity of the final CI on the quality and explanatory
power of soft data depends on the representation of this type of data in the whole amount of
the variables and on the statistical relevance of the opinion survey. The WEF’s Executive
Opinion Survey (the EOS) is considered an inestimable source, which can bring valuable
information for private and public dialogue at the national and regional levels and help
policymakers to focus on the critical barriers for a country's or region's competitiveness
(Browne, Di Battista & Geiger, 2016, p. 82). The EOS aims to monitor across time which
areas of business can be particularly problematic for national competitiveness. This survey
is administered by the World Economic Forum (WEF) and conducted at the national level
by the WEF's network of Partner Institutes2.
The EOS, as a tool following the best international practices in surveying, is reviewed every
year and its methodology has been audited by survey experts. Deeper audits were realized
by Gallup in the years 2008 and 2012. The 2012 audit addressed an important aspect
related to the impact of national culture (national sentiment) - the so-called cultural bias -
which can affect the interviewees’ responses. The Global Competitiveness and
Benchmarking Network admits that national sentiment can lead to bias “…however,
following international best practices and upon Gallup's recommendation, it was decided
not to re-weight the data using anchoring mechanisms because of the limited effectiveness
of such a procedure and to prevent adding further noise to the data” (Browne, Geiger &
Gutknecht, 2013, p. 85). With the aim to mitigate cultural bias, the WEF’s partner institutes
are reminded to administer the EOS according to guidelines and to ask the respondents to
answer the EOS “given the country they are assessing based on international comparison”
(Browne et al., 2016, p.82). Nevertheless, the above-mentioned attitude of the WEF (not to
re-weight the EOS soft data) can produce some unintended side effects - distortions, not
only among individual countries but also among world regions (see Table 1 and the
following text).
1 Global competitiveness index (GCI) for the country is computed as a weighted average of 12 pillars: 1. Institutions, 2. Infrastructure, 3. Macroeconomic environment, 4. Health and primary education, 5. Higher education and training, 6. Goods market efficiency, 7. Labour market efficiency, 8. Financial market development, 9. Technological readiness, 10. Market size, 11. Business sophistication, 12. Innovation. The first five pillars are also referred to as basic requirements, the second five pillars are also designated as efficiency enhancers and the last two pillars are known as innovation and sophistication factors. The weights of the pillars depend on the stage of development of the particular economy. 2 Most questions in the EOS ask respondents to evaluate, on a scale of 1 to 7, one particular aspect of their operating environment. At one end of the scale, 1 represents the worst possible situation; at the other end of the scale, 7 represents the best. Partner Institutes include recognised research or academic institutions, business organisations, national competitiveness councils, or other established professional entities, and, in some cases, survey consultancies. The WEF’s respondents include firms in proportion to the share of GDP accounted for by the sector, i. e. agriculture, manufacturing industry, non-manufacturing industry (mining and quarrying, electricity, gas and water supply, construction), and services.

Volume 8 | Issue 4 | 2019
https://doi.org/10.18267/j.cebr.220
CENTRAL EUROPEAN BUSINESS REVIEW
57
Table 1 | WEF respondents’ assessment of the quality of institutions in a different world regions
Regions/pillar or sub-pillar (hard/soft data)
1.Institutions (0/21)
1A.Public Institutions (0/16)
1B. Private institutions (0/5)
Latin America and the Caribbean
3.36 3.21 3.82
Sub-Saharan Africa 3.67 3.62 3.84
Visegrad Group countries 3.74 3.62 4.10
Eurasia 3.88 3.81 4.09
South Asia 3.92 3.85 4.15
EU13 (new member countries) 3.94 3.85 4.21
Middle East and North Africa 4.34 4.35 4.34
EU28 4.53 4.46 4.72
Europe and North America 4.55 4.49 4.74
East Asia and Pacific 4.56 4.52 4.68
EU15 (old member countries) 5.04 4.99 5.17
Source: WEF (2017), own elaboration
In Table 1, we show the results of the assessment of the quality of institutions in the GCR
2017-18. The world regions are ranked according to the evaluation in the 1st pillar - from the
most negative to the most positive3. The WEF’s traditional regional classification was
broadened by a more detailed view of the EU28 countries (EU13 – the new member
countries4, EU15 – the old member countries, and the Visegrad group countries). It is clear
that the critical attitude to the evaluation of institutions in the Visegrad group countries
influences negatively not only the EU28 assessment (average value for this group of
countries) in this WEF’s pillar but also the average value for the EU13. Empirical studies
using the WEF's results for the analysis of the V4 countries’ competitive advantages or
disadvantages confirm the results from Table 15. In Europe, the sub-pillar of public
institutions receives low scores in many Central and Eastern European countries (see the
evaluation for the EU13). The critical attitude of respondents from the V4 countries is
probably one of the reasons (or possibly the only reason) for the V4 and Sub-Saharan
Africa gaining the same average value in the evaluation of public institutions. On the other
hand, the predominantly positive evaluation of institutions in the old member countries6 has
3 All sub-criteria included in this pillar are based exclusively on soft data. At the same time, this pillar contains the largest number of sub-criteria. 4 The new member countries joined the EU at 2004 and later. 5 E.g. Necadova and Soukup (2013) found that pillars based on soft data could act as substantial impediments to the improvement of the V4 national competitiveness. Similarly, papers dealing with the changes in WEF’s evaluation of V4 countries after the economic crisis (e.g. Necadova, 2015) identify worse results (the deterioration in the ranking) in the pillars which are based exclusively or previously on soft data. 6Only respondents from countries with the important macroeconomic disbalancies, i. e. Greece (89th position) and Italy (96th position), were more critical to the quality of Public institutions than the Czech Republic (the best performer in this pillar from the V4).
Volume 8 | Issue 4 | 2019
https://doi.org/10.18267/j.cebr.220
58 CENTRAL EUROPEAN BUSINESS REVIEW
an evidently positive impact on the value for the whole EU and the region of Europe and
North America.
From our point of view, regional comparison of the assessment of the quality of institutions
in Table 1 raises the above-mentioned question about the explanatory power of soft data,
which are distorted by the subjectivity of respondents. As Ochel & Rohn (2006) point out,
the necessary condition for comparability of survey results is using the same benchmarks
for participants from all the countries compared. These authors also perceive the
importance of the national specifics for the explanatory power of survey data and argue that
the cross-country analysis cannot account for the specific characteristics of individual
countries (e.g. the national sentiment). They note that the problem of countries’ specifics
becomes more pronounced (and the comparability decreases) as the sample of the
countries included (and therefore their heterogeneity) increases. We can assume that in the
international comparison of circa 140 countries (WEF’s sample), the obtained results mirror
the above-mentioned ‘cultural bias’, which can be connected with national sentiment7. As
noted above, confidence (or sentiment) is an elusive concept, which cannot be defined
precisely or measured directly. If we accept the current assumption of the international
competitiveness rankings (that higher standards of living or higher GDP per capita are
correlated with convenient results in all aspects of competitiveness), we can explain the
discrepancy between the real standards of living and the self-assessment in soft data only
by the above-mentioned specifics among countries (different national sentiment among
countries). Since the WEF does not provide more detailed information about the differences
among answers of respondents from the different branches and sectors of national
economies, and the time series using the same EOS methodology is limited, we decided to
use, in other parts of this paper, the survey data published by European Commission and
Eurostat, which are published monthly, are available in a longer period than the WEF
surveys and cover more homogenous samples of countries (the EU-28). The relatively long
time series of the below-described survey data (time series of the economic sentiment and
confidence indicators) enable us to compare not only the changes in the economic
sentiment in the V4 during and after the economic crisis but also to evaluate the changes of
sentiment connected with the EU accession.
7 The V4 country's positions in the 1st pillar in WEF's group are the following: CZE (52.), POL (72.), SVK (93.), HUN (101.). (A slightly less pessimistic view of Polish and Czech respondents on the quality of private institutions is projected in these ranks: CZE (41.), POL (53.), SVK (78.), HUN (114.).) The comparison of above-mentioned results with the results of Sub-Saharan Africa could serve as a suitable argument promoting our assumption that the V4 countries evaluate themselves more pessimistically. Five Sub-Saharan countries - Rwanda (16.), Mauritius (37.), Namibia (44.), Botswana (45.), or Gambia (46.) - have better positions than the Czech Rep. (52.); the ranks of the other five Sub-Saharan countries - Ghana (59.), Cape Verde (65.), Senegal (67.), Lesotho (69.), or Tanzania (70.) -, are more favourable compared to Poland (80.); the institutions in Ethiopia (73.), Kenya (75.), South Africa (76.), Zambia (84.), Benin (91.), and Liberia (92.) are evaluated better than institutions in Slovakia (93.); Hungary (101.) is overtaken by,e.g. Malawi (96.), Uganda (99.) or Cameroon (100.)..Our summary is following: according to WEF¨s ranking in the 1st pillar, 19 Sub-Saharan countries have better positions than Hungary.

Volume 8 | Issue 4 | 2019
https://doi.org/10.18267/j.cebr.220
CENTRAL EUROPEAN BUSINESS REVIEW
59
1 Economic sentiment and confidence indicators – methodology and discussion
1.1 Measuring economic sentiment – methodology of the European Commission
The Economic Sentiment Indicator (ESI) is comprised of 15 individual components of five
confidence indicators. The explanatory power of the ESI is associated with the main aim
of its construction - to summarise the attitudes and judgements of economic actors. The
following explicit weights are allocated to different sectors to compute the composite
indicator - Industry: 40 %, Services: 30 %, Consumers: 20 %, Construction: 5 %, Retail
trade: 5 %. The given weights have been determined according to two criteria:
‘representativeness’ of the sector in question and tracking performance of the reference
variable. The obvious reference variable is the GDP growth (the choice of this
performance indicator is determined by the fact that GDP follows the movements of the
economy as a whole). The weights mentioned above are not directly applied to the five
confidence indicators themselves but to their standardised individual component series.
Prior standardisation is essential to render the individual component series comparable in
terms of both its mean level and volatility before aggregation, especially when the
components pertain to developments in different sectors of the economy (European
Commission, 2019, p. 23). The brief description of questions included in the monthly
surveys is mentioned in Table 1 in the Annex. The sample size for each survey varies
among countries according to the heterogeneity of their economies and is generally
positively related to the countries’ respective population size. Answers obtained from the
surveys are aggregated in the form of ‘balances’. Balances are constructed as the
difference between the percentage of respondents giving positive replies and those giving
negative replies. The European Commission (the EC) calculates the EU and euro-area
aggregates using the national results and seasonally adjusts the balance series. The
balance series is then used to build the composite indicators. Firstly, for each surveyed
sector, the EC calculates the confidence indicators as arithmetic means of answers
(seasonally adjusted balances). Secondly, the results for the five surveyed sectors are
aggregated into the Economic Sentiment Indicator (ESI), whose purpose is to track the
GDP growth in individual Member States, the EU, and the euro-area (European
Commission, 2019, p. 10).
1.2 Review
According to a considerable amount of papers, economic sentiment indicators have limited
explanatory and predictive power. Lemmens, Courx & DeKimpe (2005) proved that the
findings regarding the predictive power of the confidence indicators are mixed. According to
these authors, the results strongly depend on whether an in-sample or out-of-sample
testing framework is used. Similarly, Roberts & Simon (2001) recommended caution when
using sentiment indicators for analytical purposes. An investigation of the predictive power
of component indices corresponding to the individual survey questions yields limited insight.
Posta & Valenta (2011), describing the practice with the leading composite indicator at the
MF CR (Ministry of Finance of the Czech Republic), encapsulated the critical criteria for the
relevant predictive power of the indicators based on business surveys: economic

Volume 8 | Issue 4 | 2019
https://doi.org/10.18267/j.cebr.220
60 CENTRAL EUROPEAN BUSINESS REVIEW
interpretation, exhibition of cyclical behaviour, statistically significant relationship to the
economic cycle, and time availability. Santero & Westerlund (1996) used graphical
examination, correlation analysis and Granger causality tests for examining the usefulness
of consumer and business surveys in the assessment of the cyclical position of the
economy and for forecasting output movements. Their key findings were the following: 1.
the relationship between sentiment indicators and output varies considerably across
countries and sentiment measures, 2. for economic analysis, consumer confidence
indicators are much less useful than business confidence indicators due to their much
looser relationship with output movements. For example, Claveria, Pons & Ramos (2007)
(2007) analysed the explanatory power of 38 business and consumer survey indicators in
the euro-area and pointed out some methodological problems with this type of survey data.
Firstly, the information refers to the direction of change but not to its magnitude; secondly,
the conversion of qualitative data into a quantitative measure enables the computation of
only one-period-ahead forecasts. Sorić, Lolić & Čižmešija (2016) and Gelper & Coux (2010)
proved that the methodology used in calculating ESI is potentially flawed because of
arbitrarily chosen balance response weights. Gelper and Coux (2010) compare the original
ESI with more sophisticated aggregation schemes (based on dynamic factor analysis and
partial least squares) and show that alternative aggregation schemes bring stronger co-
movement of the composite indicator with economic activity and better forecast
performance at longer horizons. Studies which are primarily concentrated on the
explanatory power of indicators in times of economic turbulences bring ambiguous results.
Analysis of Posta & Pikhart (2012) shows that the turbulences in 2007–2008 had a
detrimental impact on the relationship between ESI and GDP. Using rolling forecast and
panel regression, the dependency of forecast errors on the magnitude of the quarterly
changes in GDP was not proven. Therefore Posta & Pikhart (2012) expected that the
relationship between ESI and GDP may be exploited in relatively peaceful times while it
may become quite distorted when the economy is hit by unexpected shocks.
In contrast, Throop (1992), who focused on consumer sentiment, found that consumer
sentiment ordinarily has little complementary value in forecasting durables spending, yet
when an unusual event occurs, the consumer confidence indicator is likely to improve
forecasts. Similarly, Blanchard (1993) perceived the consumer confidence indicator as the
bearer of relevant information mainly under circumstances of strong fluctuations in the
economy. Neisingh & Stokman (2013) found that the following factors have a major
influence on the cyclical variations in the sentiment indicators: financial stability, price
stability, and political stability in the given country.
Many studies inferred the assessment of predictive accuracy of the economic sentiment
and the confidence indicators through bivariate, within-country Granger-causality tests,
which resulted in mixed conclusions. Lemmens, Croux & Dekimpe (2005) used both
bivariate and multivariate Granger-causality tests to take into account cross-country
influences. This approach results in the following consequences: the economic climate in
Germany and France is found to influence the subsequent, actual production in the rest of
the EU. The results of the multivariate analysis allow for the sorting out of EU countries
according to influence and receptivity (France and Germany have more ‘clout’, while others
are more ‘receptive’). Therefore, Lemmens et al. (2005) support the harmonisation of EU
business surveys as their approach allows for the exploitation of cross-country relations
between different series of indicators which in turn leads to the improvement of forecasts of

Volume 8 | Issue 4 | 2019
https://doi.org/10.18267/j.cebr.220
CENTRAL EUROPEAN BUSINESS REVIEW
61
future account data for an individual country. Lemmens, Croux & Dekimpe (2007) - using
the concepts of dynamic correlation and cohesion between countries - investigated the
homogeneity of EU countries in the consumer confidence indicators. Their findings are as
follows: the short-run fluctuations in consumer confidence are found to be largely country-
specific; the consumer confidence indicators become much more homogeneous as the
planning horizon is extended, and the homogeneity is inversely related to the economic and
cultural distance among the various member states.
As we describe above, the economic and cultural distance among countries can cause the
so-called national bias (Browne et al., 2013), which enters into the respondents’ answers in
the EOS and can cause a discrepancy between the economic performance and the
respondents’ sentiment. Studies concentrated on the impact of this phenomenon seek the
reasons for ‘irrational’ consumers’ decisions which are not explicable by variables of
economic performance (i.e. income, inflation, unemployment). As Neisingh & Stokman
(2013) show, the academic literature is not unanimous about the added value of information
on consumer confidence in comparison with other available broad economic indicators. In
the academic discussion, there is no consensus on the existence of additional information
contained in consumer confidence indicators compared to commonly used indicators of
economic performance. Highlighting this is Ludvigson (2004) who points out that the
mechanisms by which household attitudes influence the real economy are less well
understood. Neisingh & Stokman (2013) - on the Netherlands’ example - identified three
distinct types of drivers of consumer confidence: general economic indicators, animal
spirits, and trust. According to them, the financial crisis caused the loss of faith in the
financial system in Europe and contributed to the longer-lasting negative impact on
consumer confidence and spending.
The term ‘Animal spirits’ was first used by Keynes (1973) in Chapter 12 of The General
Theory of Employment, Interest, and Money, ‘The State of Long-Term Expectation’, with the
aim to explain human action in relation to asset prices. Keynes wrote that when individuals
cannot make a rational calculation of expected values, animal spirits are the de facto
springs of action. He defined ‘animal spirits’ as ‘a spontaneous urge to action rather than
inaction’ (Keynes, 1973, p. 161). According to Koppl (1991), Keynes connects the term with
irrational behaviour. On the contrary, Camerer, Loewenstein & Rabin (2004) argued that if
only limited time and limited knowledge are available, cognitive capabilities using intuition,
rules of thumb, and heuristics may be considered rational. Santero & Westerlund (1996)
considered ’animal spirits’ to be the most explicit reference to business sentiment in the
business cycle theory, which is used to explain the volatility of private business investment
spending. According to them, it is unclear what specifically these animal spirits are, and the
shifts in sentiment were left largely unexplained. (Santero & Westerlund, 1996, p. 5).
Neisingh & Stokman (2013) perceived animal spirits as manifestations of overly optimistic
or pessimistic perceptions on the part of households which in consequence desire to
consume more or less than is optimal in conditions of perfect information. Blanchard's
interpretation of the term is connected with “increasing prudence to changes in
intertemporal preferences, to the sudden realization of past over borrowing, panic and so
on,” (Blanchard, 1993, p. 274). According to Katona (1951), consumers’ ability (objective
financial resources) and willingness (their subjective perception of the world) are the key
factors for their decisions. Therefore, even if negative shocks do not have a direct impact
on consumers’ ability-to-buy, they might affect consumers’willingness-to-buy. Neisingh and

Volume 8 | Issue 4 | 2019
https://doi.org/10.18267/j.cebr.220
62 CENTRAL EUROPEAN BUSINESS REVIEW
Stokman (2013) assumed that the development of the stock market and the yield spread
affect willingness-to-buy and overall consumer confidence. They estimated that a relation
between stock market developments (and the yield spread) and overall consumer
confidence exists. Economic optimism based on the expectation of positive institutional
changes and positive future economic performance connected with entry to the EU is
perceived as the background for the explanation of the so-called ’halo effect’.
Cihak & Mitra (2009) analysed spreads on the sovereign bonds of new member states in
the period 2005-08 and searched for the causes for the differences in spreads in the pre-
crisis period and during the crisis. They showed that the crisis has led to the disappearance
of the ’halo effect’. This term is used for the designation of the difference between the
fundamental and actual sovereign bond rates. According to Hauner, Jonas & Kumar (2007),
the EU halo effect is linked to EU membership and arises from the optimism associated
with perceived better institutions and processes (such as fiscal rules) compared to those
present before entry to the EU. In the pre-crisis period, despite fundamentals, the positive
perception of these institutional improvements in the new member states probably had the
effect of reducing sovereign risk8. Jansen & Nahuis (2003) observed the importance of
fundamentals in the decision-making processes in the financial markets. They found that
the decisions made in the stock markets are driven by expectations about economy-wide
conditions rather than personal finances.
2 Economic sentiment and confidence indicators – analysis
2.1 Aims of analysis
We aim to offer a more precise view of the changes of economic sentiment inside the EU
and, above all, the V4 countries. Eurostat and National Statistical Offices, which publish
results of relevant surveys on a monthly basis, served as a suitable source of relevant data
about economic sentiment and confidence. In this part of the paper, we analyse the
changes of ESI (Economic Sentiment Indicator) and confidence indicators in the period
2002Q2 – 2016Q4. This period enables us to follow changes in sentiment for the V4
countries and the majority of the EU countries. We note that the length of time series
captured in the charts depends on the availability of survey data for the V4 and Germany.
Our analysis seeks the answers to the following questions:
• Is it possible to identify positive/negative economic sentiment in the V4 countries in
connection with entry to the EU and the economic crisis? Can we identify more
significant changes in the economic sentiment of the V4 countries before and after
the economic crisis?
• Can we observe the changes in the relationship (in correlation) between ESI (or
given confidence indicator) and GDP in the pre-crisis and the post-crisis period?
8 Cihak and Mitra (2009) also illustrated the increased country dispersion of sovereign spreads during the crisis and demonstrated that this t can be, in no small part, explained by the differences in the macroeconomic performance and external vulnerabilities of the countries (success in keeping inflation low and the financing of the current account deficit at a sustainable level).

Volume 8 | Issue 4 | 2019
https://doi.org/10.18267/j.cebr.220
CENTRAL EUROPEAN BUSINESS REVIEW
63
• Are the V4 countries - according to the changes in ESI and in confidence
indicators in both periods – a more homogeneous or heterogeneous group of
countries?
2.2 Methods
The homogeneity of the V4 will be evaluated using the frequency distribution and
descriptive statistics for all indicators. To examine the rate of coincidence among indicators
of Germany9 and the V4 countries, graphs with quarterly values for the above-mentioned
countries will be presented. Additionally, the graphical examination enables the monitoring
of the impact of economic crises on the changes in confidence indicators. The assessment
of the relationship between business sentiment indicators and GDP is based on the
analysis of correlation coefficients of the confidence indicator with GDP growth. Following
the approach of Santero & Westerlund (1996), the number of quarter lags reported was
limited to four lags since the highest correlation was found within one to four quarters after
the observation point in time (see Tables 3a and 3b in Annex). Following these authors, a
correlation coefficient exceeding 0.75 is considered as large in our commentaries. In our
analysis, these other methods were applied. Firstly, the ranking of the EU member states
according to the average value of individual indicators (see Tables in Annex) for three-time
series was constructed. The following time series were considered: 1) the whole period
(2002Q2 – 2016Q4), 2) the 1st period (2002Q2 – 2009Q4), and 3) the 2nd period (2010Q1 –
2016Q4). Secondly, the graphs with difference between the average values in the 1st and
the 2nd period are considered to be a suitable tool for the assessment of the impact of the
economic crisis on economic sentiment. The graphs with the above-mentioned differences
are added by standard deviations of variables in both periods with aim to describe the
differences in variability among the EU member states and compare the changes in
variability in both periods.
2.3 Economic sentiment indicator (ESI)
The graphical examination in Figure 1 highlights the impact of the transformation recession
on the economic sentiment in the V4 countries; deeper deterioration is visible in the Czech
and Slovak Republic. The process of entry to the EU is likely connected with bigger
optimism in these countries compared to Germany which at the time of its entry to the EU in
the '90s was influenced by the process of equalization of economic and living standards
among old and new federal states.
9 Germany was chosen for comparison with the V4 countries as their closest and strongest trade partner.

Volume 8 | Issue 4 | 2019
https://doi.org/10.18267/j.cebr.220
64 CENTRAL EUROPEAN BUSINESS REVIEW
Figure 1 | ESI_Germany, Visegrad countries (1996Q1-2016Q4)
Source: Eurostat (2018), own elaboration
The analogue between the ESI values and the halo effect (see Cihak & Mitra, 2009) is
evident from the comparison of the V4 with Germany in the period 2002Q1–2008Q1. The
earlier deterioration of the Hungarian ESI compared to the other V4 countries is connected
with macroeconomic imbalances as Hungary suffered from a large fiscal deficit, high
inflation, and external debt. In the post-crisis period, the economic sentiment in the Czech
and Slovak Republic and Poland has been more negative compared to Germany and the
other EU countries. The most positive economic sentiment in Hungary in the period
2013Q3-2016Q4 was connected with the economy-wide conditions, especially relatively
high economic growth which, according to the average quarterly growth rate of GDP,
ranked 15th in the post-crisis period among Germany and other EU countries.
Figure 2 | ESI_frequency distribution (average value of ESI, 2002Q2-2016Q4)10
Source: Eurostat (2018), own elaboration
10 The frequency distribution in this paper is presented as a frequency bar chart. This method provides a visual display using columns, with the y-axis representing the frequency count (the number of countries) and the x-axis representing the variable to be measured (the average value of indicators in the whole period, i.e 2002Q2 - 2016Q4). The individual column's legend indicates which countries are included in a given quantile. Reading the legends from right to left allows to follow the EU ranking according to the average value of the given indicator.
60
70
80
90
100
110
120
1301
996
Q1
19
96Q
4
19
97Q
3
19
98Q
2
19
99Q
1
19
99Q
4
20
00Q
3
20
01Q
2
20
02Q
1
20
02Q
4
20
03Q
3
20
04Q
2
20
05Q
1
20
05Q
4
20
06Q
3
20
07Q
2
20
08Q
1
20
08Q
4
20
09Q
3
20
10Q
2
20
11Q
1
20
11Q
4
20
12Q
3
20
13Q
2
20
14Q
1
20
14Q
4
20
15Q
3
20
16Q
2
DEU CZE HUN POL SVK
GRC
PRT, POL, LUX, NLD ESP, ITA, DEU,
CYP, AUT
BEL, FRA, FIN, ROU, HUN, GBR, SVK, SVN, DNK
CZE, BGR, SWE, EST, LVA, LTU
0
2
4
6
8
10
[94.3;96.3] [96.3;98.3] [98.3;100.3] [100.3;102.3] [102.3;104.3]
nu
mb
er o
f co
un
trie
s

Volume 8 | Issue 4 | 2019
https://doi.org/10.18267/j.cebr.220
CENTRAL EUROPEAN BUSINESS REVIEW
65
Despite the deterioration of the average value of ESI in the post-crisis period, the Czech
position (6th place) is the best in the whole period. Positive sentiment in the new member
states in the first period contributes to their position in the first half of the EU countries
(with the exception of Poland, which occupies the 23 rd place). Polish economic sentiment
was below the EU average, but was relatively stable during the whole period.
Figure 3 | ESI_differences between periods
Source: Eurostat (2018), own elaboration
The stronger negativism after the crisis is linked with the bigger sensitivity of small open
economies in the economic cycle. This pesimism determined the negative changes of
Czech and Slovak ranking (from the 2nd to the 11th position for the Czech Republic and from
the 6th to the 18th place for the Slovak Republic) – see Table2a in Annex. The improvement
in the post-crisis period was observed only in four countries. The highest positive difference
for Germany is connected with a change in the EU ranking according to average ESI value
during the whole period by 23 places (from 25th place to 2nd place). Simultaneously,
Germany is the country with a relatively stable development of ESI (standard deviation is
below the EU average), and higher variability in the post-crisis period was found only in
Greece, Italy, Cyprus, and Portugal (i.e. in countries with bigger macroeconomic
imbalances). The higher prudence (connected with the smaller average of the indicator)
and the lower variability after the crisis are typical for the majority of the EU countries. Table
3a in the Annex shows the best results for the correlation coefficients between ESI and
quarterly GDP growth. Changes of ESI matched GDP swings with a lag of one quarter in
the whole period (2002Q2-2016Q4) in the Czech Republic (with the closest relation from
chosen countries in all periods), Hungary, Slovakia, and Germany. Higher coefficients are
found in the pre-crisis period. The weakest relationship and better results for the second
lagged value of ESI are observed in Poland. Stronger correlation is typical for the pre-crisis
period (with the exception of Poland). Tendency to a more pessimistic attitude of
respondents after the economic crisis should explain the more significant correlation at the
second lag of ESI during the post-crisis period. These results imply that ESI should not be
considered as a reliable leading indicator in our countries’ sample.
2.4 Consumer confidence indicator (CCI)
Graphical examination of CCI in Figure 4 implies the prevailing pessimism of consumers
during the whole period with the most negative balances occurring during the economic
crisis. Positive balances were registered only in the Czech Republic and Germany. Czech
consumers' optimism (slightly positive balances) is observable during the pre-crisis years
-20
-10
0
10
20
DEU
HU
N
SWE
GB
R
EU2
8
BEL
DN
K
NLD
LVA
AU
T
PR
T
EST
ESP
LTU
ITA
PO
L
FRA
FIN
LUX
SVN
SVK
CZE
RO
U
BG
R
CYP
GR
C
dif. s.d.2Q02_4Q09 s.d. 1Q10_4Q16

Volume 8 | Issue 4 | 2019
https://doi.org/10.18267/j.cebr.220
66 CENTRAL EUROPEAN BUSINESS REVIEW
(2006-07) and at the end of the period (2015-16). In Germany, the predominance of
positive answers is visible during the year 2007 and in the time of recovery after the
economic crisis – in the period 2010Q2-2011Q3. The strongest negativism in Hungary is
connected with the above-mentioned macroeconomic misbalances and the only below-
average quarterly GDP growth - compared to other NMC - during the whole period (14th
place - see Table 2a in Annex).
Figure 4 | CCI_Germany, V4 (2001Q1-2016Q4)
Source: Eurostat (2018), own elaboration
The prevalence of positive consumer perception (according to the average value for the
whole period) was monitored only in these three EU countries: Finland, Sweden, and
Denmark (see Figure 5).
Figure 5 | CCI_frequency distribution (average value of CCI, 2002Q2 -2016Q4)
Source: Eurostat (2018), own elaboration
In the first period, the mean of CCI is lower than the median in the Czech Republic,
Hungary, and the Slovak Republic, which implies the left-skewness of CCI. The occurrence
of positive outliers has an influence on the right-skewness of CCI for Germany and Poland.
In the post-crisis period, it is possible to monitor the lower rate of consumers' pessimism on
average in Germany, Hungary, Poland, and Slovakia. The Czech Republic is one of the 16
member countries where pessimism has grown in the post-crisis period (see Figure 6). In
- 80,0
- 60,0
- 40,0
- 20,0
0,0
20,0
20
01Q
12
001
Q3
20
02Q
12
002
Q3
20
03Q
12
003
Q3
20
04Q
12
004
Q3
20
05Q
12
005
Q3
20
06Q
12
006
Q3
20
07Q
12
007
Q3
20
08Q
12
008
Q3
20
09Q
12
009
Q3
20
10Q
12
010
Q3
20
11Q
12
011
Q3
20
12Q
12
012
Q3
20
13Q
12
013
Q3
20
14Q
12
014
Q3
20
15Q
12
015
Q3
20
16Q
12
016
Q3
DEU CZE HUN POL SVK
GRC
BGR, CYP, HUN, PRT, ROU
SVN, POL, SVK, FRA, ITA, LVA, ESP, IRL, LTU
CZE, BEL, GBR, EST, DEU, NLD,
AUT
DNK, SWE, FIN
0
2
4
6
8
10
[-57.0;-41.8] [-41.8; -26.5] [-26.5;-11.2] [-11.2; 4.1] [4.1;19.4]nu
mb
er o
f co
un
trie
s

Volume 8 | Issue 4 | 2019
https://doi.org/10.18267/j.cebr.220
CENTRAL EUROPEAN BUSINESS REVIEW
67
the post-crisis period, the values of CCI are more variable in the 18 member states (see
Figure 6).
Figure 6 | CCI _differences between periods
Source: Eurostat (2018), own elaboration
More negative (in 16 member states) and volatile consumer sentiment is connected with the
negative impacts of the economic crisis in the form of the above-mentioned higher
vulnerability of countries with macroeconomic imbalances (Cyprus, Portugal, Greece,
Spain). From the V4 countries, Czech respondents were more pessimistic only in the post-
crisis period. Higher Czech negativism explains the lack of two places in CCI ranking (see
Table 2a in Annex). Despite this fact, the average value of the Czech's CCI is the highest
compared to the other V4 countries (10th place of the Czech Republic in comparison with
the 15th place of the Slovak Republic, the 16th position of Poland, and the 20th rank of
Hungary). The biggest positive change of average consumer sentiment between the pre-
crisis and the post-crisis period was observed in Germany. This change is reflected in the
better position of Germany in CCI ranking (the shift from 10th to 4th place).
As Table 3a (in Annex) shows, the relationship between GDP and CCI is weaker compared
to the relationship between GDP and ESI. Changes of CCI matched GDP swings with a lag
of one quarter for all periods. Higher coefficients are found in the pre-crisis period. The
weakest relationship is monitored in Poland. Closer correlation is registered in the pre-crisis
period - with the exception of the Czech Republic (there is a significant correlation at the
second lag). A comparison of correlation coefficients (see Table 3a in Annex) shows that
correlation between CCI and GDP is weaker than the correlation between ESI and GDP. As
Santero & Westerlund (1996) state, CCI is probably more easily affected by factors
unrelated to near-term business cycle fluctuations (i.e. animal spirits, cultural bias, etc.).
2.5 Construction confidence indicator (Constr. CI)
The prevalence of negative balances in respondents’ answers is typical for construction
confidence indicator in the V4 and Germany (see Figure 7). Compared to the average
confidence of EU28 (see Table 9 in Annex), the above-average confidence in the pre-
crisis period was found in the Czech Republic and in the post-crisis period in Germany.
-40-30-20-10
0102030
DEU IR
L
SWE
HU
N
LVA
DN
K
EST
ESP
EU2
8
SVK
PO
L
GB
R
LUX
CYP BEL
PR
T
FIN
NLD IT
A
CZE
LTU
FRA
SVN
AU
T
BG
R
RO
U
GR
C
dif. s.d.2Q02_4Q09 s.d. 1Q10_4Q16
Volume 8 | Issue 4 | 2019
https://doi.org/10.18267/j.cebr.220
68 CENTRAL EUROPEAN BUSINESS REVIEW
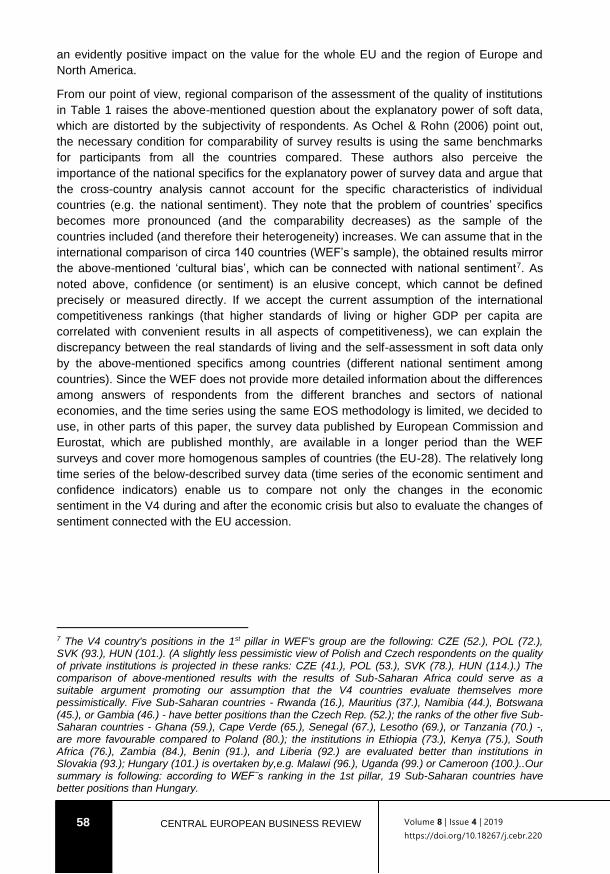
Figure 7 | Constr.CI_Germany, V4 (1998Q1-2016Q4)
Source: Eurostat (2018), own elaboration
In the first period, the less negative balances in the V4 compared to Germany are
connected with the inflow of FDI and consequential higher activity in construction. The
lower inflow of FDI along with the realisation of the higher vulnerability of small opened
economies in the post-crisis period can explain the higher pessimism in the Czech
Republic, Hungary, and Slovakia. As Figure 9 shows, in the post-crisis period, the lower
average pessimism in construction was observed only in five EU countries (Germany,
Luxembourg, Austria, Sweden, and Poland).
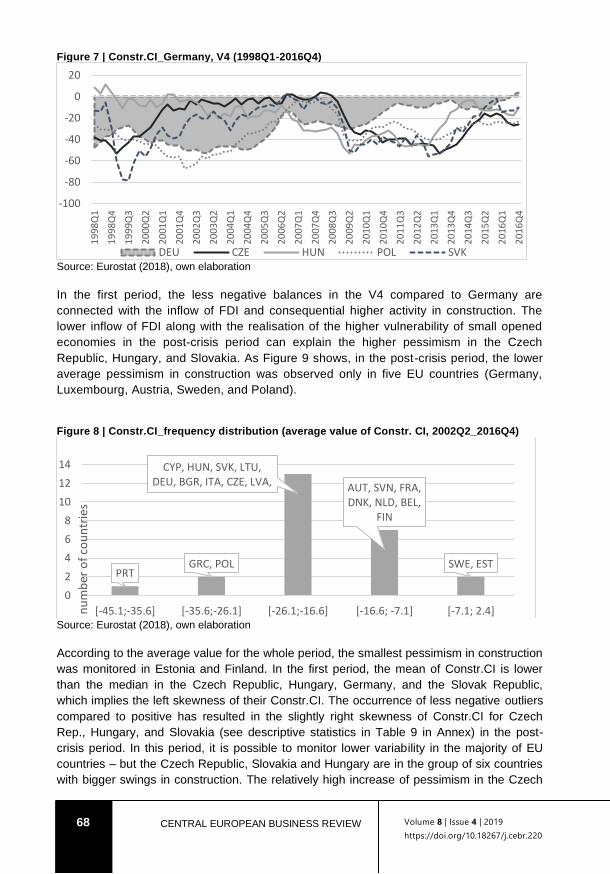
Figure 8 | Constr.CI_frequency distribution (average value of Constr. CI, 2002Q2_2016Q4)
Source: Eurostat (2018), own elaboration
According to the average value for the whole period, the smallest pessimism in construction
was monitored in Estonia and Finland. In the first period, the mean of Constr.CI is lower
than the median in the Czech Republic, Hungary, Germany, and the Slovak Republic,
which implies the left skewness of their Constr.CI. The occurrence of less negative outliers
compared to positive has resulted in the slightly right skewness of Constr.CI for Czech
Rep., Hungary, and Slovakia (see descriptive statistics in Table 9 in Annex) in the post-
crisis period. In this period, it is possible to monitor lower variability in the majority of EU
countries – but the Czech Republic, Slovakia and Hungary are in the group of six countries
with bigger swings in construction. The relatively high increase of pessimism in the Czech
-100
-80
-60
-40
-20
0
20
19
98Q
1
19
98Q
4
19
99Q
3
20
00Q
2
20
01Q
1
20
01Q
4
20
02Q
3
20
03Q
2
20
04Q
1
20
04Q
4
20
05Q
3
20
06Q
2
20
07Q
1
20
07Q
4
20
08Q
3
20
09Q
2
20
10Q
1
20
10Q
4
20
11Q
3
20
12Q
2
20
13Q
1
20
13Q
4
20
14Q
3
20
15Q
2
20
16Q
1
20
16Q
4
DEU CZE HUN POL SVK
PRTGRC, POL
CYP, HUN, SVK, LTU, DEU, BGR, ITA, CZE, LVA, AUT, SVN, FRA,
DNK, NLD, BEL, FIN
SWE, EST
0
2
4
6
8
10
12
14
[-45.1;-35.6] [-35.6;-26.1] [-26.1;-16.6] [-16.6; -7.1] [-7.1; 2.4]nu
mb
er o
f co
un
trie
s

Volume 8 | Issue 4 | 2019
https://doi.org/10.18267/j.cebr.220
CENTRAL EUROPEAN BUSINESS REVIEW
69
Republic and Slovakia affects their position in ranking (the change from the 8th to 21st rank
for the Czech Rep. and from the 19th to 20th place for Slovakia).
Figure 9 | Constr.CI _differences between periods
Source: Eurostat (2018), own elaboration
As Table 3b (in Annex) shows, the relationship between GDP and Constr.CI is weaker
compared to the relationship between GDP and ESI. The closest correlations were
observed at the second lag of Constr.CI with exceptions in all three periods. E.g., in the
case of the Czech Republic there is a more significant correlation between the third lag of
sentiment indicator and GDP, while the fourth lag of Constr. CI is closer related to GDP
than other lags for Germany and Poland. Higher coefficients are mostly found in the pre-
crisis period (after the economic crisis, higher correlation was observed only in case of
Poland and Slovakia).
2.6 Industrial confidence indicator (ICI)
Czech and Slovak respondents show the most significant rate of confidence in the
evaluation of the present situation and future development in industry and services, strongly
positive balances are typical for the Czech sentiment in retail and services as well. The
optimism of Czech and Slovak respondents from industry is evident in comparison with the
other V4 countries and Germany (see Figure 10). The prevalence of positive balances
makes Czech's and Slovak's respondents leaders in ICI within the EU during the whole
period.
The graphical examination in Figure 10 reveals the following tendencies in the post-crisis
period: lower average optimism in the Czech Republic and Slovakia, lower average
pessimism in Germany and Hungary, and higher inclination to negativism of Polish
respondents.
The differences in industrial sentiment within the V4 countries are apparent from the
frequency distribution in Figure 11.
-30
-20
-10
0
10
20
30
40D
EU LUX
AU
T
SWE
PO
L
HU
N
LTU
BEL FIN
DN
K
PR
T
RO
U
GB
R
LVA
EU2
8
ITA
EST
NLD
SVK
BG
R
CZE
SVN
FRA
GR
C
CYP ES
P
dif. s.d.2Q02_4Q09 s.d. 1Q10_4Q16

Volume 8 | Issue 4 | 2019
https://doi.org/10.18267/j.cebr.220
70 CENTRAL EUROPEAN BUSINESS REVIEW
Figure 10 ICI_Germany, V4 (1998Q1-2016Q4)
Source: Eurostat (2018), own elaboration
Figure 11 ICI_frequency distribution (average value of ICI, 2002Q2-2016Q4)
Source: Eurostat (2018), own elaboration
While the Czech and Slovak Republic are the EU leaders in the average optimism, Polish
respondents belong to the biggest pessimists. This fact is naturally related to the different
structure of the Polish economy and follows the different orientation of Polish competitive
advantage in foreign trade. Differences in industrial sentiment within the V4 countries are
also apparent from the frequency distribution in Figure 11.
Figure 12 | ICI _differences between periods
Source: Eurostat (2018), own elaboration
-50
-40
-30
-20
-10
0
10
20
301
998
Q1
19
98Q
4
19
99Q
3
20
00Q
2
20
01Q
1
20
01Q
4
20
02Q
3
20
03Q
2
20
04Q
1
20
04Q
4
20
05Q
3
20
06Q
2
20
07Q
1
20
07Q
4
20
08Q
3
20
09Q
2
20
10Q
1
20
10Q
4
20
11Q
3
20
12Q
2
20
13Q
1
20
13Q
4
20
14Q
3
20
15Q
2
20
16Q
1
20
16Q
4
DEU CZE HUN POL SVK
LUX POL
ESP, GRC, PRT, FRA, BEL, LTU,
GBR, DEU, AUT, ITA
CYP, HUN, SWE, LVA, NLD, BGR, FIN, DNK, ROU,
SVNSVK, CZE, EST
0
5
10
15
[-22.0;-16.5] [-16.5;-11.0] [-11.0;-5.5] [-5.5;0.0] [0.0;5.5]
nu
mb
er o
f co
un
trie
s
-15
-10
-5
0
5
10
15
20
GR
C
EST
LVA
ESP
BEL
DN
K
BG
R
HU
N
SVN
RO
U
PO
L
FIN
ITA
DEU
NLD
PR
T
FRA
AU
T
LUX
CYP
SVK
EU2
8
SWE
CZE
LTU
GB
R
dif. s.d.2Q02_4Q09 s.d. 1Q10_4Q16

Volume 8 | Issue 4 | 2019
https://doi.org/10.18267/j.cebr.220
CENTRAL EUROPEAN BUSINESS REVIEW
71
As Figure 12 shows, the negative changes in average industrial sentiment were observable
in 10 EU countries in the post-crisis period. Despite the relatively high decrease of Czech
and Slovak optimism, both countries have stayed as leaders in the ICI ranking (the Czech
Republic is in the 2nd position in both periods, the Slovak Republic improved its position by
two places – from the 3rd to the 1st rank). The positive shifts in ranking for Hungary (from the
17th to 4th place) and Germany (from the 22nd to 9th position) are caused by lower
pessimism in the post-crisis period. The more significant negative changes of balances
compared to positive swings are the reason for left skewness of ICI for all V4 countries and
Germany (see descriptive statistics in Table 7). In the post-crisis period, it is possible to
monitor the lower variability in all EU countries. This tendency is connected on one hand
with lower pessimism in the EU generally, but on the other hand with lower optimism on the
side of leaders. Table 3a (in Annex) shows that changes of ICI have matched GDP swings
with a lag of one quarter in the pre-crisis period (with the exception of Poland) and with the
lag of two quarters after the economic crisis. The closest relationship for the Czech
Republic is found in both periods. The lagged ICI is closely correlated with GDP in the pre-
crisis period (with the exception of Poland).
2.7 Retail confidence indicator (RCI)
Positive balances in Czech answers and mostly positive balances in Slovak retail
confidence (only the period 2009Q1 – 2010Q2 is connected with negative balances)
indicate the confidence in the evaluation of the present situation and future development in
retail. This optimism of Czech and Slovak respondents is evident in comparison with
Hungary, Poland, and Germany (see Figure 13).
Figure 13 | RCI_Germany, V4 (1996Q1-2016Q4)
Source: Eurostat (2018), own elaboration
The lower Czech optimism during the year 2013 is connected with the negative sentiment
caused by the so-called second recession. Graphical examination in Figure 13 indicates the
following tendencies in the post-crisis period: lower average optimism in the Czech
Republic, slightly lower optimism in Slovakia, bigger decrease of pessimism in Germany,
and slightly lower pessimism in Poland.
-40
-30
-20
-10
0
10
20
30
40
19
96Q
1
19
96Q
4
19
97Q
3
19
98Q
2
19
99Q
1
19
99Q
4
20
00Q
3
20
01Q
2
20
02Q
1
20
02Q
4
20
03Q
3
20
04Q
2
20
05Q
1
20
05Q
4
20
06Q
3
20
07Q
2
20
08Q
1
20
08Q
4
20
09Q
3
20
10Q
2
20
11Q
1
20
11Q
4
20
12Q
3
20
13Q
2
20
14Q
1
20
14Q
4
20
15Q
3
20
16Q
2
DEU CZE HUN POL SVK

Volume 8 | Issue 4 | 2019
https://doi.org/10.18267/j.cebr.220
72 CENTRAL EUROPEAN BUSINESS REVIEW
Figure 14 | RCI_frequency distribution (average value of RCI, 2002Q2-2016Q4)
Source: Eurostat (2018), own elaboration
Positive Czech and Slovak evaluation of present and expected development in retail affect
the EU ranking for the whole period (see Figure 14 and Table 2b in the Annex). The
differences in retail sentiment within the V4 countries are apparent from the frequency
distribution in Figure 14. While the Czech and Slovak Republic are the EU leaders in the
average optimism in retail, Hungarian respondents – due to the above-mentioned
pessimism caused by macroeconomic imbalances - belong to the biggest pessimists in the
EU28.
Figure 15 | RCI _differences between periods
Source: Eurostat (2018), own elaboration
As Figure 15 shows, the negative changes in average retail sentiment were observable in
14 EU countries in the post-crisis period. Despite the relatively high decrease of Czech
optimism, the Czech Republic has stayed the leader in RCI ranking (the position of Czech
Republic is worsened by one place between the pre-crisis and the post-crisis period – from
1st to 2nd place), the Slovak Republic improved its position by three places – from 7th to 4th
rank). The positive shifts in ranking for Hungary (from the 22nd to the 12th place) and
Germany (from the 23rd to the 14th position) are caused by lower pessimism in the post-
crisis period. The bigger negative changes of balances compared to positive swings are the
DEU, PRT, CYP, HUN, ESP
FRA, AUT, BEL, ITA, POL, GRC,
FIN
GBR, NLD, LTU
LVA, ROU, SVK, BGR, SVN, EST,
SWE
CZE
0
1
2
3
4
5
6
7
8
[-14.9;-8.0] [-8.0; -1.0] [-1.0; 6.0] [6.0; 12.9] [12.9; 19.8]
nu
mb
er o
f co
un
trie
s
-40
-30
-20
-10
0
10
20
30
DEU
HU
N
ESP
GB
R
EU2
8
EST
AU
T
PR
T
PO
L
SWE
ITA
BEL
LVA
SVK
FRA
NLD
BG
R
SVN
FIN
CZE
LTU
RO
U
CYP
GR
C
dif. s.d.2Q02_4Q09 s.d. 1Q10-4Q16

Volume 8 | Issue 4 | 2019
https://doi.org/10.18267/j.cebr.220
CENTRAL EUROPEAN BUSINESS REVIEW
73
reason for the left-skewness of RCI for Hungary and Slovakia during the pre-crisis period
(see descriptive statistics in Table 8 in Annex). In the post-crisis period, it is possible to
monitor the lower standard deviation of RCI in Germany, in the EU28, and in all the V4
countries (with the exception of Hungary). The decrease of pessimism in Hungary and the
positive value of median in the post-crisis period are connected with the slightly higher
variance of RCI. The negative average values of RCI for the EU28 as a whole are caused
by pessimism in the old member countries, in the EU19 respectively (see Table 8 in the
Annex).
Table 3b in the Annex shows that the number of RCI’s lags (behind the changes in GDP)
varies among countries. The biggest number of lags and relatively tight relation between
sentiment indicator and GDP is observed in the Czech Republic in both periods (RCI
lagged four quarters behind GDP swings before crisis, the third lagged value of RCI was
relatively well correlated with GDP in the post-crisis period). The weakest relationship was
observed in Poland. It is obvious that RCI and GDP are correlated closely in the pre-crisis
period.
2.8 Service confidence indicator (SCI)
Positive balances in Czech answers and mostly positive balances in Slovak service
confidence in services (only these periods: 2009Q1 –2009Q3, 2012Q3 – 2013Q4, 2015Q1-
2016Q1 and 2016Q3 were connected with the slightly negative balances in Slovakia)
indicate the confidence in the evaluation of the present situation and future development in
services. This optimism of Czech and Slovak respondents is evident compared to Hungary,
Poland, and Germany (see Figure 16).
Figure 16 | SCI_Germany, V4 (2002Q2-2016Q4)
Source: Eurostat (2018), own elaboration
Figure 16 shows that the similar rate of optimism of Czech, Slovak, and German
respondents is observable only during the crisis. A slight decrease of Czech optimism
during the year 2013 is connected with higher stability of this sector during the crisis periods
compared to other economic areas. The graphical examination in Figure 16 indicates these
tendencies in the post-crisis period: lower average optimism in the Czech Republic,
Slovakia, and Poland, decrease of pessimism in Hungary, and higher optimism in Germany.
-60
-40
-20
0
20
40
60
80
20
02Q
2
20
02Q
4
20
03Q
2
20
03Q
4
20
04Q
2
20
04Q
4
20
05Q
2
20
05Q
4
20
06Q
2
20
06Q
4
20
07Q
2
20
07Q
4
20
08Q
2
20
08Q
4
20
09Q
2
20
09Q
4
20
10Q
2
20
10Q
4
20
11Q
2
20
11Q
4
20
12Q
2
20
12Q
4
20
13Q
2
20
13Q
4
20
14Q
2
20
14Q
4
20
15Q
2
20
15Q
4
20
16Q
2
20
16Q
4
DEU CZE HUN POL SVK

Volume 8 | Issue 4 | 2019
https://doi.org/10.18267/j.cebr.220
74 CENTRAL EUROPEAN BUSINESS REVIEW
Figure 17 | SCI_frequency distribution (average value of SCI, 2002Q2-2016Q4)
Source: Eurostat (2018), own elaboration
Positive Czech and Slovak evaluation of present and expected development in services is
projected at the EU ranking for the whole period (see Figure 17 and Table 2b in the Annex).
The differences in the average sentiment within the V4 countries are apparent from the
frequency distribution in Figure 17. While the Czech and Slovak Republic are the EU
leaders, Hungarian respondents - due to the above-mentioned pessimism caused by the
macroeconomic imbalances - belong to the biggest pessimists in the EU28.
Figure 18 | SCI _differences between periods
Source: Eurostat (2018), own elaboration
As Figure 18 shows, negative changes in average sentiment in services are apparent in 19
of the EU countries in the post-crisis period. Despite the relatively high decrease of Czech
optimism, the Czech Republic has stayed the leader in SCI ranking and the position of
Slovakia has worsened by two places (from 2nd to 4th rank). The slightly positive shift in the
ranking for Hungary (from the 23rd to 21st place) and more important shift for Germany (from
the 16th to the 3rd position) are caused by slightly lower average pessimism (Hungary) and
higher optimism (Germany) in the post-crisis period. Deeper decreases of balances
compared to their increases (and deeper negative changes compared to positive shifts for
Hungary) are the reason for left skewness of SCI for the whole sample of countries during
the pre-crisis period (see descriptive statistics in Table 8 in the Annex). In the post-crisis
period, it is possible to observe lower standard deviation of SCI for all countries in our
sample with the exception of Hungary (standard deviation for Hungarian SCI has stayed
HUN, PRT
GRC, FRA, GBR, ITA, CYP, ESP,
NLD, POL, LVA, LTU
BEL, EST, BGR, DEU, FIN, AUT,
ROU, SVN
SWE, SVKCZE
0
2
4
6
8
10
12
[-12.4; -2.2] [-2.2; 8.0] [8.0; 18.2] [18.2; 28.4] [28.4; 38.6]
nu
mb
er c
ou
ntr
ies
-30
-20
-10
0
10
20
30
DEU
SWE
BEL
GB
R
HU
N
EU2
3
EST
NLD
AU
T
LVA
FIN
ITA
PR
T
PO
L
LTU
FRA
ESP
BG
R
CZE
CYP
RO
U
SVN
SVK
GR
C
dif. s.d.2Q02_4Q09 s.d. 1Q10_4Q16

Volume 8 | Issue 4 | 2019
https://doi.org/10.18267/j.cebr.220
CENTRAL EUROPEAN BUSINESS REVIEW
75
almost un-changed). As Table 3b (in the Annex) shows, GDP is relatively well correlated
with the first lagged value of SCI in the pre-crisis period (with the exception of Poland) and
with the second lagged value of SCI after the economic crisis (with the exception of the
Czech Republic). Stronger correlation between variables is apparent in the pre-crisis period
(with the exception of Poland). Higher correlation coefficients for the EU28 and the EU19
indicate that other EU countries (on average) have a stronger relationship between
confidence indicators and GDP than the V4 and Germany.
Conclusion
We believe that the main reason for worse European results in competitiveness indicators
based on soft data (compared to the regions of the developing world) lies in the so-called
cultural bias (differences in cultural and national sentiment), particularly as it relates to the
more negative sentiment in developed countries, especially in the post-crisis period. The
changes in economic sentiment for the V4 countries and Germany in the period 2002Q2 -
2016Q4 were described using graphical examination and statistical analysis of ESI and
confidence indicators. A key advantage of business surveys published by the European
Commission is their periodicity and differentiation of respondents according to the important
area of economy which was considered as a good tool for the aims of our analysis. These
aims were to identify positive or negative trends in soft data and to verify the existence of
(1) cultural bias (different national sentiment) in soft data and (2) the equivalent of the so-
called halo effect (which is connected with the positive impacts of entry to the EU).
Graphical examination of ESI and confidence indicators implies more positive sentiment, or
a lower rate of negativism, in the Czech Republic, Slovakia, and Poland in the pre-crisis
period (the first period: 2002Q2-2009Q4, the second period: 2010Q1 – 2016Q4). Hungarian
sentiment due to the impacts of macroeconomic imbalances which influenced Hungarian
respondents in the first period showed improvement after the economic crisis.
Macroeconomic performance of the V4 countries (measured by quarterly GDP growth) was
above-average (inside the EU) in both time series, with a tendency to lower and more
stable growth in the post-crisis period (see Table 4 in the Annex) in the Czech Republic,
Poland, and Slovakia. In the EU28 as a whole, in the EU19 (Eurozone), in Germany, and
Hungary, there was an apparent tendency to higher and more stable economic growth. In
the post-crisis period, the development of ESI and confidence indicators were most
probably influenced by the decrease of economic growth, acknowledgement of higher
economic vulnerability, and the extinction of the positive expectations connected with etnry
to the EU (the so-called halo effect). Despite the above-average economic performance of
the Czech Republic, Poland, and Slovakia, these countries’ average value of ESI was lower
than the average value for the EU28 and the EU19. Differences between the average value
of confidence indicators in the first and the second period indicate positive or negative
changes in respondents’ sentiment. In this respect, our analysis shows that the V4
countries are not a homogenous group of countries. In the Czech Republic, the decrease in
all sentiment indicators was discovered in the post-crisis period.
The best position of the Czech Republic in international competitiveness rankings is
probably connected with the above-average values of confidence indicators (CCI, ICI, RCI,
SCI) compared to the EU28. Due to the negative sentiment in the first period connected
with the country’s macroeconomic imbalances, positive changes of sentiment (except for
Constr. CI) were observable in Hungary. Compared to the EU28, the above-average values

Volume 8 | Issue 4 | 2019
https://doi.org/10.18267/j.cebr.220
76 CENTRAL EUROPEAN BUSINESS REVIEW
of Hungarian sentiment were typical only for ESI, ICI, and RCI. A different economic
structure and less openness of the Polish economy had an impact on the differences in
changes of economic sentiment in comparison with the answers of Czech and Slovak
respondents. In the post-crisis period, improvements were apparent in CCI, RCI, and
Constr.CI, while deteriorations were found in ESI, ICI, and SCI. Compared to the EU28, the
below-average values of Polish sentiment were proved in all indicators. Apart from CCI,
deterioration in all confidence indicators was found in Slovakia. Compared to the EU28, the
above-average values of Slovak sentiment were ascertained only for ICI, RCI, and SCI. The
rise of optimism in all sentiment indicators and above-average values (excepting RCI) were
proved in Germany.
Correlation analysis shows that all confidence indicators lagged behind the changes in GDP
(by up to four quarters) and that the relationship between sentiment indicators and output
varies across countries and sentiment measures. It seems that CCI is not as useful as ESI
due to its weaker relationship with GDP swings. This finding corresponds with the results of
the above-mentioned studies: consumer sentiment measures the degree of uncertainty felt
by households, rather than just optimism or pessimism about the future.
Acknowledgement
This study was supported by the internal grant of Faculty of Business Administration,
University of Economics, Prague (IP300040).
References
Blanchard, O. (1993). What caused the last recession? American Economic Review, 83(2), 270-274.
Browne, C., Geiger, T., & Gutknecht, T. (2013). The executive opinion survey: The voice of the
business community. The Global Competitiveness Report 2016–2017, 83-92.
Browne, C., Di Battista, A., Geiger, T., & Verin, S. (2016). The executive opinion survey: The voice of
the business community. The Global Competitiveness Report 2013–2014, 77-87.
Camerer, C. F., Loewenstein, G., & Rabin, M. (Eds.) (2004). Advances in behavioral economics,
Princeton University Press.
Claveria, O., Pons, E., & Ramos, R. (2007). Business and consumer expectations and macroeconomic
forecasts. International Journal of Forecasting, 23(1), 47-69.
Čihák, M., & Mitra, S. (2009). The financial crisis and European emerging economies. Czech Journal of
Economics and Finance (Finance a uver), 59(6), 541-553.
European Commission (2019). A User Manual to the Joint Harmonised EU Programme of Business
and Consumer Surveys. Retrieved January 29, 2019, from https://ec.europa.eu/info/business-
economy-euro/indicators-statistics/economic-databases/business-and-consumer-surveys_en.
Eurostat (2018). Database. Retrieved December 15, 2018, from
https://ec.europa.eu/eurostat/databrowser/view/teibs010/default/table?lang=en
Gelper, S., & Croux, C. (2010). On the construction of the European economic sentiment indicator.
Oxford Bulletin of Economics and Statistics, 72(1), 47-62.
Hauner, D., Jonas, J., & Kumar, M. (2007). Policy Credibility and Sovereign Credit-The Case of New
EU Member States. IMF Working Paper No. WP/07/1, Washington: International Monetary
Fund.

Volume 8 | Issue 4 | 2019
https://doi.org/10.18267/j.cebr.220
CENTRAL EUROPEAN BUSINESS REVIEW
77
Jansen, W. J., & Nahuis, N. J. (2003). The stock market and consumer confidence: European
evidence. Economics Letters, 79(1), 89-98.
Katona, G. (1951). Psychological analysis of economic behavior. New York: McGraw-Hill Book
Company Inc.
Keynes, J. M. (1973). The general theory of employment, interest and money. Collected Writings of
John Maynard Keynes, Vol. 7, London: St. Martin's Press for the Royal Economic Society.
Koppl, R. (1991). Retrospectives: animal spirits. Journal of Economic Perspectives, 5(3), 203-210.
Lemmens, A., Croux, C., & Dekimpe, M. G. (2005). On the predictive content of production surveys: A
pan-European study. International Journal of Forecasting, 21(2), 363-375.
Lemmens, A., Croux, C., & Dekimpe, M. G. (2007). Consumer confidence in Europe: United in
diversity? International Journal of Research in Marketing, 24(2), 113-127.
Ludvigson, S. C. (2004). Consumer confidence and consumer spending. Journal of Economic
perspectives, 18(2), 29-50.
Nečadová, M., & Soukup, J. (2013). Kontroverzní pojem národní konkurenceschopnost a výsledky
zemi V-4 v mezinárodních žebříčcích konkurenceschopnosti 2007-2012. Politická ekonomie,
61(5), 583-604.
Nečadová, M. (2015). Selected Approaches to Measurement of National Competitiveness and the
Results. Acta Oeconomica Pragensia, 2015(2), 22-39.
Neisingh, P., Stokman, A. (2013). What Drives Consumer Confidence in Times of Financial Crises?
Evidence for the Netherlands. De Nederlandsche Bank. Working Paper No. 394,
https://doi.org/10.2139/ssrn.2338977
Ochel, W., Röhn, O. (2006). Ranking of Countries - The WEF, IMD, Fraser and Heritage Indices,
CESifo DICE Report, 4(2), 48-60.
Pošta, V., & Valenta, V. (2011). Composite Leading Indicators Based on Business Surveys: Case of
the Czech Economy. Statistika: Statistics and Economy Journal, 48(1), 12-18.
Pošta, V., & Pikhart, Z. (2012). The Use of the Sentiment Economic Indicator for GDP Forecasting:
Evidence from EU Economies. Statistika: Statistics and Economy Journal, 49(1), 41-55.
Roberts, I., & Simon, J. (2001). What do sentiment surveys measure?. Reserve Bank of Australia.
Santero, T., & Westerlund, N. (1996). Confidence Indicators and Their Relationship to Changes in
Economic Activity. OECD Economics Department Working Papers, No. 170, OECD Publishing,
Paris, https://doi-org.zdroje.vse.cz/10.1787/537052766455.
Sorić, P., Lolić, I., & Čižmešija, M. (2016). European economic sentiment indicator: an empirical
reappraisal. Quality & Quantity, 50(5), 2025-2054.
Throop, A. W. (1992). Consumer sentiment: Its causes and effects. Federal Reserve Bank of San
Francisco Economic Review, 1, 35-59.
World Economic Forum (2017). The Global Competitivness Report 2017-18. Retrieved January, 20,
2019, from http://www3.weforum.org/docs/GCR2017-
2018/05FullReport/TheGlobalCompetitivenessReport2017%E2%80%932018.pdf.
The research paper has been reviewed. | Received: March 21, 2019; Revised: July 12, 2019;
Accepted: September 2, 2019; Prepublished online: September 2, 2019; Published: December 17,
2019

Volume 8 | Issue 4 | 2019
https://doi.org/10.18267/j.cebr.220
78 CENTRAL EUROPEAN BUSINESS REVIEW
Annex
Table 1 | Variables covered in the monthly business and consumer surveys
Type of survey
Monthly questions Type of survey
Monthly questions
Industry
Production, past 3 months
Services
Firm's employment, past 3 months
Production, next 3 months Firm's employment, next 3 months
Total order books Selling prices, next 3 months
Export order books
Financial services
Business situation, past 3 months
Stocks of finished products Demand/turnover, past 3 months
Selling prices, next 3 months Demand/Turnover, next 3 months
Firm's employment, next 3 months
Firm's employment, past 3 months
Construction
Building activity, past 3 months Firm's employment, next 3 months
Factors limiting building activity
Consumers
Financial situation, past 12 months
Overall order books Financial situation, next 12 months
Firm's employment, next 3 months
General economic situation, past 12 months
Selling prices, next 3 months General economic situation, next 12 months
Retail trade
Business activity, past 3 months Consumer prices, past 12 months
Business activity, next 3 months Consumer prices, next 12 months
Stocks of goods Unemployment, next 12 months
Orders placed with suppliers, next 3 months
Major purchases of durable consumer goods, current environment
Firm's employment, next 3 months
Major purchases intentions, next 12 months
Selling prices, next 3 months Savings, current environment
Services
Business situation, past 3 months
Savings intentions, next 12 months
Demand/Turnover, past 3 months
Capacity to save
Demand/Turnover, next 3 months
Source: European Commision (2019), own elaboration

Volume 8 | Issue 4 | 2019
https://doi.org/10.18267/j.cebr.220
CENTRAL EUROPEAN BUSINESS REVIEW
79
Table 2a | EU28 - countries’ ranking in three periods (according to means)
(A= 2002Q2-2016Q4, B = 2002Q2-2009Q4, C=2010Q1-2016Q4)
qGDP ESI CCI ICI
A B C A B C A B C A B C
AUT 17 20 17 16 14 10 4 4 6 14 14 15
BEL 16 18 18 14 18 9 8 6 9 19 19 17
BGR 6 3 11 5 1 16 24 22 24 8 6 13
HRV 18 10 24 x x x x x x x x x
CYP 19 8 27 17 4 24 23 23 23 13 4 22
CZE 11 7 14 6 2 11 10 8 10 2 2 2
DNK 25 26 16 7 13 8 3 2 2 6 9 6
EST 9 9 4 2 7 7 7 9 7 1 1 3
FIN 23 21 22 13 10 12 1 1 3 7 5 14
FRA 24 24 21 15 11 13 15 13 18 20 20 18
DEU 22 25 13 18 25 2 6 10 4 16 22 9
GRC 28 13 28 25 12 25 25 25 25 22 11 24
HUN 14 19 15 10 22 3 22 24 20 11 17 4
IRL 1 14 1 x x x 12 19 11 x x x
ITA 27 28 25 19 17 17 16 14 17 15 13 16
LVA 7 6 7 3 9 5 14 15 12 10 8 12
LTU 3 5 3 1 5 6 11 11 14 18 16 19
LUX 10 12 5 21 16 23 x x x 25 25 25
MLT 8 16 2 x x x x x x x x x
NLD 21 22 20 22 23 14 5 5 5 9 12 11
POL 4 4 6 23 20 21 18 17 16 24 24 23
PRT 26 27 26 24 24 22 21 21 21 21 18 20
ROU 5 2 10 12 3 20 20 20 22 5 7 10
SVK 2 1 9 9 6 18 17 18 15 3 3 1
SVN 13 11 19 8 8 15 19 16 19 4 10 5
ESP 20 15 23 20 19 19 13 12 13 23 21 21
SWE 12 17 8 4 15 1 2 3 1 12 15 7
GBR 15 23 12 11 21 4 9 7 8 17 23 8
Source: Eurostat (2018), own elaboration
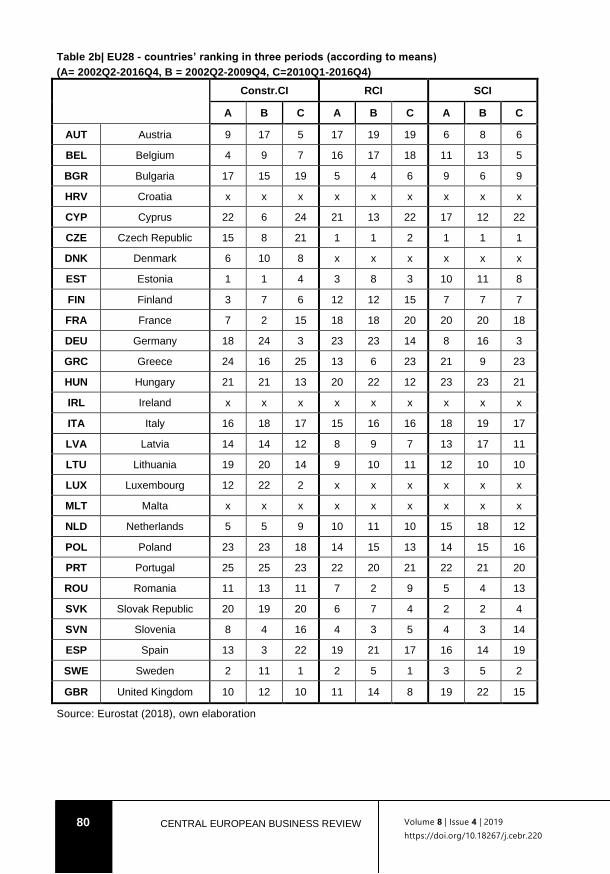
Volume 8 | Issue 4 | 2019
https://doi.org/10.18267/j.cebr.220
80 CENTRAL EUROPEAN BUSINESS REVIEW
Table 2b| EU28 - countries’ ranking in three periods (according to means)
(A= 2002Q2-2016Q4, B = 2002Q2-2009Q4, C=2010Q1-2016Q4)
Constr.CI RCI SCI
A B C A B C A B C
AUT Austria 9 17 5 17 19 19 6 8 6
BEL Belgium 4 9 7 16 17 18 11 13 5
BGR Bulgaria 17 15 19 5 4 6 9 6 9
HRV Croatia x x x x x x x x x
CYP Cyprus 22 6 24 21 13 22 17 12 22
CZE Czech Republic 15 8 21 1 1 2 1 1 1
DNK Denmark 6 10 8 x x x x x x
EST Estonia 1 1 4 3 8 3 10 11 8
FIN Finland 3 7 6 12 12 15 7 7 7
FRA France 7 2 15 18 18 20 20 20 18
DEU Germany 18 24 3 23 23 14 8 16 3
GRC Greece 24 16 25 13 6 23 21 9 23
HUN Hungary 21 21 13 20 22 12 23 23 21
IRL Ireland x x x x x x x x x
ITA Italy 16 18 17 15 16 16 18 19 17
LVA Latvia 14 14 12 8 9 7 13 17 11
LTU Lithuania 19 20 14 9 10 11 12 10 10
LUX Luxembourg 12 22 2 x x x x x x
MLT Malta x x x x x x x x x
NLD Netherlands 5 5 9 10 11 10 15 18 12
POL Poland 23 23 18 14 15 13 14 15 16
PRT Portugal 25 25 23 22 20 21 22 21 20
ROU Romania 11 13 11 7 2 9 5 4 13
SVK Slovak Republic 20 19 20 6 7 4 2 2 4
SVN Slovenia 8 4 16 4 3 5 4 3 14
ESP Spain 13 3 22 19 21 17 16 14 19
SWE Sweden 2 11 1 2 5 1 3 5 2
GBR United Kingdom 10 12 10 11 14 8 19 22 15
Source: Eurostat (2018), own elaboration

Volume 8 | Issue 4 | 2019
https://doi.org/10.18267/j.cebr.220
CENTRAL EUROPEAN BUSINESS REVIEW
81
Table 3a| Correlation coefficients (sentiment/confident indicator vs. quarterly GDP growth)
(A= 2002Q2-2016Q4, B = 2002Q2-2009Q4, C=2010Q1-2016Q4)
ESI CCI ICI
A
GDPt-1 B
GDPt-1 C
GDPt-2 A
GDPt-1 B
GDPt-1 C
GDPt-1 A
GDPt-1 B
GDPt-1 C
GDPt-2
EU28 0.844 0.874 0.792 0.749 0.852 0.695 0.819* 0.853 0.802
EU19 0.834 0.859 0.813 0.752 0.822 0.737 0.809 0.839 0.797
DEU 0.669 0.725 0.638 0.609x 0.681 0.592* 0.706* 0.729 0.662
CZE 0.780 0.800 0.765 0.566 0.546 0.648* 0.764 0.790 0.688
HUN 0.648 0.786 0.538 0.585 0.640 0.479 0.545 0.683 0.576
POL 0.531* 0.497* 0.501 0.285 0.313 0.225 0.579* 0.557* 0.591
SVK 0.571 0.572 0.657 0.352 0.395 0.518 0.527 x 0.525 0.663
Source: Eurostat (2018), own elaboration
Notes: number of * or x indicates the different number of lags compared to table heading (* means
one more lag of sentiment indicator in a given country,** means two more lags of the sentiment
indicator in a given country, x means one less lag of sentiment indicator in a given country)
Table 3b| Correlation coefficients (sentiment/confident indicator vs. quarterly GDP growth)
(A= 2002Q2-2016Q4, B = 2002Q2-2009Q4, C=2010Q1-2016Q4)
Constr.CI RCI SCI
A
GDPt-2 B
GDPt-2 C
GDPt-2 A
GDPt-1 B
GDPt-1 C
GDPt-2 A
GDPt-1 B
GDPt-1 C
GDPt-2
EU28 0.641 0.837 0.526** 0.698 0.763 0.756 x 0.813 0.848 0.769
EU19 0.570 0.806 0.607** 0.647 0.699 0.787 0.799 0.836 0.809
DEU 0.234 0.320** -0.138** 0.415 0.472 x 0.634 0.573 0.632 0.500
CZE 0.620* 0.818* 0.719* 0.742** 0.73*** 0.765* 0.737* 0.769 0.634**
HUN 0.643 0.753 0.548 0.401* 0.627 0.586 0.672 0.801 0.523
POL 0.425** 0.478** 0.544 0.41*** 0.534** 0.461 0.502** 0.49*** 0.498
SVK 0.410 0.512 0.578 0.426* 0.495 0.827** 0.434 0.442 0.313**
Source: Eurostat (2018), own elaboration
Notes: number of * or x indicates the different number of lags compared to table heading (* means
one more lag of sentiment indicator in a given country,** means two more lags of the sentiment
indicator in a given country, x means one less lag of sentiment indicator in a given country)

Volume 8 | Issue 4 | 2019
https://doi.org/10.18267/j.cebr.220
82 CENTRAL EUROPEAN BUSINESS REVIEW
Table 4 | Quarterly GDP growth – descriptive statistics
Period B (2002Q2_2009Q4) C (2010Q1_2016Q4)
Mean Med. s.d. Min Max Mean Med. s.d. Min Max
EU28 0.31 0.6 0.784 -2.6 1.0 0.332 0.40 0.319 -0.4 1.0
EU19 0.245 0.5 0.81 -3.0 1.1 0.268 0.35 0.356 -0.4 1.0
CZE 0.835 1.0 1.14 -3.7 2.3 0.457 0.4 0.62 -0.8 1.5
DEU 0.148 0.4 1.1 -4.5 1.6 0.475 0.4 0.533 -0.5 2.1
HUN 0.403 0.7 1.23 -4.0 1.5 0.439 0.6 0.706 -2.3 1.4
POL 1.1 1.2 0.797 -0.5 2.4 0.782 1.0 0.554 -0.3 1.7
SVK 1.31 1.6 2.3 -9.1 6.1 0.693 0.65 0.292 0.1 1.3
Source: Eurostat (2018), own elaboration
Table 5| Economic sentiment indicator (ESI) – descriptive statistics
Period B (2002Q2_2009Q4) C (2010Q1_2016Q4)
Mean Med. s.d. Min Max Mean Med. s.d. Min Max
EU28 98.7 100.2 11.4 67.5 114.1 100.6 103.9 6.58 87.3 107.8
EU19 98.3 99.9 10.6 69.9 112.9 99.6 101.3 6.31 86.3 108.4
CZE 105.7 107.6 9.77 79 116.6 98.6 99.5 6.01 88.9 108.4
DEU 94.3 94.8 9.89 71.5 110.6 105 104.6 5.41 94 116
HUN 98.1 99.2 10.4 69.5 112.5 104 105.4 9.27 88.7 115.3
POL 99.3 97.6 11.1 80.3 118.1 96.1 97.8 4.61 86.3 101.4
SVK 104 106.8 12.5 68 117.8 97.6 98.8 4.82 86.6 103
Source: Eurostat (2018), own elaboration

Volume 8 | Issue 4 | 2019
https://doi.org/10.18267/j.cebr.220
CENTRAL EUROPEAN BUSINESS REVIEW
83
Table 6 | Consumer confidence indicator (CCI) – descriptive statistics
Period B (2002Q2_2009Q4) C (2010Q1_2016Q4)
Mean Med. s.d. Min Max Mean Med. s.d. Min Max
EU28 -12.8 -11.5 6.6 -31.8 -2.6 -12.1 -12 6.39 -24 -3.4
EU19 -14.4 -13.9 6.79 -32.8 -2.5 -13.4 -11.4 6.09 -26 -5.2
CZE -8.2 -7.8 7.83 -26.1 2.6 -10.7 -10.8 11.62 -28.4 5.5
DEU -11.7 -14.6 9.48 -31.4 8.9 -1.5 -1.3 5.69 -16.1 9.1
HUN -34.4 -29.2 17.61 -66.1 -1.1 -29.7 -24.3 11.81 -50.2 -15.9
POL -20 -21.6 11.17 -36.5 -1.9 -19.8 -20 6.99 -31.3 -7.9
SVK -20 -18.1 13.22 -40.9 3.3 -19.5 -19.2 9.11 -35.4 -6.1
Source: Eurostat (2018), own elaboration
Table 7| Industrial confidence indicator (ICI) - descriptive statistics
Period B (2002Q2_2009Q4) C (2010Q1_2016Q4)
Mean Med. s.d. Min Max Mean Med. s.d. Min Max
EU28 -7.2 -5.2 10.9 -35.7 7 -4.5 -3.1 4.83 -13.9 5.8
EU19 -7 -6.1 11.1 -35.7 7.4 -4.9 -3.8 5.2 -15.3 6.5
CZE 4 8.6 12.7 -32.8 17.2 0.9 2.3 6.03 -10.4 13.2
DEU -9.1 -7 13.7 -40.7 10.2 -1.7 -2.3 7.06 -14.7 14.5
HUN -7.4 -5.1 8.16 -32.1 2.5 0.1 2.5 5.73 -10.1 7.1
POL -12.1 -11.9 7.16 -27.5 -1 -13.7 -12.8 2.71 -20.2 -10.9
SVK 3.6 8.4 11.6 -29.5 17.3 1.2 2.2 4.87 -12.5 10.9
Source: Eurostat (2018), own elaboration

Volume 8 | Issue 4 | 2019
https://doi.org/10.18267/j.cebr.220
84 CENTRAL EUROPEAN BUSINESS REVIEW
Table 8 | Retail confidence indicator (RCI) – descriptive statistics
Period B (2Q2002_4Q2009) C (1Q2010_4Q2016)
Mean Med. s.d. Min Max Mean Med. s.d. Min Max
EU28 -6.2 -6.4 7.42 -24.2 6.6 -2.3 -0.6 6.54 -12.8 8
EU19 -8.6 -10.4 6.46 -20.8 3.4 -5.1 -3.1 6.77 -16.8 5.1
CZE 19.4 19.5 6.12 1.9 28.8 13 12.7 4.99 2.9 21.7
DEU -19.1 -21.3 9.29 -33.7 -2.2 -3 -2.8 6.43 -15.6 11.1
HUN -15.7 -13.9 7.85 -32.8 -3.9 -0.9 0.5 9.11 -16.1 10.5
POL -3.7 -6.1 7.57 -12.9 10.9 -2.6 -1.5 3.71 -10 1.9
SVK 10.8 13.8 12.7 -21.5 27 9.5 10.1 6.78 -9.8 20
Source: Eurostat (2018), own elaboration
Table 9| Construction confidence indicator (Constr.CI) – descriptive statistics
Period B (2002Q2_2009Q4) C (2010Q1_2016Q4)
Mean Med. s.d. Min Max Mean Med. s.d. Min Max
EU28 -11.6 -10.1 12.2 -38.9 3.4 -23.9 -25 5.91 -33.3 -11.5
EU19 -11 -10.9 11.1 -36 4.1 -24.5 -24.9 4.35 -30.5 -13.1
CZE -6.2 -3.5 9.53 -35 3.7 -35.2 -38.8 11.1 -53.5 -16.1
DEU -35.3 -31 12.5 -52.9 -14.1 -9.1 -8.7 6.36 -26.4 4.0
HUN -22.5 -18.9 13.1 -53.6 -3 -26 -26.9 15.0 -46.7 -3.5
POL -31.2 -34.4 20.1 -65.6 -1.7 -29.4 -28.1 5.69 -40.5 -23.0
SVK -15.9 -13.4 13.8 -51.9 2.9 -32.4 -37.5 16.2 -56 -1.5
Source: Eurostat (2018), own elaboration

Volume 8 | Issue 4 | 2019
https://doi.org/10.18267/j.cebr.220
CENTRAL EUROPEAN BUSINESS REVIEW
85
Table 10| Service confidence indicator (SCI) – descriptive statistics
Period B (2002Q2_2009Q4) C (2010Q1_2016Q4)
Mean Med. s.d. Min Max Mean Med. s.d. Min Max
EU28 4.1 7.7 12.3 -26.7 18.9 3.9 7 7.29 -11.2 13.5
EU19 4.6 7.7 11.3 -22.6 18.7 3.6 5 7.14 -10.4 12.6
CZE 39 43 11.1 10 50 27.3 26.7 4.22 19 36.7
DEU 5.5 8.8 11.5 -19.2 20 15.7 15 6.24 4 27.7
HUN -8.1 -5.8 12.8 -40.1 9.7 -6.4 -7.9 12.3 -25.9 9.5
POL 5.5 3.4 8.9 -9.0 22.2 1.1 0.4 4.18 -6.8 8.6
SVK 34.2 42.0 20.9 -20.9 57.7 13.4 14.2 8.34 -0.8 31.5
Source: Eurostat (2018), own elaboration