Change in Relative Density of Natural Rock Minerals Due to ...
12
Change in relative density of natural rock minerals due to electron irradiation Ippei Maruyama , Shunsuke Muto Journal of Advanced Concrete Technology, volume ( ), pp. 14 2016 706-716 This paper will also be published as an electronic book together with other papers of the special issue, "Aging management of concrete structures in nuclear power plants" in 2016.
Transcript of Change in Relative Density of Natural Rock Minerals Due to ...
Change in relative density of natural rock minerals due toelectron irradiationIppei Maruyama, Shunsuke Muto
Journal of Advanced Concrete Technology, volume ( ), pp.14 2016 706-716
This paper will also be published as an electronic book together with other papers of the special issue,"Aging management of concrete structures in nuclear power plants" in 2016.

Journal of Advanced Concrete Technology Vol. 14, 706-716, November 2016 / Copyright © 2016 Japan Concrete Institute 706
Scientific paper
Change in Relative Density of Natural Rock Minerals Due to Electron Irradiation Ippei Maruyama1* and Shunsuke Muto2
Received 18 July 2016, accepted 3 November 2016 doi:10.3151/jact.14.706
Abstract We investigated changes in the density of natural rock minerals following high-energy electron irradiation, using the plasmon peak shift of electron energy-loss spectra and transmission electron microscopy. The target materials were the natural rock minerals α-quartz, orthoclase, anorthite, albite, biotite, muscovite, and chlorite. These crystalline minerals can be classified into three groups based on their Si-network geometries: 3-dimensional 6-member ring; 4-member ring + 6-member ring; and planar 6-member ring. The metamictization rates and changes in relative density are discussed using a phenomenological model, which we used to identify the physical parameters that describe the metamictization process as a function of the volume density of Si and Al atoms, or Si atoms alone, in the crystal structures. The relative densities following metamictization all decreased by more than a few percent, except for albite, which became denser. These results suggest that radiolysis damage causes initial compaction, then metamictization, characterized by the expansion of the Si- and Al-polyhedra in the aggregate. The stability of concrete containing α-quartz, orthoclase, and anorthite should be further investigated in the light of the present results.
1. Introduction
Light water reactors (LWRs) are considered an important power supplier even after the Fukushima Daiichi acci-dent. A Japanese cabinet decision passed on April 11, 2014, nuclear electric power is considered as an impor-tant base load power. Safe long-term operation of nuclear power plants (NPPs) will be required in the near future in Japan, because construction of new NPPs will be con-siderably difficult.
From a viewpoint of aging management and plant life management for concrete structures of LWR, deteriora-tion of concrete is a key research topic, because concrete structures are hardly replaced. While deteriorations of concrete structures have been extensively researched in civil engineering field, there still remains the character-istic deterioration environment, i.e., irradiation, fully unexploited in NPPs (Rosseel et al. 2016). Biological shielding concrete walls (in case of a pressurized water reactor; PWR) or reactor vessel support pedestals (in case of a boiling water reactor; BWR) are irradiated by neutrons and gamma rays from the reactor during op-eration.
The neutron and gamma-ray irradiation effects on the physical properties of concrete has been firstly summa-rized by Hilsdorf et al. (1978), whose results, however, included concrete and mortar not representative of LWRs
concrete. Maruyama et al. (2013) then summarized the relationship between the fast neutron fluence and relative compressive strength for concrete or mortar applicable to concrete members in LWRs. They confirmed a clear trend of the decrease in the relative strength with the fluence for more than 1–3 × 10¹⁹ n/cm2. This trend is almost consistent to the integrated data of irradiated concrete recently reported by Field et al. (2015).
It has been reported that deteriorated concrete showed expansion after irradiation (Dubrovskii et al. 1970; Elleuch et al. 1971; Elleuch et al. 1972; Hilsdorf et al. 1978; Seeberger and Hilsdorf 1982). The main reason is considered as an expansion of aggregate, because α-quartz is well-known to show an expansion and den-sity reduction under neutron and electron irradiation (Primak et al. 1955; Primak 1958; Bonnet et al. 1994; Douillard and Duraud 1996; Bolse 1999; Ewing et al. 2000; Field et al. 2015). It is hence considered that the natural rock should be sensitive to irradiation, which poses very important issues on the durability of concrete under irradiation as 1) expansion of aggregate, and 2) degradation of concrete performance as a result of 1) (Maruyama et al. 2012; Field et al. 2015; Giorla et al. 2015; Le Pape et al. 2015, 2016; Maruyama et al. 2016).
In the present contribution, we conducted electron ir-radiation experiments to examine how the sili-cate/aluminate unit polyhedral aggregates respond to irradiation, especially of which radiolysis impact, with respect to the density change in several fundamental natural minerals.
2. Experimental procedure
2.1 Materials We examined the following materials in the experiment:
1Professor, Graduate School of Environmental Studies, Nagoya University, Nagoya, Japan. *Corresponding author, E-mail: [email protected] 2 Professor, Advanced Measurement Technology Center, Institute of Materials and Systems for Sustainability, Nagoya University, Nagoya, Japan.
I. Maruyama and S. Muto / Journal of Advanced Concrete Technology Vol. 14, 706-716, 2016 707
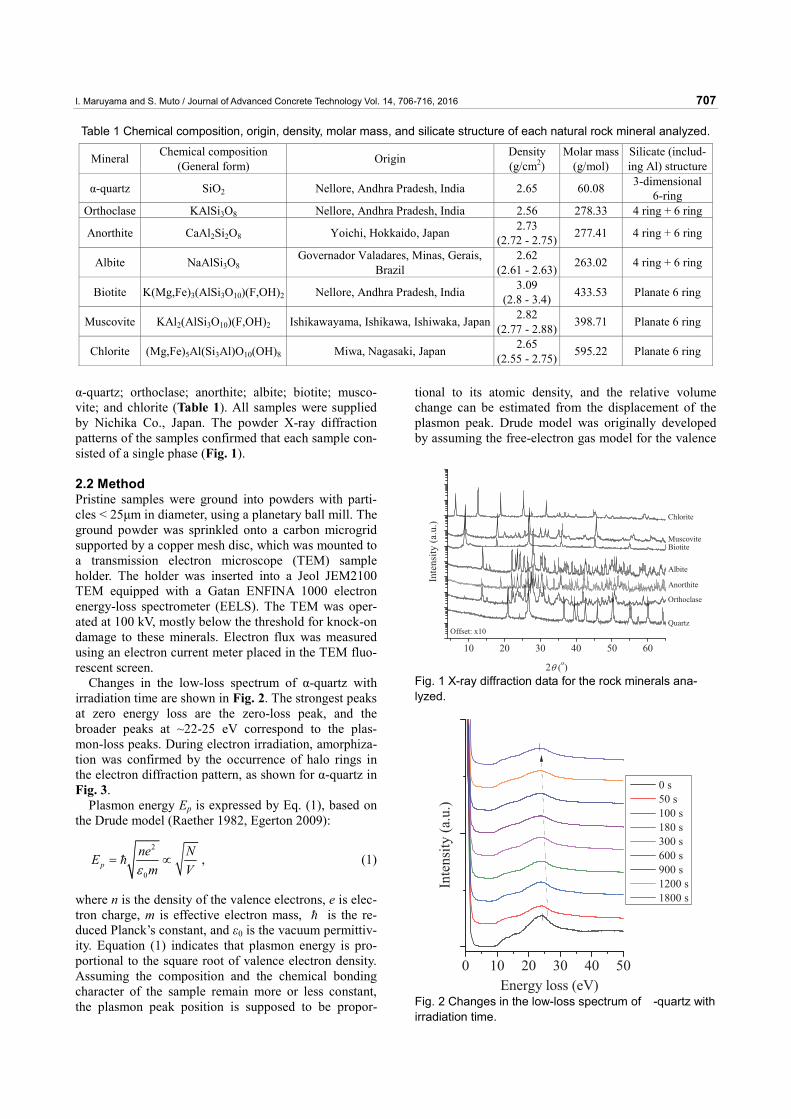
α-quartz; orthoclase; anorthite; albite; biotite; musco-vite; and chlorite (Table 1). All samples were supplied by Nichika Co., Japan. The powder X-ray diffraction patterns of the samples confirmed that each sample con-sisted of a single phase (Fig. 1). 2.2 Method Pristine samples were ground into powders with parti-cles < 25μm in diameter, using a planetary ball mill. The ground powder was sprinkled onto a carbon microgrid supported by a copper mesh disc, which was mounted to a transmission electron microscope (TEM) sample holder. The holder was inserted into a Jeol JEM2100 TEM equipped with a Gatan ENFINA 1000 electron energy-loss spectrometer (EELS). The TEM was oper-ated at 100 kV, mostly below the threshold for knock-on damage to these minerals. Electron flux was measured using an electron current meter placed in the TEM fluo-rescent screen.
Changes in the low-loss spectrum of α-quartz with irradiation time are shown in Fig. 2. The strongest peaks at zero energy loss are the zero-loss peak, and the broader peaks at ~22-25 eV correspond to the plas-mon-loss peaks. During electron irradiation, amorphiza-tion was confirmed by the occurrence of halo rings in the electron diffraction pattern, as shown for α-quartz in Fig. 3.
Plasmon energy Ep is expressed by Eq. (1), based on the Drude model (Raether 1982, Egerton 2009):
2
0p
ne NEm Vε
= ∝ , (1)
where n is the density of the valence electrons, e is elec-tron charge, m is effective electron mass, is the re-duced Planck’s constant, and ε0 is the vacuum permittiv-ity. Equation (1) indicates that plasmon energy is pro-portional to the square root of valence electron density. Assuming the composition and the chemical bonding character of the sample remain more or less constant, the plasmon peak position is supposed to be propor-
tional to its atomic density, and the relative volume change can be estimated from the displacement of the plasmon peak. Drude model was originally developed by assuming the free-electron gas model for the valence
Fig. 1 X-ray diffraction data for the rock minerals ana-lyzed.
Fig. 2 Changes in the low-loss spectrum of �-quartz with irradiation time.
Table 1 Chemical composition, origin, density, molar mass, and silicate structure of each natural rock mineral analyzed.
Mineral Chemical composition (General form) Origin Density
(g/cm2) Molar mass
(g/mol) Silicate (includ-ing Al) structure
α-quartz SiO2 Nellore, Andhra Pradesh, India 2.65 60.08 3-dimensional 6-ring
Orthoclase KAlSi3O8 Nellore, Andhra Pradesh, India 2.56 278.33 4 ring + 6 ring
Anorthite CaAl2Si2O8 Yoichi, Hokkaido, Japan 2.73 (2.72 - 2.75) 277.41 4 ring + 6 ring
Albite NaAlSi3O8 Governador Valadares, Minas, Gerais,
Brazil 2.62
(2.61 - 2.63) 263.02 4 ring + 6 ring
Biotite K(Mg,Fe)3(AlSi3O10)(F,OH)2 Nellore, Andhra Pradesh, India 3.09 (2.8 - 3.4) 433.53 Planate 6 ring
Muscovite KAl2(AlSi3O10)(F,OH)2 Ishikawayama, Ishikawa, Ishiwaka, Japan 2.82 (2.77 - 2.88) 398.71 Planate 6 ring
Chlorite (Mg,Fe)5Al(Si3Al)O10(OH)8 Miwa, Nagasaki, Japan 2.65 (2.55 - 2.75) 595.22 Planate 6 ring
I. Maruyama and S. Muto / Journal of Advanced Concrete Technology Vol. 14, 706-716, 2016 708
electrons in metals, though it has been well established that the model is applicable to materials having covalent and/or ionic bonds when the plasmon peak energy is significantly larger than the band gap energy (Egerton 2011) and Eq. (1) provides reasonable agreement with experimental values. It is thus considered that the pre-sent analyses can be effective unless a significant com-positional change or appreciable phase separation is observed during the irradiation. 3. Results
The changes in the relative density of the rock minerals tested, as a function of electron dose, are summarized in Fig. 4 and Table 2. Each mineral demonstrated different degrees of tolerance to electron irradiation. The relative density of α-quartz and orthoclase decreased monotoni-cally, then asymptotically approached its final value. For α-quartz this was −4%, at a dose of ~6 × 10²⁰ e/cm2, and dose at metamictization was similar to the previous re-sults (Inui et al. 1990). Orthoclase exhibited a greater tolerance and reached its final value of about −2% at ~2 × 10²¹ e/cm2. The metamictization of α-quartz pro-ceeded very rapidly.
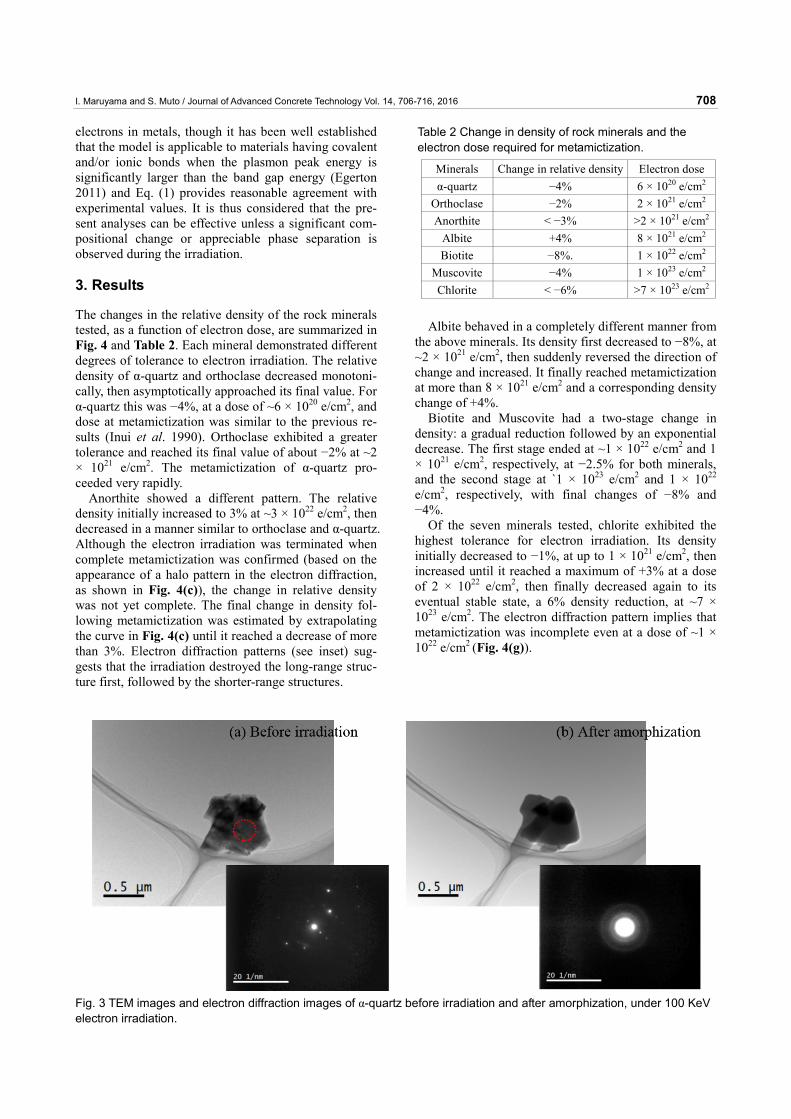
Anorthite showed a different pattern. The relative density initially increased to 3% at ~3 × 10²² e/cm2, then decreased in a manner similar to orthoclase and α-quartz. Although the electron irradiation was terminated when complete metamictization was confirmed (based on the appearance of a halo pattern in the electron diffraction, as shown in Fig. 4(c)), the change in relative density was not yet complete. The final change in density fol-lowing metamictization was estimated by extrapolating the curve in Fig. 4(c) until it reached a decrease of more than 3%. Electron diffraction patterns (see inset) sug-gests that the irradiation destroyed the long-range struc-ture first, followed by the shorter-range structures.
Albite behaved in a completely different manner from the above minerals. Its density first decreased to −8%, at ~2 × 10²¹ e/cm2, then suddenly reversed the direction of change and increased. It finally reached metamictization at more than 8 × 10²¹ e/cm2 and a corresponding density change of +4%.
Biotite and Muscovite had a two-stage change in density: a gradual reduction followed by an exponential decrease. The first stage ended at ~1 × 10²² e/cm2 and 1 × 10²¹ e/cm2, respectively, at −2.5% for both minerals, and the second stage at `1 × 10²³ e/cm2 and 1 × 10²² e/cm2, respectively, with final changes of −8% and −4%.
Of the seven minerals tested, chlorite exhibited the highest tolerance for electron irradiation. Its density initially decreased to −1%, at up to 1 × 10²¹ e/cm2, then increased until it reached a maximum of +3% at a dose of 2 × 10²² e/cm2, then finally decreased again to its eventual stable state, a 6% density reduction, at ~7 × 10²³ e/cm2. The electron diffraction pattern implies that metamictization was incomplete even at a dose of ~1 × 10²² e/cm2 (Fig. 4(g)).
Table 2 Change in density of rock minerals and the electron dose required for metamictization.
Minerals Change in relative density Electron doseα-quartz −4% 6 × 10²⁰ e/cm2
Orthoclase −2% 2 × 10²¹ e/cm2
Anorthite < −3% >2 × 10²¹ e/cm2
Albite +4% 8 × 10²¹ e/cm2
Biotite −8%. 1 × 10²² e/cm2
Muscovite −4% 1 × 10²³ e/cm2
Chlorite < −6% >7 × 10²³ e/cm2
Fig. 3 TEM images and electron diffraction images of α-quartz before irradiation and after amorphization, under 100 KeV electron irradiation.

I. Maruyama and S. Muto / Journal of Advanced Concrete Technology Vol. 14, 706-716, 2016 709
(a) α-quartz (b) Orthoclase
(c) Anorthite (d) Albite
(e) Biotite (f) Muscovite
(g) Chlorite
Fig. 4 Change in relative density of rock minerals as a function of electron dose at 100 KeV. Inset images show the electron differentiation patterns used to identify the completion of metamictization.
I. Maruyama and S. Muto / Journal of Advanced Concrete Technology Vol. 14, 706-716, 2016 710
4. Discussion
Minerals that are largely based on silicates consist of a flexibly joined network of Si-Ox polyhedra, with heavier cations located in the spacious channels between the polyhedra. In the case of α-quartz, the metamictization process was proposed previously (Hobbs and Pascucci 1980; Hobbs 1995). These authors suggested that the tetrahedral Si-O4 network is metamictized by electron irradiation via the excitonic excitation of the Si-O bond, which results in the configurational instability of the oxygen atom. This atom moves to an off-center position, immediately connecting with a neighboring oxygen atom to form a peroxy geometry. This generation of a Frenkel pair (an oxygen vacancy and a molecular oxy-gen crowdion interstitial) effectively breaks the silica network, and the adjacent SiO4 units are relaxed to form flexibly linked triangular structures (SiO3). When the density of such affected structures reaches a critical level, associated local bond-breaking and stochastic local reconstruction will bring about topological disor-dering (Hobbs 1995). This final state is called a metamict state.
In this study, we confirmed metamictization by the appearance of a halo ring pattern in the electron diffrac-tion insets in Fig. 4, particularly those in (e), (f), and (g), in which the halo ring was apparently exhibited in the lower-order superlattice reflections, while the funda-mental reflections remained spotty. This suggests that the metamictization began with the deformation of the long-range superstructures, followed by the collapse of the shorter-range structures, possibly the unit polyhedral structures. During the initial process of long-range structural deformation, a slight increase in density was common (e.g. Figs. 4(b), (c), and (g)). This confirms the findings in a previous report that α-quartz showed a slight increase in density under a low-dose regime (those experimental data showed slight hardening; (Nakano et al. 2005)). The metamictization dose for SiO4 tetrahedra is reported to be ~7 eV/atom (Eby et al. 1992), and the displacement threshold energies for Si and O are 11-22 eV and 9 eV respectively (Inui et al. 1990; Hobbs et al. 1994). Al2O3 and MgO also exhibit metamictization as a result of electron irradiation. The displacement threshold energies for Al and O in Al2O3 are ~20 eV and 50~75 eV respectively, and the metamictization dose is 3500 eV/atom, while for Mg and O they are 60 and 65 eV/atom respectively, and the metamictization dose for MgO is 6000 eV/atom (Hobbs 1994). It is hence thought that ionic bonded materials are more tolerant of irradiation (Hobbs et al. 1994), and that the metamictization and resultant relative density changes observed in this study are attributable to radio-lysis by way of the deformation of the silica (or alumi-num) bonding network.
The change in relative density following electron ir-radiation that we observed for α-quartz was about −4%, much smaller than the effect of neutron irradiation,
which is reported as 14−15% (Primak 1958; Lell et al. 1968; Bykov et al. 1981). Other research has shown that the metamictized structure resulting from neutron irra-diation is not the same as that caused by electron irra-diation (Hobbs 1995). This suggests that electron irra-diation experiments do not simulate the metamictization process of rock minerals caused by neutron irradiation. A previous electron irradiation experiment, using an electron energy of > 1500 KeV, revealed a ballistic ef-fect (or knock-on impact) on metamictization, and the resultant EELS structure evaluation showed a new and unexpected structure.
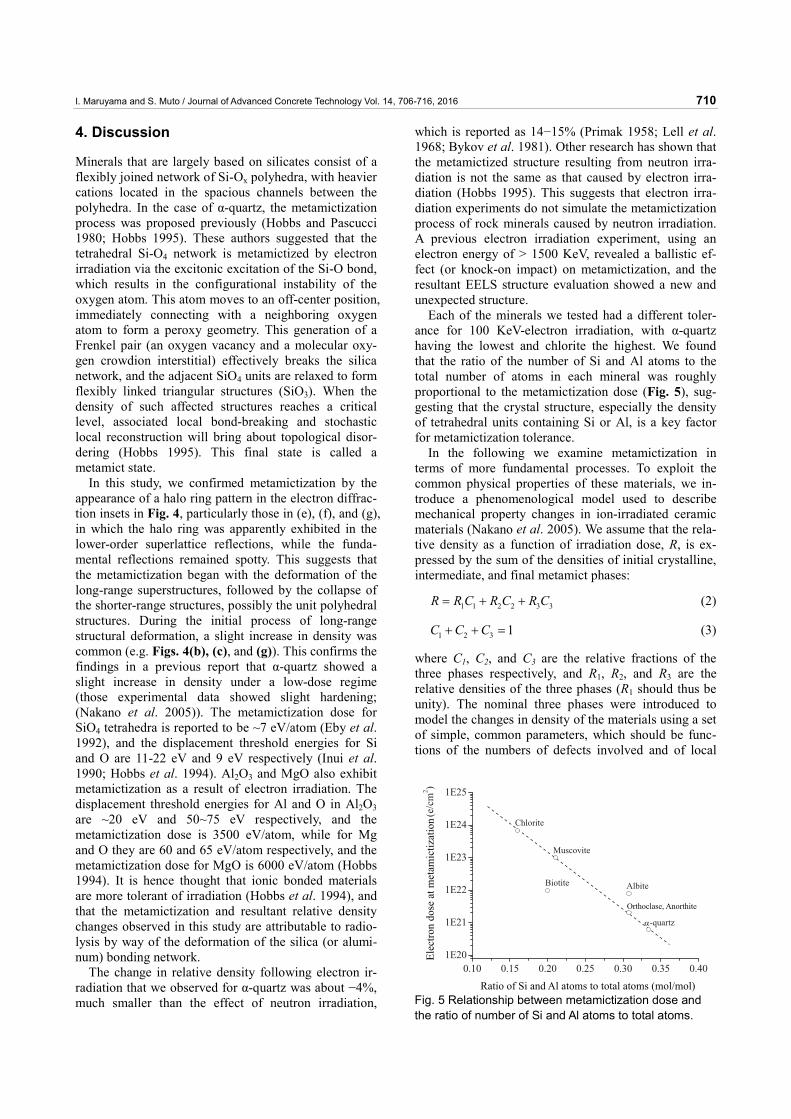
Each of the minerals we tested had a different toler-ance for 100 KeV-electron irradiation, with α-quartz having the lowest and chlorite the highest. We found that the ratio of the number of Si and Al atoms to the total number of atoms in each mineral was roughly proportional to the metamictization dose (Fig. 5), sug-gesting that the crystal structure, especially the density of tetrahedral units containing Si or Al, is a key factor for metamictization tolerance.
In the following we examine metamictization in terms of more fundamental processes. To exploit the common physical properties of these materials, we in-troduce a phenomenological model used to describe mechanical property changes in ion-irradiated ceramic materials (Nakano et al. 2005). We assume that the rela-tive density as a function of irradiation dose, R, is ex-pressed by the sum of the densities of initial crystalline, intermediate, and final metamict phases:
1 1 2 2 3 3R R C R C R C= + + (2)
1 2 3 1C C C+ + = (3)
where C1, C2, and C3 are the relative fractions of the three phases respectively, and R1, R2, and R3 are the relative densities of the three phases (R1 should thus be unity). The nominal three phases were introduced to model the changes in density of the materials using a set of simple, common parameters, which should be func-tions of the numbers of defects involved and of local
Fig. 5 Relationship between metamictization dose and the ratio of number of Si and Al atoms to total atoms.
I. Maruyama and S. Muto / Journal of Advanced Concrete Technology Vol. 14, 706-716, 2016 711
structures. The metamictization process can be ex-pressed using the following reaction rate equations:
11 1 2
21 1 2 2 2
32 2
dCC bC
dtdC
C C bCdt
dCC
dt
φσ
φσ φσ
φσ
⎧ = − +⎪⎪⎪ = − −⎨⎪⎪
=⎪⎩
(4)
where φ is electron flux (e/cm2), and 1σ and 2σ are the effective cross sections for damage production from the initial crystalline phase to the intermediate phase, and from the intermediate phase to the metamict phase, respectively. We assume that the intermediate phase can be thermally reversed to the initial phase, whereas the metamict phase is irreversible once reached. This as-sumption is drawn from the facts that (neutron-) metamicted structure showed consistent volume change regardless temperature during irradiation (Bykov et al. 1981). It should be noted that this model is quite simpli-fied but this has been successfully applied to predict the physical property of electron-irradiated materials (Nakano et al. 2005). The set of equations (4) can be solved analytically, and the experimental data were fit to the solutions using least-squares (solid lines in Fig. 4) to yield the parameters 1σ , 2σ , b, R2, and R3. (Table 3). The thermal recovery parameter b can take arbitrary small values for orthoclase and biotite, where the cross sections for damage formation, 1σ and 2σ , are not significantly different from each other. This suggests that metamictization proceeds according to a single ra-diolysis process in those minerals. On the other hand, the other minerals exhibited considerable thermal re-covery and different values for 1σ and 2σ , which suggests that metamictization follows a two-step proc-ess in those minerals. The derived cross section values are also reasonable for radiolysis (Ugurlu et al. 2011). These results are obviously supporting that the applied eq. (4) is good enough as the first approximation of the observed phenomenon and not far from the real phe-nomenon.
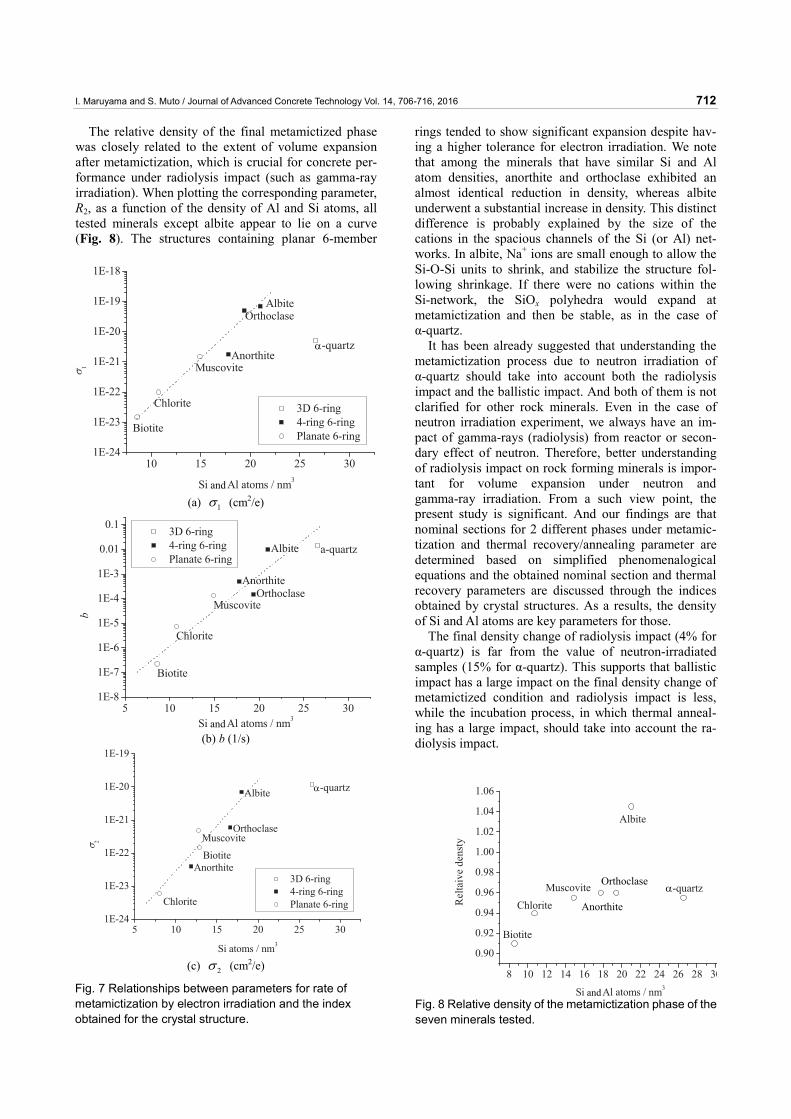
The 1σ s values for the seven minerals are plotted as a function of the density of Si and Al atoms in Fig. 7(a), since the bonding of the oxygen atom in Si-O-Si, Si-O-Al, or Al-O-Al is likely the most susceptible point for irradiation damage, and the density of Si and Al can
thus be used as a measure of damage tolerance. All the data points except that for α-quartz exhibit a linear rela-tionship. Muscovite, chlorite, and biotite consist of a planar 6-ring Si structure (as does Al to some extent and in some cases), which is thought to be more tolerant of irradiation than a 6-member ring and 4-member ring structure or a 3-dimensional 6-ring structure. Biotite is characterized by 6-member Si ring wedges and K+ and Mg/Al-O layers interpenetrating each other. Chlorite, on the other hand, has a 6-member Si ring wedge between a Mg/Al-O layer and interlayer Mg2+/Al2+ cations, and muscovite includes a 6-member Si ring wedge between interlayer K+ cations and Al-O layers. Of these three minerals, muscovite shows the largest cross section 1σ , probably because of the larger number of Al-O-Al, Al-O-Si, and Si-O-Si networks it contains.
Albite, orthoclase, and anorthite have 4-member Si ring and 6-member Si ring structures, with larger cations in the channels between the networks, and have larger
1σ values than the minerals with planar 6-member ring structures. Among these three minerals, albite has the largest 1σ , which can be explained by the Si-O-Si an-gles linking the Si-polyhedra being more flexible due to the small cations (Na+) in the spacious channels of the Si-networks. In this context, α-quartz is an outlier (Fig. 7(a)), probably because it has a greater capacity for the Si-O-Si angles to change, since it has no other cations in the channels to resist local deformation.
The relationship of the thermal recovery parameter, b, relative to the density of Si and Al atoms is similarly linear, and α-quartz is not as much of an outlier (Fig. 7(b)). We can thus conclude that both 1σ and b are governed by the flexibility inherent in their Si-O-Si, Si-O-Al, and Al-O-Al networks and the location of other cations in these networks. Larger cations probably play a role in restricting the change in angle possible in these networks.
The value of 2σ , the effective cross section of trans-formation from the intermediate phase to the metamict phase, is thought to be related to the collapse of Si-O-Si bonds. Plotting 2σ as a function of the density of Si atoms (Fig. 7(c)) yielded a strong linear relationship, although this parameter did not show a good correlation with the density of Si and Al atoms. We therefore con-clude that the final metamictization process is mainly attributable to the collapse of Si-O-Si bonds. However, α-quartz was an outlier in this respect as well, and ex-hibited different tendencies than the other minerals.
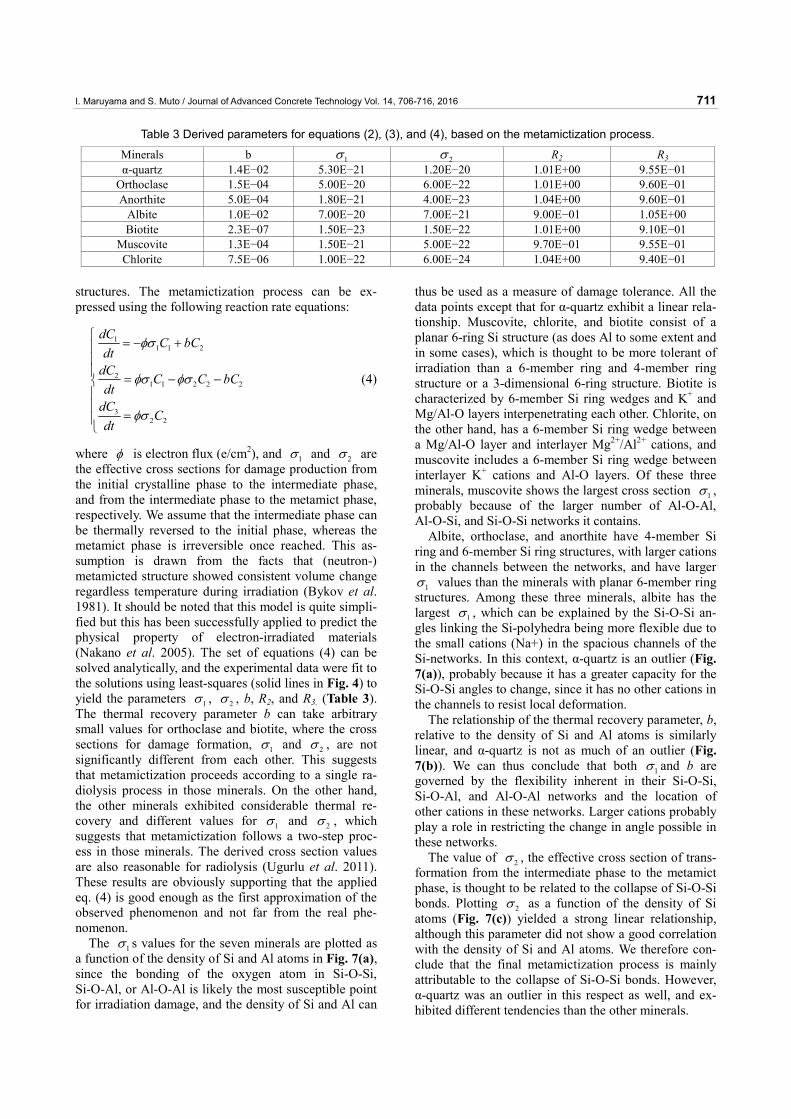
Table 3 Derived parameters for equations (2), (3), and (4), based on the metamictization process.
Minerals b 1σ 2σ R2 R3 α-quartz 1.4E−02 5.30E−21 1.20E−20 1.01E+00 9.55E−01
Orthoclase 1.5E−04 5.00E−20 6.00E−22 1.01E+00 9.60E−01 Anorthite 5.0E−04 1.80E−21 4.00E−23 1.04E+00 9.60E−01
Albite 1.0E−02 7.00E−20 7.00E−21 9.00E−01 1.05E+00 Biotite 2.3E−07 1.50E−23 1.50E−22 1.01E+00 9.10E−01
Muscovite 1.3E−04 1.50E−21 5.00E−22 9.70E−01 9.55E−01 Chlorite 7.5E−06 1.00E−22 6.00E−24 1.04E+00 9.40E−01
I. Maruyama and S. Muto / Journal of Advanced Concrete Technology Vol. 14, 706-716, 2016 712
The relative density of the final metamictized phase was closely related to the extent of volume expansion after metamictization, which is crucial for concrete per-formance under radiolysis impact (such as gamma-ray irradiation). When plotting the corresponding parameter, R2, as a function of the density of Al and Si atoms, all tested minerals except albite appear to lie on a curve (Fig. 8). The structures containing planar 6-member
rings tended to show significant expansion despite hav-ing a higher tolerance for electron irradiation. We note that among the minerals that have similar Si and Al atom densities, anorthite and orthoclase exhibited an almost identical reduction in density, whereas albite underwent a substantial increase in density. This distinct difference is probably explained by the size of the cations in the spacious channels of the Si (or Al) net-works. In albite, Na+ ions are small enough to allow the Si-O-Si units to shrink, and stabilize the structure fol-lowing shrinkage. If there were no cations within the Si-network, the SiOx polyhedra would expand at metamictization and then be stable, as in the case of α-quartz.
It has been already suggested that understanding the metamictization process due to neutron irradiation of α-quartz should take into account both the radiolysis impact and the ballistic impact. And both of them is not clarified for other rock minerals. Even in the case of neutron irradiation experiment, we always have an im-pact of gamma-rays (radiolysis) from reactor or secon-dary effect of neutron. Therefore, better understanding of radiolysis impact on rock forming minerals is impor-tant for volume expansion under neutron and gamma-ray irradiation. From a such view point, the present study is significant. And our findings are that nominal sections for 2 different phases under metamic-tization and thermal recovery/annealing parameter are determined based on simplified phenomenalogical equations and the obtained nominal section and thermal recovery parameters are discussed through the indices obtained by crystal structures. As a results, the density of Si and Al atoms are key parameters for those.
The final density change of radiolysis impact (4% for α-quartz) is far from the value of neutron-irradiated samples (15% for α-quartz). This supports that ballistic impact has a large impact on the final density change of metamictized condition and radiolysis impact is less, while the incubation process, in which thermal anneal-ing has a large impact, should take into account the ra-diolysis impact.
(a) 1σ (cm2/e)
(b) b (1/s)
(c) 2σ (cm2/e)
Fig. 7 Relationships between parameters for rate of metamictization by electron irradiation and the index obtained for the crystal structure.
Fig. 8 Relative density of the metamictization phase of the seven minerals tested.
I. Maruyama and S. Muto / Journal of Advanced Concrete Technology Vol. 14, 706-716, 2016 713
5. Conclusion
We investigated the effects of electron irradiation on the relative density of the natural rock minerals α-quartz, orthoclase, anorthite, albite, biotite, muscovite, and chlorite, in terms of plasmon peak shift, using TEM-EELS. Each mineral showed a substantially dif-ferent tolerance for electron fluence, in terms of the ex-tent of its amorphization, as confirmed by electron dif-fraction and the change in relative density. The relative density increased only for albite, and decreased for the other minerals. The changes in density amounted to several percent, which would likely be non-negligible for components of concrete. The density change due to electron-irradiation was 4% in case of α-quartz and this value is far from the density change due to neu-tron-irradiation. Consequently, the present elec-tron-irradiation experiments are limited to understand the radiolysis impact. Applying phenomenological kinetic reaction rate equations to this process, we found that the metamictization rate was linearly correlated with the density of Si and Al atoms or of Si atoms alone. Crystal structures containing Si networks of 4- and 6-member rings, such as albite, orthoclase, and anorthite, had al-most identical tolerance for electron irradiation to that of α-quartz. We also found that the relative density of the metamict phase could be expressed as a smooth function of the density of Si and Al atoms.
The fact that irradiation induced swelling in these mineral aggregates is an important issue for the concrete used in LWRs. These results highlight the importance of neutron and gamma-ray irradiation experiments on the natural rock minerals that are potentially used in con-structing LWRs. Aggregates in concrete members that are subject to neutron and gamma-ray irradiation are thought to be degraded by radiolysis impact as well as ballistic impact, and would expand in volume if they contain the minerals we have studied here. Several as-pects of this process, highlighted in the present study, remain to be clarified. These include the energy and temperature dependencies of the volume expansion, the metamictizaion and recrystallization processes of each mineral under neutron and gamma-ray irradiation (Bolse 1999), and how all of these aspects affect composites, including cracking at mineral grain boundaries due to heterogeneous volume changes of the constituent min-erals in an aggregate.
Acknowledgements This work was partially supported by a Grant-in-Aid on Innovative Areas “Nano Informatics” (Grant No. 25106004) from the Japan Society for the Promotion of Science and crystal figures in appendix were drawn with VESTA. References Bolse, W., (1999). “Amorphization and recrystallization
of covalent tetrahedral networks.” Nuclear Instru-
ments and Methods in Physics Research, Section B: Beam Interactions with Materials and Atoms, 148(1-4), 83-92.
Bonnet, J. P., Boissier, M. and Ait Gherbi, A., (1994). “The amorphization process of neutron-irradiated crystalline quartz studied by Brillouin scattering.” Journal of Non-Crystalline Solids, 167(1–2), 199-204.
Bykov, V. N., Denisov, A. V., Dubrovskii, V. B., Korenevskii, V. V., Krivokoneva, G. K. and Muzalevskii, L. P., (1981). “Effect of irradiation temperature on the radiation expansion of quartz.” Soviet Atomic Energy, 51(3), 593-595.
Douillard, L. and Duraud, J. P., (1996). “Amorphization of α-quartz under irradiation.” Journal de Physique III, 6 (12), 1677-1687.
Dubrovskii, V. B., Ibragimov, S. S, Korenevskii, V. V., Ladygin, A. Y., Pergamenshchik, V. K. and Perevalov, V. S., (1970). “Hematite concrete for shielding against high neutron fluxes.” Soviet Atomic Energy-Ussr, 28(3), 336-338.
Eby, R. K., Ewing, R. C. and Birtcher, R. C., (1992). “Amorphization of complex silicates by ion-beam irradiation.” Journal of Materials Research, 7(11), 3080-3102.
Egerton, R. F., (2009). “Electron energy-loss spectros-copy in the TEM.” Reports on Progress in Physics, 72(1), 016502.
Egerton, R. F., (2011). “Electron energy-loss spectros-copy in the electron microscope.” Third. Springer Science & Business Media.
Elleuch, L. F., Dubois, F. and Rappeneau, J., (1972). “Effects of neutron radiation on special concretes and their components.” Special Publication, 34.
Elleuch, M. R., Dubois, F. and Rappenau, J., (1971). “Behavior of special shielding concretes and of their constituents under neutron irradiation.” Fourth United Nations International Conference on the Peaceful Uses of Atomic Energy, 7.
Ewing, R. C., Meldrum, A., Wang, L. and Wang, S., (2000). “Radiation-induced amorphization.” Reviews in Mineralogy and Geochemistry, 39, 319-361.
Field, K. G., Remec, I. and Le Pape, Y., (2015). “Radiation effects in concrete for nuclear power plants – Part I: Quantification of radiation exposure and radiation effects.” Nuclear Engineering and Design, 282 0 126-143.
Giorla, A., Vaitová, M., Le Pape, Y. and Štemberk, P., (2015). “Meso-scale modeling of irradiated concrete in test reactor.” Nuclear Engineering and Design ,295, 59-73.
Harlow, G. E., (1982). “The anorthoclase structures; the effects of temperature and composition.” American Mineralogist , 67(9-10), 975-996.
Hilsdorf, H., Kropp, J. and Koch, H., (1978). “The effects of nuclear radiation on the mechanical properties of concrete.” ACI SP-55, 223-251.
Hobbs, L. and Pascucci, M., (1980). “Radiolysis and defect structure in electron-irradiated α-quartz.” Le
I. Maruyama and S. Muto / Journal of Advanced Concrete Technology Vol. 14, 706-716, 2016 714
Journal de Physique Colloques, 41, C6 C6-237-C236-242.
Hobbs, L. W., (1995). “The role of topology and geometry in the irradiation-induced amorphization of network structures.” Journal of Non-Crystalline Solids, 182(1), 27-39.
Hobbs, L. W., Clinard Jr, F. W., Zinkle, S. J. and Ewing, R. C., (1994). “Radiation effects in ceramics.” Journal of Nuclear Materials, 216(C), 291-321.
Inui, H., Mori, H., Sakata, T. and Fujita, H., (1990). “Electron irradiation induced crystalline-to-amorphous transition in quartz single crystals.” Journal of Non-Crystalline Solids, 116(1), 1-15.
Le Pape, Y., Field, K. G. and Remec, I., (2015). “Radiation effects in concrete for nuclear power plants, Part II: Perspective from micromechanical modeling.” Nuclear Engineering and Design, 282, 144-157.
Le Pape, Y., Giorla, A. and Sanahuja, J., (2016). “Combined Effects of Temperature and Irradiation on Concrete Damage.” Journal of Advanced Concrete Technology, 14(3), 70-86.
Lell, E., Kreidl, N. J. and Hensler, J. R., (1968). “Radiation effects in quartz, silica, and glasses.” In: Progress in Ceramic Science. Volume 4. Burke, JE (ed.). New York, Pergamon Press, Inc., 1-93.
Levien, L., Prewit, C. T. and Weidner, D. J., (1980). “Structure and elastic properties of quartz at pressure.” American Mineralogist, 65(9-10), 920-930.
Maruyama, I., Haba, K., Sato, O., Ishikawa, S., Kontani, O. and Takizawa, M., (2016). “A numerical model for concrete strength change under neutron and gamma-ray irradiation.” Journal of Advanced Concrete Technology 14(4), 144-162.
Maruyama, I., Kontani, O., Ishizawa, A., Takizawa, M. and Sato, O., (2012). “Development of system for evaluating concrete strength deterioration due to radiation and resultant heat.” Proceedings of 3rd International Conference on NPP Life Management for Long Term Operations, IAEA-CN-194-096, Salt Lake City, May.
Maruyama, I., Kontani, O., Sawada, S., Sato, O., Igarashi, G. and Takizawa, M., (2013). “Evaluation of irradiation effects on concrete structure-background and preparation of neutron irradiation test.” American Society of Mechanical Engineers, Power Division (Publication) POWER.
Momma, K. and Izumi, F., (2011). “VESTA 3 for three-dimensional visualization of crystal, volumetric and morphology data.” J. Appl. Crystallogr., 44, 1272-1276.
Nakano, S., Muto, S. and Tanabe, T., (2005). “Change in
mechanical properties of ion-irradiated ceramics studied by nanoindentation method.” Journal of the Japan Institute of Metals and Materials 69(9), 815-824.
Primak, W., (1958). “Fast-neutron-induced changes in quartz and vitreous silica.” Physical Review, 110(6), 1240-1254.
Primak, W., Fuchs, L. and Day P., (1955). “Effects of nuclear reactor exposure on some properties of vitreous silica and quartz.” Journal of the American Ceramic Society, 38(4), 135-139.
Raether, H., (1982). “Excitation of plasmons and interband transitions by electrons.” Springer Tracts in Modern Physics, 88, Springer-Verlag. Berlin.
Richardson, S. M. and Richardson, J. W., (1982). “Crystal structure of a pink muscovite from Archer's Post, Kenya; implications for reverse pleochroism in dioctahedral micas.” American Mineralogist, 67(1-2), 69-75.
Rosseel, T. M., Maruyama, I., Le Pape, Y., Kontani, O., Giorla, A. B., Remec, I. Wall, J. J., Sircar, M., Andrade, C. and Ordonez, M., (2016). “Review of the current state of knowledge on the effects of radiation on concrete.” Journal of Advanced Concrete Technology, 14(7), 368-383.
Seeberger, J. and Hilsdorf, H., (1982). “Einfluß von radioactiver Strahlung auf die Festogkeit and Struktur von Beton.” Technical Report NR 2505, Institut für Massivbau and Baustofftechnologie, Universität Karlsruhe.
Takeda, H. and Ross, M., (1975). “Mica polytypism - Dissimilarities in crystal-structures of coexisting 1M and 2M Biotite.” American Mineralogist, 60(11-1), 1030-1040.
Ugurlu, O., Haus, J., Gunawan, A. A., Thomas, M. G., Maheshwari, S., Tsapatsis,M. and Mkhoyan, K. A., (2011). “Radiolysis to knock-on damage transition in zeolites under electron beam irradiation.” Physical Review, B 83(11), 113408.
Viswanathan, K. and Kielhorn, H.-M., (1983). “Al, Si distribution in a ternary (Ba, K, Na)-feldspar as determined by crystal structure refinement.” American Mineralogist, 68(1-2), 122-124.
Wenk, H. R., Joswig, W., Tagai, T., Korekawa, M. and Smith, B. K., (1980). “The average structure of An 62-66 labradorite.” American Mineralogist 65(1-2), 81-95.
Zanazzi, P. F., Montagnoli, M. Nazzareni S. and Comodi P., (2007). “Structural effects of pressure on monoclinic chlorite: A single-crystal study.” American Mineralogist, 92(4), 655-661.
I. Maruyama and S. Muto / Journal of Advanced Concrete Technology Vol. 14, 706-716, 2016 715
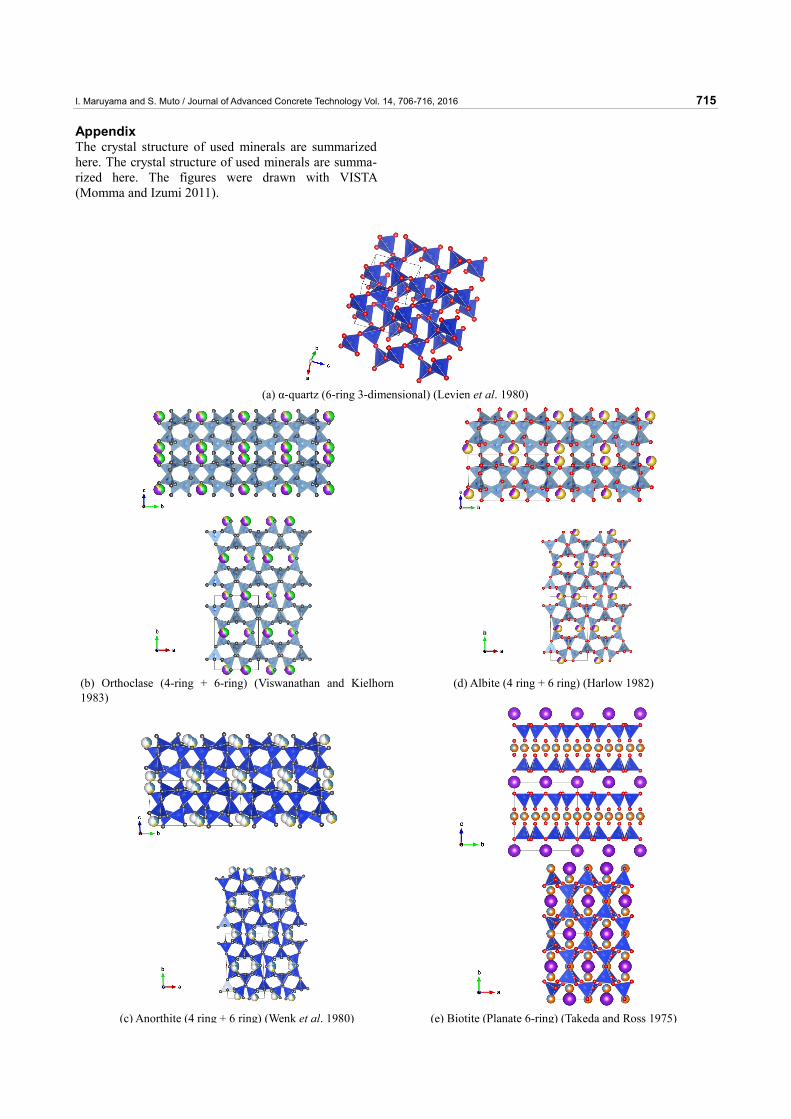
Appendix The crystal structure of used minerals are summarized here. The crystal structure of used minerals are summa-rized here. The figures were drawn with VISTA (Momma and Izumi 2011).
(a) α-quartz (6-ring 3-dimensional) (Levien et al. 1980)
(b) Orthoclase (4-ring + 6-ring) (Viswanathan and Kielhorn 1983)
(d) Albite (4 ring + 6 ring) (Harlow 1982)
(c) Anorthite (4 ring + 6 ring) (Wenk et al. 1980) (e) Biotite (Planate 6-ring) (Takeda and Ross 1975)
I. Maruyama and S. Muto / Journal of Advanced Concrete Technology Vol. 14, 706-716, 2016 716
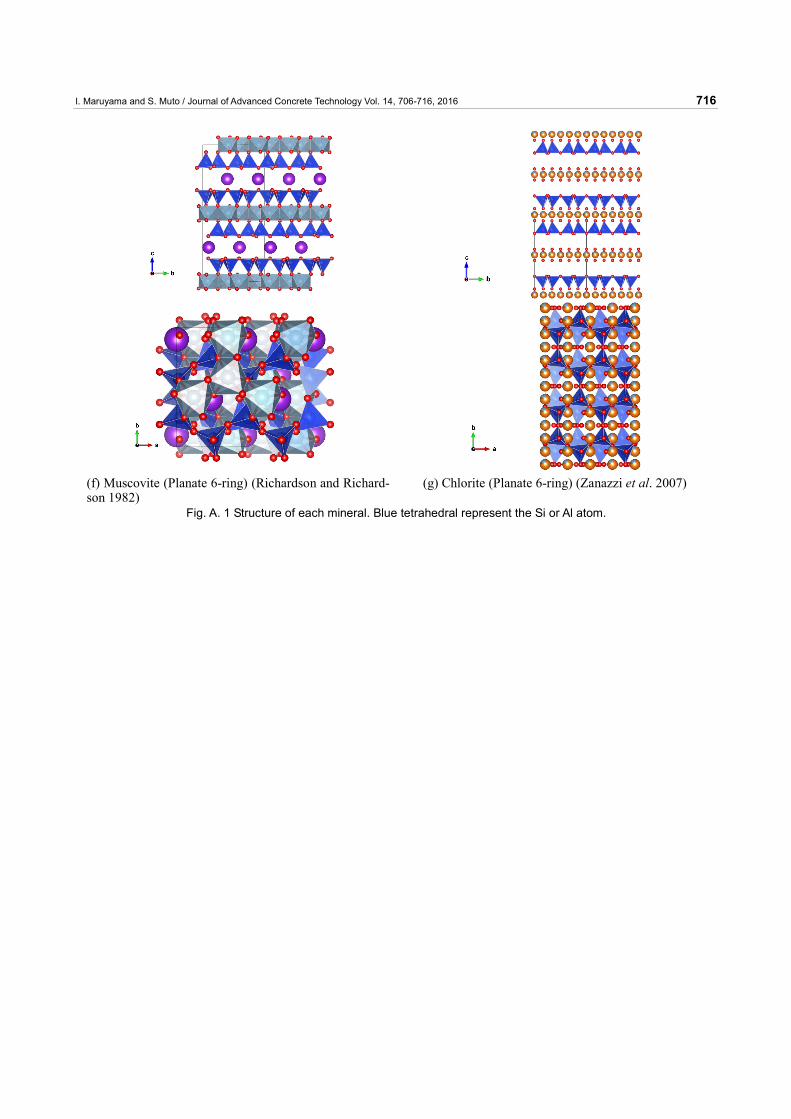
(f) Muscovite (Planate 6-ring) (Richardson and Richard-son 1982)
(g) Chlorite (Planate 6-ring) (Zanazzi et al. 2007)
Fig. A. 1 Structure of each mineral. Blue tetrahedral represent the Si or Al atom.