Digital Change Detection Techniques using remote sensor data
Upload
oluwafemi-opaleyeCategory
view
104download
3description

Change Detection
Prepared by:Oluwafemi Opaleye

08/04/2023 2
Objectives
• Introduction• What is Change Detection?• Pre-processing / Requirement • Change Detection Techniques• Application Areas• Practical Example• Further Readings

08/04/2023 3
Remote Sensing (RS) methods try to answer four basic questions:
How much of What is Where? • What: Type, Characteristic and Properties of Object.
e.g. Water, Vegetation, Land etc.• How Much: determine by simple Counting,
measuring Area covered or percentage of total area coverage.
• Where: Relate locations and area covered to either a standard map or to the actual location on the ‘ground’ where the object occurs.
Note: Where also refers to a moment in time
Introduction
08/04/2023 4
• What is the SHAPE and EXTENT of ... ?
(Area, Boundaries, Lineaments, ...)• This extends the ‘WHERE’ to be a completely
GEOMETRIC problem.– Identification and Delineation of Boundaries

08/04/2023 5
• What is the MIX of Objects?
The surface of the Earth is covered by objects like Soil, Water, Grass, Trees, Houses, Roads and so on.
- Landuse/Landcover - Classification

08/04/2023 6
• Has it CHANGED?
CHANGE may occur with progress of TIME.Change may be detected through comparison of
observed states at different moments in time. - CHANGE DETECTION
08/04/2023 7
What is Change Detection?
• Change detection is the process of identifying differences in the state of an object or phenomenon by observing it at different times.
• It is the detection of class transition between a pair of co-registered images.
• The main goal is to use remote sensing to detect CHANGE on a landscape (landuse and landcover) over time.

08/04/2023 8
• Change detection algorithms analyze multiple images of the same scene – taken at different times – to identify regions of change.
• Changes on the earth surface could be directly caused by natural forces, by the activities of animals and human induced.
• Timely and accurate change detection of Earth’s surface features provides the foundation for a better understanding of the relationships and interactions between human and natural phenomena in order to better manage and use resources.
08/04/2023 9
• area change• rate of change• spatial distribution of changed types• accuracy assessment of change detection results
• It can be performed with raw remote sensing bands or thematic land cover maps classified from them.
• Good Change Detection research should provide the following:

08/04/2023 10
Pre-processing / Requirement
• Geometric Correction – Georeferencing - precise coregistration between multitemporal images
• Radiometric Correction - precise radiometric and atmospheric calibration or normalization between multitemporal images
• Region/Area of Interest – same geographic location• Remote sensing system consideration – spatial,
spectral, radiometric and temporal– whenever possible, select images acquired from the same
type of sensors, with the same spectral and spatial resolutions, and at the same seasonal timeframe in order to minimize unwanted variances.

08/04/2023 11
• Free of clouds in the area of analysis• Select time periods – what is change detection
period?• Select Landcover scheme – they must be classified in
accordance with the same classification scheme.– classes must also be defined identically
• Classification – choose classification algorithm• Choose change detection method• Change detection accuracy assessment

08/04/2023 12
Major steps involved in a typical change analysis process change detection procedure
08/04/2023 13
Change Detection Techniques
• Visual Analysis• Image Differencing• Image ratioing • Post Classification Comparison• Statistical analysis

08/04/2023 14
Visual Analysis
• It is the first place to start• Visually comparing multi-images• Manual digitizing changes in multi-images is often
used to both identify and classify change between images
• Elements of image interpretation combined with the knowledge of the area of study are often used.
08/04/2023 15
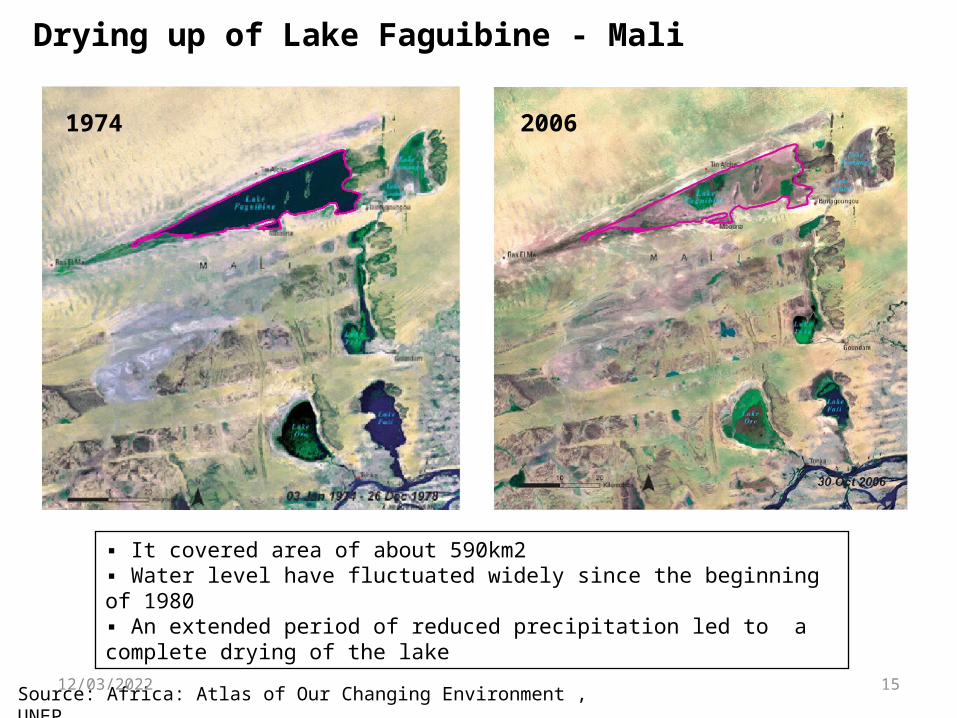
Drying up of Lake Faguibine - Mali
▪ It covered area of about 590km2▪ Water level have fluctuated widely since the beginning of 1980▪ An extended period of reduced precipitation led to a complete drying of the lake
Source: Africa: Atlas of Our Changing Environment , UNEP
1974 2006

08/04/2023 16
Declining Water Levels in Lake Chad (1972-2007)1972 1987
2007
Lake Chad, located at the junction of Niger, Nigeria, Chad and Cameroon, was once the sixth largest lake in the world.
Persistent drought and increased agriculture irrigation have reduced the lake’s extent
1987 Image show that lake Chad reduced to about one-tenth of what it was in 1972 image.
2007 image show some improvement but the extent of the lake is still smaller to what it was 2-3 decades ago.
Area (12,797sqkm)
Area (1,563sqkm)
Area (1,753sqkm)

08/04/2023 17
Image Differencing
• It requires selection of corresponding bands from two dates imageries of the same study area
• Uses software algorithm to identify and quantify the changes between two temporal images
• The difference image is created by subtracting the brightness values of one image from the other on a per-pixel basis.
• Unchanged areas will have values at or nearer zero; while areas with significant change will be progressively positive or negative.

08/04/2023 18
Example of image differencing procedure
08/04/2023 19
Advantages
• It is relatively easy to understand and to implement.• This method of analysis involves only subtraction
with minimal human intervention.• So long as the two images have been sampled to the
same ground resolution and projected to the same coordinate system, the subtraction can be carried out very quickly.
• The results of change detection are not subject• to the inaccuracy inherent in classified land cover
maps.
08/04/2023 20
Limitations
• this method is limited in that it fails to reveal the nature of a detected change (e.g., the class from which a land cover has changed).
• identify threshold values of change and no-change in the resulting images.
• direct use of raw spectral data in change analysis makes the detected change highly susceptible to radiometric variations caused by illumination conditions and seasonality.
08/04/2023 21
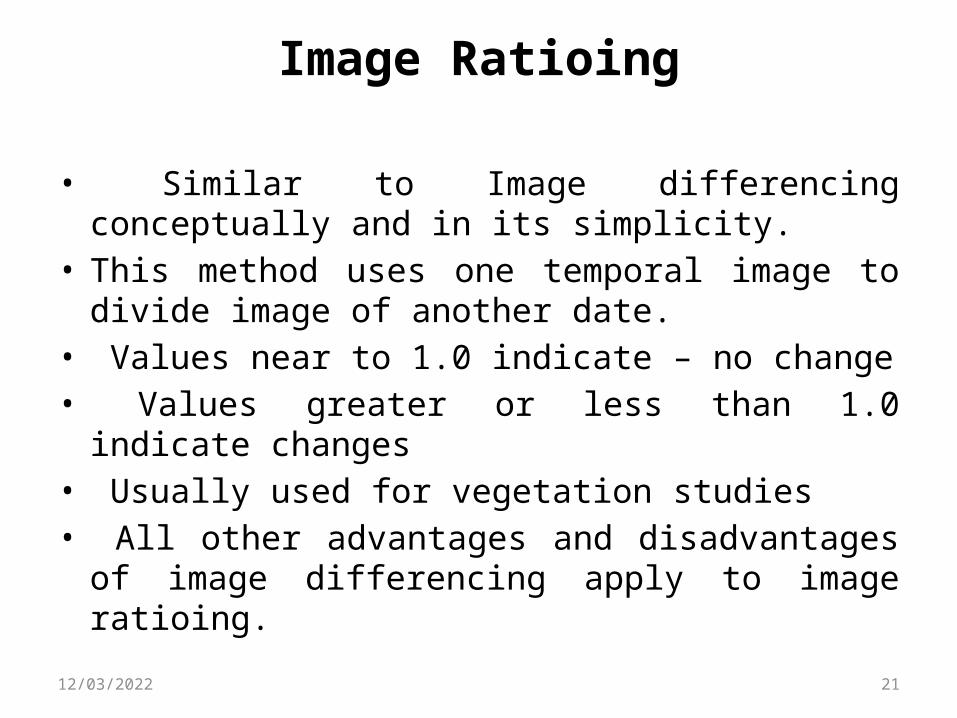
Image Ratioing
• Similar to Image differencing conceptually and in its simplicity.
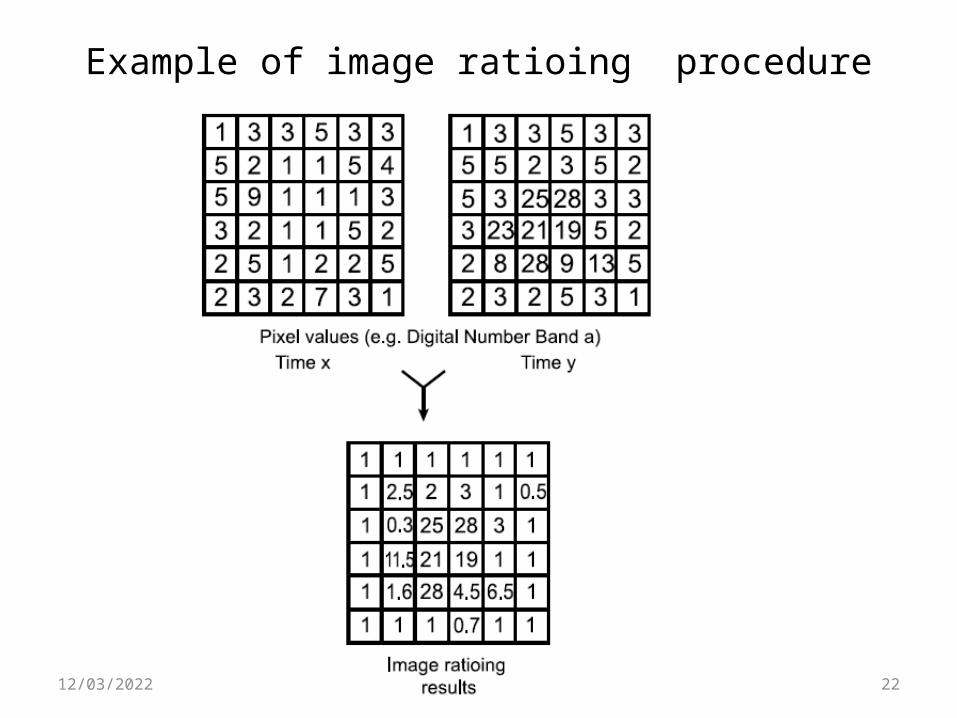
• This method uses one temporal image to divide image of another date.
• Values near to 1.0 indicate – no change• Values greater or less than 1.0 indicate changes• Usually used for vegetation studies• All other advantages and disadvantages of image
differencing apply to image ratioing.
08/04/2023 22
Example of image ratioing procedure

08/04/2023 23
Post Classification Comparison
• Most popular method of change detection• In post classification comparison, each date of
rectified imagery is independently classified to fit common landtype.
• Landcover maps are overlaid and compared pixel by pixel basis.
• The result is a map of landtype change• The change map display acreage of each change
class

08/04/2023 24
Advantages
• Many classification algorithms can be directly used. It can provide detailed matrix of change information and accuracy assessment is easy.
• Easy to quantify the area of change and rate of change
• It also attribute changes e.g.

08/04/2023 25
Limitations
• Classification accuracy directly influences the accuracy of change detection.
• It is time-consuming to create classification results and a professional operator is necessary.
• It is difficult and expensive to obtain appropriate multi-temporal ground reference.

08/04/2023 26
Sources of Error in Change Detection
• Errors in data – image quality• Atmospheric error• Mis-registration between multiple image dates• Seasonal variability• Processing error • Radiometric error – due to sensor drift or age• Error in Classification

08/04/2023 27
Application Areas
• landcover/landuse changes• mapping urban growth• rate of deforestation• urban sprawl• desertification• disaster monitoring• agriculture• coastal change• environmental impact assessment

08/04/2023 28
Practical Example:
Geospatial Assessment of Amanawa Forest Reserve, Sokoto State, Nigeria

08/04/2023 29
1996 Landcover Map of Amanawa Forest Reserve Area

08/04/2023 30
2008 Landcover Map of Amanawa Forest Reserve Area

08/04/2023 31
Landcover Type 1996
Area (sqkm)
1996
Percentage (%)
2008
Area (sqkm)
2008
Percentage (%)
Farmland 30.627 74.71 30.772 75.07
Rock Outcrop 4.6449 11.33 4.0734 9.94
Bare Soil 3.537 8.63 4.1517 10.12
Forest Reserve 2.0133 4.91 1.89 4.61
Dam 0.171 0.42 0.1053 0.26
Total 40.9932 100 40.9932 100

08/04/2023 32
Change Detection Map showing transition of Landcovers (1996-2008)

08/04/2023 33
Landcover Type
Area (sqkm) Difference (sqkm) Increase/Decline(%)
1996 2008 1996 - 2008 1996 - 2008
Farmland30.627 30.772 0.145 0.473
Rock Outcrop
4.645 4.073 -0.572 -12.304Bare Soil 3.537 4.152 0.615 17.379Forest Reserve
2.013 1.890 -0.123 -6.124Dam 0.171 0.105 -0.066 -38.421

08/04/2023 34
• Prediction Analysis

Markov Probability of Change in Landcover (1996 – 2008)
Bare Soil Dam Farmland Forest Rock Outcrop
Bare Soil 0.7646 0.0382 0.1726 0.0233 0.0012
Dam 0.2765 0.6137 0.1098 0.0000 0.0000
Farmland 0.3212 0.0680 0.6097 0.0011 0.0000
Forest 0.1849 0.0000 0.1475 0.6676 0.0000
Rock Outcrop 0.3376 0.0000 0.0231 0.0000 0.6393

2018 Projected Landcover Map of Amanawa Forest Area

Landcover Type Area (sqkm) Percentage (%)
Farmland 27.5877 67.3
Rock Outcrop 3.9555 9.65
Bare Soil 7.6527 18.67
Forest Reserve 1.71 4.17
Dam 0.0873 0.21
Total 40.9932 100
Area and Percentage of 2018 Projected Landcover of Amanawa Forest Area

08/04/2023 38
Reading for further information
• J.R. Jensen (2005)Introductory Digital Image Processing, A Remote sensing perspective. 467-492
• R. R. Jensen, J. D. Gatrell and D. McLean (2007) Geo-Spatial Technologies in Urban Environments Policy, Practice, and Pixels. 145-167

08/04/2023 39
Thank You for Listening