Change Detection in Social Networks - Homepage | CASOS 1235.pdf · Technical Report 1235 Change...
26
Technical Report 1235 Change Detection in Social Networks MAJ Ian McCulloh, 2LT Matthew Webb, LTC John Graham U.S. Military Academy Kathleen Carley Carnegie Mellon University Daniel B. Horn U.S. Army Research Institute June 2008 United States Army Research Institute for the Behavioral and Social Sciences Approved for public release; distribution is unlimited.
Transcript of Change Detection in Social Networks - Homepage | CASOS 1235.pdf · Technical Report 1235 Change...

Technical Report 1235 Change Detection in Social Networks MAJ Ian McCulloh, 2LT Matthew Webb, LTC John Graham U.S. Military Academy Kathleen Carley Carnegie Mellon University Daniel B. Horn U.S. Army Research Institute June 2008
United States Army Research Institute for the Behavioral and Social Sciences
Approved for public release; distribution is unlimited.
U.S. Army Research Institute for the Behavioral and Social Sciences A Directorate of the Department of the Army Deputy Chief of Staff, G1 Authorized and approved for distribution:
MICHELLE SAMS, Ph.D.
Director Technical review by Dr. Craig Schreiber, Army Research Laboratory—HRED Dr. Lada Adamic, University of Michigan
NOTICES
DISTRIBUTION: Primary distribution of this Technical Report has been made by ARI. Please address correspondence concerning distribution of reports to: U.S. Army Research Institute for the Behavioral and Social Sciences, Attn: DAPC-ARI-ZXM, 2511 Jefferson Davis Highway, Arlington, Virginia 22202-3926. FINAL DISPOSITION: This Technical Report may be destroyed when it is no longer needed. Please do not return it to the U.S. Army Research Institute for the Behavioral and Social Sciences. NOTE: The findings in this Technical Report are not to be construed as an official Department of the Army position, unless so designated by other authorized documents.

i
REPORT DOCUMENTATION PAGE
1. REPORT DATE (dd-mm-yy) June 2008
2. REPORT TYPE Final
3. DATES COVERED (from. . . to) August 2006 - May 2007
4. TITLE AND SUBTITLE
Change Detection in Social Networks
5a. CONTRACT OR GRANT NUMBER
5b. PROGRAM ELEMENT NUMBER 611102
6. AUTHOR(S) MAJ Ian McCulloh, 2LT Matthew Webb, LTC John M. Graham (U.S. Military Academy); Kathleen Carley (Carnegie Mellon University); and Daniel B. Horn (U.S. Army Research Institute for the Behavioral and Social Sciences)
5c. PROJECT NUMBER B74F 5d. TASK NUMBER 2903 5e. WORK UNIT NUMBER
7. PERFORMING ORGANIZATION NAME(S) AND ADDRESS(ES) Department of Mathematical Sciences United States Military Academy 626 Swift Road West Point, NY 10996
8. PERFORMING ORGANIZATION REPORT NUMBER
9. SPONSORING/MONITORING AGENCY NAME(S) AND ADDRESS(ES) U.S. Army Research Institute for the Behavioral and Social Sciences 2511 Jefferson Davis Highway
10. MONITOR ACRONYM ARI
Arlington, VA 22202-3926 11. MONITOR REPORT NUMBER Technical Report 1235
12. DISTRIBUTION/AVAILABILITY STATEMENT Approved for public release; distribution is unlimited.
13. SUPPLEMENTARY NOTES
Contracting Officer’s Representative and Subject Matter POC: Daniel Horn
14. ABSTRACT (Maximum 200 words):
Social network analysis (SNA) has become an important analytic tool for analyzing terrorist networks, friendly command and control structures, and a wide variety of other applications. This project proposes a new method for detecting change in social networks over time, by applying a cumulative sum statistical process control statistic to normally distributed network measures. The proposed method is able to detect organizational change in the same manner as a quality engineer can detect a change in a manufacturing process. The new algorithm is demonstrated on social network data collected on a group of 24 Army officers going through a 1-year graduate program at Columbia University and on al-Qaeda leading up to and immediately following the terrorist attacks of September 11, 2001.
15. SUBJECT TERMS
Social Network Analysis, e-mail, dyad, command and control, statistical process control, CUSUM, control chart
SECURITY CLASSIFICATION OF 19. LIMITATION OF ABSTRACT
20. NUMBER OF PAGES
21. RESPONSIBLE PERSON
16. REPORT Unclassified
17. ABSTRACT Unclassified
18. THIS PAGE Unclassified
Unlimited
23
Ellen Kinzer Technical Publications Specialist 703-602-8047

ii
iii
Technical Report 1235
Change Detection in Social Networks
MAJ Ian McCulloh, 2LT Matthew Webb, LTC John Graham U.S. Military Academy
Kathleen Carley
Carnegie Mellon University
Daniel B. Horn U.S. Army Research Institute
Basic Research Unit Paul A. Gade, Chief
U.S. Army Research Institute for the Behavioral and Social Sciences 2511 Jefferson Davis Highway, Arlington, Virginia 22202-3926
June 2008
Army Project Number Personnel, Performance 611102B74F and Training
Approved for public release; distribution is unlimited.

iv
ACKNOWLEDGEMENT
The authors would like to thank Richard Freytag of Freytag Industries LLC. Mr. Freytag wrote several custom programs to make the data collection on this project much faster and more efficient. He was always available and provided rapid and excellent support.
This project would never have been possible without the initial efforts of MAJ Steve
Henderson of the Department of Systems Engineering at the U.S. Military Academy. While in the process of returning from combat operations in Iraq and starting a Ph.D. at Columbia University, Steve wrote, tested, and debugged the initial patch that was used to collect data from the Army officers who were subjects in this research.
The authors are equally appreciative of MAJ Dennis O’Neill and the 24 officers in the
Eisenhower Leadership Development Program who graciously allowed the investigators to monitor their personal and professional e-mail traffic over the course of the academic year.
This work was supported in part by the Office of Naval Research (ONR), United States
Navy Grant No. N00014-02-10973 on Dynamic Network Analysis, the Army Research Labs Grant No. DAAD19-01-2-0009, the Air Force Office of Sponsored Research (MURI: Cultural Modeling of the Adversary Organization, 600322), and the NSF IGERT program in CASOS (DGE-9972762).
Additional support was provided by the Center for Computational Analysis of Social and Organizational Systems (CASOS) and the Institute for Software Research International (ISRI) at Carnegie Mellon University.
v
CHANGE DETECTION IN SOCIAL NETWORKS EXECUTIVE SUMMARY Research Requirement:
Within an organization, changes in communication patterns often reflect, and may even predict, significant events or behaviors. The breakdown of a team’s effectiveness, the emergence of informal leaders, or the preparation of an attack by a clandestine network may all be associated with changes in the patterns of interactions between group members. The ability to effectively and efficiently detect these changes has the potential to enable the Army to anticipate and respond to changes in friendly and non-friendly organizations.
The present report describes an application of statistical process control techniques to social network analysis data to detect changes in networks. This approach draws on the theory and methods used to detect problems in manufacturing processes. The strength of this approach is that it can identify changes that occur slowly over a period of time and can suggest the potential starting point of such changes. This technique is demonstrated on a network of e-mail communications among graduate students and on the network of contacts among members of the al-Qaeda terrorist organization. Procedure:
This project used two data sets. The first data set consisted of social networks of e-mail communication over time collected by monitoring the e-mail traffic of 24 Army officers in a 1-year graduate program at Columbia University (McCulloh, et. al., 2007). The content of the e-mail messages was not collected, meaning that all findings in this research were based on communication patterns rather than communication content. The data were unique in that when changes in communication patterns were detected, the investigators were able to interview the subject participants to determine specific causes for organization change or assess the occurrence of a false alarm, which is a statistical indication of change when none actually occurred.
The second data set was social network data of the al-Qaeda terrorist organization over
time. This data set was provided by the Center for Computational Analysis of Social and Organizational Systems (CASOS) and developed under a grant from the Office of Naval Research (ONR). While we were unable to interview al-Qaeda members to distinguish causes for organizational change, information on the group was widely available in the literature to support conclusions drawn on the change detection method.
For any statistical test, certain assumptions must be met. Several social network measures are investigated in the data for their conformance to certain statistical properties necessary for statistical process control. The data are studied to identify stable organizational behavior from a network perspective. This means that there is no observable increasing or decreasing trend in a particular social network measure under investigation. Sample means and standard deviations are calculated over the apparent stable time period for the network. The cumulative sum statistic is

vi
then calculated for each subsequent time period until the statistic signals that a change in the organization may have occurred. A qualitative review of the organization is then conducted to determine if there was a false alarm or if there really was a change in the organization. Findings:
Within the graduate student data set, the cumulative sum control chart was effective in detecting the comprehensive exam, the most significant academic event of the year. The control chart was also effective in detecting changes leading up to the terrorist attacks of September 11, 2001. The change point was identified as 1997, the same year that al-Qaeda joined several other militant Islamic groups and declared a public jihad against Jews and the West. Counterterrorism experts believe that this year was perhaps the key year in the dangerous and offensive change in the al-Qaeda organization.
Statistical process control has been shown to be effective in detecting organizational
change when applied to social network measures. Utilization and Dissemination of Findings:
This research is an important emerging area of Network Science. As such, it has been and will continue to be presented at a variety of academic conferences. These conferences include:
- ARI-USMA Network Science Workshop, 18-20 April 2007 - Service Academy Student Mathematics Conference, 18-19 Apr 2007 - ELICIT Tool Set Conference (OSD NII), 4 May 2007 - DoD Human Factors Engineering Technical Advisory Group Meeting, 16 May 2007 - NetSci International Workshop and Conference on Network Science, 20-25 May 2007
vii
CHANGE DETECTION IN SOCIAL NETWORKS CONTENTS
Page
INTRODUCTION .......................................................................................................................... 1 Social Network Analysis................................................................................................................. 1 Statistical Process Control .............................................................................................................. 3 METHOD AND RESULTS ........................................................................................................... 4 Tactical Officer Education Program E-mail Network .................................................................... 5 Al-Qaeda Communications Network .............................................................................................. 9 DISCUSSION ............................................................................................................................... 12 REFERENCES ............................................................................................................................. 15
LIST OF TABLES
TABLE 1. ANOVA TABLE FOR CLOSENESS PREDICTORS........................................... 7 TABLE 2. CUSUM STATISTIC VALUES FOR CLOSENESS
NETWORK MEASURE ........................................................................................ 8 TABLE 3. CUSUM STATISTIC VALUES FOR CLOSENESS
NETWORK MEASURE ...................................................................................... 11
LIST OF FIGURES FIGURE 1. E-MAIL NETWORK OF ACTIVE TOEPS DURING WEEK OF 29 OCTOBER 2007 .......................................................................................... 6 FIGURE 2. PLOT OF CLOSENESS CUSUM STATISTIC FOR NINE ACTIVE TOEPS ..................................................................................................... 8 FIGURE 3. MONITORED AL-QAEDA COMMUNICATIONS NETWORK FOR YEAR 2001 .................................................................................................... 9 FIGURE 4. PLOT OF SELECTED NETWORK MEASURES OF AL-QAEDA
ORGANIZATION ................................................................................................ 10 FIGURE 5. PLOT OF CLOSENESS CUSUM STATISTIC OF AL-QAEDA ....................... 11

viii
1
Introduction
Social Network Analysis (SNA) is an approach to studying and analyzing groups of actors and their ties. When applied to communication networks, SNA enables us to quantitatively analyze the patterns of information flow through time and space (Monge & Contractor, 2003). These techniques can be used to characterize the roles of individuals in groups, compare subgroups with one another, or describe the informal structure of large organizations (Wasserman & Faust, 1994). SNA can be applied to friendly forces to support command and control (Schreiber, 2006; Carley, 2003; Carley & Schreiber, 2002; Carley & Ren, 2001) as well as to enemy forces in efforts to detect and disrupt terrorist networks (Carley, 2002, 2006).
Organizations are not static, and over time their structure, composition, and patterns of
communication may change. These changes may occur quickly, such as when a corporation restructures, but they often happen gradually, as the organization responds to environmental pressures, or individual roles expand or contract. Often, these gradual changes reflect a fundamental qualitative shift in an organization and may precede other indicators of change. It is important to note, however, that a certain degree of change is expected in the normal course of an unchanging organization, reflecting normal day-to-day variability. The challenge of Social Network Change Detection is whether metrics can be developed to detect signals of meaningful change in social networks in a background of normal variability.
Current methods of change detection in social networks are limited. Hamming distance
(Hamming, 1950) is often used in binary networks to measure the distance between two networks. Euclidean distance is similarly used for weighted networks (Wasserman and Faust, 1994). While these methods may be effective at quantifying a difference in static networks, they lack an underlying statistical distribution. This prevents an analyst from identifying a statistically significant change, as opposed to normal and spurious fluctuations in the network. Social Network Change Detection significantly improves on previous attempts to detect organizational change over time by introducing a statistically sound probability space and uniformly more powerful detection methods.
Social Network Change Detection is a process of monitoring networks to determine when significant changes to their organizational structure occur and what caused them. We propose that techniques from SNA, combined with those from statistical process control, can be used to detect when significant changes occur in a network. In application, it requires the use of statistical process control charts to detect changes in observable network measures. By taking measures of a network over time, a control chart can be used to signal when significant changes occur in the network. We describe our technique below. First, we provide an overview of the relevant SNA methods, and then we describe statistical process control. We follow that with demonstrations of the technique on two distinct networks: the e-mails between Army officers in a graduate program and the patterns of communication between members of al-Qaeda. Social Network Analysis
SNA provides the basis for how networks are modeled, measured, and compared. A typical social network can be modeled on a graph with people represented as vertices and links
2
between them as edges (Scott, 2002; Wasserman & Faust, 1994). These edges can represent a wide variety of links including exchanged e-mail, shared religious beliefs, or attendance at the same university. Edges may be weighted to show the importance of the link. For example, the weight could be how many e-mails were sent over the data collection time period. Edges also may be directed to show who is initiating the link and who is receiving it. The simplest social networks have just one edge set that is unweighted and undirected.
Hundreds of different network measures can be calculated from a given graph. Network
measures can be calculated from the entire graph or for each individual node. The most prolific of these individual network measures are the centrality measures of closeness and betweenness. Centrality network measures are widely used for their easily applied practical applications in determining how information spreads through a social network. This research was limited in scope to one graph level measure—density, and two individual node measures averaged over the graph—closeness and betweenness.
A graph’s density is the measure of how many links exist in the graph divided by the total
number of possible links. For a non-directional graph with n nodes, the density of a graph is expressed as,
)1(#
−=
nnedgesd .
Organizations with high density are well connected internally with each member
“plugged in” to the organization. This may work well for information sharing in relatively small organizations; however, as the size of the organization increases, a high-density measure may be undesirable because the corresponding high number of links for each individual could lead to information overload. Thus, density is not an ideal measurement for monitoring an organization that is growing rapidly because it does not scale well or allow for comparison among different network sizes.
Betweenness centrality is a measure of how often a node lies along the shortest path, or geodesic, between two other nodes for all nodes in a graph (see equation above). Betweenness for a node is defined as,
∑=ji ij
ikjk g
gb
,
where bk is the betweenness measure at node k, gikj is the number of geodesic paths between nodes i and j crossing node k, and gij is the total number of geodesic paths between nodes i and j (Wasserman & Faust, 1994). The node or nodes with the highest betweenness in a graph have the practical application of being the best places to divide a graph into separate sub-graphs by using a cut node or cut set.
Closeness centrality measures the sum of the distances from a particular node to all other nodes in the graph. As such, it is an inverse measure of how a node is connected in a network
3
beyond its immediate neighbors. A node with high closeness centrality may or may not be in the center of a large subgroup, but it will be in position to distribute information the fastest throughout the entire group. In this project, the closeness measure was normalized using the expression,
{ }∑∑=
== n
i ki
n
i kikk
g
gc
1
1min
.
Despite the practicality of these measures, several problems arise from their usage. First,
these individual measures must be translated into a network picture of the entire graph. This may be as simple as averaging the measures across the entire graph and using that as the measure for each time period. An alternative method would be to use either the maximum or minimum value from nodes within the graph as the sample. Unlike in Everett and Borgatti’s paper (1999), one cannot recalculate the network measure by collapsing the graph into a single node and analyzing its links with nodes outside the group because our group involves the entire graph and the result would be trivial. One must thus explore how both the individual measures and average measures are distributed and whether the average is a good representation for the entire graph. A second difficulty with these measures is their normalization. In order to compare measures across different time periods, they must be normalized. For a steady sized group this should not be an issue, but in the case of an expanding or contracting group, issues arise as to whether results can be used across the different scales of group size. In other words, the network measures may change in different ways with respect to the current group size and thus provide inconsistent information about the group even absent of any changes within the group. For this research, the Organizational Risk Analyzer (ORA) developed by Kathleen Carley at the Center for Computational Analysis of Social and Organizational Systems at Carnegie Mellon University is used to compute the average network measures from all group information (Carley, 2007). Statistical Process Control
Another component for social network change detection is Statistical Process Control (SPC). SPC is a technique used by quality engineers to monitor industrial processes. They use control charts to detect changes in the mean of the industrial process by taking periodic samples of the product and tracking the results against a control limit. Once a change has been detected, the engineers determine the most likely time the change occurred to reexamine and reset the process to avoid financial loss for the company by making substandard or wasteful products. Control charts are usually optimized for their processes to increase their sensitivity for detecting changes, while minimizing the number of false alarms.
The control chart investigated for this project was the cumulative sum (CUSUM). The CUSUM control chart is a widely used control chart derived from the sequential probability ratio test (SPRT) (Page, 1961). The SPRT was derived in turn from the Neyman and Pearson (1933) most powerful test for a simple hypothesis.
4
The decision rule of the CUSUM chart runs off the cumulative statistic
∑=
−=t
jit kZC
1)(
where iZ is the standardized normal of each observation,
x
ii
xZ
σμ )( 0−
=
and the common choice for k is 0.5 (McCulloh, 2004), which corresponds to a standardized magnitude of change of 1. The CUSUM control chart sequentially compares the statistic tC against a control limit A′ until ACt ′> . Since we are not interested in concluding that the network is unchanged, the cumulative statistic is
},0max{ 1+−
+ +−= ttt CkZC .
The statistic +tC is compared to the constant control limit, +h . If ++ > hCt , then the
control chart signals that an increase in a network measure has occurred. Since this rule only detects increases in the mean, a second cumulative statistic rule must be used to detect decreases in the mean,
},0max{ 1−−
− +−−= ttt CkZC
which signals a decrease in a network measure’s mean when −− > hCt .
The CUSUM control chart was selected for two reasons. First, this chart is well suited to detecting small changes in the mean of a process over time. In terms of a social network, this is a desired quality because one would not expect a social network to change dramatically between short time periods. By casual observation, one could conclude that a person’s friends generally stay the same from week to week and would not expect drastic changes in that social network. In addition, drastic changes in the network are normally quite obvious, but since the CUSUM is good at detecting slight changes it may be able to provide early warning for drastic changes, or reveal when more subtle changes have occurred. A second benefit of the CUSUM control chart is its built-in change point detection. After the control chart signals, the most likely change point is found by tracing the C statistic back to the last time it was zero. This allows the time of the change in the network to be calculated quickly and easily.
Method and Results
Social network change detection algorithms are implemented in much the same way a control chart is implemented in a manufacturing process. The average graph measures for density, closeness, and betweenness centrality are calculated for several consecutive time periods
5
of the social network. When these measures appear to have stabilized over time, the “in-control” mean and variance for the measures of the network are calculated by taking a sample average and sample variance of the stabilized measures. The subsequent, successive social network measures are then used to calculate the CUSUM’s C+ and C- statistics. These were then compared to a control limit to determine when or if the control chart signals a change in the mean of the monitored network measure. Upon receiving a signal, the change point is calculated by tracing the signaling C+ or C- statistic back to the last time period it was zero. In order to continue running the control chart after a signal, the in-control mean and variance are recalculated after the network measures have stabilized following the change.
The results of this type of research are the suspected time periods when the network appears to be significantly changing. The network then can be studied in depth across these time periods in the wide variety of network measures to determine the extent of changes to the network structure. Further study can also be directed towards determining changes in the environment in which the network operates during those time periods. Tactical Officer Education Program E-mail Network
The Tactical Officer Education Program (TOEP) is a 1-year graduate program run as a joint effort by the United States Military Academy (USMA) and Columbia University. Each year, 24 Army officers (referred to in this research as TOEPs 1 through 24) enter the program to earn a Master’s degree in Social-Organizational Psychology with a concentration in Leadership and to prepare for service as mentors for West Point’s cadet companies during the following two years. In the fall of 2007, the TOEP officers agreed to allow data about their personal and professional e-mail communication to be tracked over a 24-week period as part of research on social networking. Details regarding the data collection and network properties are described in McCulloh et. al. (2007).
The data were pre-processed before any social network change detection algorithms were
performed. The first step of processing the raw data was to remove all e-mail sent outside of the TOEP network. The primary concern of this effort was to examine how e-mail communication changed within the exclusive group of TOEP students. This required that records of e-mail sent to non-TOEPs and e-mail addresses of non-TOEPs in messages that were sent to mixed parties be deleted. Thus, all subsequent network pictures would involve only the e-mail communication among the 24 TOEPs. Despite our best efforts, though, the network information can only be viewed as “near” complete as e-mail sent using Webmail could not be collected because of limitations of the data collection software (McCulloh et. al. 2007).
The data were then separated into weekly time periods. Too much variance existed in the
data set to be divided into monthly time periods (McCulloh et. al. 2007). This variance was due to communication patterns that changed between months of schoolwork (e.g., October and February) and those of long break periods (e.g., December and March). These large changes in communication patterns would prevent unbiased calculation of the baseline measurements with which to calibrate the control chart. Dividing the data based on days provided too much resolution and was unacceptable because network communication patterns change dramatically from weekdays to weekends.
6
The network measures of interest were selected because theoretically they should follow
or approximate a normal distribution due to the central limit theorem. For veracity, the measures’ distributions were verified so that usage of the CUSUM Control Chart could be justified. Each of the network measures was fit with five continuous distributions: normal, uniform, gamma, exponential, and chi-squared. Least Squares was used to determine the best overall distribution for each measure. The distribution with the best fit for betweenness and density network measures was the Gamma Distribution. This invalidated further usage of the CUSUM Control Chart to detect changes in these network measures over time.
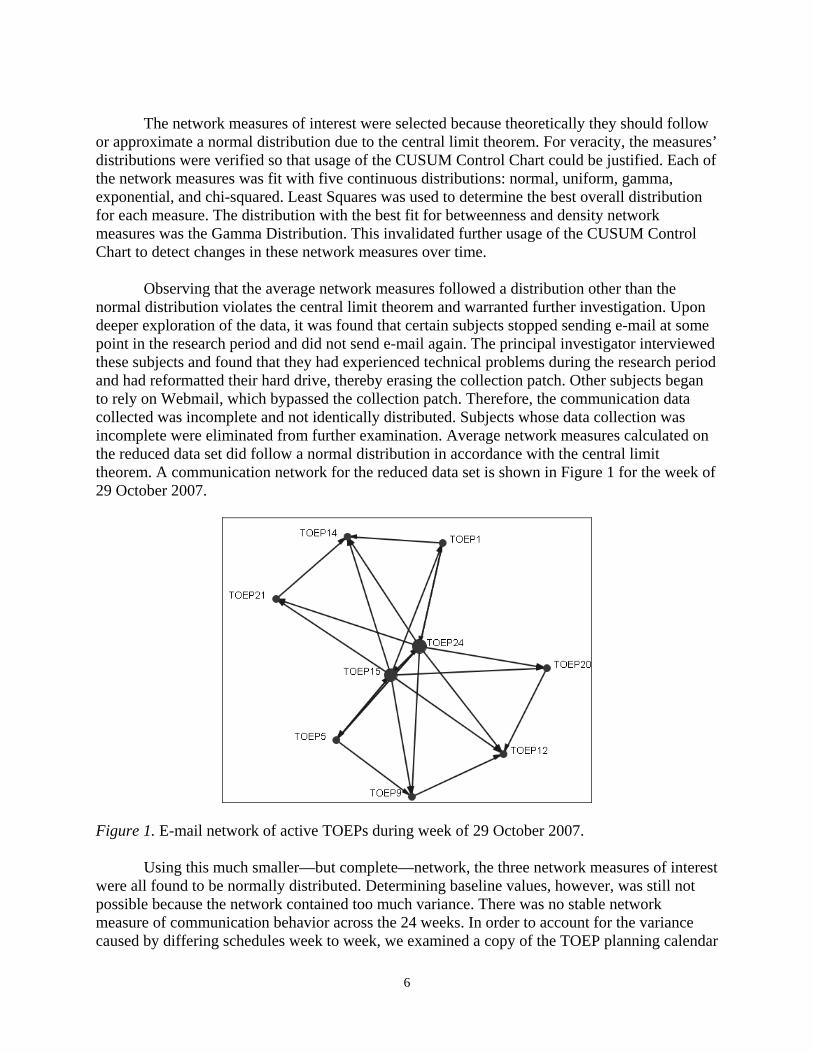
Observing that the average network measures followed a distribution other than the normal distribution violates the central limit theorem and warranted further investigation. Upon deeper exploration of the data, it was found that certain subjects stopped sending e-mail at some point in the research period and did not send e-mail again. The principal investigator interviewed these subjects and found that they had experienced technical problems during the research period and had reformatted their hard drive, thereby erasing the collection patch. Other subjects began to rely on Webmail, which bypassed the collection patch. Therefore, the communication data collected was incomplete and not identically distributed. Subjects whose data collection was incomplete were eliminated from further examination. Average network measures calculated on the reduced data set did follow a normal distribution in accordance with the central limit theorem. A communication network for the reduced data set is shown in Figure 1 for the week of 29 October 2007.
Figure 1. E-mail network of active TOEPs during week of 29 October 2007.
Using this much smaller—but complete—network, the three network measures of interest were all found to be normally distributed. Determining baseline values, however, was still not possible because the network contained too much variance. There was no stable network measure of communication behavior across the 24 weeks. In order to account for the variance caused by differing schedules week to week, we examined a copy of the TOEP planning calendar
7
for the entire year. The calendar, combined with participant interviews, allowed investigators to determine the number of significant events from a variety of categories that occurred each week. The significant events based on qualitative assessments by the participants were Academic Requirements, the Next Week’s Academic Requirements, Administrative Events (such as a class trip or cancelled class), Group Projects, Social Gatherings, and Days Off.
Using MINITAB Statistical Software, analysis of variance (ANOVA) tests were run on
the predictors to determine if they were statistically significant factors in determining network measures. Days Off was the most significant factor, due to Christmas break in the middle of the 24-week period. However, once these weeks were removed from the period, Days Off was no longer a significant factor in any model. The best linear regression model obtained from first semester (12 weeks) data for closeness, based on the number of group projects, the number of social gatherings, and the number of e-mails sent each week found in Table 1, was,
)EmailsofNumber(0074.0)GatheringsSocial(11.0)ProjectsGroup(11.018.0Closeness ++−= Table 1 ANOVA Table for Closeness Predictors
Predictor Coefficient SE Coefficient T P VIF Constant 0.1800 0.03400 5.40 0.00 ~Group Projects -0.1100 0.05000 -2.10 0.05 1.30Social Gatherings 0.1100 0.04000 2.89 0.01 1.30Number of E-mails 0.0074 0.00084 8.77 0.00 1.00
This model has an adjusted R2 value of 79.8%, accounting for a large majority of the
variance in the network measure and a predictive R2 value of 70.9%. Slightly surprising from this model is the effect of group projects on closeness. An increase in group project work was correlated with a decrease in communication. This might be due to the fact that as a group project comes due, the subjects may communicate more with their immediate team of group members and communicate more face-to-face, but overall they decrease communication outside of their working groups and through e-mail in order to focus on the project. The positive effects of Social Gatherings and more e-mail sent over the week had the foreseen effect of improving group closeness.
Being able to predict the closeness of the TOEPs communication network was essential in explaining much of the variance in the network. The control chart could then be used to determine when the network changed away from the model. In effect, when is the model no longer providing a good prediction? Using the closeness model developed from the first semester data, predicted values were calculated for each week of the second semester using the number of social gatherings and group projects from the TOEP calendar and the number of e-mails sent by observation. These were compared with the observed network measures. The residuals were verified as normally distributed to meet the prerequisites of the CUSUM Control Chart. The C+ and C- statistics were calculated for each week using a k value of 0.5 and a control limit of 3. By running a Monte Carlo simulation with these settings, we were able to predict that the CUSUM
8
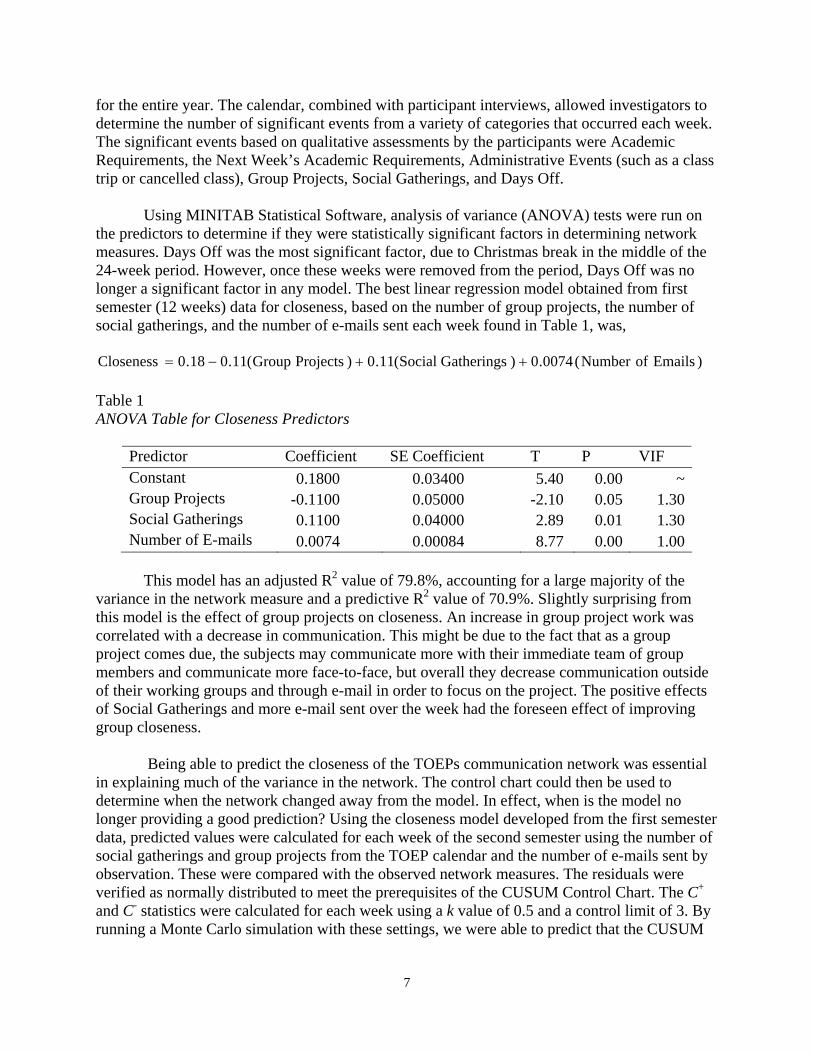
would have a false alarm rate of once out of every 59 observations or practically once every year. Figure 2 shows a graph of the CUSUM.
0
0.5
1
1.5
2
2.5
3
3.5
4
15 16 17 18 19 20 21 22 23 24
Week Number
C- S
tatis
tic
Figure 2. Plot of closeness CUSUM statistic for nine active TOEPs.
Figure 2 indicates that the control chart signals on Week 23 (see Table 2). Week 23 was
the week the TOEPs took the comprehensive exam for their graduate program. It was the most significant academic event of the year. Tracing the C- statistic back to the last time it was zero, the most likely change point was during Week 21. Upon first examination, Week 21 looks like it should be a typical academic week, with no unusual events or graded projects. However, based on interviews conducted with TOEPs, it was discovered that Week 21 was a critical preparation week prior to the comprehensive exam when the study questions for the exam were sent to the students. Thus, the CUSUM control chart signals on Week 23 as it represents a significant departure from the value predicted by the model. Table 2 CUSUM Statistic Values for Closeness Network Measure
Week Closeness Model Z C+ C- 15 0.3332 0.4712 -1.9714 0.0000 1.4714 16 0.5134 0.3798 1.9086 1.4086 0.0000 17 0.2760 0.3798 -1.4829 0.0000 0.9829 18 0.3332 0.3562 -0.3286 0.0000 0.8114 19 0.5406 0.5243 0.2329 0.0000 0.0786 20 0.6536 0.5745 1.1300 0.6300 0.0000 21 0.4977 0.3916 1.5157 1.6457 0.0000 22 0.1258 0.2913 -2.3643 0.0000 1.8643 23 0.2646 0.4215 -2.2414 0.0000 3.6057 24 0.5226 0.4152 1.5343 1.0343 1.5714

9
The CUSUM control chart implemented on the residuals of a communication model proved to be effective at detecting organizational change in the TOEP program. It is also interesting to note that a decrease in communication can indicate that a major event is about to occur, as the subjects rely less on e-mail and more on face-to-face communication and study groups. Al-Qaeda Communications Network
The Center for Computational Analysis of Social and Organizational Systems (CASOS) at Carnegie Mellon University created snapshots of the annual communication between members of the al-Qaeda organization from its founding in 1988 until 2004 from open source data (Carley, 2006). The data are limited in that we do not know the type, frequency, or substance of the communication and all links are non-directional, meaning we do not know who initiated communication with whom. Finally, the completeness of the data is uncertain since it only contains information available from open sources. The data are unique in that they provide a network picture of a robust network over standard time periods of one year.
Figure 3. Monitored al-Qaeda communications network for year 2001.
Using the network snapshots for each year, the average social network measures were calculated and plotted for betweenness, closeness, and density. Each of these measures increased
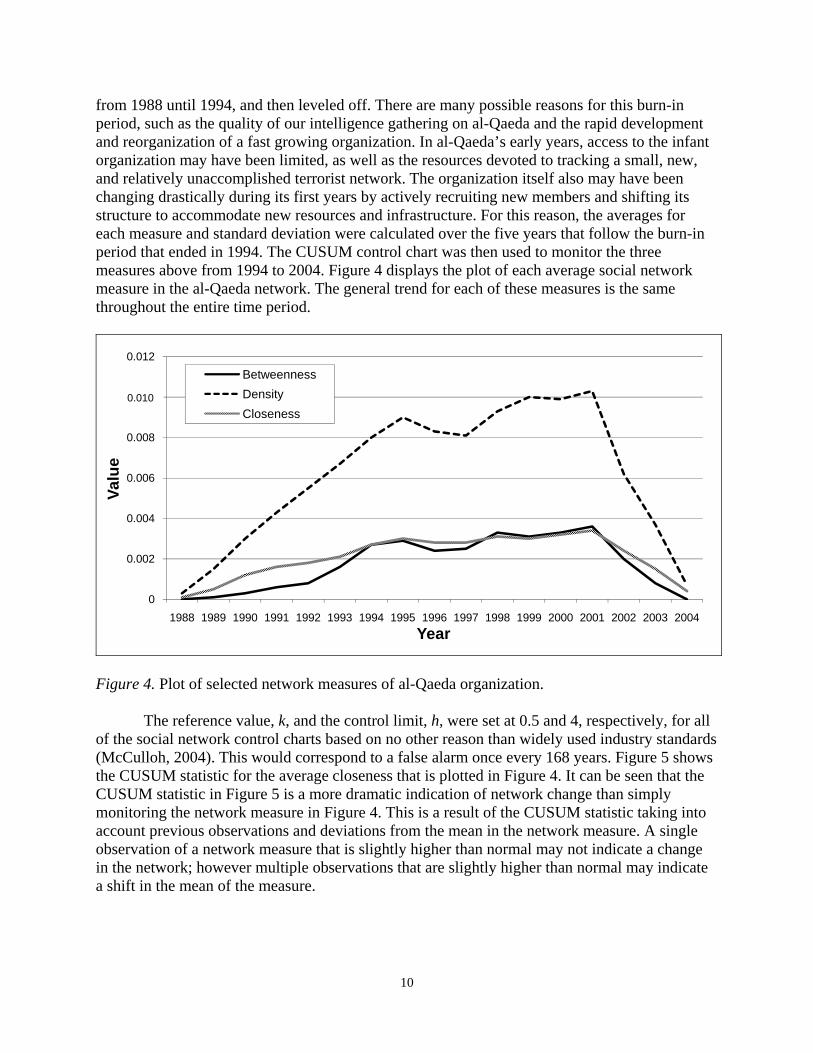
10
from 1988 until 1994, and then leveled off. There are many possible reasons for this burn-in period, such as the quality of our intelligence gathering on al-Qaeda and the rapid development and reorganization of a fast growing organization. In al-Qaeda’s early years, access to the infant organization may have been limited, as well as the resources devoted to tracking a small, new, and relatively unaccomplished terrorist network. The organization itself also may have been changing drastically during its first years by actively recruiting new members and shifting its structure to accommodate new resources and infrastructure. For this reason, the averages for each measure and standard deviation were calculated over the five years that follow the burn-in period that ended in 1994. The CUSUM control chart was then used to monitor the three measures above from 1994 to 2004. Figure 4 displays the plot of each average social network measure in the al-Qaeda network. The general trend for each of these measures is the same throughout the entire time period.
0
0.002
0.004
0.006
0.008
0.01
0.012
1988 1989 1990 1991 1992 1993 1994 1995 1996 1997 1998 1999 2000 2001 2002 2003 2004
Valu
e
Year
BetweennessDensityCloseness
Figure 4. Plot of selected network measures of al-Qaeda organization.
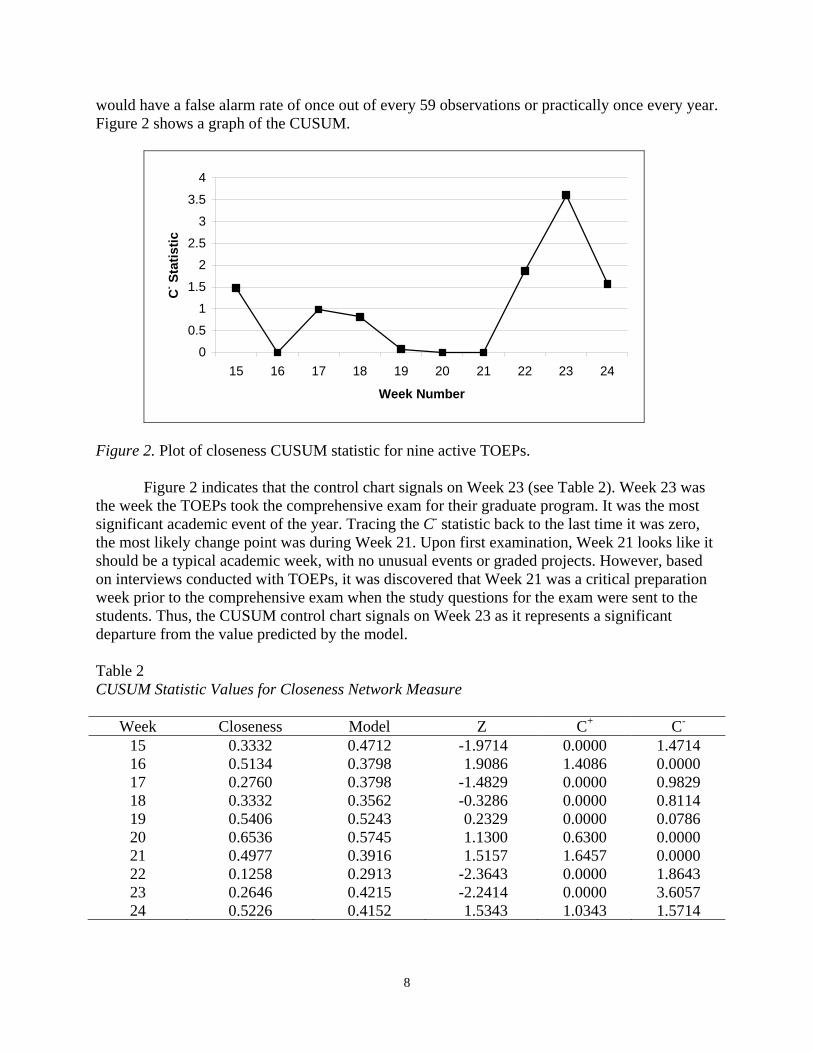
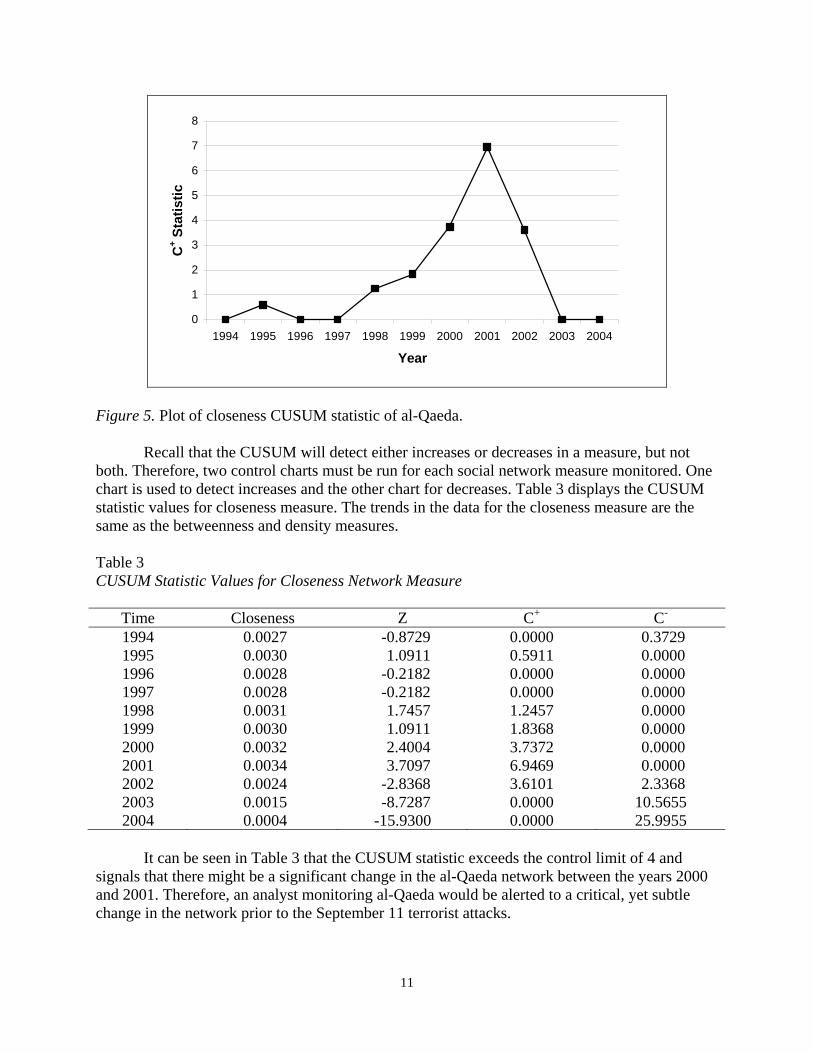
The reference value, k, and the control limit, h, were set at 0.5 and 4, respectively, for all of the social network control charts based on no other reason than widely used industry standards (McCulloh, 2004). This would correspond to a false alarm once every 168 years. Figure 5 shows the CUSUM statistic for the average closeness that is plotted in Figure 4. It can be seen that the CUSUM statistic in Figure 5 is a more dramatic indication of network change than simply monitoring the network measure in Figure 4. This is a result of the CUSUM statistic taking into account previous observations and deviations from the mean in the network measure. A single observation of a network measure that is slightly higher than normal may not indicate a change in the network; however multiple observations that are slightly higher than normal may indicate a shift in the mean of the measure.
0.010
11
0
1
2
3
4
5
6
7
8
1994 1995 1996 1997 1998 1999 2000 2001 2002 2003 2004
Year
C+ S
tatis
tic
Figure 5. Plot of closeness CUSUM statistic of al-Qaeda.
Recall that the CUSUM will detect either increases or decreases in a measure, but not both. Therefore, two control charts must be run for each social network measure monitored. One chart is used to detect increases and the other chart for decreases. Table 3 displays the CUSUM statistic values for closeness measure. The trends in the data for the closeness measure are the same as the betweenness and density measures.
Table 3 CUSUM Statistic Values for Closeness Network Measure
Time Closeness Z C+ C- 1994 0.0027 -0.8729 0.0000 0.3729 1995 0.0030 1.0911 0.5911 0.0000 1996 0.0028 -0.2182 0.0000 0.0000 1997 0.0028 -0.2182 0.0000 0.0000 1998 0.0031 1.7457 1.2457 0.0000 1999 0.0030 1.0911 1.8368 0.0000 2000 0.0032 2.4004 3.7372 0.0000 2001 0.0034 3.7097 6.9469 0.0000 2002 0.0024 -2.8368 3.6101 2.3368 2003 0.0015 -8.7287 0.0000 10.5655 2004 0.0004 -15.9300 0.0000 25.9955
It can be seen in Table 3 that the CUSUM statistic exceeds the control limit of 4 and
signals that there might be a significant change in the al-Qaeda network between the years 2000 and 2001. Therefore, an analyst monitoring al-Qaeda would be alerted to a critical, yet subtle change in the network prior to the September 11 terrorist attacks.
12
The CUSUM control chart also has a built-in feature for determining the most likely time that the change occurred. This time is identified as the last point in time when the CUSUM statistic is equal to zero. For all measures, this point in time is 1997. To understand the cause of the change in the al-Qaeda network, an analyst should look at the events occurring in al-Qaeda’s internal organization and external operating environment in 1997.
Several very interesting events related to al-Qaeda and Islamic extremism occurred in 1997. Six Islamic militants massacred 58 foreign tourists and at least four Egyptians in Luxor, Egypt (Jehl, 1997). United States and coalition forces deployed to Egypt in 1997 for a bi-annual training exercise were repeatedly attacked by Islamic militants. The coalition suffered numerous casualties and shortened their deployment. In early 1998, Zawahiri and Bin Laden were publicly reunited, although based on press release timing, they must have been working throughout 1997 planning future terrorist operations. In February of 1998, an Arab newspaper introduced the “International Islamic Front for Combating Crusaders and Jews.” This organization, established in 1997, was founded by Bin Laden, Zawahiri, leaders of the Egyptian Islamic Group, the Jamiat-ul-Ulema-e-Pakistan, and the Jihad Movement in Bangladesh, among others. The Front condemned the sins of American foreign policy and called on every Muslim to comply with God’s order to kill the Americans and plunder their money. Six months later the U.S. embassies in Tanzania and Kenya were bombed by al-Qaeda. Thus, 1997 was possibly the most critical year in uniting Islamic militants and organizing al-Qaeda for offensive terrorist attacks against the United States.
Discussion
Control charts are a critical quality-engineering tool that assist manufacturing firms in
maintaining profitability. The TOEP and al-Qaeda examples demonstrate that social network monitoring could enable analysts to detect important changes in the monitored communication of both command and control networks as well as terrorist networks. Furthermore, the most likely time that the change occurred can also be determined. This allows one to allocate minimal resources to tracking the general patterns of a network and then shift to full resources when changes are determined.
These results do not imply that the CUSUM is the only answer to social network monitoring. Instead, it provides almost anecdotal evidence that this type of change detection algorithm is feasible. Several difficulties were encountered when working with the datasets, primarily the question as to the completeness of the dataset. Since al-Qaeda is an enemy organization that resists our observation of its network, we cannot be sure that we have the entire, or even true, picture of their communication network. However, the fact that our technique detects a change corresponding with the 9/11 attacks suggests that it may be applicable to networks of non-cooperative actors.
In order to rectify the above shortcomings, future research should focus on near-complete
datasets with high resolution. Higher resolution involves taking snapshots of the network more often. This provides more opportunities to detect changes while they are still small, instead of allowing them to incubate and grow for a year, as was the case for the al-Qaeda data. Larger datasets also will provide near continuous network measures permitting the use of control charts
13
for continuous data. If these network measures also are verified as normally distributed, the CUSUM control chart can be used to monitor network change; otherwise, a different control chart must be used or a new approach at the problem made. Together, these improvements with test data will allow further investigation of change detection algorithms in a controlled environment. This model then can be applied to less controlled datasets with imperfect or missing information.
One of the most promising future research endeavors will be continued collection and examination of the TOEP e-mail network. Since many variables make up human behavior, models of the TOEP network measures should continue to improve as more data is taken into account. It also will be interesting to compare communication patterns between new TOEP classes each year to see if any consistent patterns emerge, or if similar models can be used. Study should be invested in optimizing the k and control limit values of the CUSUM Control Chart for network measure change detection. As stated earlier, these values are generally arbitrarily chosen and then optimized for the process. By using further Monte Carlo simulations, a researcher should determine which parameter value would be best in detecting certain types of changes, such as sudden large changes or slow creeping shifts. Usage of control charts on comparing models and observations should be studied to see what specific conclusions can be obtained.
Additional study is warranted for less complex, more predictable social networks. Prime examples would be communication networks that consist of routine offices, working 9-5 every workday. This will decrease the amount of variance in the data and allow control charting with minimal modifications from industrial processes. However, networks with a set of good predictors to explain varying behavior may be useful in producing models that can be control charted; this also should be researched. Thus, the mathematical study of change detection in social networks is far from settled. These studies do have, however, a broad spectrum of possible applications in fields as diverse as monitoring terror networks to improving command and control of friendly forces.

14
15
References Carley, K. M. (2002). Inhibiting adaptation. In Proceedings of the 2002 Command and Control
Research and Technology Symposium. Conference held in Naval Postgraduate School, Monterey, CA. Evidence Based Research, Track 3, Electronic Publication, http://www.dodccrp.org/events/2002_CCRTS/Tracks/pdf/023.PDF.
Carley, K. M. (2003). Dynamic network analysis. In P. Pattison (Ed.), Dynamic social network
analysis: Workshop summary and papers: 133-145. Washington, DC: The National Academies Press.
Carley, K. M. (2006). A dynamic network approach to the assessment of terrorist groups and the
impact of alternative courses of action. In Visualising Network Information. Meeting Proceedings RTO-MP-IST-063. Neuilly-sur-Seine, France: RTO. Available from: http://www.vistg.net/documents/IST063_PreProceedings.pdf.
Carley, K. M. (2007). ORA: Organizational Risk Analyzer v.1.7.8. [Network Analysis
Software]. Pittsburgh: Carnegie Mellon University. Carley, K. M., & Ren, Y. (2001). Tradeoffs between performance and adaptability for C3I
architectures. Paper presented at the Command and Control Research and Technology Symposium, Annapolis, MD.
Carley, K. M., & Schreiber, C. (2002). Information technology and knowledge distribution in C3I
teams. Proceedings of the 2002 Command and Control Research and Technology Symposium. Conference held in Naval Postgraduate School, Monterey, CA. Evidence Based Research, Track 1, Electronic Publication, http://www.dodccrp.org/events/2002_CCRTS/Tracks/pdf/032.PDF.
Everett, M. G., & Borgatti, S. P. (1999). The centrality of groups and classes. Journal of
Mathematical Sociology, 23(3), 181-201. Hamming, R. W. (1950). Error detecting and error correcting codes. Bell System Technical
Journal, 26(2), 147-160. Jehl, D. (1997, November 23). Islamic militants attack tourists in Egypt. The New York Times, p.
WK2. McCulloh, Ian. (2004). Generalized cumulative sum control charts. Unpublished Master’s
Thesis, The Florida State University. McCulloh, I., Garcia, G., Tardieu, K., MacGibon, J., Dye, H., Moores, K., Graham, J. M., &
Horn, D. B. (2007). IkeNet: Social network analysis of e-mail traffic in the Eisenhower Leadership Development Program. (Technical Report, No. 1206). Arlington, VA: U.S. Army Research Institute for the Behavioral and Social Sciences.
16
MINITAB Release 14.1. (2003). [Statistical Software]. Minitab Inc. Monge, P. R., & Contractor, N. S. (2003). Theories of Communication Networks. New York:
Oxford University Press. Neyman, J., & Pearson, E. S. (1933). On the problem of the most efficient tests of statistical
hypotheses. Philosophical Transactions Royal Society Series A., 231, 289-337. Page, E. S. (1961). Cumulative sum control charts. Technometrics, 3, 1-9. Schreiber, C. (2006). Human and Organizational Risk Modeling: Critical Personnel and
Leadership in Network Organizations. Pittsburgh, PA: Carnegie Mellon University, School of Computer Science, Institute for Software Research International, Technical Report CMU-ISRI-06-120.
Scott, J. (2002). Social Network Analysis, A Handbook. 2nd Ed. Newberry Park, CA: Sage. Wasserman, S., & Faust, K. (1994). Social Network Analysis: Methods and Applications. New
York: Cambridge University Press.