
CHAM Case Study - PHOENICS · CHAM Case Study Flow in a Stratified Thermal Energy Storage Tank...
8
CHAM Limited Pioneering CFD Software for Education & Industry CHAM Case Study Flow in a Stratified Thermal Energy Storage Tank Demonstration example using PHOENICS-2012- May 2013 CHAM’s agent for Malaysia, Focus Advanced Technologies Sdn Bhd, requested an example case to be set up on behalf of its customer, ANMAS, of a Thermal Energy Storage (TES) tank that contains normal water or glycol water (a mixture of water and ethylene.) TES units are used to off-set and reduce peak energy demand for air-conditioning systems without affecting the comfort levels within their environment. Thermal energy is stored or charged using refrigeration equipment during low- energy demand off-peak periods and then discharged for use during high energy demand, peak periods. Two cases are described below; firstly, the charging operation for a theoretical configuration to compare the effects of two different flow rates. The second shows the discharging operation for a real storage tank. CASE [1] Charging Operation: In the demonstration example shown, there are several pipe diffusers present within a cylindrical storage tank (overall dimensions of 17m x 19m). Only the major components have been considered within the context of this demonstration. There are four inlet and four outlet pipes which charge and discharge the water. During the charging operation, the tank is completely filled with water at 56˚F (13.3˚C). At regular intervals, this warm water is replaced slowly by chilled water supplied from an external chiller unit at a temperature of 42˚F (5.55˚C.) This process occurs slowly over a period of a few hours until the tank is filled completely with the lower-temperature water. The chilled water is supplied through the bottom diffusers displacing the warmer water through similar diffusers at the top of the storage tank. The chilled water supply inlets and warm water extraction locations are shown in Fig1 below.
Transcript of CHAM Case Study - PHOENICS · CHAM Case Study Flow in a Stratified Thermal Energy Storage Tank...

CHAM Limited
Pioneering CFD Software for Education & Industry
CHAM Case Study Flow in a Stratified Thermal Energy Storage Tank
Demonstration example using PHOENICS-2012- May 2013
CHAM’s agent for Malaysia, Focus Advanced Technologies Sdn Bhd, requested an example case to
be set up on behalf of its customer, ANMAS, of a Thermal Energy Storage (TES) tank that contains
normal water or glycol water (a mixture of water and ethylene.) TES units are used to off-set and
reduce peak energy demand for air-conditioning systems without affecting the comfort levels within
their environment. Thermal energy is stored or charged using refrigeration equipment during low-
energy demand off-peak periods and then discharged for use during high energy demand, peak
periods. Two cases are described below; firstly, the charging operation for a theoretical
configuration to compare the effects of two different flow rates. The second shows the discharging
operation for a real storage tank.
CASE [1] Charging Operation: In the demonstration
example shown, there are several pipe diffusers
present within a cylindrical storage tank (overall
dimensions of 17m x 19m). Only the major
components have been considered within the
context of this demonstration.
There are four inlet and four outlet pipes which
charge and discharge the water. During the
charging operation, the tank is completely filled
with water at 56˚F (13.3˚C). At regular intervals,
this warm water is replaced slowly by chilled water
supplied from an external chiller unit at a
temperature of 42˚F (5.55˚C.)
This process occurs slowly over a period of a few hours until the tank is filled
completely with the lower-temperature water.
The chilled water is supplied through the bottom diffusers displacing the
warmer water through similar diffusers at the top of the storage tank. The
chilled water supply inlets and warm water extraction locations are shown in
Fig1 below.

Figure 1 CFD model - Simplified geometry.
The CFD model has been constructed using standard objects built into PHOENICS. This transient
case involves single-phase flow and heat transfer. For the purpose of this particular example, heat is
neither gained nor lost through the tank’s external wall. Although using a polar coordinate mesh
would be normal for this type of case, the PARSOL (PARtial SOLid) feature of PHOENICS makes it
equally practical to create the CFD model within a Cartesian mesh.
Temperature distributions inside the tank with two different flow rates at various time intervals are
shown below in Fig2 to Fig4. The interfacial zone between the warm and chilled water where there
is large temperature gradient, is known as the thermocline. Temperature contours within the
stratified storage tank show the thermocline forming at the bottom and gradually moving up to the
top as the charging process continues.
Figure 2 Temperature distribution inside the tank after 1-hour (left) and 2-hour (right)
charging periods, with flow rates of 0.4m3/s (left) and 0.2 m
3/s (right) respectively.

Figure 3 Temperature distribution inside the tank after 2-hour (left) and 4-hour (right)
charging periods, with flow rates of 0.4m3/s (left) and 0.2m
3/s (right) respectively.
Figure 4 Temperature distribution inside the tank after 3-hour (left) and 6-hour (right)
charging periods, with flow rates of 0.4m3/s (left) and 0.2m
3/s (right) respectively.
The effect of flow rate on thermal stratification in the storage tank is shown in Fig5 (below) by plotting the average temperature distribution with height (at three different time intervals) for the two different charge rates. As expected, the temperature profile for the higher flow rate is much steeper than for the lower flow rate case. This is because the higher stream flow rate increases the mixing of warm and chilled water, which in turn reduces cooling capacity. Therefore, using a lower flow rate improves the thermal stratification.
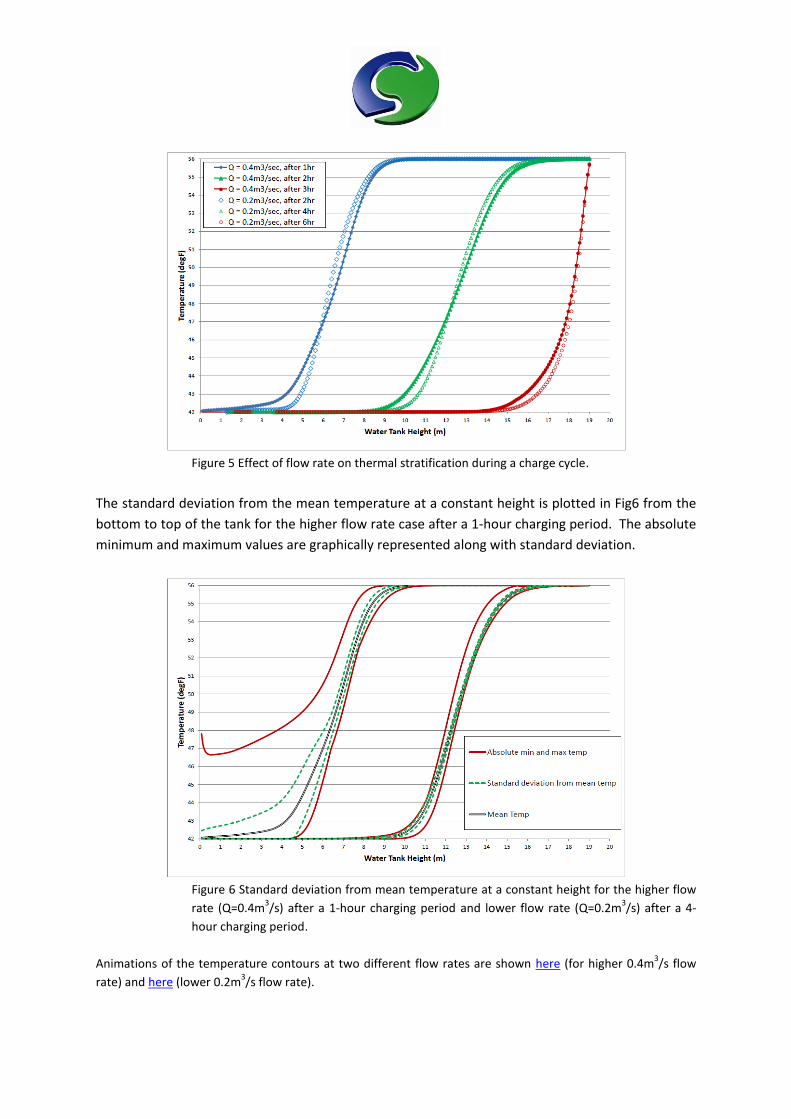
Figure 5 Effect of flow rate on thermal stratification during a charge cycle.
The standard deviation from the mean temperature at a constant height is plotted in Fig6 from the
bottom to top of the tank for the higher flow rate case after a 1-hour charging period. The absolute
minimum and maximum values are graphically represented along with standard deviation.
Figure 6 Standard deviation from mean temperature at a constant height for the higher flow
rate (Q=0.4m3/s) after a 1-hour charging period and lower flow rate (Q=0.2m
3/s) after a 4-
hour charging period.
Animations of the temperature contours at two different flow rates are shown here (for higher 0.4m3/s flow
rate) and here (lower 0.2m3/s flow rate).
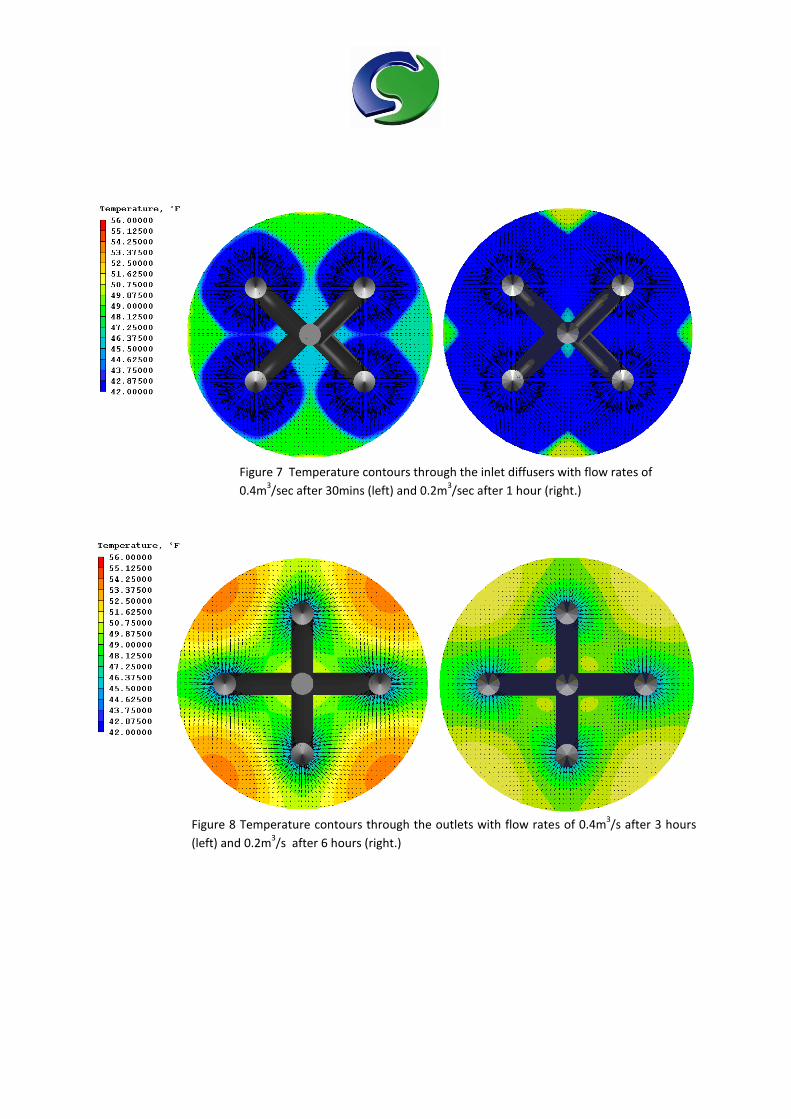
Figure 7 Temperature contours through the inlet diffusers with flow rates of
0.4m3/sec after 30mins (left) and 0.2m
3/sec after 1 hour (right.)
Figure 8 Temperature contours through the outlets with flow rates of 0.4m
3/s after 3 hours
(left) and 0.2m3/s after 6 hours (right.)

CASE [2) Discharging Operation: As might be expected, discharging is the opposite process to the
charging operation. The following describes the discharging process for a real thermal storage tank
in use by ANMAS. During its 12-hour discharging period, the resident cool water stored at 42oF
(5.55oF) is withdrawn via extract units at a low level in the tank. At the same time, re-cycled warm
water with a temperature of 56oF (13.33
oC) is supplied via diffusers the top of the storage tank. In
this case, the thermal storage tank is equipped with 10 supply diffusers at the top and 10 extracts
near its base. As part of the structural design, the tank has internal columns and beams, which are
included in the CFD model. The size of the tank is about 91m x 43m x 10.63m. The locations of
inlets, outlets, beams, columns is shown in Fig9 below.
Figure 9 CFD model - Discharging process
A numerical grid of about 3.75 million cells was used for the simulation. Especial attention was taken to use a fine grid in vertical direction to capture the thermocline accurately. The model was run in transient mode to simulate the fluid motion and thermal conditions during its 12-hour discharging period. The model took 62 hours of CPU time when run in parallel on 12 processors, using a time step of 30secs. At the start of the simulation, more sweeps were used to ensure good convergence, i.e. 200 sweeps were used for the first 6 time steps and, as the solution develops, less change becomes evident from one time step to the next. Therefore, fewer sweeps were used; for example, 30 sweeps per time step were used after 30th time step.
The temperature distributions inside the tank taken at various time intervals are shown in Fig10 to
Fig12. Each diffuser has a flow rate of 0.78m3/sec. Temperature contours within the stratified
storage tank show the thermocline forming at the top and gradually moving down to the bottom as
the discharging process continues.
Animations of the temperature contour through front row 4 diffusers and behind 6 diffusers after 12hours
discharging period are shown here and here respectively.
Warm water supply diffusers
Cold water extractors
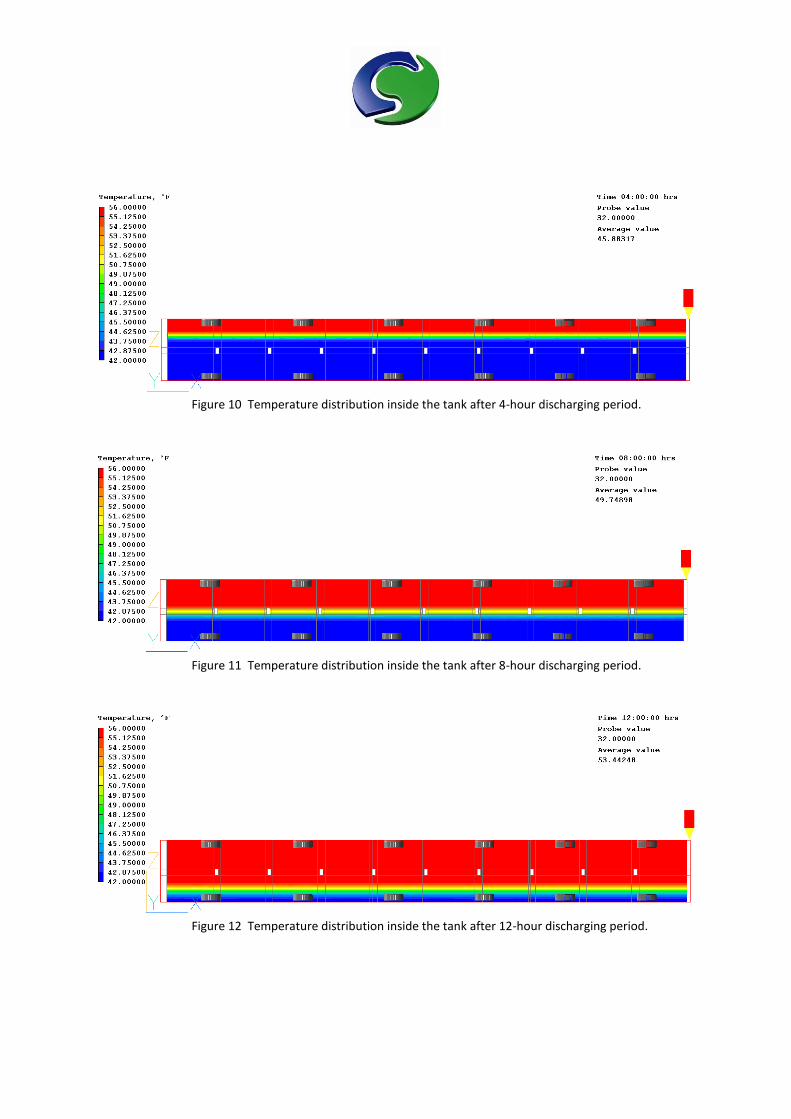
Figure 10 Temperature distribution inside the tank after 4-hour discharging period.
Figure 11 Temperature distribution inside the tank after 8-hour discharging period.
Figure 12 Temperature distribution inside the tank after 12-hour discharging period.
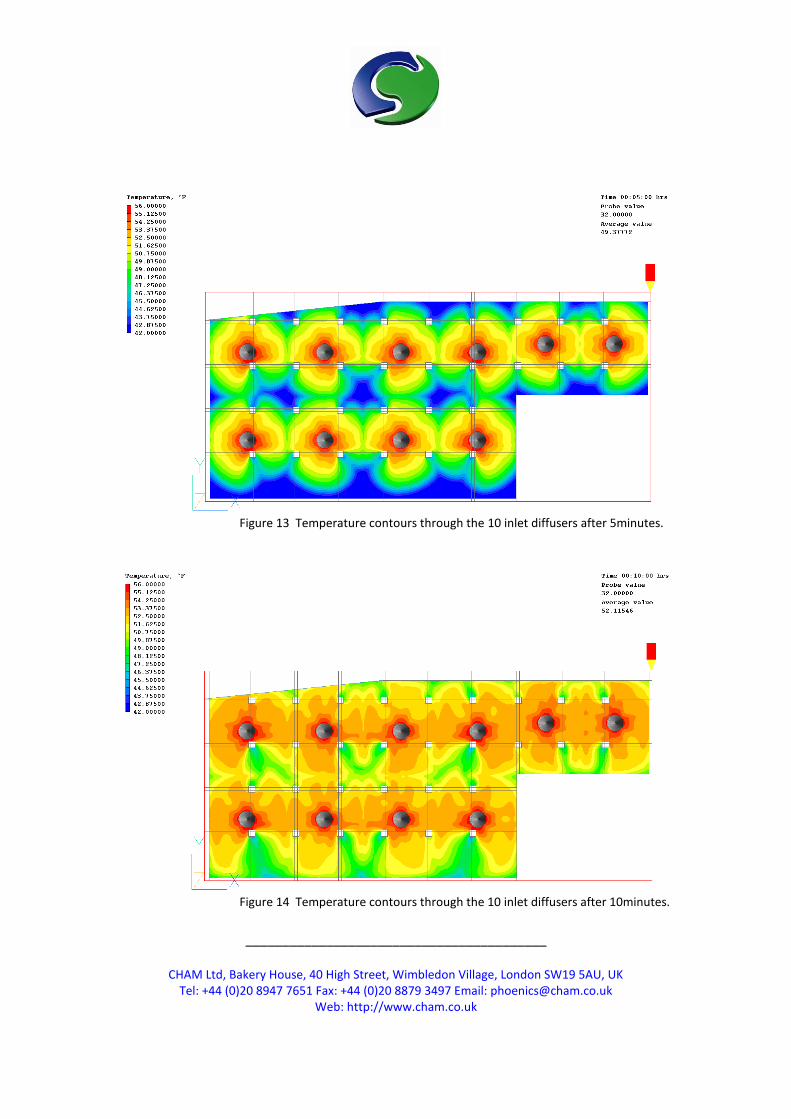
Figure 13 Temperature contours through the 10 inlet diffusers after 5minutes.
Figure 14 Temperature contours through the 10 inlet diffusers after 10minutes.
_________________________________________
CHAM Ltd, Bakery House, 40 High Street, Wimbledon Village, London SW19 5AU, UK
Tel: +44 (0)20 8947 7651 Fax: +44 (0)20 8879 3497 Email: [email protected] Web: http://www.cham.co.uk