Challenges to developing resilience to post-earthquake .../media/shared/documents... · Beichuan,...
18
Challenges to developing resilience to post-earthquake landslides T.C. Hales Xuanmei Fan, Oliver Francis, Brian MacGillivray, Guillem Domenech, Jing Ran, Dan Hobley, Yi Gong
Transcript of Challenges to developing resilience to post-earthquake .../media/shared/documents... · Beichuan,...
Challenges to developing resilience to post-earthquake landslides
T.C. Hales
Xuanmei Fan, Oliver Francis, Brian MacGillivray, Guillem Domenech, Jing Ran, Dan Hobley, Yi Gong

Beichuan, Sichuan, China
May 12, 2008- Earthquake shaking
12 min post-earthquake-landsliding
June 10, 2008-landslide dam collapse
Sept 24, 2008- 1st post earthquake debris flow
Hazard
con
centratin
g from
a wid
e
spatial area to
river valleys at d
ecreasin
g frequ
en
cy
The 7.8 Wenchuan Earthquake

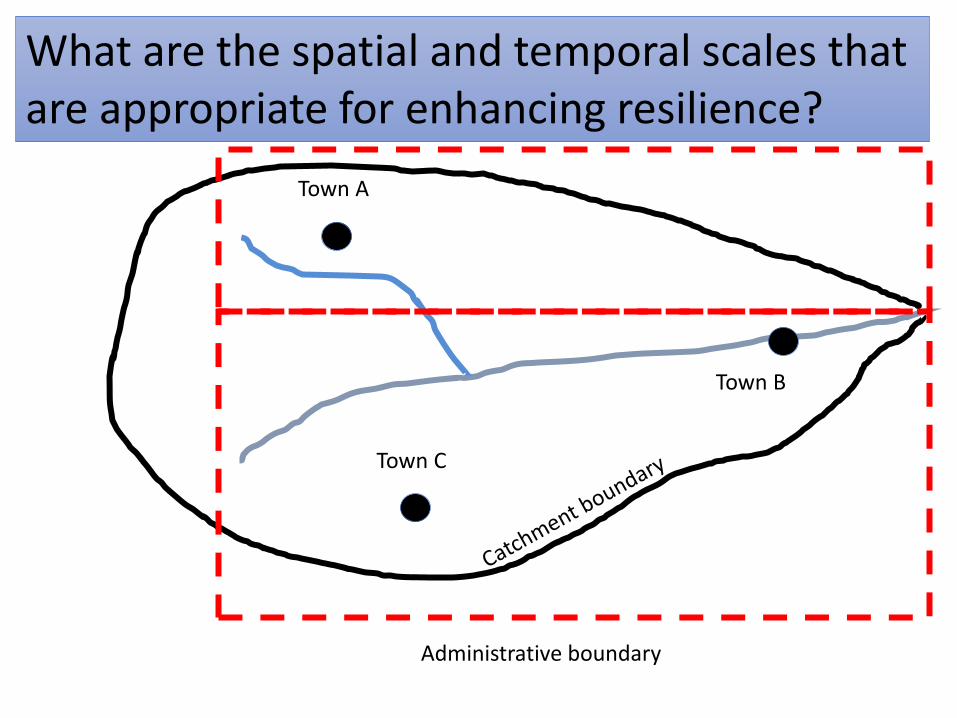
What are the spatial and temporal scales that are appropriate for enhancing resilience?
Town A
Town B
Administrative boundary
Town C

Research Question • How do we develop
resilience to post-earthquake debris flow hazards? • How does hazard vary
with time?
• At what spatial and temporal scale does resilience develop?

Post earthquake debris flow - 2010

2010 Qingping Debris Flow

100
10
1
0.1
Mea
n r
ain
fall
inte
nsi
ty (
mm
/h)
1 10 100
Rainfall duration (h)
Rainfall triggering DF 2008
Rainfall triggering DF 2009-2013
Threshold rainfall for DF triggering increases with time
Guo et al. (2016) Geomorphology
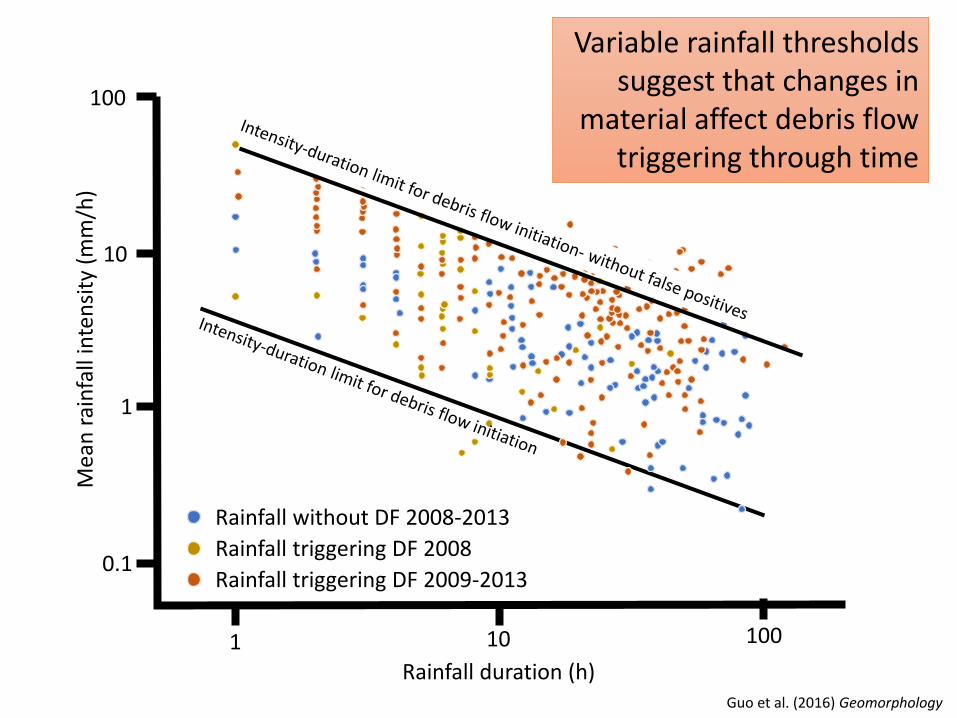
Rainfall conditions under which debris flows are
triggered
100
10
1
0.1
Mea
n r
ain
fall
inte
nsi
ty (
mm
/h)
1 10 100
Rainfall duration (h)
Rainfall without DF 2008-2013
Rainfall triggering DF 2008
Rainfall triggering DF 2009-2013
Guo et al. (2016) Geomorphology
Variable rainfall thresholds suggest that changes in
material affect debris flow triggering through time

y = 119.83x0.4143 R² = 0.1782
1000
10000
100000
1000000
10000000
10000 100000 1000000 10000000 100000000
De
bri
s Fl
ow
Vo
lum
e (
m3)
Coseismic Landslide Volume (m3)
Poor correlation between debris flows and availability of debris

Study area: Mianjiang River

2008
2014
We mapped the “activity” levels of coseismic landslides since 2008

Total coseismic debris volume = 1.1 km3
Volume remaining in 2011 = 1.0 km3

Topographic drivers of debris flows
Den
sity
0 10 20 30 40 50
Slope (degrees)
“Active” landslides
“Inactive” landslides
No difference in the slopes of active and inactive slides
Den
sity
0 2 4 6 8
Drainage area (log m2)
Active landslides found in topographically wetter locations

From Richard Iverson
Why is there so much uncertainty in understanding where debris flows initiate?
What are the spatial and temporal scales that are appropriate for enhancing resilience?
Town A
Town B
Administrative boundary
Town C
Rel
ativ
e H
azar
d
Res
ilien
ce
Rel
ativ
e H
azar
d
Res
ilien
ce
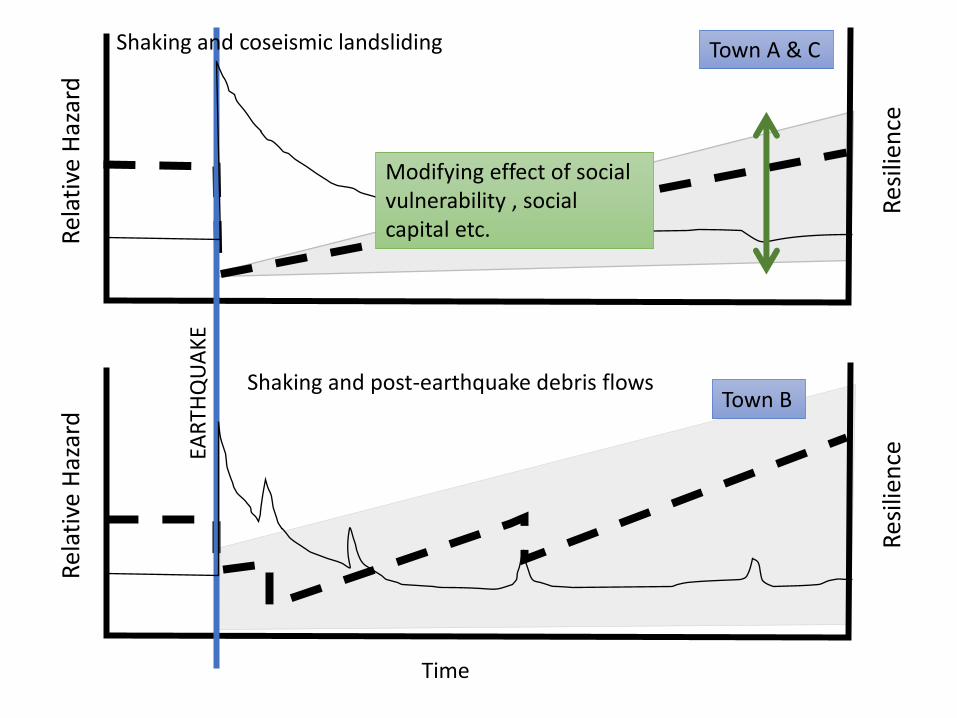
Town A & C
Time
Shaking and coseismic landsliding
Shaking and post-earthquake debris flows
EAR
THQ
UA
KE
Town B
Modifying effect of social vulnerability , social capital etc.

• Despite an apparent reduction in debris flow hazard through time, most of the coseismic debris that creates debris flows remains in catchments.
• Simple metrics of debris flow hazard are elusive, as hazard depends on the ability of a flow to bulk by entraining wet sediment.
• The earthquake hazard chain leads to heightened susceptibility along river channels potentially leading to a resilience chain.

Spatial measurements of resilience
Changes in post-earthquake population growth rates