Challenges of high growth: Global aviation outlook · 2015-02-26 · Global CO2 from fuel burn,...
34
To represent, lead and serve the airline industry Challenges of high growth: Global aviation outlook Brian Pearce, Chief Economist www.iata.org/economics
Transcript of Challenges of high growth: Global aviation outlook · 2015-02-26 · Global CO2 from fuel burn,...

To represent, lead and serve the airline industry
Challenges of high growth: Global aviation outlook Brian Pearce, Chief Economist www.iata.org/economics

Challenges of high growth
• Meeting demand for air travel • Attracting capital • Wider economic benefits • Climate impacts
IATA Economics www.iata.org/economics 2

Demand for air travel to double over 20 years
IATA Economics www.iata.org/pax-forecast 3
Source: IATA/Tourism Economics ‘Air Passenger Forecasts’
2,000
3,000
4,000
5,000
6,000
7,000
8,000
9,000
2014 2019 2024 2029 2034
Outlook for worldwide O-D passenger trips, million
2014-2034
1.8-2.8x growth
2.3-5 billion additional O-D passenger trips
Currentpolicies
Liberalpolicies scenario
Closing borders scenario
Largest rise in numbers forecast in China
IATA Economics www.iata.org/pax-forecast 4
Source: IATA/Tourism Economics ‘Air Passenger Forecasts’
-200
-100
0
100
200
300
400
500
600
700
800
900
-200
-100
0
100
200
300
400
500
600
700
800
900
Drivers of additional passenger numbers, million
Living standards Demographics Price and other Overall growth

Living standards are one key driver
IATA Economics www.iata.org/pax-forecast 5
0.00
0.01
0.10
1.00
10.00
0 10 20 30 40 50 60 70 80 90 100 110 120
Flig
hts p
er c
apita
* (2
013,
loga
rithm
ic sc
ale)
GDP per capita (2013, US$ '000s)
China
USA
UK Luxembourg
Norway
Qatar
AustraliaSwitzerland
Sweden
SingaporeHong Kong Iceland
BahamasMaldives
Seychelles
Uganda
FranceJapan
Russia
Brazil
New Zealand
Source: IATA/Tourism Economics ‘Air Passenger Forecasts’

Countries becoming ‘middle’ or ‘high’ income
IATA Economics www.iata.org/pax-forecast 6
Source: IATA/Tourism Economics ‘Air Passenger Forecasts’

Demographic change dramatically different
IATA Economics www.iata.org/pax-forecast 7
Source: IATA/Tourism Economics ‘Air Passenger Forecasts’
-25%
-20%
-15%
-10%
-5%
0%
5%
10%
15%
20%
25%
India Indonesia Turkey US Brazil France China Germany Japan Russia
% c
hang
e 20
14-2
034
Demographic change, 2014-2034
Population change
'Flying' population change

Emerging market population much younger
IATA Economics www.iata.org/economics 8
0
10
20
30
40
50
60
2014 2019 2024 2029 2034
Old-age dependency ratio, % (65+/15-64)
Japan
Germany
US
China
Brazil
TurkeyIndonesiaIndia
Source: IATA/Tourism Economics ‘Air Passenger Forecasts’

Trend in cost of travel is still downwards
IATA Economics www.iata.org/pax-forecast 9
0.8
1.0
1.2
1.4
1.6
1.8
2.0
2.2
2.4
2.6
2.8
0.5
0.6
0.7
0.8
0.9
1.0
1.1
1.2
1.3
1.4
1.5
1970 1980 1990 2000 2010
US
$ in
201
3 pr
ices
per
tonn
e ki
lom
eter
US
$ in
201
3 pr
ices
to fl
y a
tonn
e ki
lom
eter
Unit cost and the price of air transport, adjusted for inflation
Price (US$/RTK)
Unit cost (US$/ATK)
Source: IATA/Tourism Economics ‘Air Passenger Forecasts’

Scope for lower fares on a number of markets
IATA Economics www.iata.org/pax-forecast 10
0.05
0.07
0.09
0.11
0.13
0.15
0.17
0.19
0 2,000 4,000 6,000 8,000 10,000 12,000 14,000 16,000 18,000
Pass
enge
r yie
lds,
US$
per
RPK
Average trip length (kms)
Passenger yields and average trip length
Within Africa
Within South America
Within ASEAN
WithinEurope
Middle East-rest of world
ASEAN-Europe
North Atlantic
Pacific
North-South America
Within East Asia
ASEAN-Africa
China-North AmericaASEAN-North America
ASEAN-E Asia
Europe-Australia
Source: IATA/Tourism Economics ‘Air Passenger Forecasts’

Resulting in much change over next 20 years
IATA Economics www.iata.org/pax-forecast 11
0
1
2
3
4
5
6
7
8
9
10
0
1
2
3
4
5
6
7
8
9
10
2013
2014
2015
2016
2017
2018
2019
2020
2021
2022
2023
2024
2025
2026
2027
2028
2029
2030
2031
2032
2033
2034
US
China
UK
Japan
Germany
Spain
France
Italy
India
Brazil
2013 rank 2034 rank
China
US
India
UK
Brazil
Indonesia
Spain
Germany
Japan
France
Source: IATA/Tourism Economics ‘Air Passenger Forecasts’
Rank by size of O-D passenger flows in, out & within country

Trans-Pacific a
43m 83m
952m 2,541m
618m 1,003m
Trans-Atlantic a
63m 110m
Passenger journeys by route (2014 and 2034, million)
542m 1,007m
North-South America a
20m 44m
2014 passenger flow 2034 passenger flow
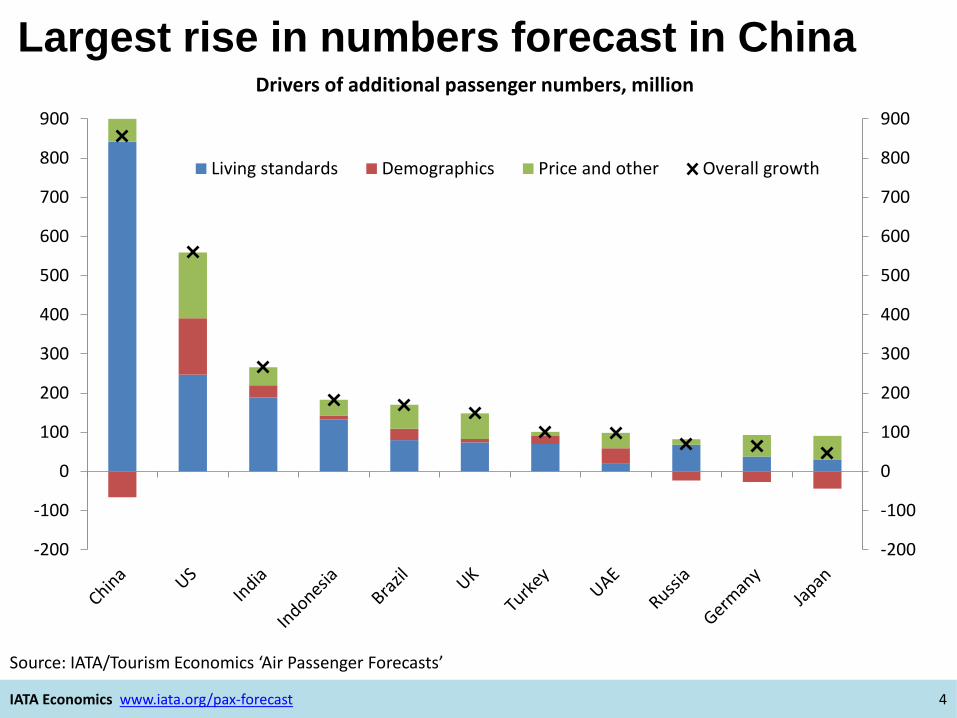
Within Asia-Pacific
Within Europe Within North America
Trans-Pacific
+40m 3.3% +1,589m
5.0%
Within Asia-Pacific
+386m 2.5%
Within Europe
Trans-Atlantic
+48m 2.9%
Legend: +123m = the additional number of annual passenger journeys by 2034 (example) 5.0% = the corresponding average annual growth rate (2014-2034)
Growth and change in passenger journeys by route (% and million, 2014-2034)
+465m 3.1%
Within North America
North-South America
+20m 4.0%

Challenges of high growth
• Meeting demand for air travel • Attracting capital • Wider economic benefits • Climate impacts
IATA Economics www.iata.org/economics 14

Airlines will need to raise $5 trillion capital
IATA Economics www.iata.org/economics 15
Source: Boeing current market outlook

Airlines are not most attractive to investors!
IATA Economics www.iata.org/economics 16
Industry
Industry median ROIC, without goodwillPercent
1 ROIC after tax, excluding goodwill; For charting purposes, ROIC values are cut off if beyond (-5%, 50%)
1965 – 2007 Average
1st quartile
3rd quartile
Median
PharmaceuticalsSoftwareIT ServicesBeveragesHH & Personal ProductsApparel RetailBroadcastingRestaurantsHealth Care EquipmentComputers & PeripheralsFood ProductsMachineryChemicalsMovies & EntertainmentAerospace & DefenseAuto ComponentsBuilding ProductsEnergy Equipment & ServicesHealth Care FacilitiesIntegrated Oil & GasDepartment StoresTruckingConstruction MaterialsMetals & MiningPaper PackagingPaper & Forest ProductsIntegrated TelecomElectric UtilitiesAirlines
Source: McKinsey

Is the problem a result of liberalization?
IATA Economics www.iata.org/economics 17
Source: IATA, ICAO
-6%
-4%
-2%
0%
2%
4%
6%
8%
1950 1955 1960 1965 1970 1975 1980 1985 1990 1995 2000 2005 2010
Airline industry profit margin, after debt interest and tax
Average0.2%
After liberalization
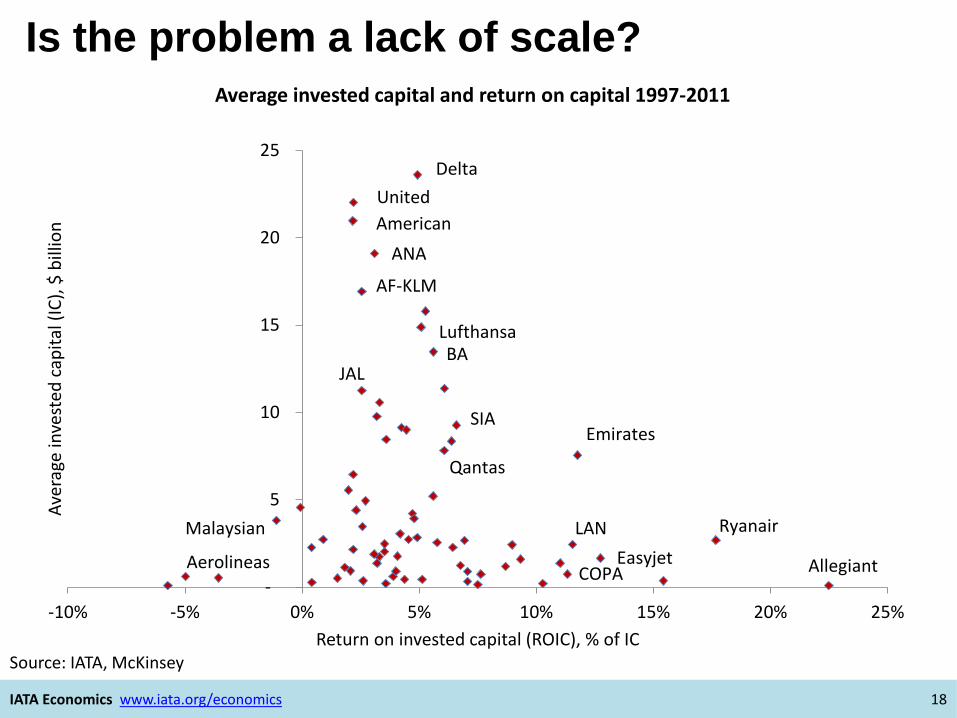
Is the problem a lack of scale?
IATA Economics www.iata.org/economics 18
-
5
10
15
20
25
-10% -5% 0% 5% 10% 15% 20% 25%
Aver
age
inve
sted
capi
tal (
IC),
$ bi
llion
Return on invested capital (ROIC), % of IC
Average invested capital and return on capital 1997-2011
DeltaUnitedAmerican
ANA
AF-KLM
BALufthansa
Emirates
Ryanair
Allegiant
LAN
JAL
EasyjetCOPA
SIA
Qantas
Aerolineas
Malaysian
Source: IATA, McKinsey

Is the problem legacy business models?
IATA Economics www.iata.org/economics 19
0%
1%
2%
3%
4%
5%
6%
7%
8%
9%
2004 2005 2006 2007 2008 2009 2010 2011
% in
vest
ed c
apita
l
ROIC for worldwide average legacy and LCCs versus WACC
ROIC 'LCCs'
ROIC 'Legacy'
WACC
Source: IATA, McKinsey

Is the problem with airlines’ supply chain?
IATA Economics www.iata.org/economics 20
0
5
10
15
20
25
30Return on invested capital in the air transport value chain, 2002-2009
ROIC WACC
Source: IATA, McKinsey

Supplier ‘excess’ profit not large in $ terms
IATA Economics www.iata.org/economics 21
Source: IATA, McKinsey
-0.6
Trav
el
agen
ts
CRS
0.5
Airli
nes
-17.0
ANSP
0.7
Airp
orts
-3.7
Cate
ring
0.2
Grou
ndha
ndlin
g
0.5
MRO
0.3
Less
ors
Frei
ght F
orw
arde
rs
-16.0-18.0
Tota
l
1.3
-0.2
Man
ufac
ture
rs

Costs typically passed through to prices
IATA Economics www.iata.org/economics 22
-
1.0
2.0
3.0
4.0
5.0
6.0
7.0
0.0
0.5
1.0
1.5
2.0
2.5
3.0
3.5
4.0
1950 1960 1970 1980 1990 2000 2010
US
$ in
201
3 pr
ices
per
tonn
e ki
lom
eter
US
$ in
201
3 pr
ices
to fl
y a
tonn
e ki
lom
eter
Unit cost and the price of air transport
Price(US$/RTK)
Unit cost(US$/ATK)
US deregulation
EU deregulation
Boeing 707
1973 oil crisis
Source: IATA/Tourism Economics ‘Air Passenger Forecasts’

In fact yields have fallen faster than unit costs
IATA Economics www.iata.org/economics 23
45%
50%
55%
60%
65%
70%
1970 1975 1980 1985 1990 1995 2000 2005 2010
% A
TKs
Breakeven and actual load factors
Breakeven load factor
Load factor achieved
+15%points
Source: IATA, ICAO

Inadequate returns on invested capital
IATA Economics www.iata.org/economics 24
Source: IATA, McKinsey
0.0
1.0
2.0
3.0
4.0
5.0
6.0
7.0
8.0
9.0
10.0
1994 1996 1998 2000 2002 2004 2006 2008 2010 2012 2014
% o
f inv
este
d ca
pita
l
Return on capital invested in airlines
Cost of capital (WACC)
Return on capital (ROIC)
Challenges of high growth
• Meeting demand for air travel • Attracting capital • Wider economic benefits • Climate impacts
IATA Economics www.iata.org/economics 25

This is aviation’s unique economic benefit
IATA Economics www.iata.org/economics 26
Source: SRS Analyser
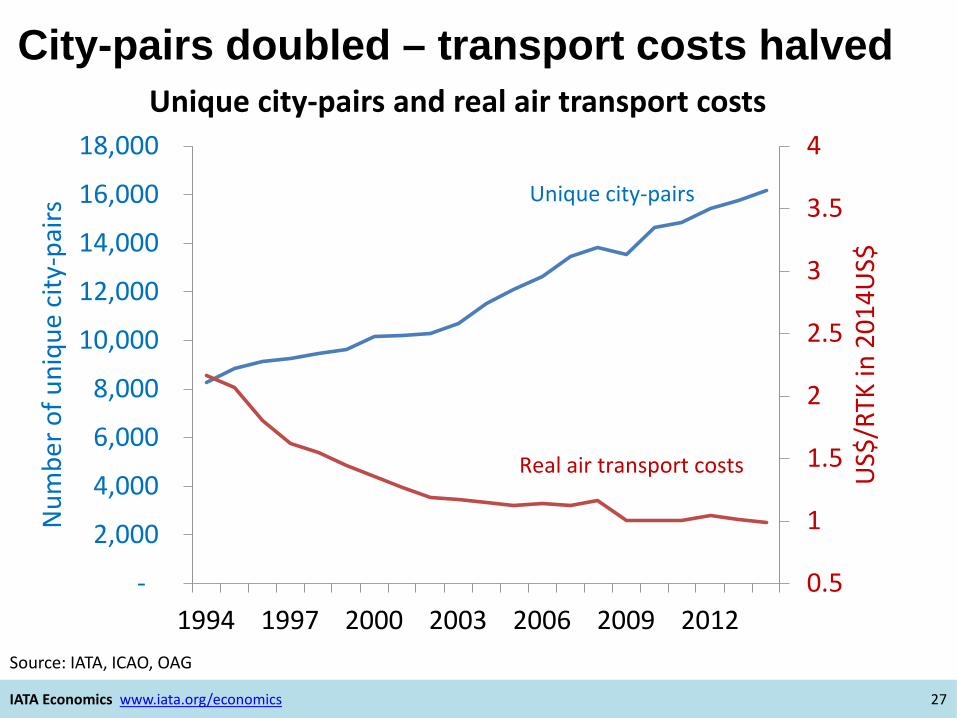
City-pairs doubled – transport costs halved
IATA Economics www.iata.org/economics 27
Source: IATA, ICAO, OAG
0.5
1
1.5
2
2.5
3
3.5
4
-
2,000
4,000
6,000
8,000
10,000
12,000
14,000
16,000
18,000
1994 1997 2000 2003 2006 2009 2012
US$
/RTK
in 2
014U
S$
Num
ber o
f uni
que
city
-pai
rs
Unique city-pairs and real air transport costs
Unique city-pairs
Real air transport costs

Global Value Chains – diversification and development
IATA Economics www.iata.org/economics 28
An opportunity for SIDS?
Source: ATAG

How do we measure the degree of air connectivity?
IATA Economics www.iata.org/economics 29
0.00 1.00 2.00 3.00 4.00 5.00 6.00MaldivesSt. Lucia
FijiAntigua and BarbudaSeychellesJamaica
GrenadaBarbadosVanuatuMauritiusSingapore
Dominican Republic
US
Spain
Trinidad and Tobago
Norway
UK
GermanyChinaBrazil
South KoreaSolomon Islands
Papua New Guinea
NigeriaPoland
IATA air connectivity measure, seats to weighted destinations as % GDP
Source: IATA, World Bank, SEO

Challenges of high growth
• Meeting demand for air travel • Attracting capital • Wider economic benefits • Climate impacts
IATA Economics www.iata.org/economics 30

CO2 up despite strong efficiency gains
IATA Economics www.iata.org/economics 31
0
50
100
150
200
250
300
1994 1996 1998 2000 2002 2004 2006 2008 2010 2012 2014
Inde
xed
to e
qual
100
in 1
994
Worldwide RTKs, CO2 and fuel efficiency
RTKs2.7x
CO21.5x
Fuel use/RTK0.4x
Source: IATA, Datastream

Carbon neutral growth policy key for aviation
IATA Economics www.iata.org/economics 32
450
550
650
750
850
950
1050
1150
20 000
25 000
30 000
35 000
40 000
45 000
50 000
55 000
60 000
1990 1995 2000 2005 2010 2015 2020 2025 2030 2035
Avia
tion
CO2,
mill
ion
tonn
es
Glo
bal C
O2
from
fuel
bur
n, m
illio
n to
nnes
Global vs aviation CO2 emissions
Aviation CO2 after pillar 1-3 measures, inc. 12% biofuels+2.5% p.a.
Currentclimate policies+1.4% pa
New policies+0.7% pa
450ppm scenario-1.7% pa
Source: IEA 2013 World Energy Outlook, IATA Aviation Carbon Model
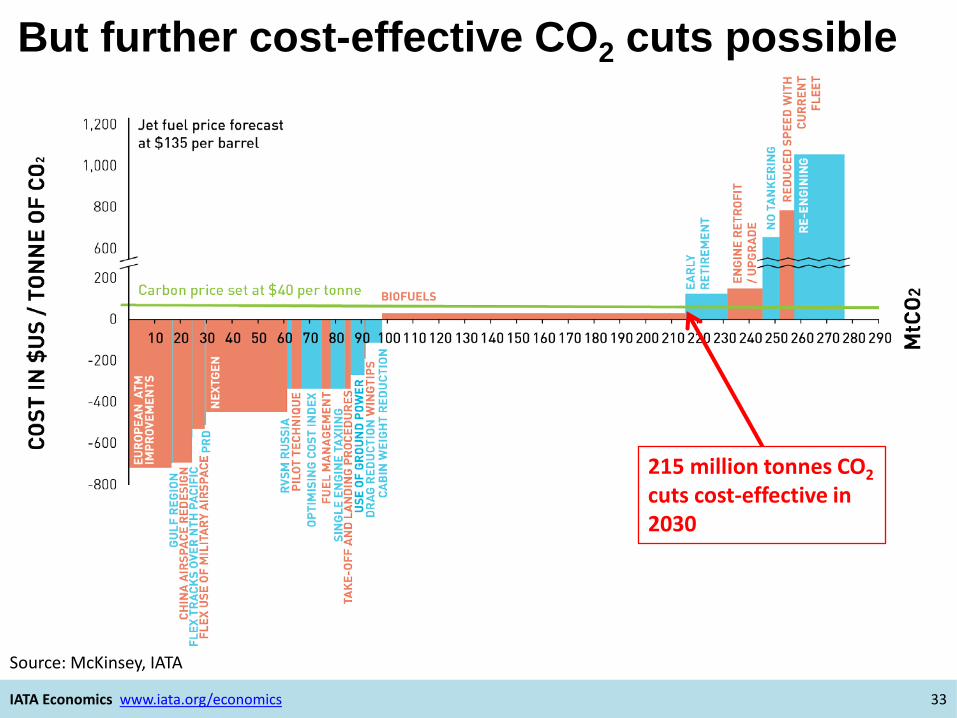
But further cost-effective CO2 cuts possible
IATA Economics www.iata.org/economics 33
215 million tonnes CO2 cuts cost-effective in 2030
Source: McKinsey, IATA
Challenges of high growth • Meeting demand for air travel
– OD pax flows on US markets likely to double in next 20 years – Fastest growth on N-S American and trans-Pacific markets – Largest increase in numbers within N America and trans-Atlantic
• Attracting capital – $5 trillion new capital needed by airlines over 20 years but returns inadequate – Mergers/JVs driven by network economics and the need to pay capital providers
• Wider economic benefits – Connecting US to markets/cities worldwide is the unique economic value – Bigger markets, access to efficient resources, specialization, competition – How does a measure of connectivity best capture this (generalized costs?)?
• Climate impacts – One of best fuel efficiency improvement records of all industries – But success with Carbon Neutral Growth policy will more surely enable growth – ATM improvements can offer some of the largest cost-effective CO2 reductions
IATA Economics www.iata.org/economics 34