Challenges in managing the T&T Economic ‘Plane’ COTE Conference Dennis Pantin October 09, 2008.
36
Challenges in managing the T&T Economic ‘Plane’ COTE Conference Dennis Pantin October 09, 2008
-
Upload
sabina-wiggins -
Category
Documents
-
view
216 -
download
2
Transcript of Challenges in managing the T&T Economic ‘Plane’ COTE Conference Dennis Pantin October 09, 2008.

Challenges in managing the T&T Economic ‘Plane’COTE Conference
Dennis Pantin
October 09, 2008

Content of Presentation
What type of Economic ‘Plane’? Type of ‘Engine’ Type of ‘fuel’ ‘ Clear air Turbulence’ already at hand ‘Turbulence’ within ‘Turbulence’ down the road Proposals for managing turbulence/avoidance of
another crash landing as in 1980s/early 1990s
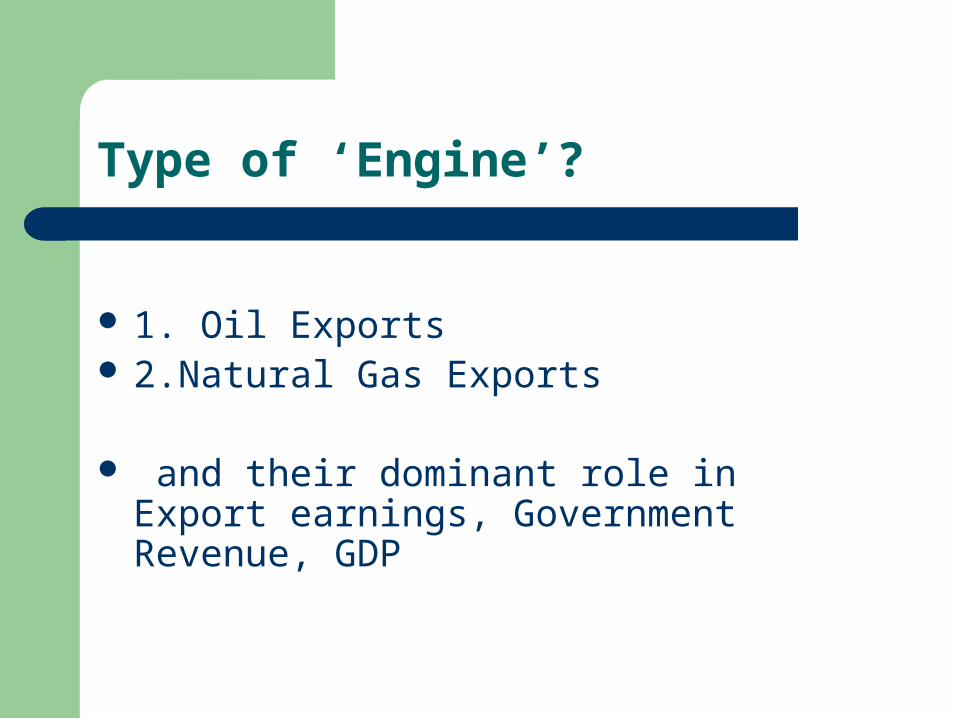
Type of ‘Engine’?
1. Oil Exports 2.Natural Gas Exports
and their dominant role in Export earnings, Government Revenue, GDP

How Dependant ?Figure 4Hydrocarbon Exports as % of Total Exports
1981-2006
0.00
20.00
40.00
60.00
80.00
100.00
120.00
140.00
160.00
Years
$b
illi
on
TT Total Exports
Hydro-Carbon Exports
Source: Table A 3
How Dependant ?
0
10
20
30
40
50
60
70
80
90
100
%
1981 1984 1987 1990 1993 1996 1999 2002 2005
Years
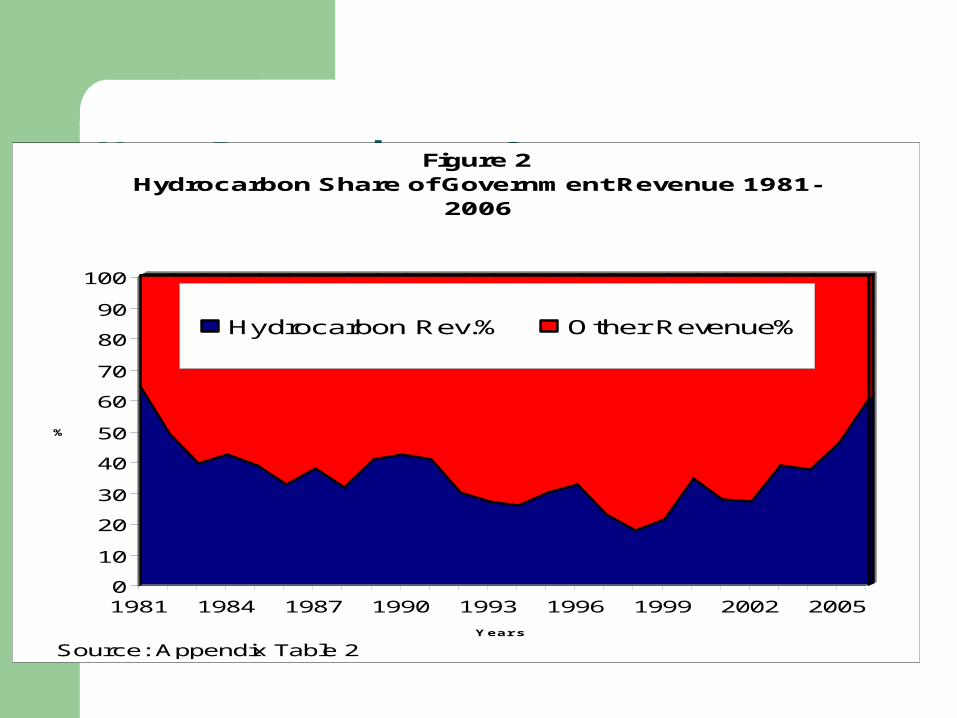
Figure 2Hydrocarbon Share of Government Revenue 1981-
2006
Hydrocarbon Rev.% Other Revenue%
Source: Appendix Table 2

Petroleum’s Contribution %ITEM 2002 2003 2004 2005 2006r 2007p
GDP 26.2 33.9 37.1 42.9 46.8 43.0
Gov’t Revenues 27.8r 42.8r 42.4r 53.6r 61.9 56..5
M’dise Exports 75.9 83.3 85.8 85.9 91.0 86.7
Employment 3.4 3.2 3.6 3.4 3.3 3.3
Notes: p- provisional , r – revised Source: Annual Economic Survey, 2006: www.central-bank.org.tt

Growth in the Energy and Non Energy Sectors
0
5
10
15
20
25
30
35
2001 2002 2003 2004 2005
per
cent
Energy Non Energy
Source: Central Statistical Office
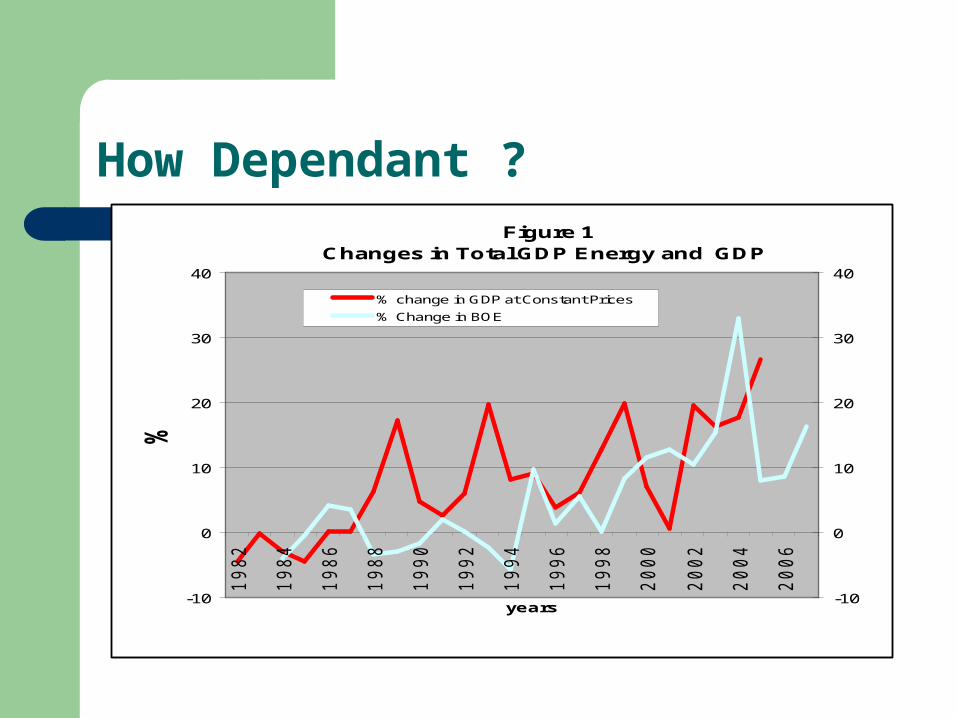
How Dependant ? Figure 1
Changes in Total GDP Energy and GDP
-10
0
10
20
30
40
19
82
19
84
19
86
19
88
19
90
19
92
19
94
19
96
19
98
20
00
20
02
20
04
20
06
years
%
-10
0
10
20
30
40
% change in GDP at Constant Prices
% Change in BOE
Source: Appendix Table A 1

Types of ‘fuel’
1. Foreign Direct Investment and behind this foreign technology and know how
2. Together with Foreign Demand and hence Prices
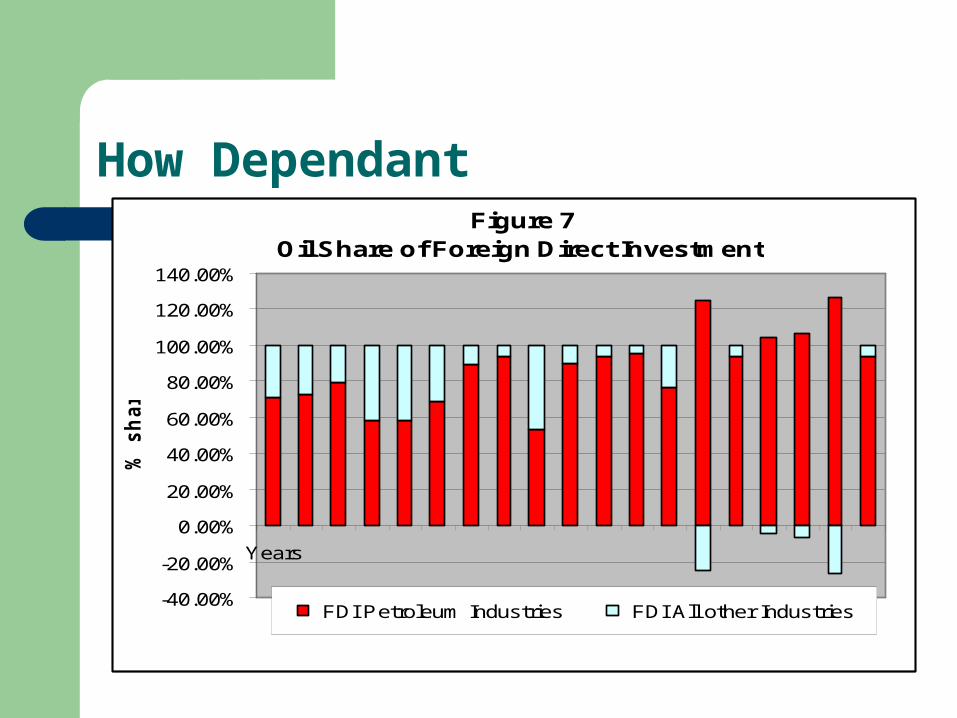
How Dependant Figure 7
Oil Share of Foreign Direct Investment
-40.00%
-20.00%
0.00%
20.00%
40.00%
60.00%
80.00%
100.00%
120.00%
140.00%
Years
% s
hare
FDI Petroleum Industries FDI All other Industries
Source: Appendix Table 4

Map of T&T Gas Market

Nominal Oil Prices: 1986-2008
0
20
40
60
80
100
120
86 87 88 89 90 91 92 93 94 95 96 97 98 99 0 1 2 3 4 5 6 7 8
Years
US
$/b
bl
Source: Appendix table 6

Real Oil pricesReal Oil Prices 1980-2008 ( 2006 dollars)
0.0
10.0
20.0
30.0
40.0
50.0
60.0
70.0
80.0
90.0
Years
US
$/b
bl.
Source: US EIA. Annual Energy Outlook 08

Rising Gas Prices Figure 6
US Natural Gas Prices 1994-08 ( Henry Hub) US$/MMbtu
0
2
4
6
8
10
12
94 95 96 97 98 99 0 1 2 3 4 5 6 7 8Years
US
$/M
Mb
tu
Source: Table 6

Methanol & Ammonia Prices
0
50
100
150
200
250
300
350
400
450
500
Years
US
$/T
on
ne
Ammonia Methanol

‘Clear-air’ Turbulence
US/Canada, Europe/OECD recession and with outside probability of a global depression as a result of:
A. the US financial crisis and its spread effects internationally;
B. Its coincidence with a US Pres. Elections and the role of partisan politics;
C. Fact that ‘greed’ has long overwhelmed regulation

Turbulence Within
‘Extremists’ on the ‘plane’ who threaten to ‘crash land’ it as a result of ‘Mr. Big’ and the drug lords and the impact of the space made available to them by : A. weaknesses in security system;
And B. failure to fully grasp and treat as an emergency the underlying neglect of communities and groups which create the substrate for guns, gangs and a culture of violence and death

Turbulence Ahead but on the ‘Radar’
Climate Change Ageing of the T&T Population exacerbated
by impact of HIV-AIDs on working age population now and to come
Decline in Reserves of Oil and natural Gas Inadequate National Savings in light of above
projected forms of turbulence and End of this hydrocarbon boom
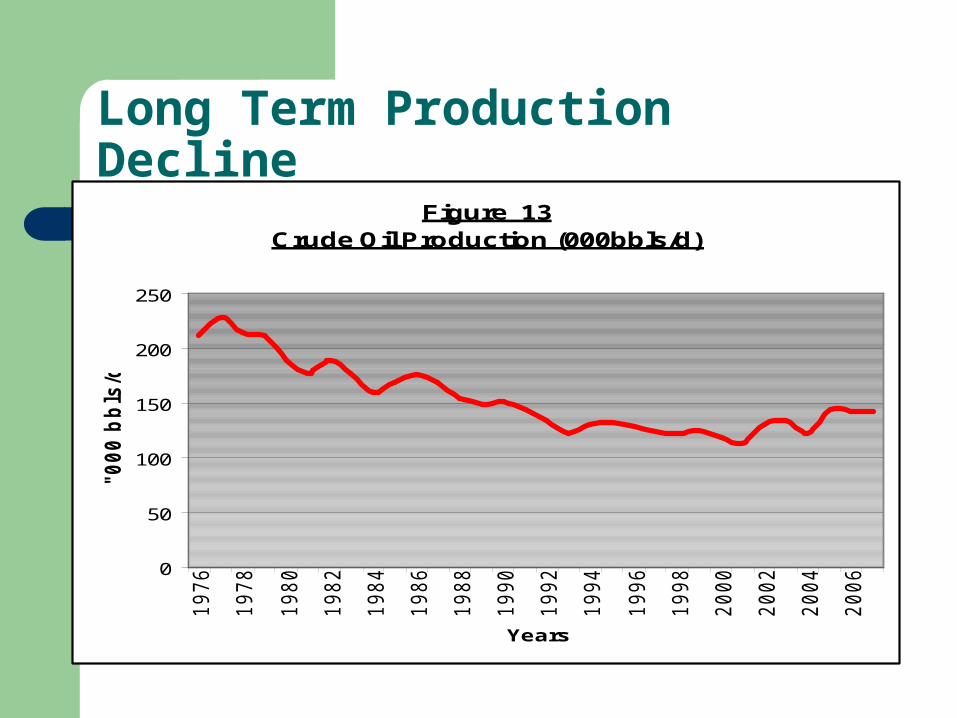
Long Term Production DeclineFigure 13
Crude Oil Production (000bbls/d)
0
50
100
150
200
250
1976
1978
1980
1982
1984
1986
1988
1990
1992
1994
1996
1998
2000
2002
2004
2006
Years
"000 b
bls
/day
Source Table A8

Oil Producers 2008 (YTD)Crude Oil Producers (2008 YTD)
Petrotrin44%
BP19%
BHP17%
Repsol10%
Others10%

Refinery Output Figure 14Refinery Product Slate ( 2006)
Gasoline 17%
Reg Gasoline7%
Unf Gas/Ref Feed6%
Kerosene11%
Gas Oil / Diesel23%
Fuel Oil 32%
Other 4%
Source: Petrotrin

Petrotrin Sales Figure 15
Petrotrin's Sales By Channel 2006
In'national31%
Non Caricom Extra Regional
25%
Local13%
Caricom 31%
Souce: Petrotrin

How Long?Figure 9
Crude Oil Proved Reserves and RTP ( 1976 - 2006)
0
200
400
600
800
1000
1200
Years
MM
bb
ls
0
5
10
15
20
25
ye
ars
Proved Reserves
RTP Years
Source: Appendix Table 7

Natural Gas DemandHistory & Projections(1965-2016)
0
200
400
600
800
1000
1200
1400
1600
1800
2000
1959 1962 1965 1968 1971 1974 1977 1980 1983 1986 1989 1992 1995 1998 2001 2004 2007 2010 2013 2016
Bcf
p.a
.
Total Gas Production
Total Consumption w /Lng
Total Consumption w /o Lng
Projected

Gas Reserves
1993 1996 2003 2007
Proven 8.2 12.3 20.76 17.05
Probable 4.6 3.7 8.12 7.76
Possible 1.1 2 5.85 6.23
Total 13.9 18 34.73 31.04
Source: http://www.ryderscott.com

Gas .How Long?Figure 10
Natural Gas Proved Reserves and RTP(1976-2006)
0.0
50.0
100.0
150.0
200.0
250.0
300.0
19
76
19
78
19
80
19
82
19
84
19
86
19
88
19
90
19
92
19
94
19
96
19
98
20
00
20
02
20
04
20
06
Years
Ye
ars
( R
TP
)
0.00
5.00
10.00
15.00
20.00
25.00
TC
F(R
es
erv
es
)
RTP YearsProved Reserves TCF
Source: Appendix Table 8

Oil and Gas RTP Compared
0
50
100
150
200
250
300
Years( Time)
Ga
s Y
ea
rs
( R
TP
)
0
5
10
15
20
25
Oil Y
ea
rs
( R
TP
)
Gas RTP
Oil RTP

Medium Term Demand Outlook
MmscfdExisting Projects 4000
New Projects( Inclusive of Train X) 1800
Total 6000
Do we have the resources to satisfy this level of demand over the next 20 years???

Gas Reserves discovery needed to maintain 12 year RTP
Optimal Depletion Scenario 4
0
1000
2000
3000
4000
5000
6000
7000
8000
Years
MM
SC
FD
23
23.5
24
24.5
25
25.5
26
26.5
27
TC
F
Total Demand Reserves
To maintain an RTP of say 12 years. The Optimistic Scenario requires reserves addition at rate of 2.27
TCF/yr to 2030. We need to find 50.6 TCF over the next 20 years!!!!!!

Inadequate Savings
Year US $million TT$ Million
Sept 2002 162.66 1015
Sept 2003 249.12 1566.9
Sept 2004 449.23 2830.2
Sept 2005 640.33 4034.1
Sept 2006 1354.13 8544.6
Sept2007 1,680.0 10,617.6
April 2008 1, 996 12,375.2
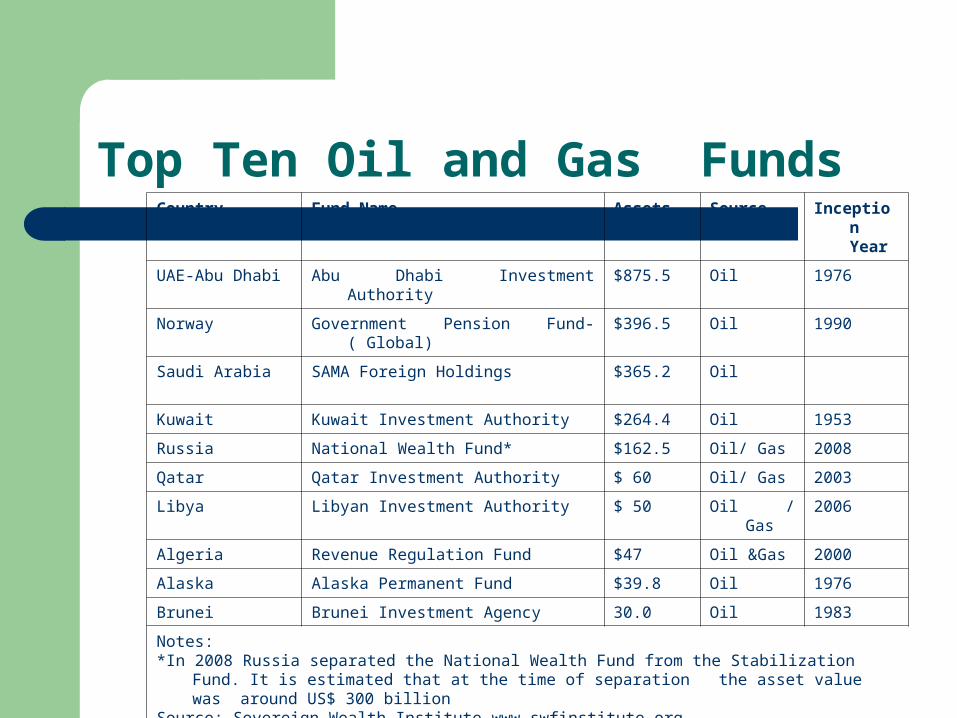
Country Fund Name AssetsUS$ B
Source Inception Year
UAE-Abu Dhabi Abu Dhabi Investment Authority $875.5 Oil 1976
Norway Government Pension Fund-( Global) $396.5 Oil 1990
Saudi Arabia SAMA Foreign Holdings $365.2 Oil
Kuwait Kuwait Investment Authority $264.4 Oil 1953
Russia National Wealth Fund* $162.5 Oil/ Gas 2008
Qatar Qatar Investment Authority $ 60 Oil/ Gas 2003
Libya Libyan Investment Authority $ 50 Oil / Gas 2006
Algeria Revenue Regulation Fund $47 Oil &Gas 2000
Alaska Alaska Permanent Fund $39.8 Oil 1976
Brunei Brunei Investment Agency 30.0 Oil 1983
Notes:*In 2008 Russia separated the National Wealth Fund from the Stabilization Fund. It is estimated that at the time of
separation the asset value was around US$ 300 billion Source: Sovereign Wealth Institute www.swfinstitute.org
Top Ten Oil and Gas Funds

Definitions in H&Stab Fund
Petroleum revenues means the aggregate of the supplemental petroleum tax, petroleum profits tax and royalties collected under the Petroleum Taxes Act .IT DOES NOT INCLUDE UNEMPLOYMENT LEVY, THE OIL IMPOST AND SIGNATURE BONUSES
Petroleum Business means the business of exploration for and the winning of petroleum and natural gas-IT DOES NOT INCLUDE THE LIQUEFACTION OF NATURAL GAS.

Rules of Withdrawal
Withdrawals may be made from the FUND when petroleum revenues collected in any financial year fall below the estimated petroleum revenues for that financial year by at least 10% -
Amount limited to – 60% of the amount of shortfall of petroleum
revenues for that year or – 25% of the credit balance of the FUND.

Rules of Withdrawal
No withdrawals may be made from the Fund in any financial year where the balance standing to the credit of the Fund would fall below US$ one (1) billion if such withdrawal were made.

Fund Update1
Board has approved an Investment Plan.– Short term investments- US/Treasury bills– Longer term US Fixed income securities– US./developed countries’ equities
First Audited Report submitted to Minister and Parliament
1. Source: Governor Central Bank speech to Rotary Club of POS – May 8 th 2008.

Proposals for Managing Turbulence
Revision of oil price forecast to US $40-45. Multi-stakeholder Advisory Group drawn
from business, labour, NGOs, the university together with Central Bank and public service technocracy with mandate to prepare ‘Turbulence’ preparedness plan;
All party Committee to draw up consensus plan based on report of Advisory Group