Challenges in Designing and Implementing Research and ...
12
Challenges in Designing and Implementing Research and Development Surveys in the Philippines Dalisay S. Maligalig, Maurice C. Borromeo, Ramoncito G. Cambel, Ronald R. Roldan, Jr., and Clifford B. Lesmoras Institute of Statistics, University of the Philippines Los Baños Abstract To spur technological innovation which is a proven driver of competitiveness for many countries, and consequently, of economic growth, research and development (R&D) needs to be strengthened. Policies that can stimulate R&D need to be formulated and monitored. Good quality data are needed for this purpose. Data on expenditures and personnel in R&D are important to identify areas that can be improved, to develop viable approaches in promoting R&D and to allocate the limited funds for R&D. These data, however, are not easily compiled because of the wide variety of institutions that are undertaking R&D – in business and industry, in the academe, in government and in civil society in general. The Department of Science and Technology (DOST) has been collecting R&D data through surveys administered to government agencies, higher education institutions and non-profit private institutions, while the Philippine Statistics Authority gathers R&D data from the business and industry sector. This paper discusses the challenges that are commonly experienced in conducting these surveys like non-coverage, nonresponse and measurement error. Examples of these issues will be discussed and viable solutions will be offered so that good quality data in R&D can be achieved. 1. Introduction Technological innovation, like the automobile, computer and mobile telephone have propelled the economic progress of countries that initiated their development and those that further enhanced them. These technologies and others, in general, were usually developed through research to improve efficiency and the quality of their outputs. Research and development (R&D), therefore, is an important driver of economic growth which should be cultivated for its positive impacts. Policies, projects and programs that enhance research and development need to be formulated and monitored. The government, as well as the private sector, would also need to allocate their resources so that their desired R&D levels can be achieved effectively. These resources are investments that, in the long term, are expected to result in further economic development. For these important tasks, policy makers need data on the level of expenditure on various types of research areas, the total number of different types of R&D personnel for evidence-based decision making which is proven to be effective. While expenditures can be captured from the accounting system and personnel data can be collected through the human resources office of an institution, specific data of this nature are not compiled in a single location. The responsibility for compiling R&D
Transcript of Challenges in Designing and Implementing Research and ...
Challenges in Designing and Implementing Research and Development Surveys in the Philippines Dalisay S. Maligalig, Maurice C. Borromeo, Ramoncito G. Cambel, Ronald R. Roldan, Jr., and Clifford B. Lesmoras Institute of Statistics, University of the Philippines Los Baños
Abstract
To spur technological innovation which is a proven driver of competitiveness for many countries, and consequently, of economic growth, research and development (R&D) needs to be strengthened. Policies that can stimulate R&D need to be formulated and monitored. Good quality data are needed for this purpose. Data on expenditures and personnel in R&D are important to identify areas that can be improved, to develop viable approaches in promoting R&D and to allocate the limited funds for R&D. These data, however, are not easily compiled because of the wide variety of institutions that are undertaking R&D – in business and industry, in the academe, in government and in civil society in general.
The Department of Science and Technology (DOST) has been collecting R&D data through surveys administered to government agencies, higher education institutions and non-profit private institutions, while the Philippine Statistics Authority gathers R&D data from the business and industry sector. This paper discusses the challenges that are commonly experienced in conducting these surveys like non-coverage, nonresponse and measurement error. Examples of these issues will be discussed and viable solutions will be offered so that good quality data in R&D can be achieved.
1. Introduction
Technological innovation, like the automobile, computer and mobile telephone have propelled the economic progress of countries that initiated their development and those that further enhanced them. These technologies and others, in general, were usually developed through research to improve efficiency and the quality of their outputs. Research and development (R&D), therefore, is an important driver of economic growth which should be cultivated for its positive impacts. Policies, projects and programs that enhance research and development need to be formulated and monitored. The government, as well as the private sector, would also need to allocate their resources so that their desired R&D levels can be achieved effectively. These resources are investments that, in the long term, are expected to result in further economic development. For these important tasks, policy makers need data on the level of expenditure on various types of research areas, the total number of different types of R&D personnel for evidence-based decision making which is proven to be effective.
While expenditures can be captured from the accounting system and personnel data can be collected through the human resources office of an institution, specific data of this nature are not compiled in a single location. The responsibility for compiling R&D

data may not also be well-defined within an institution and through the government hierarchy. Hence, the use of administrative records based on the accounting system and personnel records have not been explored well except when the Department of Science and Technology (DOST) started to conduct the Survey on Research and Development Expenditures and Personnel (R&D Surveys) in 2003 to collect R&D data specified above from government, higher education institutions and private non-profit institutions. The Philippine Statistics Authority (PSA), on the other hand, gathers R&D data from the business and industry sector through two questions in the Annual Survey of Philippine Business and Industry (ASPBI). DOST, using both the results of the R&D surveys that it conducts and those from ASPBI, provides estimates of total R&D expenditure and number of personnel in R&D at both the national and sub-national levels. These data items are used in estimating R&D indicators for crafting and monitoring R&D policies both at the country and sub-national levels, e.g., regions, sector and research areas. Therefore, it is important to collect good quality data in order to derive reliable indicators that would be used for decision making.
This year, the DOST commissioned the Institute of Statistics (INSTAT) of the University of the Philippines Los Baños (UPLB) to further improve the design and general operations of the R&D surveys. This paper describes the initial findings of the INSTAT project team that was assigned to undertake the research and implementation of the R&D Surveys.
Section 2 of this paper outlines the major challenges encountered in designing and implementing R&D surveys in the country. These challenges, together with brief reviews of current literature on the how they were addressed in developed countries that successfully conducted R&D surveys, are described in this section. Section 3 presents the various approaches that were considered by the INSTAT project team given the available limited resources, time and information. Section 4 presents the recommendations on how R&D stakeholders could promote science, technology and innovation and discusses opportunities for statistical research in the conduct of R&D surveys, or related topics.
2. The Challenges in the R&D Survey 2.1 Understanding the Target Population
The population units for the R&D Surveys include all institutions that perform in-house R&D in the country. To facilitate the collection, analysis and interpretation of the R&D data, these institutions are classified into four sectors: higher education, government, private non-profit, and business sectors. Figure 1 illustrates the flow of R&D funds. An institution can use its own funds, explore the possibility of getting government funding or private or foreign funds or other funds to conduct in-house R&D activities. Government agencies, higher education institutions (HEIs), private non-profit institutions, business and industry firms may conduct in-house research. To avoid duplication and/or confusion, the R&D Surveys cover only those that undertake in-house research. However, a question in the R&D Surveys is also included on whether the responding institution funds research or not.

Figure 1. Sectors involved in the funding and expending of research and
development budget
For the past survey rounds, DOST covered only higher education, government, and private non-profit institutions, while the PSA through the ASPBI collected the R&D data from the business and industry sector. The target population covered in the DOST R&D Surveys are limited only to the institutions in these three sectors that undertake in-house R&D activities. 2.2 The Sampling Frames
Institutions that undertake R&D differ in terms of business practice and functions depending on the sector to which they belong. A government agency would follow the government’s standard practice on accounting and personnel. On the other hand, HEIs act independently of each other. Some HEIs have centralized reporting system for research projects. Many have very decentralized system, with each academic unit having its own independent reckoning system. Similarly, for private non-profit institutions. Hence, it is prudent to design separate R&D surveys for each of these sectors.
So that results from the R&D surveys can be applied on the whole R&D populations, the R&D Surveys need to be designed as probability sample surveys. A necessary requirement in the design is the construction of a sampling frame that would ensure that each population unit has a chance of being included in the sample.
The construction of such sampling frames for the three sectors of the R&D surveys is quite challenging since there is no single data source for these sectors that can be used. While the list of government agencies is in the official website of the Government of the Philippines, the list does not identify the government agencies that have regional offices some of which could exercise independence in terms of conducting and funding R&D projects. For the higher education sector, although the Commission on Higher Education (CHED) maintains a list of all HEIs, it does not have information on which HEIs perform in-house R&D. Perhaps, a practicable but not full proof way, for identifying HEIs with R&D activities is by considering graduate enrolment size. HEIs with large graduate enrolment are more likely to have in-house R&D activities. Moreover, HEIs also have a wide variety
of accounting systems. Public HEIs, or what are referred to as state universities and colleges (SUCs), are funded by the government and thus, follow the government accounting rules, whereas, private HEIs have their own accounting systems. Private non-profit institutions, on the other hand, cannot be easily identified to undertake R&D activities since no comprehensive list that provides such information is available.
The cornerstone of a probability sample survey is a good sampling frame. In Singapore, for example, a register of institutions doing in-house R&D is maintained by conducting an annual preliminary survey of institutions that are not included in the register but potentially perform R&D. The preliminary survey also includes all institutions that received grants to undertake R&D from the government. 2.3 The Questionnaires
The questionnaire of the 2015 R&D survey, the most recent R&D survey round conducted by DOST, consists of the following sections: (1) definition of R&D, (2) enumeration of each R&D personnel and their profile, (3) enumeration of each project field of science and socio-economic objective, (4) enumeration of R&D personnel per project, (5) enumeration of projects being funded, (6) enumeration of published journal articles, and (7) definition of terms.
The questionnaires used in 2015 and in the other previous rounds were comprehensive and designed to collect very detailed data on each R&D personnel and on each of the R&D projects that are being performed by each responding institution. Because of the stringent data requirements, DOST had to exert extraordinary efforts to obtain the necessary information from institution respondents. Institutions with decentralized research project management system need to consolidate the answers of each research project leaders with regards to outputs, expenditures and personnel. Those with centralized accounting system, need to request that R&D expenditures be identified and compiled according to various types of expenditures (e.g. equipment, wages, etc.) In most cases, the information required to complete the R&D questionnaire need to be consolidated from various internal units and hence, would need substantial time and effort. The questionnaires were then reviewed for possible streamlining to reduce the response burden. The experience of other countries in this area was also considered in the review.
One of the major challenges in the R&D survey is to ensure that an appropriate and knowledgeable (and motivated) respondent will complete the questionnaire [6]. It is then recommended to identify in each responding institution a key person, to whom the questionnaire is sent, and assign a survey personnel who will assist the key person in accomplishing the questionnaire. R&D surveys for the universities and colleges attempt to eliminate the problem of unit nonresponse completely, by seeking 100 percent compliance from the universe of reporters [6]. Item nonresponse is also minimized by making it difficult to skip an item in a web-based report, or by encouraging reporters to estimate information when actual data are not available. However, the panel that reviewed the R&D Surveys in the US recommended the investigation of the impact of this practice on the overall quality of data. There is also a recommendation to have field observation staff visits to a sample of reporters to examine record-keeping practices and conduct research on how respondents fill out the forms.
Item nonresponse is a serious problem for the industry where many large companies refuse to participate in the survey due to company policies unless the survey

is mandatory [8]. On this issue, the panel recommended additional research on the effect of voluntary versus mandatory reporting of R&D expenditures and personnel. Additionally, it is recommended to set standards for the treatment of unit-nonresponse and require to computation of response rates prior to the determination of the final survey weights that will be used for analysis.
3. Meeting the Challenges 3.1 Constructing and Validating the Sampling Frames
Since separate surveys will be conducted for each of the three sectors covered, three sampling frames will also need to be constructed. There is no single data source for constructing these sampling frames; hence, online searches and data sets from various agencies were leveraged to complement the previous sampling frames to produce a draft list of institutions for each sector. The initial sampling frames that were used were the lists of respondents of the previous R&D surveys that were provided by DOST. These sampling frames for the sectors were then improved as follows:
i. Government -- Through searching online and visiting websites of various government agencies and offices, a list of government institutions was constructed with information about their head agency, head of the office, address, telephone number, and email address;
ii. Higher Education -- A list of HEIs for academic year 2017-2018 was obtained from CHED. The list, however, needs updating as some information like the head of institution are outdated and the contact information like the email address are missing for some HEIs especially for some of those satellite campuses. Moreover, new HEIs that were identified from online searches which are not found in the list were added while HEIs found to have ceased their operations were removed from the list. Updating the list was done by examining every HEI’s website and contacting them through emails and telephone calls;
iii. Private Non-profit -- A registry of NGOs found in the Philippine Council for NGO Certification (PCNC) website together with the list of PNPIs who responded in the previous survey round was used to construct an initial list of PNPIs. Institutions known to conduct R&D but are not part of the initial list e.g. International Rice Research Institute (IRRI) and Quantitative Aquatics, Inc. (Q-quatics) are also added in the list.
These constructed lists are not yet the desired sampling frames for the R&D survey
since not all listed institutions are known to perform R&D. It is for this reason that a double-phase survey will be implemented such that Phase 1 will be used to screen out institutions that do not conduct in-house R&D. The initial list constructed for each sector was used to launch the online Phase 1 survey, which aims to identify the institutions that performed in-house R&D in 2018. Moreover, information on which lower administrative units independently conduct R&D and the new head of the institution were also obtained for some responding institutions.
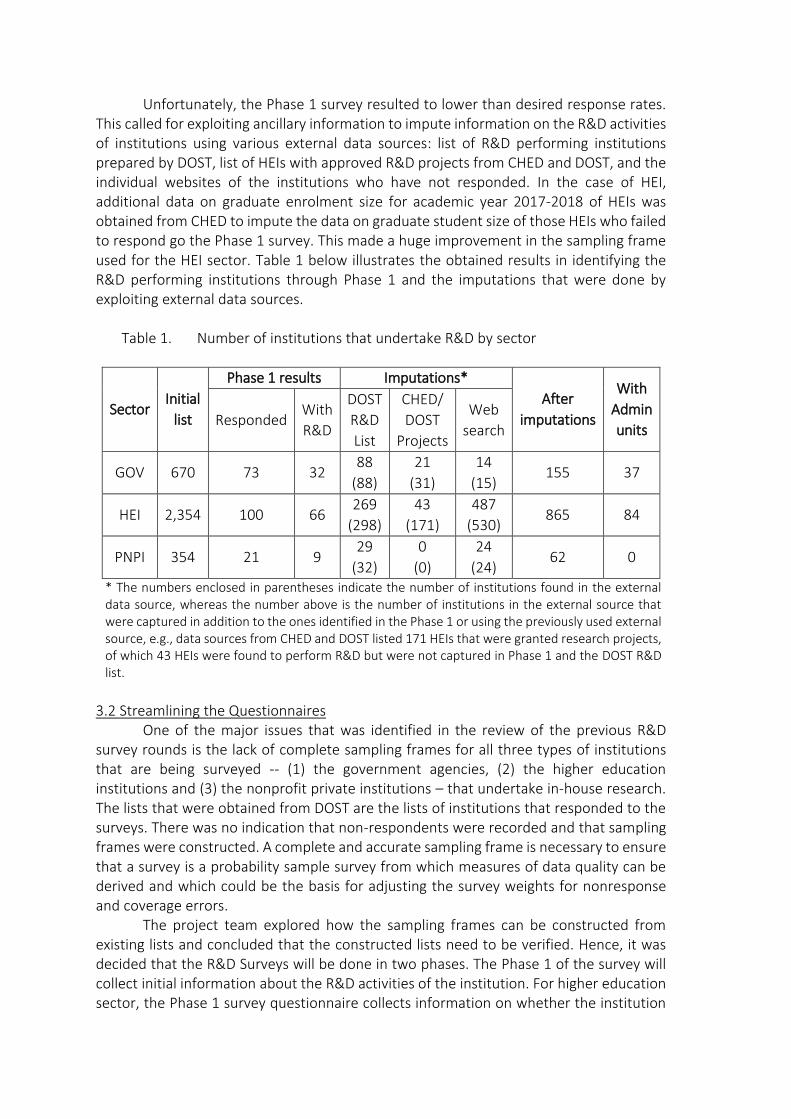
Unfortunately, the Phase 1 survey resulted to lower than desired response rates. This called for exploiting ancillary information to impute information on the R&D activities of institutions using various external data sources: list of R&D performing institutions prepared by DOST, list of HEIs with approved R&D projects from CHED and DOST, and the individual websites of the institutions who have not responded. In the case of HEI, additional data on graduate enrolment size for academic year 2017-2018 of HEIs was obtained from CHED to impute the data on graduate student size of those HEIs who failed to respond go the Phase 1 survey. This made a huge improvement in the sampling frame used for the HEI sector. Table 1 below illustrates the obtained results in identifying the R&D performing institutions through Phase 1 and the imputations that were done by exploiting external data sources. Table 1. Number of institutions that undertake R&D by sector
Sector Initial
list
Phase 1 results Imputations*
After
imputations
With
Admin
units Responded
With
R&D
DOST
R&D
List
CHED/
DOST
Projects
Web
search
GOV 670 73 32 88
(88)
21
(31)
14
(15) 155 37
HEI 2,354 100 66 269
(298)
43
(171)
487
(530) 865 84
PNPI 354 21 9 29
(32)
0
(0)
24
(24) 62 0
* The numbers enclosed in parentheses indicate the number of institutions found in the external data source, whereas the number above is the number of institutions in the external source that were captured in addition to the ones identified in the Phase 1 or using the previously used external source, e.g., data sources from CHED and DOST listed 171 HEIs that were granted research projects, of which 43 HEIs were found to perform R&D but were not captured in Phase 1 and the DOST R&D list.
3.2 Streamlining the Questionnaires
One of the major issues that was identified in the review of the previous R&D survey rounds is the lack of complete sampling frames for all three types of institutions that are being surveyed -- (1) the government agencies, (2) the higher education institutions and (3) the nonprofit private institutions – that undertake in-house research. The lists that were obtained from DOST are the lists of institutions that responded to the surveys. There was no indication that non-respondents were recorded and that sampling frames were constructed. A complete and accurate sampling frame is necessary to ensure that a survey is a probability sample survey from which measures of data quality can be derived and which could be the basis for adjusting the survey weights for nonresponse and coverage errors.
The project team explored how the sampling frames can be constructed from existing lists and concluded that the constructed lists need to be verified. Hence, it was decided that the R&D Surveys will be done in two phases. The Phase 1 of the survey will collect initial information about the R&D activities of the institution. For higher education sector, the Phase 1 survey questionnaire collects information on whether the institution

performs in-house R&D, the total number of graduate faculty and students and the identification of admin units and personnel who are most knowledgeable about their R&D activities. Information derived from Phase 1 also helped in updating the sampling frame and generating the stratification of HEI’s according to size of graduate students and faculty. For the government and private non-profit sectors, the Phase 1 survey questionnaire collects information on whether or not the institution performs in-house R&D, whether or not the institution fund other institutions for R&D activities, and the identification of administrative units (e.g. division, project teams, etc.) with the personnel who are most knowledgeable about R&D activities. In general, the information derived from the Phase 1 questionnaire and the records of the previous survey rounds will be the basis for identifying the target institutions in Phase 2.
The Phase 2 questionnaire collects the information needed to measure the R&D indicators. To measure these indicators appropriately, the proposed 2018 questionnaire aims to reduce the possible respondent’s burden and nonresponses in accomplishing the survey questionnaire. Using the observations on the questionnaire of other countries and recommendations in conducting the survey, the proposed changes of the survey questionnaire from the 2015 to 2018 are summarized in Table 2 below. Although there are changes in the questions, the data collected can still measure the R&D indicators measured during the past surveys. Table 2. Comparison of the R&D 2015 and 2018 questionnaires
2015 Questionnaire 2018 Questionnaire
Enumeration or listing of all Personnel and profile
Headcount of personnel according to type of personnel, sex, age group, highest qualification and field of science
Number of personnel by percent of time spent in R&D by occupation
Enumeration or listing of all research projects with their expenditure and source of funds
Total expenditures and their subcategories
Percentage of R&D expenditure to sources categories
Percentage of R&D expenditure per Socio-economic objectives and field of science
Enumeration of name of agency with R&D funded by the institution
Name of institution and total amount of funds provided to other institution for R&D
Enumeration of publish journals Total number of journals publish (local and international)
Collecting data regarding the head count of R&D personnel and disaggregating it
by sex is in line with the declaration in the 1995 World Conference on Women by the United Nations to make every effort to generate gender-disaggregated data for statistics of R&D personnel. This can also be used to support in gender analysis and gender mainstreaming.
The 2018 R&D survey questionnaire classifies the R&D personnel’s highest qualification following the standard classification set in the 2017 Philippine Standard Classification of Education (PSCED). This will ensure comparability of the classification of educational levels of the R&D personnel to the Philippine educational system and to other

official statistics. The PSCED has 9 levels of education, however, the R&D survey will combine the lowest three levels (Early childhood, Primary Education and Lower Secondary Education) as Lower Secondary Education and below. 3.3 Using Two-Phase Sampling Design
Since no sufficient auxiliary data is available to identify the target population, a two-phase sampling design (also called double-phase sampling) is employed. Under this design, the Phase 1 is a census of all institutions in the constructed sampling frames described in the previous section was conducted to identify the institutions in the various sectors that undertake in-house R&D activities. At the end of Phase 1 and some supplementary imputations using various external sources, a comprehensive list of R&D performing institutions is attained, which will serve as the sampling frame for the probability surveys that will be carried out in the next phase.
Varying sampling strategies were used for the different sectors in Phase 2. A census of all institutions will be gathered for the government and private non-profit sectors since the total numbers of institutions performing R&D in these sectors are small. Whereas, in the higher education sector, which is the largest sector, a stratified cluster sampling design is employed. The primary sampling units are the HEIs which were identified in the Phase 1 to undertake R&D activities in 2018. These institutions are then stratified according to the graduate student size. HEIs with have no data on enrolment size are classified in the unknown group. Hence, three strata are formed namely, small (size less than 1,000), large (size at least 1,000), and unknown. Institutions in the large stratum are selected with certainty, while probability samples of institutions in the small and unknown stratum are gathered. If simple random sample (SRS) will be used, the sample size 𝑛SRSwill be determined as
𝑛SRS =
𝑍𝛼 2⁄2 × 𝑃𝑄
𝑑2
1 +1𝑁 (
𝑍𝛼 2⁄2 × 𝑃𝑄
𝑑2− 1)
where 𝑍𝛼 2⁄ is the abscissa of the standard normal distribution given risk 𝛼/2;
𝑁 is the population size;
𝑃 is the proportion of the characteristic of interest;
𝑄 is the proportion of not having the characteristic of interest, i.e., 1 − 𝑃;
𝑑 is the margin of error.
With 𝑃 being unknown at this point, we choose its value to 𝑃 = 0.5 to obtain a
conservative sample size. Table 3 presents the tentative sample sizes for the small and unknown strata under varying confidence levels and values of margin error.

Table 3. Summary of tentative sample sizes computed for small (𝑁 = 363) and unknown strata (𝑁 = 447)
Stratum Level of
Confidence, 1−∝
Margin of Error, 𝒅
0.10 0.07 0.05 0.03 0.01
Small
0.95 77 128 187 272 350
0.975 94 151 211 289 353
0.99 115 176 235 304 356
Unknown
0.95 80 137 207 316 428
0.975 99 164 237 339 432
0.99 122 193 268 360 436
Choosing the sample sizes corresponding to smaller error level and higher level of
confidence is not practical as it would result in large sample sizes which would require bigger budgets and more time spent for the survey operation. On the other hand, sample sizes derived from larger error levels and lower levels of confidence make the sample sizes smaller but would make the estimates less precise. It was then decided to consider the sample size computed with a margin of error of 0.05 and a level of confidence of 0.95 as it would give greater balance between the resources and the precision of estimates to be obtained in this survey. The final sample size for each stratum was then proportionally allocated across the regions as shown in Table 4. Table 4. Sample size allocation per stratum across regions
Region
Stratum Total Sample,
𝒏 Large Small Unknown
𝑁𝑖 𝑛𝑖 𝑁𝑖 𝑛𝑖 𝑁𝑖 𝑛𝑖 01 - Ilocos Region 6 6 19 10 19 9 25
02 - Cagayan Valley 3 3 19 10 16 8 21
03 - Central Luzon 5 5 26 14 31 15 34
04A - CALABARZON 5 5 34 18 70 33 56
04B - MIMAROPA 0 0 12 7 40 19 26
05 - Bicol Region 1 1 22 12 28 13 26
06 - Western Visayas 3 3 39 21 47 22 46
07 - Central Visayas 5 5 26 14 27 13 32
08 - Eastern Visayas 3 3 18 10 23 11 24
09 -Zamboanga Peninsula 2 2 13 7 45 21 30
10 - Northern Mindanao 0 0 20 11 15 7 18
11 - Davao Region 3 3 16 9 16 8 20
12 - SOCCSKSARGEN 3 3 15 8 22 11 22
13 - Caraga 1 1 12 7 11 6 14
NCR 13 13 52 27 22 11 51
CAR 2 2 13 7 7 4 13
ARMM 0 0 7 4 8 4 8
Total 55 55 363 196 447 215 466

In generating estimates of total by sector of performance, both totals of the government and private non-profit sectors can be simply computed as the sum of the characteristic of interest since a complete enumeration of R&D performing institutions was implemented in Phase 2 survey. However in the survey among HEIs, information on the performance of R&D was collected in Phase 1, and then followed by the collection of R&D data in Phase 2 which involves a truncated sample from the previous phase. Ratio estimation can be well applied in this situation given that auxiliary information on the R&D performance can be used to improve the estimates of the R&D statistics and given that these two data are highly correlated to each other. The ratio can be estimated from the sampled HEIs with both data found in Phase 2 survey while the population total of the auxiliary information can be estimated from the Phase 1 survey data.
Aside from national estimates, sub-national estimates of total, i.e., estimates at lower levels of disaggregation, will also obtained using subclass analysis. This is done by setting 𝑤𝑖𝑗𝑘 = 0 for respondents not in the subgroup or by performing the summation
only for respondents in the subgroup. Variances of the survey estimates both national and subnational estimates will also be computed to assess their precision and robustness. Assessment of the statistical properties of estimates obtained from surveys are vital in determining whether to accept them as a useful evidence in policy making. Precise estimates are also desired to assure that they remain stable from a sample to another sample. Use of statistical software packages like SAS and Stat survey package will be used to aid in the computation of the estimates as well as their corresponding variances. 3.4 Implementing Multi-Mode R&D Surveys
Low participation rates have always persisted among R&D surveys because the nature of data gathered in these surveys is cumbersome to provide from the respondents’ perspective. Along with streamlining the questionnaire to reduce response burden, effective strategies in gathering data need to be implemented to obtain desirable results in the survey operations.
The R&D Surveys employed a combination of multiple survey modes in collecting data in both phases to improve the survey’s response rates. In Phase 1, an online version of the survey was first broadcasted through SurveyMonkey to those institutions with known contact email addresses. SurveyMonkey is an online platform that allows users to create surveys and send the questionnaires via email to target recipients. This platform allows the survey proponents to capture invalid email addresses in the sampling frames so appropriate actions on updating the contact details of institutions may be taken. Another advantage of using this platform is that, customized reminder emails may be drafted and after a fixed amount of time, automatically sent to the institutions who have not completely accomplished the questionnaire. SurveyMonkey, however, is limited to supporting select versions of internet browsers; some respondents have reported their inability to access the questionnaire. In which case, a soft copy of the questionnaire was emailed to them, with enclosed copies of the endorsement letter from DOST and the memorandum circular from CHED (for higher education institutions) regarding the R&D surveys. Institutions with unknown email addresses were also interviewed via telephone to gather the necessary data for Phase 1. After a month since the initial inquiry, telephone follow-ups were made on the institutions who have not responded to the survey to promote better participation. To facilitate time-efficiency in the telephone calls, at most

three attempts will only be made by the telephone enumerators. An institution will be considered a non-respondent if all three telephone calls fail for an institution.
The same standards of gathering data are also implemented in Phase 2 – online survey is first launched, and telephone follow-ups are conducted. In addition to these approaches, personal interviews are also carried out as final resort to enjoin the sampled institutions to participate in the survey. Workshops at various strategic sites across the country are held to train field enumerators in conducting the telephone interviews.
4. Conclusions and Recommendations
The major challenges have been addressed through application of sound statistical methods according to the standards of implementing R&D surveys, and the practices of other countries in their respective R&D Surveys. Comprehensive and updated sampling frames for the target population were constructed by combining available data sources from CHED, DOST and various websites. These sampling frames were validated through the implementation of a double-phase sampling design and the use of other external data sources. Questionnaires were streamlined to reduce the response burden without compromising the quality of information being collected. Combination of data collection modes – online survey, telephone follow-ups, and personal follow-ups – are expected to reduce survey costs while improving the response rates.
The R&D Phase 2 Surveys are still on-going and results have yet to be analyzed. Survey operations have not been completed and hence, the debriefing of interviewers and supervisors that could help identify possible measurement errors have yet to be accomplished.
To obtain a quantitative measure of errors, a small survey using a more detailed questionnaire similar to that of 2015 R&D Survey will be undertaken in early 2020 and compare to the current R&D Survey at each common sampled institution, to evaluate the effects of questionnaire streamlining. These analyses will further improve the design and implementation of future R&D Surveys.
To further upgrade the quality of R&D data, HEIs should be encouraged to keep a centralized information system that monitors the expenditures and personnel involved in research and development. This system can also help the management of R&D in the higher education sector. It does not need to be an elaborate and highly technical system but such that one can store data on R&D personnel and expenditure at the project level and at a regular frequency. This database can be the source of reports for the HEI management as well as for the DOST R&D Survey.
This year’s round of the R&D survey has provided many research opportunities for statisticians who are interested in the subject matter. Since the in-house R&D activities of some institutions cannot be determined with certainty as discussed in Section 2, the effect of the imputation methods using different external data on the sampling weights would be an interesting topic area of research. Two other topics for research are the development of alternative estimation procedures in between survey rounds and analysis of measurement errors for improving the questionnaire design and combination of survey modes.

References [1] DOST (2015). Compendium of Science and Technology Statistics (ISSN 2244-3614).
Retrieved from DOST Philippines website: http://www.dost.gov.ph/phocadownloa d/Downloads/Statistics/Compendium%20ST%20Statistics%20as%20of%20December%202015.pdf
[2] FAO (1997). Marketing Research and Information systems. Retrieved from
http://www.fao.org/3/W3241E/w3241e06.htm#TopOfPage [3] Lohr, S.L. (2010). Sampling: Design and Analysis. Second edition. Boston:
Brooks/Cole, Cengage Learning. [4] MOST (n.d.) Interviewing Guidelines Operations Manual. Retrieved from
http://most.ucsf.edu/docs/IntervGuidelines_v1.0p_06.01.13.pdf [5] OECD (2015). Frascati Manual: Guidelines for Collecting and Reporting Data on
Research and Experimental Development. Retrieved from http://www.uis.unesco. org/ScienceTechnology/Documents/oecd-frascati-manual.pdf
[6] National Research Council (2004). Measuring Research and Development
Expenditures in the US Economy. National Academies Press. [7] Singapore Agency for Science, Technology and Research. (2017). National Survey
of Research and Development 2016. Retrieved from https://www.a-star.edu.sg/ Portals/81/Data/News%20And%20Events/Publications/National%20Survey%20of%20R&D/Files/national-survey-of-research-development-singapore-2016.pdf
[8] UNESCO, Institute of Statistics (2014). Guide to Conducting an R&D Survey: For
countries starting to measure research and experimental development (Technical
Paper No. 11). Retrieved from http://uis.unesco.org/sites/default/files/document
s/guide-to-conducting-an-rd-survey-for-countries-starting-to-measure-research-a
nd-experimental-development-2014-en.pdf