Challenges in business analytics
16
Challenges in business analytics Mikl´ os Koren CEU @korenmiklos #ceubusinessanalytics Budapest BI Meetup
-
Upload
miklos-koren -
Category
Education
-
view
235 -
download
0
Transcript of Challenges in business analytics
Challenges in business analytics
Miklos KorenCEU
@korenmiklos#ceubusinessanalytics
Budapest BI Meetup
Analytics is hard
Analytics is hard
Insights from ”Enterprise Data Analysis and Visualization: AnInterview Study” (Kandel et al, 2012)
1

”I spend more than half of my time integrating, cleansing andtransforming data without doing any actual analysis.”
2

”In practice it tends not to be just data prep, you are learningabout the data at the same time, you are learning about what as-sumptions you can make.”
3

”We meet every week, we find some interesting insight, and we saythat’s great. There’s no repeatable knowledge, so we end uprepeating the process 1 year later.”
4
”It is really hard to know where the data is. We have all the data,but there is no huge schema where we can say this data is hereand this variable is there. ... It’s more like folklore. Knowledge istransmitted as you join.”
5
”Diversity is pretty important. A generalist is more valuable than aspecialist. A specialist isn’t fluid enough. We look for pretty broadskills and data passion.”
6
”Run a Hadoop job, then run a Hadoop job on results, then awkit... Hadoop job chained to Hadoop job chained to a Python scriptto actually process data.”
7

Why is analytics hard?
I Statistics is hard.
I People with different skills interact.
I Multiplicity of tools. (Natural for a fast evolving technology.)
I Implementing a business analytics project is subject to theeconomics of technology adoption.
I ”Hard” pays off (Strata survey 2013).
8

Why is analytics hard?
I Statistics is hard.
I People with different skills interact.
I Multiplicity of tools. (Natural for a fast evolving technology.)
I Implementing a business analytics project is subject to theeconomics of technology adoption.
I ”Hard” pays off (Strata survey 2013).
8
Hackers, scripters and users
Application UserScripterHacker
Analyti
csBiolo
gyData
martFin
ance
Finan
ceHea
lthca
reHea
lthca
reHea
lthca
reHea
lthca
reIns
uranc
eMark
eting
Marketi
ngNew
s Agg
regato
r
Retail
Retail
Social
Network
ing
Social
Network
ing
Social
Network
ing
Visualiz
ation
Visualiz
ation
WebWeb Analyti
csAna
lytics
Analyti
csFin
ance
Health
care
Media
Retail
Finan
ceIns
uranc
eReta
ilReta
ilSpo
rtsWeb
Securi
ty
DiscoveryLocating Data x x x x x x x x x x x x x x x x xField Definitions x x x x x x x x x x x x x x x x
Wrangle Data Integration x x x x x x x x x x x x x x x x x x x x x x xParsing Semi-Structued x x x x x x x x x x x x x x x x x x x x x x xAdvanced Aggregation and Filtering x x x x x x x x x x x x x x x x
Profile Data Quality x x x x x x x x x x x x x x x x x x x x x x x x x x x x x xVerifying Assumptions x x x x x x x x x x x x x x x x x x x x x x x x
Model Feature Selection x x x x x x x x x x x x x x x x x x x xScale x x x x x x x x x x x x x x x x x x x x x x x x x x x x x x xAdvanced Analytics x x x x x x x x x x x x x x
Report Communicating Assumptions x x x x x x x x x x x x x x x x xStatic Reports x x x x x x x x x x x x x x x x x
Workflow Data Migration x x x x x x x x x x x x x x x xOperationalizing Workflows x x x x x x x x x x x x x x x x
Database SQL x x x x x x x x x x x x x x x x x x x x x x x x x x xHadoop/Hive/Pig x x x x x x xMongoDB x xCustomDB x x x x x x x
Scripting Java x x x x x x x x x x x x xPerl x xPython x x x x x x x x x x x x x x xClojure xVisual Basic x x x
Modeling R x x x x x x x x x x x x x x x xMatlab x x x x x x xSAS x x x x xExcel x x x x x x x x x x x x x x x x x x x x x
Proc
ess
Tool
s
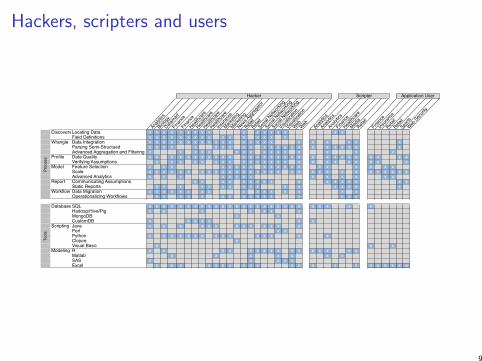
Fig. 1. Respondents, Challenges and Tools. The matrix displays interviewees (grouped by archetype and sector) and their corresponding chal-lenges and tools. Hackers faced the most diverse set of challenges, corresponding to the diversity of their workflows and toolset. Application usersand scripters typically relied on the IT team to perform certain tasks and therefore did not perceive them as challenges.
Hackers reported using a variety of tools for visualization, includ-ing statistical packages, Tableau, Excel, PowerPoint, D3, and Raphael.Six hackers viewed tools that produce interactive visualizations as re-porting tools and not exploratory analytics tools. Since they could notperform flexible data manipulation within visualization tools they onlyused these tools once they knew what story they wanted to tell with thedata.
4.1.2 ScriptersScripters performed most of their analysis within a software packagesuch as R or Matlab. They were able to perform simple manipulationssuch as filtering and aggregating data, but typically could not performcustom operations such as parsing log files or scraping data off theweb. They generally operated on data that had been pulled from thedata warehouse by IT staff and stored in an expected format. Some ofthese analysts could write simple SQL queries (e.g., without joins) topull data into their analytic tool of choice. In some cases, they werecomfortable writing scripts in a scripting language, but typically donot know how to create scripts that run at scale.
Scripters applied the most sophisticated models among the ana-lysts we observed. Advanced modeling was potentially enabled by thebreadth of libraries available for analytic packages and the percent-age of time these analysts devoted to modeling. The implementationand application of algorithms was more easily done when dealing withdata resident on one machine (as opposed to distributed). Scriptersoften produced visualizations using the statistical package during ex-ploratory analysis. Using the same tool for visualization and analysispermitted them to iterate fluidly between the two tasks. In some casesscripters used a separate tool, such as Tableau, to create interactivedashboards for reporting after the significant insights had been discov-ered.
4.1.3 Application UserThe last set of analysts performed almost all operations in a spread-sheet or other dedicated analysis application (e.g., SAS/JMP, SPSS,etc). Like scripters, they typically required someone to prepare datafor them by pulling it from the warehouse. One Excel user’s accountwas quite typical of most spreadsheet users:
All data is in a relational database. When I get it, it’s outof the database and into an Excel format that I can start
pivoting. I ask the IT team to pull it.
Application users typically worked on smaller data sets than theother groups and generally did not export data from the spreadsheetexcept for building reports. In some cases, advanced application userswrote scripts using an embedded language such as Visual Basic. Toproduce visualizations they typically created charts in Excel or ex-ported data to a reporting tool such as Crystal Reports.
4.2 Organization
Enterprise analysts work within the context of a larger organization.Political and social conventions within the organization can and doaffect the analysis process. We now discuss three recurring themes.
4.2.1 The Relationship between Analysts and IT Staff
Analysts often interacted closely with IT staff to complete aspects oftheir job. We observed that the IT team regularly provides four primaryfunctions in support of analysis. First, they often maintain data withina centralized warehouse. This maintenance includes ingesting newdata sources and ensuring quality across these sources. If an analystrequires new data in the warehouse, the analyst will often work withIT staff to communicate these requirements.
Second, the IT team assists analysts in acquiring data. Analysts,especially application users and scripters, rely on IT staff to query datafrom the warehouse and export it in an accessible format. For instance,12 analysts reported having the IT team write SQL queries and convertthe output to delimited files or spreadsheets.
Third, the IT team is responsible for operationalizing recurringworkflows. One analyst at a media company described the workflowshe built as “prototypes”. After experimenting with samples of data, theanalyst would send a high-level description of the workflow steps —written in English — to IT staff. IT staff then implemented the processto run reliably and at scale. Even hackers relied on IT staff to oper-ationalize tasks that were critical to other business units or had chal-lenging scalability requirements. For example, one analyst at a hedgefund required the IT team to operationalize his workflows to achievelow-latency for high-frequency trading.
Finally, the IT team serves as a source of documentation. Even ana-lysts comfortable writing complex SQL and Hadoop jobs often requireIT staff to help find the appropriate data and understand its structure
9

Data scientists using more tools are paid more
9. Salary figures are for US respondents only.
number of tools. Median base salary is constant at $100k for thoseusing up to 10 tools, but increases with new tools after that.9
Given the two patterns we have just examined—the relationships be‐tween cluster tools and respondents’ overall tool counts, and betweentool counts and salary—it should not be surprising that there is a sig‐nificant difference in how each cluster correlates with salary. Usingmore tools from the Hadoop cluster correlates positively with salary,while using more tools from the SQL/Excel cluster correlates (slightly)negatively with salary.
12 | 2013 Data Science Salary Survey
10

This calls for an interdisciplinary approach
This calls for an interdisciplinary approach
Our new program puts equal weight on
1. statistics,
2. economics,
3. management,
4. and technology.
11
Program highlights
I U.S. accredited M.Sc. degree (”felnottkepzes” in progress)
I 1-year program, full time or part time
I 10 core courses and many electives
I Final analytics project
I Industry partners: IBM, Clementine Consulting, ...
12