Challenges and p rospects of teaching the Doppler...
164
Challenges and prospects of teaching the Doppler Effect at grade 12 By Sure Mupezeni Submitted in accordance with the requirements for the degree of Master of Science in Mathematics, Science and Technology Education in the subject Physics Education at the UNIVERSITY OF SOUTH AFRICA Supervisor: Prof. J. Kriek FEBRUARY 2012
Transcript of Challenges and p rospects of teaching the Doppler...

Challenges and prospects of teaching the Doppler Effect at grade 12
By
Sure Mupezeni
Submitted in accordance with the requirements for the degree of
Master of Science in Mathematics, Science and Technology Education
in the subject
Physics Education
at the
UNIVERSITY OF SOUTH AFRICA
Supervisor: Prof. J. Kriek
FEBRUARY 2012

ii
STUDENT NUMBER: 4550-392-3
DECLARATION
I declare that Challenges and prospects of teaching the Doppler Effect at grade 12 is my
own work and that all the sources that I have used or quoted have been indicated and
acknowledged by means of complete references.
........................................................................ .............................
SIGNATURE DATE
(SURE MUPEZENI)

iii
ACKNOWLEDGEMENTS
Firstly I would like to give praise to my God Jehovah for enabling me to complete this
study.
Secondly, I would like to thank the following people:
• My Supervisor Prof. Jeanne Kriek for her constructive support and supervision
throughout the study. Your support is highly appreciated.
• Members of my family; my wife Olipha, my children Pontianos, Piedad
Gugulethu, Verdad, Belkis, Musawenkosi for being supportive and loving.
• The District Senior Manager and Circuit Managers of the Department of
Education Vhembe District, Limpopo Province.
• The Subject Advisors, Principals, Physical Science Teachers of the schools
where the research was conducted.
• All the learners who have participated in this study.

iv
ABSTRACT
This study focuses on challenges and prospects of the teaching of the Doppler Effect
to grade 12 learners. The challenges of teaching the Doppler Effect were established
and these findings influenced the development of activities. These activities were
tested, refined and re-tested in an iterative cycle and finally provided prospects on
teaching the Doppler Effect. Educational Design Research (EDR) was used to bridge
theory and practice in education.
This study was done in the Vhembe district in the Limpopo province. In the first
cycle, questionnaires and interviews with 32 teachers and a subject advisor were
used to establish the baseline with regards to the challenges of teaching the Doppler
Effect. After the analysis of the data which forms the first cycle of EDR, the content
and methodological problems faced by teachers when teaching the Doppler Effect
were revealed.
In the second cycle of the EDR, learning activities were developed that was informed
by the analysis and tried out in 2 schools by learners and their teachers. Completed
activity sheets were marked and the results were used to determine if there were a
correlation between the activity sheets and the written test. Problems were
documented and changes to the activities were again made and tried out in 10
schools by 216 learners with the help of 10 teachers. The data collected from the
learners` work sheets were analysed. Pearson`s product moment correlation has
shown that there is a statistically significant relationship (r = 0.65; p < 0.01) that
exists between these design-research activities and solving of problems on the
Doppler Effect.
An instructional manual was developed comprising of the final activities. This was
distributed amongst the district officials and teachers to assist them in the teaching of
the Doppler Effect in the Vhembe district.

v
Key terms
Grade 12-curriculum, educational design research activities, physics, Doppler Effect,
teaching-approaches
1
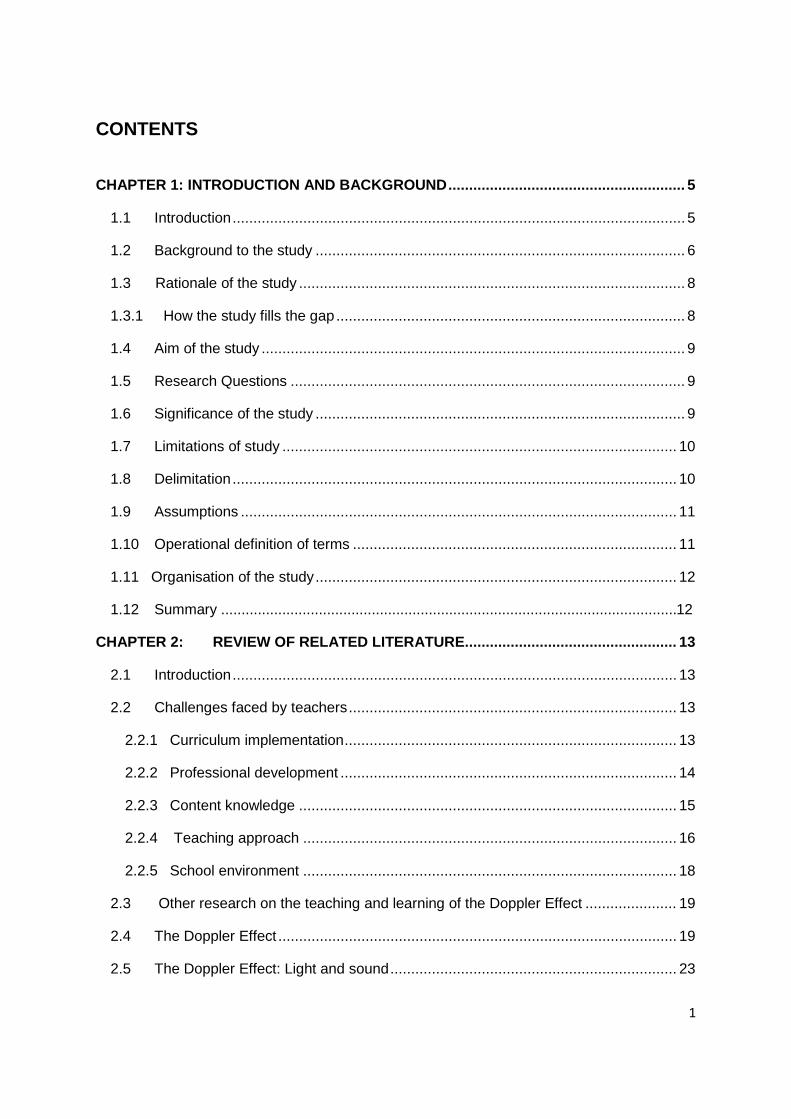
CONTENTS
CHAPTER 1: INTRODUCTION AND BACKGROUND ......................................................... 5
1.1 Introduction ............................................................................................................. 5
1.2 Background to the study ......................................................................................... 6
1.3 Rationale of the study ............................................................................................. 8
1.3.1 How the study fills the gap .................................................................................... 8
1.4 Aim of the study ...................................................................................................... 9
1.5 Research Questions ............................................................................................... 9
1.6 Significance of the study ......................................................................................... 9
1.7 Limitations of study ............................................................................................... 10
1.8 Delimitation ........................................................................................................... 10
1.9 Assumptions ......................................................................................................... 11
1.10 Operational definition of terms .............................................................................. 11
1.11 Organisation of the study ....................................................................................... 12
1.12 Summary ................................................................................................................12
CHAPTER 2: REVIEW OF RELATED LITERATURE................................................... 13
2.1 Introduction ........................................................................................................... 13
2.2 Challenges faced by teachers ............................................................................... 13
2.2.1 Curriculum implementation ................................................................................ 13
2.2.2 Professional development ................................................................................. 14
2.2.3 Content knowledge ........................................................................................... 15
2.2.4 Teaching approach .......................................................................................... 16
2.2.5 School environment .......................................................................................... 18
2.3 Other research on the teaching and learning of the Doppler Effect ...................... 19
2.4 The Doppler Effect ................................................................................................ 19
2.5 The Doppler Effect: Light and sound ..................................................................... 23

2
2.6 Theoretical Framework ......................................................................................... 24
2.7 Summary ............................................................................................................. 27
CHAPTER 3: RESEARCH METHODOLOGY ............................................................. 28
3.1 Introduction ........................................................................................................... 28
3.2 Research Design .................................................................................................. 28
3.3 Research population and sample .......................................................................... 28
3.4 Instruments .......................................................................................................... 29
3.4.1 Questionnaires .............................................................................................. 30
3.4.2 Interview ....................................................................................................... 32
3.4.3 Activity sheets ............................................................................................... 33
3.4.4 Tests ............................................................................................................. 33
3.5 Methodology ......................................................................................................... 34
3.6 Development of Doppler Effect activities ............................................................... 38
3.7 The advantages of using Educational Design Research ....................................... 40
3.8 Data analysis ........................................................................................................ 41
3.9 Ethical considerations ........................................................................................... 42
3.9.1 Official permission ............................................................................................... 42
3.9.2 Subject Advisor, teachers and learners. .............................................................. 43
3.10 Summary ................................................................................................................43
CHAPTER 4: PRESENTATION AND ANALYSIS OF DATA ....................................... 44
4.1 Overview...................... ......................................................................................... 44
4.2 Phase 1: Results and analysis of the questionnaire for teachers........................... 44
4.3 Phase 1: Results and analysis of interview with the subject advisor ...................... 61
4.4 Phase 2: Results and analysis of activity sheets and test...................................... 61
4.5 Phase 3: Results and analysis of learner and teacher interviews .......................... 67
4.6 Summary of findings ............................................................................................. 68
4.7 Summary ................................................................................................................71
4.8 Projection for the next chapter ............................................................................. 71

3
CHAPTER 5: DISCUSSIONS AND CONCLUSIONS ................................................... 72
5.1 Introduction ........................................................................................................... 72
5.2 Summary. ............................................................................................................. 72
5.3 Conclusions .......................................................................................................... 74
5.4 Discussion ............................................................................................................ 75
5.5 Recommendations ................................................................................................ 76
5.6 Concluding words ................................................................................................. 77
REFERENCES ................................................................................................................... 78
APPENDICES..................................................................................................................... 90
Appendix 1: Questionnaire for Teachers ................................................................. 90
Appendix 2: Interview schedule: Physical Science Subject Advisor ........................ 96
Appendix 3: Lesson on Doppler Effect ..................................................................... 97
Lesson 1 ................................................................................................................97
Appendix 4: Slinky ................................................................................................. 102
Appendix 5: Eyedropper ....................................................................................... 103
Appendix 6: Bicycle .............................................................................................. 105
Appendix 7: Grid code for computer SPSS data analysis ....................................... 107
Appendix 8: Codes used in SPSS computer software for responses for the teachers` questionnaire ...................................................................... 109
Appendix 9: Application letter for permission to conduct study ............................. 116
Appendix 10 A: Permission letter to conduct the study................................................ 117
Appendix 10 B: Ethical clearance letter ....................................................................... 118
Appendix 11: Verbatim analysis of the interview with the subject advisor ................. 119
Appendix 12: Test on Doppler Effect Calculations .................................................... 121
Lesson 2: Calculations on the Doppler Effect ...................................................... 121
Appendix 13: Correlation .......................................................................................... 126
Appendix 14: Interview questions for teachers and learners after the Lesson .......... 128
Appendix 15: SPSS statistical analysis of teachers’ questionnaire .......................... 129

4
LIST OF ABBREVIATIONS
ACE - Advanced Certificate in Education
ASEI - Activity, Student, Experiment, Improvisation
CAPS - Curriculum and Assessment Policy Statement
DOE - Department of Education
EDR - Education Design Research
FET - Further Education and Training (i.e. grade 9, 10 & 12)
LO - Learning Outcome
MLA - Mastery Learning Approach
NCS - National Curriculum Statement
OBE - Outcomes-based Education
PDSI - Plan, Do, See, Improve
RNCS - Revised National Curriculum Statement
RSA - Republic of South Africa
SET - Science, Engineering and Technology
SPSS - Statistical Package for Social Sciences
UNESCO - The United Nations, Scientific and Cultural Organisation
UNISA - University of South Africa

5
CHAPTER 1: INTRODUCTION AND BACKGROUND
1.1 Introduction
Applications of the Doppler Effect are apparent in everyday life. The distinct change
in the sound of a siren of an ambulance or fire truck is heard; while the ambulance
approaches the pitch of the siren is relatively high but as the ambulance passes and
moves away the pitch suddenly drops. The Doppler Effect is used in speed traps to
measure the velocity of detected vehicles by traffic officers. It is also applied in
medicine. An echocardiogram produce an assessment of the direction of blood flow
and the velocity of blood and cardiac tissue at any point in a human body using the
Doppler Effect. The measurement of blood flow rate in veins and arteries based on
the Doppler Effect is used for diagnosis of vascular problems like stenosis. In
astronomy, the Doppler Effect for light has helped scientists in realising that the
universe is expanding.
The Doppler Effect is one of the topics in the grade 12 physical science curriculum
(Department of Education, 2003, p 41). The physical science curriculum does not
only indicate what content has to be taught but describes knowledge, skills and
values that learners should acquire by the end of the Further Education and Training
band (FET) by means of Learning Outcomes (LO). The three learning outcomes are
stated below (Department of Education, 2003, pp 13-14).
LO1 The learner is able to use process skills, critical thinking, scientific
reasoning and strategies to investigate and solve problems in a variety
of scientific, technological, environmental and everyday contexts.
LO2 The learner is able to state, explain, interpret and evaluate
scientific and technological knowledge and can apply it in everyday
contexts.
LO3 The learner is able to identify and critically evaluate scientific
knowledge claims and the impact of this knowledge on the quality of
socio-economic, environmental and human development.

6
The topic Doppler Effect is also included in the new curriculum, the Curriculum and
Assessment Policy Statement (CAPS), (Department of Education (DOE), 2010) that
will be implemented for the first time in 2012 starting with Grade 10. The CAPS was
developed for each subject to replace Subject Statements, Learning Programme
Guidelines and Subject Assessment Guidelines in Grades R - 12. The general aims
of the South African Curriculum are explained in the National Curriculum Statement
(NCS) Grades R-12 which includes the three LOs.
Teachers faced challenges in teaching the Doppler Effect (Flick, 1993; Makgato &
Mjii, 2006). The main challenges faced by teachers were lack of content knowledge
on the topic, inadequate text books and science equipment (Department of
Education, 2008). In order to address these challenges, activities were developed for
use when teaching the topic, making use of demonstrations with locally available
materials.
1.2 Background to the study
The challenges faced by teachers have had an effect in the performance of learners
in their final examinations. The final marks for grade 12 comprises of 75%
examination mark and 25% tests and practical investigations (Department of
Education, 2003). The performance of learners in physical science at grade 12 in
South Africa has been poor. The study was carried out in Limpopo province because
the researcher is working in a secondary school in this province and it was easier to
carry out the research. Table 1 show the percentages indicating learners in South
Africa who achieved marks of 30% and above, 30% is being considered because it is
a pass mark for mathematics and physical science in South Africa (Department of
Education, 2011).
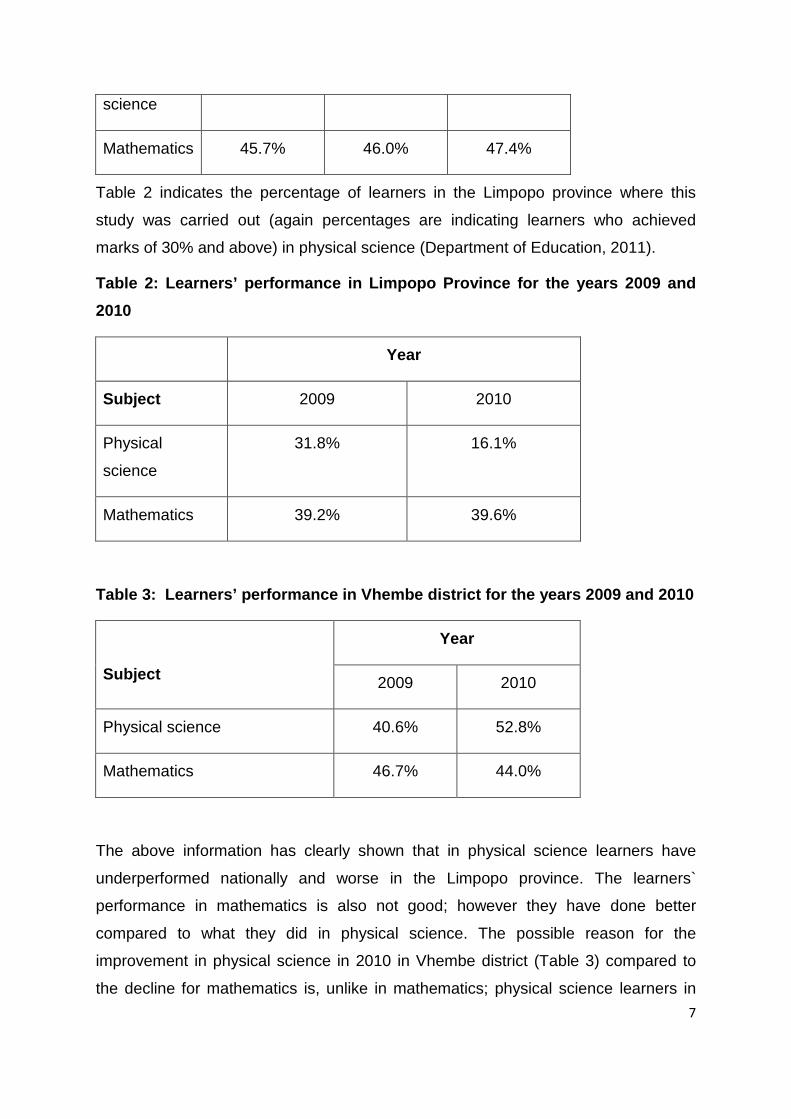
Table 1: Learners’ performance in South Africa for the years 2008, 2009 and 2010
Year
Subject 2008 2009 2010
Physical 54.9% 36.8% 47.8%
7
science
Mathematics 45.7% 46.0% 47.4%
Table 2 indicates the percentage of learners in the Limpopo province where this
study was carried out (again percentages are indicating learners who achieved
marks of 30% and above) in physical science (Department of Education, 2011).
Table 2: Learners’ performance in Limpopo Province for the years 2009 and 2010
Year
Subject 2009 2010
Physical
science
31.8% 16.1%
Mathematics 39.2% 39.6%
Table 3: Learners’ performance in Vhembe district for the years 2009 and 2010
Subject
Year
2009 2010
Physical science 40.6% 52.8%
Mathematics 46.7% 44.0%
The above information has clearly shown that in physical science learners have
underperformed nationally and worse in the Limpopo province. The learners`
performance in mathematics is also not good; however they have done better
compared to what they did in physical science. The possible reason for the
improvement in physical science in 2010 in Vhembe district (Table 3) compared to
the decline for mathematics is, unlike in mathematics; physical science learners in

8
the district were given common tests throughout the year, and these tests were
covering all the learning outcomes of the subject, as a result learners had
appropriate practice before they wrote their final examinations.
In Limpopo, the 2009 mathematics matric examination results were better than the
results for physical science by 7.4% and in 2010 physical science were out
performed by 23.5% (Table 2).
1.3 Rationale of the study
Two factors contributed towards the motivation of this study.
Firstly, there are no published research studies on the teaching and learning of the
Doppler Effect in grade 12 in Vhembe district of Limpopo province. Secondly, the
topic offers learners scientific reasoning and strategies to investigate and solve
problems learners encounter in everyday contexts. This poses a challenge in the
understanding of the Doppler Effect (Flick, 1993) by learners since some teachers do
not use experiments or demonstrations when teaching physical science (Rapudi,
2004).
1.3.1 How the study fills the gap
The South African government stipulates policy on curriculum and assessment in the
schooling sector by means of its National Curriculum Statement Grades R-12 (NCS).
The NCS learning outcomes (paragraph 1.1) outlines that the learner should be able
to explain, interpret, evaluate scientific and the technological knowledge and apply it
in everyday experiences. On daily basis learners are encountering the Doppler Effect
phenomenon but some might not be aware of it. This study attempts to show that
science is not detached from our daily life; we use science and apply scientific
methods daily at times not knowing it.
The first LO is addressed when learners performed the activities during the lesson
and applied and constructed knowledge. The second LO is achieved when the
learners stated, explained and interpreted the phenomena of the Doppler Effect. The
third LO was addressed when the learners did the activity using a bicycle and a cell
phone; this helped them to understand how science relates to their everyday lives. In
addition, the learners need to critically evaluate the impact of scientific knowledge on
the environment and human development to link the theory and practice. Therefore,

9
the Doppler Effect topic could provide the learner the opportunity to address all three
learning outcomes.
1.4 Aim of the study The aim of this study was to investigate the challenges of teaching the Doppler
Effect to grade 12 learners in Vhembe district. In order to address these challenges,
activities were developed and tried out in classrooms, laboratories and outdoors.
The main thrust of the study was to investigate the challenges and the prospects of
teaching the Doppler Effect at grade 12. This was achieved by:
1. Establishing a baseline to identify the challenges that the teachers have when
teaching the topic Doppler Effect to grade 12 learners.
2. Developing and evaluating activities to teach the Doppler Effect to grade 12
learners in different schools in the Vhembe district.
1.5 Research Questions
This study was guided by the need to identify and possibly address the challenges
that the teachers have when teaching the topic Doppler Effect to grade 12 learners.
Therefore the research questions are phrased as:
1. Which aspects of the topic Doppler Effect do the teachers find challenging?
a. What are the challenges identified by the teachers in terms of content
knowledge when teaching the Doppler Effect to grade 12 learners?
b. What are the challenges identified by the teachers in terms of teaching
approaches when teaching the Doppler Effect to grade 12 learners?
2. What is the effectiveness of teaching the Doppler Effect using developed learner-centred activities?
1.6 Significance of the study
The objective of physical science (grade 10-12) is to advance knowledge and skills
in scientific inquiry and problem solving during written tests, to construct and apply
scientific and technological knowledge and understand the nature of science and its
relationship to technology, society and the environment (Department of Education,
2010). Using Educational Design Research (EDR) this study investigated the
development and evaluation of activities that enable learners to predict, interpret and
explain their observations. The learners were able to manipulate equipment making

10
decisions using critical and creative thinking. Learners were encouraged to use
science equipment effectively showing responsibility towards the environment and
the well being of other learners by being resourceful and collaborative. The
developed activities could have implications for the effective preparation and
continuous support of teachers. Substantial information on the Doppler Effect is
provided in the instructional manual to improve on the teacher effectiveness by
increasing teacher content knowledge and suggesting an alternative teaching
method. The new suggestion in the CAPS document is that teachers have to do one
practical activity per term, and this could be a practical guideline on how to carry out
the practicum related to the Doppler Effect.
1.7 Limitations of study
Due to the possibility of respondents to answer dishonestly, results might not
accurately reflect the opinions of all members of the chosen sample. The sample
was small because it was chosen from one district only and the schools` proximity to
each other reduced transport costs during the distribution and collection of
questionnaires and so generalisation is not justifiable. This kind of study has been
done only in the Vhembe district of the Limpopo province. The 10 schools were
purposefully chosen for the study and the sample was too small to justify general
conclusions. These limitations show the limited nature of the research as reported in
this study but this should not be construed as a weakness in the research design.
1.8 Delimitation
People do not want to answer many written long questions, so to ensure maximum
return of survey instruments and manageability of collected data, the instruments
used were mostly multiple-choice items and a few open-ended response items. The
English language used in the activity sheets for learners was simple and straight
forward without double meaning making it easy for learners to understand, as
indicated in the pilot stage. There were a large number of potential participants in the
study population; however the study did focus on members located within
Thohoyandou cluster of schools, in Thohoyandou, Limpopo province, South Africa,
and purposeful samples of 32 teachers and 10 schools were chosen.
Thohoyandou cluster of schools falls under the Vhembe district.
11
1.9 Assumptions
It was assumed that the teachers and the subject advisor answered all questions
honestly and to the best of their abilities. Since the teachers were trained on how to
carry-out the activities earlier, it is assumed that the test papers and activity sheets
were not leaked.
1.10 Operational definition of terms The following operational definitions are applicable to the study:
The Doppler Effect: Suppose a learner stands beside a road while an ambulance
passes by at high speed sounding its siren. As the ambulance approaches, it
produces a sound with high frequency, and when it passes by, the frequency heard
drops significantly. The frequency of the sound heard by the learner is much higher
while the ambulance was approaching, than while it was moving away. This
phenomenon is called the Doppler Effect.
Educational design research activities: These are developed practical activities
which have the aim of solving a practical problem and to advance our knowledge,
the designed product is refined until an acceptable product is made which can be
adopted elsewhere (Barab & Squire, 2004).
Professional development: The individual teacher is responsible for his/her lifelong
career advancement and this includes “those processes that improve the job-related
knowledge, skills, or attitudes of school employees” (Sparks & Loucks-Horsley
(1990) as cited by Kriek, 2005).
Teaching approach: Teaching approaches refer to teaching strategies, ways of
conducting instructional activities and techniques that are used by teachers to
achieve their teaching objectives.
Curriculum: This refers to the plan for learning which focuses on rationale, aims,
objectives and content, striving to enable all learners to reach their maximum
learning potential by setting the learning outcomes to be achieved by the end of the
educational process (Department of Education, 2003).

12
1.11 Organisation of the study
i. Chapter one presents the introduction, background rational and aim of the
study. The research questions are presented as well as the significance of
the study, limitations and delimitations of the study.
ii. Chapter two gives a summary of the review of related literature and presents
other research related to challenges and prospects of teaching physical
science as well as the theoretical framework.
iii. Chapter three focuses on the research design, the study population,
instruments, the validity and reliability of the instruments, the methodology,
data collection, and ethical considerations.
iv. The collected data, data analysis and the findings are presented in chapter
four.
v. Chapter five provides the summary of the study, conclusions, discussions,
recommendations and concluding remarks.
1.12 Summary
The study`s orientation was established in this chapter. The background, the
rationale, aim of the study and the research questions were presented. In addition,
the significance of the study was discussed.

13
CHAPTER 2: REVIEW OF RELATED LITERATURE
2.1 Introduction
This chapter provides a review of literature related to the challenges and prospects
in teaching Physics at Secondary School level, and the teaching of the Doppler
Effect in particular. This study was carried out with the purpose of filling a gap, by
means of designing an instructional manual for grade 12 learners on the Doppler
Effect comprising of activities addressing all three learning outcomes simultaneously
as stated in the FET physical science curriculum.
2.2 Challenges faced by teachers
Physics is a conceptually demanding subject and teachers need to improve their
learners` scientific language so that they may be able to communicate and learn
science (Angell, Guttersrud, Henriksen, & Isnes, 2004; Lemke, 1990; Osborne,
1996). Teachers face challenges in teaching the Doppler Effect (Flick, 1993) and this
could be because it is an abstract science concept. Other challenges faced by
teachers when teaching have been itemised such as curriculum implementation,
professional development, content knowledge, teaching approach, and school
environment (Grossman, 1990; Kriek & Basson, 2008; Kriek & Grayson, 2009;
Shulman, 1987).
2.2.1 Curriculum implementation
Educational authorities in South Africa have been occupied with reforming the
national curriculum for schools (Department of Education, 1997) since the mid
nineties. The background to the changes that took place in the education system
over the past few years was enlightened by (Lombard & Grosser, 2008):
“Recent reforms of the South African educational system which
were characterized by the ideals that the country needs to
produce independent, critical thinkers who are able to question,
weigh evidence, make informed judgments and accept the
incomplete nature of knowledge (Republic of South Africa (RSA),
1995, p 22). As a result, an OBE curriculum was introduced in

14
schools from 1998 — initially by means of Curriculum 2005
(C2005), which was followed by the Revised National Curriculum
Statement (RNCS) and by the National Curriculum Statement
(NCS)” p 28.
Since then there has been some changes; outcomes-based education (OBE) which
forms the foundation for the curriculum in South Africa has been introduced. The
OBE as a way of teaching encourages learner-centred and activity based approach
to education (Department of Education, 2003). In addition, the NCS prescribes the
Learning Outcomes for the physical sciences and these are to ensure continuity by
linking directly with the General Education and Training (GET) Learning Outcomes. .
New topics such as the Doppler Effect were introduced in the NCS. As a result of
these changes some of the teachers find it difficult to adjust to the NCS curriculum.
The National Senior Certificate (NCS) was introduced in 2008 for the first time and
this resulted that, 2010 was the third consecutive year in which grade 12 learners
were assessed by means of this examination. Only in 2014 will Grade 12 learners be
examined under CAPS (see paragraph 1.1). It is essential that government continue
to support innovative methods of teaching science and provide the teacher
professional development necessary to transform their practices (Osborne & Dillon,
2008, p 22).
2.2.2 Professional development
Professional development occurs when teachers aim for continuous improvement in
their professional skills and content knowledge after the initial training that was
required for them to be employed. Professional development is important because
improving teacher knowledge and teaching skills raises learners` performance
(Sparks & Hirsh, 2000). In addition, “If quality education is envisaged for all learners
in South Africa, ongoing professional development is essential” (Kriek, 2005, p 17).
A subject-based professional development activity is more effective in empowering
the teacher with the content knowledge and skills (Soulsby & Swain, 2003).
However, a study by MacBeath and Galton (2004) found that teachers were not
given enough opportunities for subject-based professional development. Scientific
discoveries are made yearly and textbooks are edited to include the new discoveries.

15
As scientific world is dynamic; a teacher should always be researching and learning
new ideas and discoveries (Farrow, 1999; King, 2002). A teacher should be involved
in personal studies in order to improve on skills and knowledge (Smith & Lovat,
1995). The teacher,
“will achieve ongoing personal, academic, occupational and
professional growth, through pursuing reflective study and research in
his/her learning area, in broader professional and educational matters,
and in other related fields” (Killen, 2007, p 367.
Teachers who give themselves time to study and research could enhance their
content knowledge and they might gain confidence which is essential in qualifying
the teachers` competitiveness (Schmidt & Cogan, 1986). For a teacher to gain new
knowledge, the teacher must be open minded, creative, innovative and “posing
significant, contextualised, real-world situations, and providing resources, guidance,
and instruction to learners as they develop content knowledge and problem-solving
skills” (Mayo, Donnelly, Nash & Schwartz, 1993, p 227).
Teacher professional development programs are necessary because enhanced
learner performance correlate with teachers continued learning activities (Brown,
Smith, & Stein, 1995; Wiley & Yoon, 1995). Furthermore, according to Mayer,
Mullens, & Moore, (2001) effective teaching is achieved by quality professional
development involvement by the teachers.
2.2.3 Content knowledge
Wright and Wright (2000) have stated that a teacher cannot teach what she/he does
not understand or accept. In this study, content knowledge was considered because
teachers` content knowledge of the Doppler Effect contributes to the learners`
understanding of the topic. An effective teacher should have appropriate teaching
skills and relevant qualifications (Joyce & Showers, 1988; Fullan, 1991).
Studies suggest that higher levels of student achievement are associated with more
qualified and experienced teachers (Grayson, 1996). However, in South Africa the
poor training of teachers has been highlighted by the report of the Task Team for the
Review of the Implementation of the National Curriculum Statement (Department of

16
Education, 2009). The lack of adequate skills and content knowledge (Wenglinsky,
2000) hinder their effectiveness (Collias, Pajak, & Rigden, 2000).
The blame for learners` poor performance rests with the quality of instruction and not
learners` ability to learn (Levine, 1985); indeed this points out to teacher ability and
skills. This might not always be the case there are many issues that have to be
considered but for this study students` performance is used to judge the teacher`s
competence. It has been established that some teachers are asked to teach
“science subjects they do not feel comfortable teaching and are not provided
adequate guidance and support” (Chandralekha, Laura, & Christian, 2010).
Teachers who are not confident in a subject cannot teach it effectively. Science
teachers are not adequately prepared in scientific inquiry experiences and content
knowledge (Berns & Swanson, 2000).
Teachers need the content knowledge in order to effectively deliver a science lesson
when using the learner centred approach.
2.2.4 Teaching approach
The challenge in teaching science is according to Bybee (1997) that it is a practical
subject and learners should use audio and visual aids as well as make observations
and come up with a scientific explanation. Learners will recall better what they see
and do than what they hear (Gilbert, Justi, & Aksela, 2003). Science is not all about
problem solving skills and experiments but also explaining phenomena and relating
them to learners’ daily life experiences (Berenfeld, Pallant, Tinker, Tinker, & Xie,
2004; Nui & Wahome, 2005). Learners have different levels of skills and experiences
depending on where they come from.
A teacher encounters learners from diverse backgrounds who differ in levels of
motivation, skills and knowledge. It is the responsibility of the teacher to guide these
learners to acquire the necessary attitudes, skills, motivation and knowledge. Also
teachers have to recognise the differences between opinions of learners and
scientific facts so as to guide them. Learners take control of the learning process by
actively participating and discovering solutions to the problems with minimum
assistance from the teacher. Learners take responsibility for their own learning
(Blumberg, 2008).

17
Learner centeredness as a teaching approach was chosen in this study because
studies have shown that successful learners are those who are exposed to this
teaching approach (Lambert & McCombs, 2000). When this approached was used,
learners were personally involved, committed and confident in their ability to succeed
(Alexander & Murphy, 2000). The learner centred approach was chosen because it
offers opportunities of assuring learners that they need to recognize that the
“conceptual world” that they are exposed to in the classroom is congruent to “the
world of experience” (Touger, Dufresne, Gerace, Hardiman, & Mestre, 1995).
Learners should be given a chance to understand science concepts through practical
activities and to relate these concepts to their daily life experiences (Park, Khan, &
Petrina, 2008). This study has suggested some activities connecting their
understanding of the topic and daily life experiences on the Doppler Effect which
teachers and learners might find beneficial.
A leaner centred approach emphasizes a variety of different types of strategies that
shifts the role of the educators from givers of information to facilitating student
learning (Blumberg, 2004). Learner centered approach places the emphasis on the
person who is doing the learning (Weimer, 2002). The benefits of learner centered
approach include increased motivation for learning and greater satisfaction with
school leading to greater achievement (Maxwell, 1998; Slavin, 1990). The activities
developed for learners in this study are learner centred. The following three teaching
approaches have been selected on the basis that they all advocate for learner
centred approach. In general, the chosen teaching approaches are basically the
same as regards to their emphasis on the learners` active role in the learning
process. A summary of some teaching approaches are given below:
a) Mastery Learning Approach (MLA): This is a teaching method where learners are
given opportunities to demonstrate mastery of content which they were taught
(Kibler, Cegala, Watson, Barker & Miler, 1981).
b) Enquiry-based approach: This approach has improved problem solving skills and
has been effective at increasing student attitude toward physics (Arion, Crosby, &
Murphy, 2000). With this approach the role of the learner is active participation,
asking probing questions and learning the concepts by hands-on approach (Luke,
2010).
18
c) Activity, Student, Experiment, Improvisation (ASEI) and Plan, Do, See, Improve
(PDSI) approach: This approach advocates a shift in the educator`s thinking and
practice from teacher centred to learner centred approaches. When teachers
improvise, they demystify conventional experiments by scaling them down, thereby
relating physics to everyday situations (Nui & Wahome, 2005).
This study advocates for learner centred approaches and to that effect the
developed activities gave the learner the opportunity to discover the knowledge and
then practically relate it to the immediate environment.
2.2.5 School environment
The school environment refers to all the physical conditions (furniture, buildings,
books and equipment) and the organisation of the school (school management
team). The classroom and school environment must be conducive to learning (Joyce
& Showers 1988; Fullan 1991). Some schools in the Vhembe district do not have
enough classrooms, furniture and the science laboratories, because they are
mostly in the rural areas. The lack of resources and adequate buildings might have
an effect on the learner performance and the poor grade 12 final examination results.
The school administration emphasise the need for high pass rates (Surendra, 2001)
and the Vhembe district is no exception. This could result in teachers using teaching
approaches which are examination focused. Darling-Hammond (1997) indicated that
conditions in some schools have forced teachers to acquire survival tactics at the
expense of effectively delivering the science content.
Foreign teachers` future at a school is dependent on the pass rate of his/her learners
at the NCS examinations, and this is the practice in Limpopo province.
This study has its limitations in addressing the school environment. However, it
addresses the professional development of teachers with regards to their content
knowledge and teaching approaches of teaching the Doppler Effect to grade 12
learners. The study also explores some of the teaching and learning problems
revealed in other researches on the Doppler Effect.

19
2.3 Other research on the teaching and learning of the Doppler Effect
In their study, Flick & Bell (2000) have confirmed that many scientifically accepted
ideas are not easy for learners to understand due to their complexity, abstract nature
and/or contrariness to experience and common sense. For example, learners cannot
see the change in the wavelength of a sound wave; this shows the abstract nature of
physics where things can only be perceived with the aid of science equipment or
inferences (Mbajiorgi & Reid, 2006). As a result of this abstractness, physics is
perceived as a difficult and an uninteresting subject (Fonseca & Conboy, 1999).
Furthermore, Flick & Bell (2000) stressed that the simulations on the Doppler Effect
allow learners to manipulate various components such as speed of object, speed of
sound and frequency of sound emitted by object. As a result learners will ask
themselves questions, try out ideas and draw their conclusions.
The problem faced by learners with the Doppler Effect is that it requires
simultaneous understanding of the spatial and time dependence (Gimenez, Vidaurre,
Riera, & Monsouriu, 2008). It follows that the traditional teaching resources such as
slides, overhead projector with transparencies and the blackboard are no longer
sufficient to teach the Doppler Effect. Also in his study Papacosta Pangratios (2010)
emphasised the need for visual demonstrations or simulations on the topic like the
Doppler Effect.
2.4 The Doppler Effect
The Doppler Effect is the apparent change of frequency and wavelength of a wave
when the source or the observer moves relative to each other (Gibbs, 1997). When
dealing with sound, if a source of the wave (car sounding a siren) and an observer
are moving relative to each other, the observed frequency is different from the
source frequency. When the source and observer are moving away from each other,
the observed frequency is less than the source frequency. This is due to the sound
waves being stretched to create lower frequency sound waves. When the source
and observer are moving towards each other, the observed frequency is greater than
the source frequency. In reality the sound waves are being compressed, causing a
higher frequency to be heard by the listener/observer. This phenomenon is called the
Doppler Effect. A familiar example is the change in pitch of an ambulance siren when
20
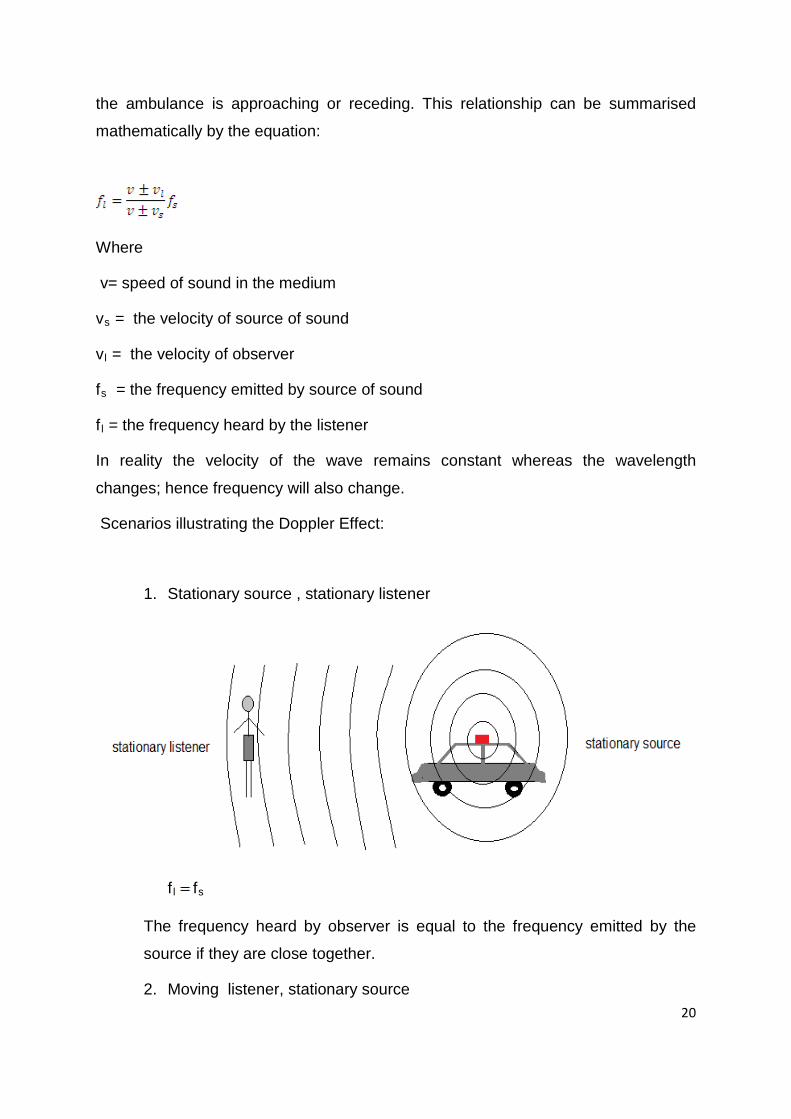
the ambulance is approaching or receding. This relationship can be summarised
mathematically by the equation:
Where
v= speed of sound in the medium
vs = the velocity of source of sound
vl = the velocity of observer
fs = the frequency emitted by source of sound
fl = the frequency heard by the listener
In reality the velocity of the wave remains constant whereas the wavelength
changes; hence frequency will also change.
Scenarios illustrating the Doppler Effect:
1. Stationary source , stationary listener
fl fs
The frequency heard by observer is equal to the frequency emitted by the
source if they are close together.
2. Moving listener, stationary source

21
• the plus sign applies when listener moves towards the source as shown
below:
• The negative sign applies when the listener moves away from the source of
sound.
3. Stationary listener, moving source

22
• the plus sign applies when source moves away from the listener
• the negative sign when source of sound moves towards the listener
4. Moving listener, moving source
• the upper sign positive and lower sign negative apply to source/
listener moving towards each other.
23
• The upper sign negative and lower sign positive apply to
listener/source moving away from each other (Lowe & Rounce, 1997).
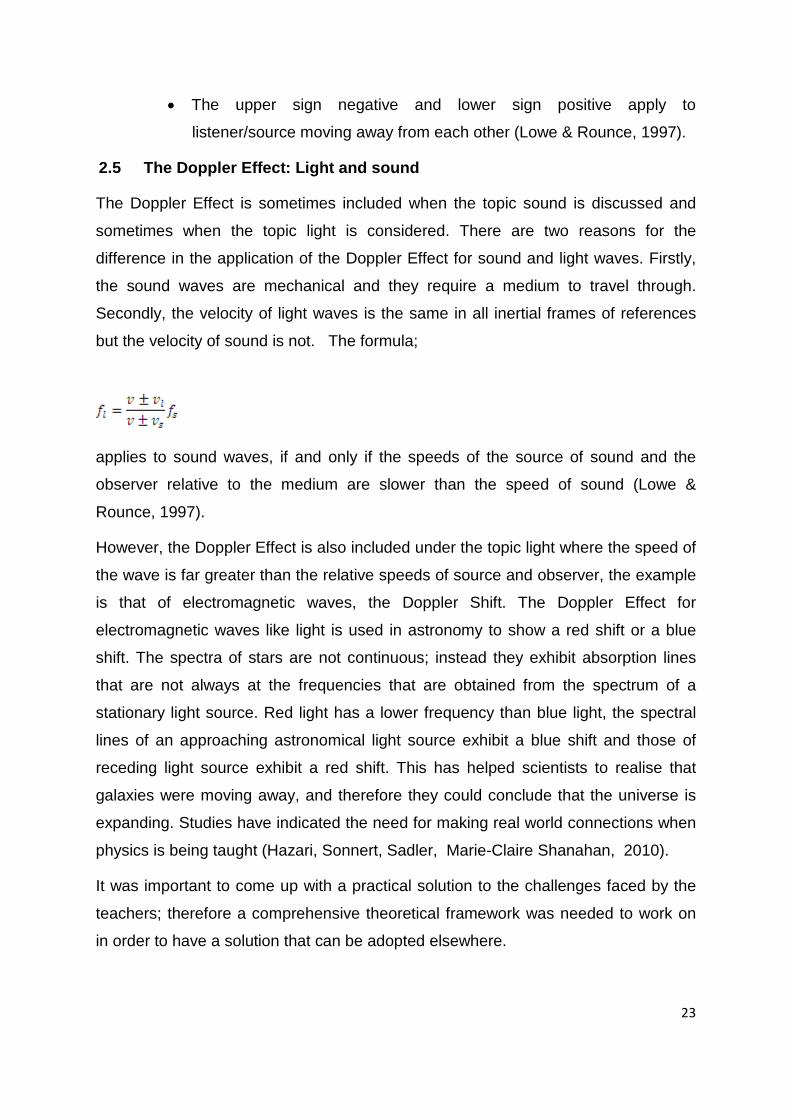
2.5 The Doppler Effect: Light and sound
The Doppler Effect is sometimes included when the topic sound is discussed and
sometimes when the topic light is considered. There are two reasons for the
difference in the application of the Doppler Effect for sound and light waves. Firstly,
the sound waves are mechanical and they require a medium to travel through.
Secondly, the velocity of light waves is the same in all inertial frames of references
but the velocity of sound is not. The formula;
applies to sound waves, if and only if the speeds of the source of sound and the
observer relative to the medium are slower than the speed of sound (Lowe &
Rounce, 1997).
However, the Doppler Effect is also included under the topic light where the speed of
the wave is far greater than the relative speeds of source and observer, the example
is that of electromagnetic waves, the Doppler Shift. The Doppler Effect for
electromagnetic waves like light is used in astronomy to show a red shift or a blue
shift. The spectra of stars are not continuous; instead they exhibit absorption lines
that are not always at the frequencies that are obtained from the spectrum of a
stationary light source. Red light has a lower frequency than blue light, the spectral
lines of an approaching astronomical light source exhibit a blue shift and those of
receding light source exhibit a red shift. This has helped scientists to realise that
galaxies were moving away, and therefore they could conclude that the universe is
expanding. Studies have indicated the need for making real world connections when
physics is being taught (Hazari, Sonnert, Sadler, Marie-Claire Shanahan, 2010).
It was important to come up with a practical solution to the challenges faced by the
teachers; therefore a comprehensive theoretical framework was needed to work on
in order to have a solution that can be adopted elsewhere.

24
2.6 Theoretical Framework
The study is to address the challenges experienced by teachers when teaching the
Doppler Effect by designing learning activities on the Doppler Effect with the aim of
promoting learner centred approach in learning.
A theoretical framework attempts to connect to all aspects of inquiry like statement of
the problem, purpose of study, literature review, methodology, data collection and
analysis of results. Frameworks help us to “visualize the problem, to break it down
into discrete, manageable units” (Ryder, 2011). The designers in the design research
should come up with a model for learning the topic of interest (Clements & Battista,
2000). The focus of this research was to design learning activities on the Doppler
Effect with the aim of promoting learner centred approach in learning.
There has been a significant shift in theories of learning from the objectivist view to
the constructivist view and this has had an impact in the teaching and learning of
science. The objectivist view as described by Hendry (1996, p 24-25) is the teaching
and learning in which the teachers possess the “knowledge” and the learners “are
expected to listen and/or watch”. According to Ng`ambi & Johnston, (2006) the
teacher was viewed as a fountain of knowledge.
The constructivist view holds that the learners construct knowledge for themselves
(Hein 1996). Learners learn new concepts by constructing or building on their prior
understanding (von Glasersfeld, 1983). Furthermore Erickson (2007, p 7) notes that
learners are “capable of constructing plausible conceptions while engaging with their
physical and social worlds”. A constructivist perspective holds that learning occur
when learners construct their own meanings in a unique way whilst interacting with
their learning environment and building on their existing knowledge (Killoran, 2003;
Ping 2002).
This study is framed by the Martinand model (figure 1) as cited in Ganaras, Dumon &
Larcher (2008). The links between practice and theory are important in the building
up, organisation and the integration of scientific knowledge (Ganaras et al., 2008).
The theoretical framework (figure 1) analyses the dialectic link between experiments,
models and theory that is experienced by learners during their construction of
knowledge.

25
Figure 1: Martinand`s science model
The empirical referent:
The empirical referent consists of real objects and phenomena and also includes
rules of action on these objects and phenomena. The empirical referent has been
divided into three components as follows:
i) Phenomenotechnic component; this is the experimental ability, knowledge of
laboratory apparatus and laboratory safety rules.
ii) Phenomenographic component; refers to the ability to describe objects and
phenomena so that related information can be communicated.
iii) Phenomenological component; corresponds to another description in terms of
concepts, models and shared theories.
The interpretive elaboration:
This is what is created with the use of models and concepts in order to represent the
empirical referent.

26
The cognitive matrix:
It consists of the epistemic paradigm and the theoretical resource (language,
drawing, theories and symbols). Cognitive matrix is a set of theoretical and
experimental knowledge of a learner`s operational knowledge (Ganaras et al., 2008).
I used this scheme in the phrasing of the questionnaires and interview questions,
developing of EDR activities and data analysis. The learners in this study were in the
final year of school and it is assumed that they should have cognitive matrixes which
allow them to link the Doppler Effect phenomena and explain the empirical referent
in using the developed EDR activities and theories. According to the theoretical
framework, the empirical referent is divided into three components. The
phenomenotechnic component includes the knowledge of the apparatus used in the
activities which are a slinky, eyedropper and bicycle. The phenomenographic
component includes the description of an empirical referent in terms of the Doppler
Effect concept, while the phenomenological component consists of the description of
the same empirical referent in terms of concepts and notions, resulting from some
past conceptualization (water waves, frequency, wavelength and speed of a wave
etc). The EDR activities were used to uncover how far the learners` experimental
knowledge has been improved by this concept.
Several factors have been identified as important to the problem such as teacher
content knowledge, laboratory equipment and teaching approaches, this framework
will assist in making logical sense of these factors (Sekaran, 2000). This theoretical
framework was utilized in this study through the use of designed activities to create
an environment that will help learners reach their level of potential development. The
learners worked in groups gaining what Solomon (1987) in Hand & Vance (1995, p
41) calls “a public forum for both testing their knowledge and extending and
expanding it” through practical activities and group discussions. The designed
activities will help learners understand beyond what they already know because they
will be actively involved and they will be constructing their own knowledge. EDR
activities can help learners to discuss in a collaborative way in the classroom and
their performance could be enhanced (Ingvarson et al, 2004).

27
2.7 Summary
The chapter started with a brief explanation of the challenges faced by the teachers.
The theory of the Doppler Effect was presented as well as why it is sometimes
included when the topic light is discussed and sometimes when the topic sound is
presented. Finally the theoretical framework was presented and explained.

28
CHAPTER 3: RESEARCH METHODOLOGY
3.1 Introduction
This chapter presents the research design, population and sample of the research,
validity and reliability of instruments, procedures for data collection and data analysis
methods. A discussion of ethical issues considered in this study is also included.
3.2 Research Design
This study incorporated a qualitative and quantitative approach when collecting and
analysing the data. It is recognised that all methods have limitations and that using a
range of research methods allows for triangulation of data sources. In this way, the
study used questionnaires and interviews to establish the baseline. Activities were
designed and the evaluation of these involves determining the worthiness, merit or
the quality (Johnson & Christensen, 2000) of the designed activities. Educational
design research sometimes called design based research was used and it
possesses an iterative design characteristic (Cobb, 2003).
A quantitative approach namely the explanatory research design (Creswell, 2008)
was used to determine the association between the final products namely the
developed activities and the written tests.
3.3 Research population and sample
The sample of the study was purposefully (Babbie & Mouton, 2009) selected so as to
get as much useful information as possible. A total of 12 secondary schools in
Vhembe district in Limpopo province were chosen for trying out the designed
lesson activities.
Although the Vhembe district has 27 circuits, only three circuits namely; Luvuvhu,
Mvudi and Sibasa were selected for this study. The 3 circuits were purposefully
chosen because of their proximity to each other which reduced transport costs
during the distribution and collection of questionnaires. Therefore the sampling is
both purposeful and convenient. Two schools (one rural and another urban) were
chosen for piloting the activities and 10 schools for evaluating the refined activities.

29
Table 4 below indicates the circuits and the number of schools which were chosen
for this study.
Table 4: The circuits in Vhembe which were chosen for the study
Circuit No of Schools
Luvuvhu 10
Mvudi 13
Sibasa 11
Total 34
A total of 32 teachers completed the questionnaires and one subject advisor was
interviewed. A total of 216 learners were used in the study and were taught by the
selected teachers.
3.4 Instruments
In order to answer research question 1; Which aspects of the topic Doppler Effect do
the teachers find challenging?
a) What are the challenges identified by the teachers in terms of content
knowledge when teaching the Doppler Effect to grade 12 learners?
b) What are the challenges identified by the teachers in terms of teaching
approaches when teaching the Doppler Effect to grade 12 learners?
A questionnaire for teachers (appendix 1) was developed and an interview with the
subject advisor (appendix 2) was conducted. To answer research question 2, which
says; What is the effectiveness of teaching the Doppler effect using developed
learner-centred activities?
Students’ activity sheets (see appendices 4, 5 and 6) were developed by the
researcher and completed by 41 learners who also wrote a test. A total of 41
learners were used in the pilot study. After analysis changes were made, and the
activity sheets were distributed to and completed by 216 learners. A total number of
216 learners completed the activity sheets and wrote a test on the Doppler Effect.

30
3.4.1 Questionnaires
A questionnaire was developed to establish the baseline of what the challenges are
in teaching the Doppler Effect to Grade 12 learners. The disadvantages of this
questionnaire were that it failed to give answers to such questions as, when? why?
and how? (Bless & Higson-Smith, 1995). The questionnaire (see appendix 1)
comprises of 18 questions and was used to obtain information on:
• teacher background: qualifications and teaching experience
• the teaching approaches used by the teachers on the topic the Doppler Effect,
• challenges experienced when teaching the topic Doppler Effect,
• whether the teachers make use of practicals/demonstrations/activities during
their lessons with regards to the Doppler Effect or not.
As pilot, six copies of the same questionnaires were distributed to grade 12 physical
science teachers who were not part of the sample. The teachers were conveniently
selected from six different schools rural, semi-rural and urban schools in the same
district. Two separate cover letters from the University of South Africa (UNISA) and
the Department of Education were attached to the questionnaires to authenticate
them and to ensure that due process is followed.
These teachers were given a week to complete the questionnaires which were then
collected by the researcher. A total of 32 questionnaires were completed (out of the
34 questionnaires that were sent out) and collected by the researcher from these
selected schools. The percentage of questionnaires returned was 69.6%.
Reliability
The questionnaire was checked for accuracy and consistency using the pilot study.
The internal consistence of the questionnaires was verified by using the split-halves
reliability method (Bless & Higson-Smith, 1995).
The items of the questionnaire were split into halves, the first half with odd question
numbers and the second half with even question numbers. The number of piloted
copies were 6 and this gave a total of 108 (6x18) questions. Therefore there were
two groups of items each with 54 (108/2) questions. The teachers responded
similarly to the groups of items, indicating reliability and that the instrument has high

31
internal consistency. When analysing the items it was found that no items were
giving conflicting results and therefore all the questions were maintained.
Validity
After piloting the questionnaire, the aim was to check if the instrument is measuring
what it is supposed to be measuring, and to determine if the answers given by
teachers have any meaning. The instruments were pilot tested in the field to ensure
instrument validity and to check on clarity of instructions and relevance of items
(Bless & Higson-Smith, 1995).
Content validity:
Before questionnaires were constructed a study of the literature related to the
Doppler Effect was done focusing on the content and teaching approaches as this is
part of the research questions. Various text books were read on the topic Doppler
Effect. This was done to make sure that the questionnaires are contextually correct.
External validity:
The questionnaires were distributed to 34 schools out of a population of 46 schools
in the chosen cluster of schools because of their location. The 34 schools were not
amongst the 6 schools chosen for pilot study. The questionnaire was completed by
32 of the 34 teachers given the questionnaire. The percentage of the teachers who
participated was 94.1%, therefore the result of the baseline can be generalised as
representing the cluster. The actual number of schools in the cluster which
participated in the study was 32/46, giving a percentage of 69.6%.
Construct validity:
The process of constructing the questionnaire began by listing different ideas about
the information which were to be uncovered by the questionnaire so as to establish
the baseline. There was a link between the items in the questionnaire and the sub
research questions (a) and (b).
Face validity:
The questionnaire was intended for the physical science teachers and correct
scientific terminology was used to ensure that it was relevant to them. The analysis

32
of the piloted questionnaires led to the conclusion that; the instrument was not too
difficult, too long, or too simple for the testees, and they found it easy to understand.
3.4.2 Interview
One subject advisor was interviewed because he was the only physical science
subject advisor covering the area of study. Before the interview was conducted, the
interview protocol was taken to two lecturers experienced in training physical science
teachers at university, for moderation. This was done to remove any ambiguity from
the interview protocol. These lecturers were chosen because they visit schools when
their students are on teaching practice and they are familiar with the context. All this
effort was made to come up with valid information from the subject advisor. In
addition, 3 of the 32 teachers and 3 of the 216 learners were interviewed after the
lessons to probe them on the lessons and thereby ask clarity on some of the
observations. Only few learners (3/216) and teachers (3/32) were chosen, this was
done for convenience purposes; there was no need for many interviewees since no
inferences were intended to be drawn from the interviews. The teachers and
learners were randomly selected. The learners had to indicate if they understood the
lesson, enjoyed the activities and if the equipment were user friendly as well as
evaluate the lesson in terms of teaching approach. The envisaged purposes of
interviews were:
a) Learners:
to check if learners understood the lesson
to verify if there was any difference in teaching approach from what they were
used to
Evaluate the lesson
The teachers had to comment on the teaching approach, the learner centeredness of
the activities. Also teachers had to express their observations and comment on the
effectiveness of the activities and if they would desire to adopt the teaching
approach.
b) Teachers:
To verify on whether the teachers benefited from the activities

33
To comment on the lesson activities.
Since the sample was small no inferences were made.
3.4.3 Activity sheets
The lesson objectives and how the activities were constructed are shown in
appendix 3. The three chosen activities which addressed the main aspects of the
Doppler Effect are:
a) The relationship between frequency and wavelength
b) The apparent change in frequency of sound when there is relative motion of
the listener and the source of sound.
c) Correct use of the Doppler formula and its application in solving problems.
It was difficult to call for a meeting with the teachers therefore the researcher had to
visit the 12 teachers (2 for pilot and 10 for the refined activities) concerned in order to
demonstrate to them how to do the activities. Some teachers asked for equipment
which they did not have in their schools and these were supplied by the researcher.
During the pilot study it was possible to note the needs with regards to equipment
and adjustments like using the pipette instead of eye dropper were made to the
activities. Activities were piloted in 2 different schools, one being a rural school and
the other being an urban school. The lessons were specifically conducted in such a
way that the learning environment of the learners was not changed so as to eliminate
bias from the learners. The schools which were selected were far apart so that the
learners would not share the contents of the lesson activities since the lessons were
conducted on different days. After the learners had done the activities and completed
the activity sheets challenges encountered such as poor visibility of waves on
cafeteria trays were noted and modifications were made to the activities and
accompanying activity sheets, before it was distributed to the 10 schools.
3.4.4 Tests
Learners in this district were subjected to writing the same test as described in
paragraph (1.2). Therefore, all schools wrote the same test with the same weighting
of marks. The questions were relevant to the curriculum and similar to those
34
questions set for the final examinations. The answered sheets were collected,
marked and analysed by the researcher.
Relationship between activity sheets and tests:
• Both the activity sheets and tests were on the same topic, the Doppler Effect.
• The learners carried out the activities performing the experiments by
themselves and the tests were used as a measure of learning gains.
• The scores from marked activity sheets and marked tests were compared to
find out if there was any correlation between the two.
3.5 Methodology
The study aimed at producing high quality developed activities designed to solve an
educational problem. The activities were use-inspired (van den Akker, 1999) and
were specifically designed for the teachers and learners in grade 12.
Systematic educational and instructional design processes are cyclical in character:
analysis, design, evaluation and activities are refined in an iterative manner until a
satisfying model was obtained. This study has used the Generic Design Research
Model (figure 2) as described by Wademan (2005).

35
Figure 2: Generic Design Research Model (Wademan, 2005).
36
Description of the steps used in the methodology (figure 1):
1. Problem identification
The challenges of teaching the Doppler Effect to Grade 12 learners in the Vhembe
District were identified as the problem of the study.
2. Preliminary investigation of problem, context and approaches.
The study has been done in three parts (see figure 3). The first part was to establish
the baseline by distributing questionnaires to teachers and conducting an interview
with the subject advisor. This was to establish the challenges faced by teachers and
determining the teaching approaches they used. The second part involved the
development of activities using Educational Design Research (EDR), then the trying
out of the activities and then the redevelopment of the activities. The third part
comprised of the testing of the activities in 10 schools. After the evaluation of these
activities an Instructional Manuel on teaching the Doppler Effect was developed and
distributed in the district.

37
Figure 3: The three parts of the study
3. Tentative products and theories
After analysis of the questionnaires information on the challenges which the teachers
have when teaching the Doppler Effect were documented. A possible solution had to
be found to address these challenges. The design-based activities were chosen as a
possible solution because they integrate all three Learning Outcomes as well as
present knowledge and alternative teaching approaches. The researcher`s goal was
to come up with refined activities which could be used to assist teachers and
learners in the topic Doppler Effect.
4. Refinement of problem, solution and method.
Both formative and summative evaluations were used. Formative evaluation was
used to improve and to uncover shortcomings of the activities during their

38
development. Summative evaluation was used to gain evidence for the effectiveness
of the developed activities (Nieveen, 2007). The activities were initially tried out in 2
schools. Challenges faced in trying-out the activities were noted, for example some
schools did not have the required apparatus. Changes were implemented and the
activities were then modified. The final product was then tried-out in 10 schools.
5. Refinement of design theory
The researcher reflected on the performance of the learners and evaluated the
effectiveness of the activities in achieving lesson objectives. The evaluation was
done to improve the activities to a high quality product.
6. Problem resolution and advancing theory.
The challenges of teaching the Doppler Effect were identified. Activities were
developed to assist the teachers and learners on the teaching and learning of the
Doppler Effect in grade 12. An instructional manual was produced after all
necessary improvements were incorporated.
3.6 Development of Doppler Effect activities
The activities of this study were developed using mainly a cited article (Patterson,
2007) and the textbook Focus on physical science grade 12 (Hendricks, Sadeck &
Spies). The Patterson approach was used, for developing activities which allowed
the learners to predict, observe and explain the phenomena.
He has produced a lesson plan with activity sheets on the Doppler Effect for use in a
secondary school (Orion Jr. High) covering the course; Earth Systems. The core
curriculum standard or aim of his activities was: “Students will understand the
scientific evidence that supports theories that explain how the universe and solar
system developed”. One of the intended learning outcomes was to, “Observe
objects, events and patterns and record both qualitative and quantitative
information”. The research questions to be scientifically investigated by learners
were:
1. What factors affect the wavelength of a wave?
2. What is the Doppler Effect?

39
In Patterson`s lesson the teacher is instructed to start out with a class discussion of
how learners think the universe might have been formed and to list reasons why they
think the universe was created that way. Learners were encouraged to discuss ways
science has tried to explain the formation of the universe. However, the approach is
different from the way it is done in the South African secondary schools.
In South Africa, one of the text books used by teachers and learners is “Focus on
Physical Science grade 12” (Hendricks et al., 2007, p 54). The only activity
suggested in this book for the Doppler Effect is a practical demonstration done
outside the classroom. The following are the instructions taken from the text book:
Your results will be more reliable on a windless day.
You will need:
• a bicycle
• a referee whistle
1. Have the class group stand 50m away from a pair of learners on
the bicycle. One of them will be cycling. While lifting the other
learner, who will be blowing the whistle.
2. Start cycling towards the class group, while the whistle is being
blown. Take care to blow the whistle steadily, not softer or
louder. (Practice blowing at an even level before the actual
demonstration).
3. Carry on cycling, with the whistler still blowing, until you are at
least 50m past the class group.
4. Write a short report about this experiment in your workbook.
Record all your observations.
5. Provide a possible explanation for what you observed.
An additional three activities were added and the one for the bicycle modified. A
learner might not be able to blow the whistle steadily and so an electronic device
(cell phone) was used. In order to link science with the everyday experiences of the
learners another activity was designed for the learners to observe the change in
sound frequencies when the vehicles pass by the road (see table of activities,

40
appendix 3). The developed activities have incorporated the main ideas of the three
teaching approaches (mentioned in paragraph 2.2.4). The learners had to
demonstrate their knowledge of water waves which they were taught earlier (Mastery
Learning approach) and the learners were to actually perform the experiments by
themselves (Enquiry-based approach). The materials used for the activities were
readily available within the learners` environment and were relating to the learners`
everyday experiences.
3.7 The advantages of using Educational Design Research
Educational Design Research (EDR) is an effort that “seek to understand learning
and influence educational practice” and “pursues the goals of developing effective
learning environments as natural laboratories to study and teaching” (Sandoval &
Bell, 2004). In addition EDR helps to bridge the gap between research and practice
(Romme, 2003; Van Akan, 2004). Learners tend to recall more when they learn
hands-on using activities (Berenfeld et al., (2004). Hegarty-Hazel (1990) points out
that the activities allow learners to develop technical skills and the manual expertise
needed when carrying-out experiments.
EDR brings out different kinds of knowledge together with a better theoretical
understanding of the learning aspect that can be addressed by an intervention and
ability to use effective design practices (Design-Based Research Collective, 2003;
Edelson, 2002).
In this study, EDR was used to identify problems faced by learners, teachers and
researcher because it gives new knowledge about science teaching and learning.
The activities were developed and tested, refined and re-tested in an iterative cycle
and finally an instructional manual were developed. The practical contribution of
EDR in this research is that it has produced tangible products that can be adopted
elsewhere (Barab & Squire, 2004).
The decision to use EDR instead of Action Research was based on the following
features that EDR possess (Juuti & Lavonen, 2006);
i. A design process is essentially iterative.

41
ii. Objective of the Design Research is to develop an artefact to help
teachers and learners to act (teach and study) more intelligible (in a
way that advance learning).
iii. Design research renders novel knowledge about science teaching
and learning.
Action research has disadvantages of; development of a solution to a practical
problem (Plomp & Nieveen, 2007), personal over-involvement, it is time consuming
and complex to conduct. Design activities were developed because they give rise to
positive scientific attitudes leading to open-mindedness and the power for critical
judgement (Friedler & Tamir 1990).
The following observation is like a wakeup call to all of us;
“unless we are willing to apply the same rigorous standards of
scholarship to issues related to learning and teaching that we regularly
apply in more traditional research, the present situation in physics
education is unlikely to change” ( McDermott, 1998, p 8)
In an attempt to change this present situation when learning and teaching the
Doppler Effect, the core of this study was to develop learning activities and trying
them out by using the EDR. The developed activities are easy to use and they utilise
simple materials which are easy to manipulate. When EDR is tested with action
research, relevant knowledge is produced for practice and theory (Andriessen,
2007). EDR must offer something new, of interest and useful to the stakeholders as
emphasised by Edelson (2002, p 118),
“A design [-based] research program should yield new theories (for
this study an instruction manual) that have utility for resolving important
problems”
This research has offered an instructional manual for the use by teachers and
learners.
3.8 Data analysis
In this study, qualitative and quantitative research methods are complementing each
other.

42
Quantitative data
The sources of the quantitative data are the teachers` questionnaire as well as
marks from activity sheets and tests. The data from questionnaires were analysed
using graphs and statistical calculations such as mean, percentages and correlations
using the software SPSS with the aim of justifying conclusions. In order to use
statistics programme SPSS for data analysis answers to individual questions were
organised. Before analysing the data, key points in the answers from questionnaires
were noted and codes were developed which describe separate categories of similar
answers. The computer was then able to manipulate the data using the codes (see
Appendix 7 and 8). The tests written by 216 learners were marked and the marks
analysed. In order to find a relationship between the marked activities and the written
tests, correlation analysis was carried out.
Qualitative data
The sources of qualitative data were the learners`, teachers` and the subject advisor
interviews. The researcher randomly selected the 3 learners and 3 teachers for
interviews. There was only one subject advisor appointed in the District where the
research was carried out and he was also interviewed. The interviews were
transcribed.
3.9 Ethical considerations
3.9.1 Official permission
An application was done (see appendix 9) to the Department of Education in
Vhembe district Limpopo province to conduct research with the selected Grade 12
learners, teachers and the subject advisor. Permission was granted (see Appendix
10A). The permission letter indicated that the researcher was to inform the Circuit
Manager and Principals of schools before visiting their schools. The Department also
emphasised that the interaction with the learners and the teachers should not disrupt
teaching and learning activities in schools. Permission was sought from the Circuit
Manager and school principals concerned.
Also students conducting research as part of their studies in the Institute for Science
and Technology Education are required to seek ethical clearance from the UNISA

43
Ethical Review Committee. An application for ethical clearance has been made and
approval has been granted (see Appendix 10B).
3.9.2 Subject Advisor, teachers and learners.
The subject advisor was notified about the purpose of the study and willingly agreed
to be interviewed (see appendix 2 for interview schedule).
The teachers completed the questionnaire voluntarily. The learners were not aware
that a research was carried out in their schools because nothing unusual happened
during class time.
To ensure that these learners and their teachers were protected from any
victimisation, biases and any infringement of their rights, the information collected in
this study will not be used to disadvantage the participants in any way. Teachers and
learners were assured that their names were not to be used in this research.
3.10 Summary
This chapter presented the research design, research population and sample. It also
presented the instruments used, methodology, data analysis and finally the ethical
considerations. The data collected and analysis will be discussed in the next chapter
in order to answer the research questions.

44
CHAPTER 4: PRESENTATION AND ANALYSIS OF DATA
4.1 Overview
This chapter focuses on the presentation and analysis of the data. The data were
collected in three phases in order to answer the two research questions.
Phase 1: In order to establish the baseline and answer research question 1, data
were collected from grade 12 physical science teachers about their background,
content knowledge with regard to the Doppler Effect, what teaching approaches they
use as well as the support they receive. An interview was conducted with the subject
advisor to seek amongst others for his explanation on the poor performance of
learners in grade 12 physical science. Quantitative and qualitative analysis of the
questionnaire were done and only a qualitative analysis of the interview was done.
Phase 2: The activities were developed and tried out in 2 schools in order to answer
sub question 2. The completed activity sheets and written test were collected from
learners and were analysed by quantitative means. In order to minimise the ‘leaking’
of the test the 2 schools whose learners wrote the pilot test, the schools were far
from the 10 schools whose learners wrote the test on the same day. Improvements
were made to the activities; the refined product was ready for the next phase.
Phase 3: The altered activities were tried in 10 schools and again the completed
activity sheets and written test were analysed quantitatively.
4.2 Phase 1: Results and analysis of the questionnaire for teachers
Teachers had to complete a questionnaire with 18 questions. The questionnaire
comprised of closed-ended questions which required a teacher to tick an option, and
open-ended questions (see appendix 1). The theoretical framework guided the
phrasing of the questions in order to get information from the teacher on the
“phenomenotechnic” aspect (see paragraph 2.6). That is, the teachers` ability to use
laboratory equipment. There were questions on the “Phenomenographic” which
required the teacher to describe how the teacher communicates information
(teaching approach) on the Doppler Effect to the learners. There were questions on

45
the cognitive matrix level of the framework (questions on the Doppler Effect formula)
which required the teacher to use rationality, symbols and theoretical ideas in order
to answer them.
The teachers` background was used to determine information on their gender, years
of teaching experience and qualifications (certificates, diploma or degrees). This
information is important, since studies have revealed that teacher` qualifications
correlates positively with learners` achievement (Betts, Zau, & Rice, 2003).
Personal Information
1. Gender N=32
Table 5: Gender
Male 30
Female 2
The analysis of the questionnaire (see appendix 1) indicates that 30 males are
teaching physical science and only 2 females are teaching the subject in grade 12
(see table 5). This is not the situation in Vhembe alone, and also it is not unique to
South Africa. The United Nations Educational, Scientific and Cultural Organisation
(UNESCO, 1999) has recognised the issue of women in science as a global
challenge (UNESCO, 1999). Women are being sidelined when it comes to education
and training in science and engineering (UNESCO, 1999). In Latin America,
Caribbean and Africa women have difficulty in accessing education and are rarely in
hierarchical posts or at decision-making levels (UNESCO 2). In United Kingdom,
only 3-4% of professors in any branch of Science, Engineering and Technology
(SET) are women (Gavaghan, 1997).
2. Grade 12 physical science teaching experience in years
The results show that of the 32 teachers who completed the questionnaires, 28
teachers (87.6%) have more than 10 years experience (figure 4). This information is

46
important because studies which were carried out at secondary schools have shown
that teachers experience correlates with learners’ achievement (Betts et al., 2003).
Figure 4: Teaching experience
0 2 4 6 8 10 12 14 16
Above 20
16-20
.11-15
.6-10
0-5
No of teachers
no of years
Teaching Experience in years
3. Teacher qualifications
A diploma referred to in this questionnaire was a science teaching diploma (2 - 4
years training). The Advanced Certificate in Education (ACE) is obtained by a
teacher with a teaching diploma. Six (18.8%) teachers possessed teaching diplomas.
Half of the teachers (16 teachers, that is 50%) who completed the questionnaire had
an ACE qualification and 10 (31.2%) teachers had science degrees (see figure 5). A
highly qualified teacher is more effective in teaching and his learners achieve better
results (Rice 2003; Darling-Hammond, 2000).
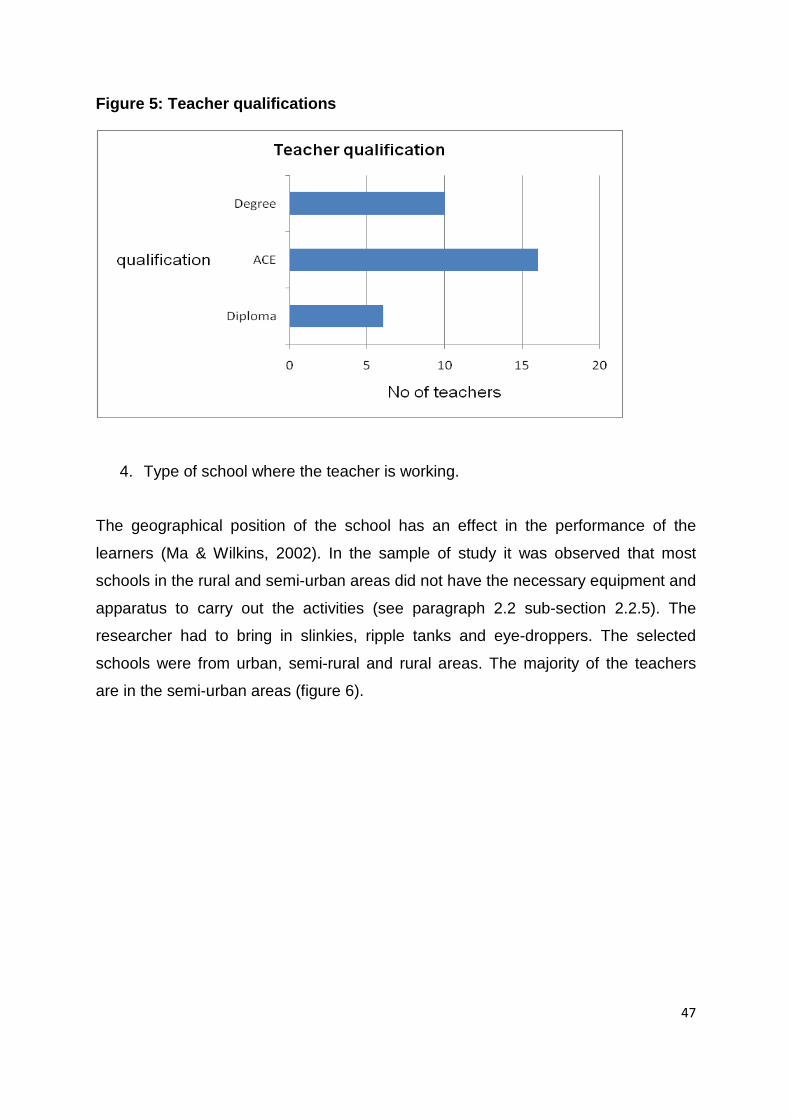
47
Figure 5: Teacher qualifications
4. Type of school where the teacher is working.
The geographical position of the school has an effect in the performance of the
learners (Ma & Wilkins, 2002). In the sample of study it was observed that most
schools in the rural and semi-urban areas did not have the necessary equipment and
apparatus to carry out the activities (see paragraph 2.2 sub-section 2.2.5). The
researcher had to bring in slinkies, ripple tanks and eye-droppers. The selected
schools were from urban, semi-rural and rural areas. The majority of the teachers
are in the semi-urban areas (figure 6).

48
Figure 6: The geographical location of the schools
0 2 4 6 8 10 12 14 16 18
Rural
Urban
Semi-urban/semirural
No of teachers
location
Location of school
A significant number of teachers (17) indicated that their understanding of the
Doppler Effect was satisfactory, nether good nor very good. It was therefore
interesting to check on the qualifications of these teachers who had problems on the
topic by cross tabulating teachers` qualifications and their understanding of the
Doppler Effect (Table 6).
Table 6: Cross tabulation: Teacher qualification and understanding Doppler
Understanding the Doppler Effect formula
Total Fair Satisfactory Good Very good
Qualification Diploma 1 5 0 0 6
Ace 3 8 5 0 16
Degree 0 4 3 3 10
Total 4 17 8 3 32
It was interesting to note that the understanding by the teachers of the Doppler Effect
does not depend on qualifications; 4 teachers (see table 6) with degrees find their
understanding of the topic satisfactory. Not even one teacher with diploma or ACE
qualification rated his/her understanding of the topic as very good.

49
5. Total number of learners in grade 12 physical science classes
Schools with many learners are actually performing better than schools with few
learners (Department of Education, 2011) despite what some teachers say “the
smaller the class the better the results”. In the sample of study the mean class size
was 57 learners and this is quite normal in this province. Grade 12 results for the
year 2010 have shown that some schools with large classes can perform much
better than some schools with a few learners as shown in table 6. Mbilwi and
Thohoyandou secondary schools had 327 and 168 candidates (table 7) respectively
who sat for their grade 12 final examinations in 2010. They all passed. In contrast, a
school with only 3 learners had a zero percent pass rate. The schools in table 6 were
chosen from Limpopo province, four from Vhembe district. One other school was
chosen from a different district to show that what the results indicate was not only
restricted to the Vhembe district.
Table 7: Comparison of learners` performance in selected schools
Limpopo
Province
District School Total no wrote
Total no
passed
Pass %
Vhembe
Thohoyandou 168 168 100
Mbilwi 327 327 100
Haggai 24 10 41.7
Baltmore Boithuto 10 0 0
Vhembe Wilmary
Christian
3
0
0
Content, support and teaching method(s)
The following 12 questions were asked to obtain information on the teachers.

50
6. How do you rate the level of difficulty of teaching the topic Doppler Effect?
The topic Doppler Effect involves mathematical calculations which require learners to
create mental visions of the situations being described in the questions (Trey &
Khan, 2008). Angell et al., (2004) declared that Physics is a more conceptually
demanding subject as compared to other disciplines. The teachers need to
understand the content first before they could impart it to learners. As Wright and
Wright (2000) have remarked- “one cannot teach, model or support what one does
not know, feel or accept” (p.137). It is the role of the teacher “to model the
appropriate mental processes so learners become aware of the correct mental
procedures that will enable them to solve a problem” (NRC, 2005; Wenning, 2005).
Figure 7 shows that 16 teachers (50%) find the topic difficult to teach and 4 teachers
(12.5%) find the topic very difficult to teach. This could indicate that the teachers`
lack content knowledge of the subject and therefore they cannot be confident in
teaching this subject.
Wilson & Floden, (2003) indicated that a teacher who has majored in physics is likely
to perform better in that subject.
Figure 7: The teachers` assessment on the levels of difficult of teaching the Doppler Effect.
0 5 10 15 20
very easy
easy
difficult
very difficult
No of teachers
level of difficult
Level of difficult of teaching the Doppler Effect

51
7. How do you rate your understanding of the formula?
The teachers were asked to indicate, poor, fair, satisfactory, good and very good in
the questionnaire. In question 6 the teachers find the topic difficult and it is not that
surprising in question 7 when the majority of the teachers (53.1%) figure 8 rate their
understanding of the formula as satisfactory.
Figure 8: Understanding of the formula by teachers.
0 2 4 6 8 10 12 14 16
poor
fair
satisfactory
good
very good
No of teachers
rating
Understanding of the formula
8. Do you discuss the application of Doppler Effect in everyday life with your
learners?
Teachers had to choose from the following options: never, just mention in passing
and I discuss and tell them to access the internet. This question was chosen to
confirm whether teachers are complying with the learning outcomes or not. All the
three learning outcomes emphasise that the learner should apply knowledge in
everyday contexts.
Learners must be given the opportunity to experience science concepts through
laboratory activities and they must link these concepts to their daily life experiences

52
(Park et al., 2008). From the analysis, 6 teachers (18.8%, see figure 9) have never
discussed the application of Doppler Effect in everyday life with their learners.
Figure 9: Discussion of Doppler Effect in everyday life with learners
0
2
4
6
8
10
12
14
never just mention in passing
I discuss tell them to access the internet
No of teachers
teaching approach used
Discussion of Doppler Effect in everyday life with learners
9. Under your given working conditions, which do you think is important when
teaching the topic?
Teachers had to indicate, drilling learners, teach for understanding and rushing to
finish the syllabus.
The study has revealed that 31.2% (figure 10) of the teachers drill learners on past
examination papers, actually learners will be memorising terms, definitions and some
answers to certain questions. This reveals a more traditional teaching style. The
traditional teaching approach is in contradiction to the learner centred strategies
outlined in paragraph 2.2 subsection 2.2.4. It is evident from the analysis of the
results that those teachers (25%) who rush to finish the syllabus will not be using
learner centred teaching practices. It is encouraging to note that 14 teachers
(44.8%) taught for understanding and did not rush to finish the syllabus. According to
the subject advisor (appendix 11 lines 32-36), teachers should;
“Use learner centred methods, not just talking and talking, learners need to
participate, they must take part in the learning process, and science is a

53
practical subject. We would like teachers to carryout experiments to show
learners the practical side of the theories”.
Those teachers who rush to finish the syllabus could possibly not be teaching for
conceptual understanding.
Figure 10: What the teachers consider as important when teaching the Doppler Effect.
0 2 4 6 8 10 12 14
Rushing to finish syllabus
Teach for understanding
Drilling learners on past exam papers
No of teachers
teaching approach
What the teachers consider important when teaching
10. Have you ever been trained while you were still at college or university on the
topic Doppler Effect?
N=32
Table 8: Teacher training on the Doppler Effect
Yes 14
No 18
The issue of some teachers not understanding the topic (question 6 and 7) is now
answered by the teacher responses to this question. If 18 teachers (56.3%) (see
table 8), claim that they never did the topic at college or university and 53.1%
teachers in question 11 never attended workshops (see paragraph 2.2 sub-
section 2.2.2) on the topic Doppler Effect, then it is likely that they might not have
the necessary content knowledge to teach the topic.

54
11. How have organised workshops on Doppler Effect enhanced your teaching
skills on the topic?
Studies have shown that teachers gain professionally if they attend workshops
and seminars where there is cross-pollination of ideas with other teachers and
consultants (Loucks-Horsley, Hewson, Love, & Stiles, 1998). However, Ball,
Lubienski, & Mewborn (2001) argued that workshops just update teachers`
knowledge and do not provide platform for sustained learning on issues to do
with learners, curriculum and teaching approaches.
From the information obtained, teachers (53.1%, figure 11) never attended any
workshop on the topic and 9.4% claimed to have benefited very little from the
workshops. This information points to the need for professional development for
teachers.
Figure 11: The effect of organised workshops on teachers teaching skills.
0 5 10 15 20
Very little
little
a lot
Never attended workshops
No of teachers
teachers` comments
Effect of organised workshops on Doppler Effect on teachers` teaching skills.
12. Have you ever done any experiment/demonstration for your learners on the
Doppler Effect?
Studies indicated in the literature review (see paragraph 2.2) have shown that
learners understand better when they do activities, observe phenomena and

55
draw their own conclusions. The learning outcomes stated in the NCS (DOE,
2003) require that learners should be able to interpret and evaluate scientific and
technological knowledge and apply it to their daily lives. Science is a practical
subject and learners tend to understand the concepts better if they carry out
experiments which are relevant to the topic (Berenfeld et al., 2004). According to
Kimbrough (1995, p 172) learners perform better and develop positive attitudes
towards science when they perform practicals.
In this study, 71.9% (figure 12) of the teachers never did any demonstration/
experiment when teaching the topic Doppler Effect. Only 6.3% claim to always do
demonstrations/experiments when teaching the topic.
Figure 12: Experiments/demonstrations done for learners on the Doppler Effect.
0 5 10 15 20
sometimes
never
always
No of teachers
teachers` comment
Experiments/demonstrations done for learners on the Doppler Effect
13. Do you have access to computers to teach the topic?
In this modern world the use of computers has improved the teaching and
learning in schools. Students were found to achieve better in science after the
instruction using simulations and computer-aided-instruction (CAI), (Trey & Khan,
2008). Also, a meta-analysis of effectiveness of CAI proved that learners can

56
improve their performance in science (Bayraktar, 2001). Therefore, teachers
should make use of simulations in their lessons to enhance learner`s
understanding as the mentioned studies have shown.
However, the disadvantage of computer simulations is that learners do not get
real laboratory experience of handling the apparatus (Corter, Nickerson, Esche,
Chassapis, Im, & Ma, 2007). There has been an increased access to ICT in the
educational environment in other countries (Hartley, Treagust, & Ogunniyi, 2007).
In order for the learners to have a better understanding of the science concepts,
the teachers should teach using methods that combine modelling and
visualisation as opposed to traditional teaching practices (Gilbert et al., 2003).
The majority of the teachers (65.6%) (See table 9) have no access to a computer
laboratory, no access to internet, do not own personal computers and only 34.4%
do have access.
N=32
Table 9: Teachers` access to computers.
Total no of teachers
Yes 11
No 21
14. Are you using the computer to teach the Doppler Effect?
Although 11 of the 32 teachers (34.4%) (Table 8) do have access to computers
only 6 (18.75%) (Table 10) use a computer to teach the topic. Some of those
who use computers to teach the topic do so by showing learners the simulations
and the diagrams illustrating the Doppler Effect.

57
N=32
Table 10: Teachers` use of computers.
Total no of teachers
Yes 6
No 26
This is an alarming situation because according to Choi & Park (2003) computer
simulations simplify difficult experiments which are carried out in laboratories. This
study revealed that 81.3% (table 9) of the teachers do not use computers to teach.
Computer simulations generate high level of involvement; learners explore and
understand more regardless of their experience (Perkins & Wienman, 2006).
Jimoyiannis and Komis (2001) found that computer simulations are very effective in
the teaching and learning of physics. In this study, computer simulations were not
used by learners as part of the activities and are acknowledged as a limitation of the
study. The use of simulations to demonstrate the Doppler Effect phenomena have
therefore been suggested for future studies.
15. How would you comment on the text books that you have?
Science learning is conducted through the use of textbooks and this is considered as
a requirement for the production of scientists (Klassen, 2006). In addition to that
textbooks contain information and activities needed to acquire the desired learning
outcomes (Khutorskoi, 2006). Furthermore studies have revealed that textbooks are
used globally (Lemmer, Edwards, & Rapule, 2008; Stern & Roseman, 2001).
A significant number of teachers 37.5% (figure 13); do not have the required
textbooks. It is shown that 50% of the science text books in the schools are irrelevant
with regards to the content. Only 12 teachers indicated that they have enough and
relevant text books.
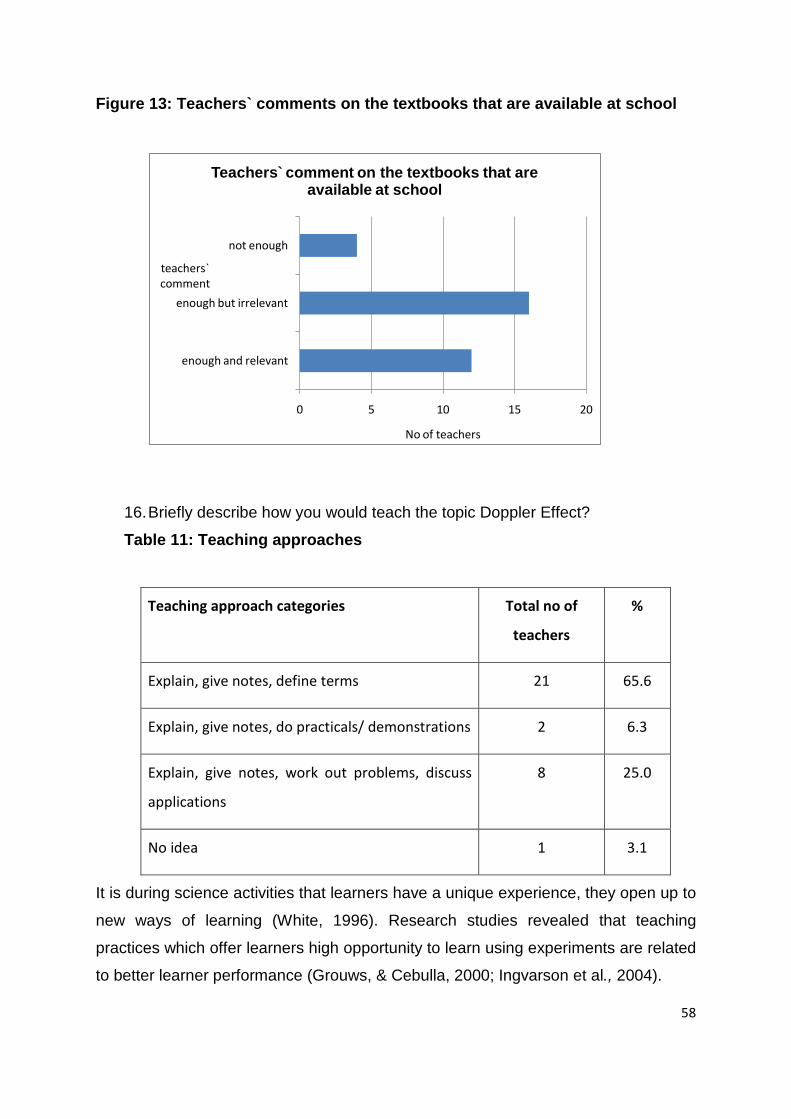
58
Figure 13: Teachers` comments on the textbooks that are available at school
0 5 10 15 20
enough and relevant
enough but irrelevant
not enough
No of teachers
teachers` comment
Teachers` comment on the textbooks that are available at school
16. Briefly describe how you would teach the topic Doppler Effect?
Table 11: Teaching approaches
Teaching approach categories Total no of
teachers
%
Explain, give notes, define terms 21 65.6
Explain, give notes, do practicals/ demonstrations 2 6.3
Explain, give notes, work out problems, discuss
applications
8 25.0
No idea 1 3.1
It is during science activities that learners have a unique experience, they open up to
new ways of learning (White, 1996). Research studies revealed that teaching
practices which offer learners high opportunity to learn using experiments are related
to better learner performance (Grouws, & Cebulla, 2000; Ingvarson et al., 2004).

59
From the information in the table 11, it is clear that the majority of the teachers (65.6
%) use traditional teaching approach, where they give explanations, notes and
define terms.
17. How would you know the learners understood the Doppler Effect?
Table 12: How the teacher evaluates learners on the topic.
Assessment categories Total no of
teachers
%
Giving tests, class work, homework 21 65.6
Asking of questions during lesson 5 15.6
Application of knowledge, discussions, correctly solved
problems
6 18.8
Assessment of learners can be either summative or formative. Teachers do
summative assessment when they gather evidence systematically and in a planned
way so as to draw inferences about the learner`s learning, based on their
professional judgements and to report at given times on learners achievement
(Garet, Porter, Desimone, Birman, & Yoon, 2001). Formative assessment is when
teachers and learners are involved to improve learning. This involves the
assessment of progress and analysing it, so as to improve the learner and for the
teacher to adopt effective teaching approaches to address identified needs (Borich,
1996).
Teachers were required to indicate the methods they use to assess their learners
from choices given in the questionnaire. In order to evaluate the learners`
understanding of the Doppler Effect 65.6% (table 12) of the teachers give tests, class
work and homework. Only 15.6% ask oral questions during the lesson to check on
the understanding of the learners.

60
18. Comment on the availability of science apparatus and equipment at your
school.
Table 13: Teachers` comments on availability of science equipment in their schools.
categories Total no of teachers %
No equipment/apparatus 23 71.8
Few, not enough 4 12.5
Enough equipment/apparatus 0 0
Available but irrelevant to the topic 5 15.6
Schools in rural areas have a shortage of science apparatus (Sadler& Tai, 2001),
and this is the case in some Vhembe rural schools. A large number of teachers
(71.8%) (Table 13) have indicated that their schools have no equipment/ apparatus
to use during science lessons. Despite the government`s claims of equipping
schools with science equipment (see question 4, paragraph 4.2) 23 teachers
indicated that they do not have science equipment at their schools. Greenwald,
Hedges, & Laine, (1996) in their study has revealed a relationship between school
resources (equipment) and learner achievement. The same study also points out
that a learner with resources performs better in the examinations. Not even a single
school in this sample has sufficient equipment. The schools located in poor rural
areas do not have enough equipment and they might not have a teacher exclusively
teaching Physics (Sadler & Tai, 2001). In this study, there were only 2 out of a total
of 10 teachers with degrees who are working in the rural areas (see appendix 15,
table 16).
According to the Department of Education, all schools have been provided with
equipment to do practical work (Strategic Plan 2007-2011). The then Minister of
Education Mrs Naledi Pandor said;

61
The sector (DOE) will receive more resources and relevant support to
ensure that all schools offer quality teaching and learning in
mathematics and science by qualified teachers. Schools will be
provided with adequate resources and facilities to enable them to
successfully teach these subjects.
However, according to this limited study it does not seem the case.
4.3 Phase 1: Results and analysis of interview with the subject advisor The subject advisor gave his responses which were transcribed (see appendix 11).
According to the subject advisor the challenges teachers experience in their practice
in the teaching of the Doppler Effect are:
i) Teachers lack content knowledge (see appendix 11 line 11) and that they are
under qualified to teach the subject.
ii) Calculations on the Doppler Effect and the use of the formula (line 23) and
also linking the theory with the practical real life situations for the learners to
understand (lines 24 and 25).
iii) Schools lack the necessary equipment to carry out the experiments during
lessons, the subject advisor said that; “we are aware that not all schools have
science equipment” (appendix 11 lines 36-37). In some cases the teacher is
left with no choice but to teach without performing any experiments or
demonstrations.
It can therefore be claimed that some of the challenges in teaching the Doppler
Effect are lack of teacher content knowledge and ineffective teaching approaches
(see paragraph 2.2 subsections 2.2.3 and 2.2.4).
4.4 Phase 2: Results and analysis of activity sheets and test
The usual time allocated to the teaching of the Doppler Effect is five lessons of 270
minutes (4 x 60 minutes plus one single lesson of 30 minutes). The activities
developed were tried out during two double lessons. The first lesson was a practical
lesson; learners were completing activity sheets (appendices 4, 5 and 6) as they

62
carried out the activities. The completed activity sheets were marked to quantify the
effectiveness of this teaching strategy. The marks were expressed in percentages.
The study used the theoretical framework (see paragraph 2.6) as a lens to look at
the development of EDR activities and how the practical links with the theory (tables
14 and 15). The “phenomenographic component” (description of the Doppler Effect
phenomena and lack of understanding of the concept) has led to the development of
“model” or EDR activities which were used in schools by learners which in turn led to
the “phenomenotechnic component” (knowledge of laboratory equipment and
development of practical skills).
In the second lesson learners were given a written test (appendix 12) on the Doppler
Effect in which they were required to solve mathematical problems involving the
Doppler Effect formula. The LO1 (paragraph 1.1) requires that learners should solve
problems in a scientific, technological and everyday contexts. The given questions
were typical of final examination questions in order for the learners to be familiar with
the questions to ensure that learners have appropriate practice before they write
their final examinations. The answers were marked out of 100. The analysis of the
results for the 2 trial schools were recorded (see table 14).
Table 14: Comparison on the learners` performance, in set activities and written test in 2 schools.
Mark range
Design based activities Written test
No of learners No of learners
School 1 School 2 School 1 School 2
90-100 0 0 0 0
80-89 1 1 0 0
70-79 1 3 0 1
60-69 3 4 1 1

63
50-59 4 3 1 4
40-49 5 3 3 7
30-39 2 5 7 3
20-29 2 3 3 5
10-19 0 1 2 1
0-9 0 0 1 1
18 23 18 23
% of learners
who got marks
above30
88.9
82.6
66.7
69.6
The results in table 14 show that learners in both schools performed better in
questions on activities (88.9% and 82.6%) than on the written test (66.7% and
69.6%). A possible reason for this result is that learners understand better and
perform better when they practically do the activity (Nui & Wahome, 2005). The two
teachers of these learners were from an urban school and a rural school and both
had more than 10 years experience with ACE diplomas.
Below are the changes made to the activities by changing the phrasing of questions
for clarity and to the type and usage of equipment in favour of those that were
available to teachers.
a) Cafeteria trays were replaced by ripple tanks for better observation of created
waves.
b) The eyedroppers were replaced by small plastic pipettes which were able to
produce constant supply of droplets at a faster rate.
c) Some schools were supplied with plastic pipettes, slinky, ripple tanks by the
researcher since they did not have them.

64
d) For the bicycle experiment, cell phones were used to supply a source of
sound since some schools did not have portable sirens.
Phase 3
The changes were implemented and the activities were tried in 10 schools. Teachers
were visited and consulted to ensure that the teachers in the schools were on the
same level in terms of teaching the Doppler Effect. The activities and what was
expected from them where clearly spelt out.
Table 15 show the results of the two marked activities for 10 schools with a total of
216 learners. The comparison was mainly on the learners` performance in the set
activities and written test and not on individual schools. The purpose of the
comparison was to establish a correlation between these two activities and to find
out in which of the two activities learners performed better. This was done to prove
on whether learners perform better on practical questions or on theoretical
questions. There was a discrepancy between the mean EDR activity scores and
written test scores and this might be due to:
• Learners understand more when they do hands-on experiments whilst making
their own observations than in tests where they are required to do problem
solving and interpret the phenomenon.
• During lesson activities learners share ideas whereas during tests they are
expected to work on their own.
Table 15: Graphical comparison on the performance of learners on EDR activities and problem solving in 10 schools (N=216).
Mark range
EDR activities Problem solving
Total learners %
Total learners
%
90-100 2 0.9 4 1.9
80-89 18 8.3 7 3.2

65
70-79 34 15.7 10 4.6
60-69 53 24.5 14 6.4
50-59 57 26.4 35 16.1
40-49 33 15.3 43 19.9
30-39 11 5.2 57 26.5
20-29 8 3.7 33 15.3
10-19 0 0 13 6.0
0-9 0 0 0 0
216 100 216 100
% No of
learners with
marks 40%
and above
91.2%
47.7%
Results on table 15 show that learners performed well in the EDR activities with
91.2% of the learners scoring marks above 40% and in written tests only 47.7% of
the learners scored above 40% mark. This might indicate (among other possible
factors) that learners understand more what they do (practically) than the solving of
theoretical problems.

66
Figure 14: Comparison of marked EDR activities and marked test given to learners (N=216).
0
10
20
30
40
50
60
0-9
.10-
1920
-29
30-3
940
-49
50-5
960
-69
70-7
980
-89
90-1
00
no o
f lea
rner
s
mark range as a percentage
comparison of marked EDR activities and marked test given to learners
Design-based activities
Written test
Pearson`s product moment Correlation r = 0.65 (see appendix 13) indicates a high
correlation (Mulder, 1993) between student EDR activities and the written tests.
These results are supported by the subject advisor (appendix 11, line 42) that
learners will understand more what they see and do. They performed poorly in their
tests compared to the activities and this might be due to the poor understanding of
the formula and concepts (appendix 11, line 23). Also the teachers themselves were
partly to blame because only 9.4% (see paragraph 4.2) of the teachers can interpret
the Doppler Effect formula.

67
4.5 Phase 3: Results and analysis of learner and teacher interviews
After the activity based lesson, some of the learners and the teachers were randomly
selected for interviews for the purposes of evaluating the lessons, based on the
geographical position of the school (urban, semi-rural and rural). Three teachers and
three learners were interviewed from different schools. The results of the analysis of
responses are not generalised because only 3 out 216 learners were interviewed.
Teachers` question: What is your opinion on the lesson?
The following were the responses given by the teachers. Some of the statements
were made in Tshivenda language, the English translation is in brackets.
Teacher A:
The lesson was good, learners enjoyed a lot, and even my usually sleeping
friends (learners) were awake today.
Teacher B:
It was nice it makes teaching much easier mara (but) you cannot do this all
the time , look, we don’t have apparatus here also zwia dzhia tshifhinga u
lugisela ( it takes a lot of time to prepare) but it’s very good.
Teacher C:
I have never seen my learners so happy, we have seen these things first time
today, ripple tanks , spring and all that, the topic becomes easy, but I have
many learners the syllabus is long you know, on top of that we don’t have
these apparatus, if I do this every day I will not finish the syllabus.
The three learners interviewed were from rural, semi-rural and urban areas.
Learners’ question: How was the lesson?
Learner X:
Yovha i ya vhudi nga maanda, arali ri tshi khou guda nga heyi ndila, ngoho ri
do pfasa. (The lesson was very good, if we were to continue learning in this
way, truly we will pass).
Learner Y:

68
Our teacher does not use your (referring to researcher) things, he teaches
and teaches, zwi songo pfara, zwitshi khou konda, mara today ndo
zwipfesesa. ( our teacher does not use your equipment, it was difficult to
understand, but today I understood).
Learner Z:
Yova ya vhudi badi. Zwi khou pfara arali ri tshi khou shumisa hezwi zwithu (it
was very good. It is easier to understand when we use these apparatus) it
was ok, very ok.
In summary the teachers enjoyed the activities but they had the following concerns:
• The activities take a lot of time to prepare; they might not finish the syllabus.
• They do not have the apparatus.
The demand to increase pass rate from the Department of Education (see paragraph
2.2.4) has led teachers to use traditional teaching approaches which could possibly
not be beneficial to learners. Learners will understand more when they use activities
during their lessons, (Park et al., (2008); Berenfeld et al., (2004) and Kimbrough
(1995)).
The learners said that it was easier to understand the topic when using EDR
activities. The reason why they performed badly in tests might be that learners have
some difficulties with understanding the concepts (Thornton & Sokoloff, 1998). The
fact that teachers indicated that they did not understand the Doppler Effect formula
(see paragraph 4.2 question 7) implies that their content knowledge is questionable
and that their lesson might not have been effective.
4.6 Summary of findings
According to the research methodology (paragraph 3.5) this study was done in three
phases. Phase 1 was the establishment of the baseline using a questionnaire with
18 questions which was completed by the teachers and an interview conducted with
the subject advisor. In phase 2, activities were developed and tried out in 2 schools.
Finally in phase 3, the redeveloped activities were tried out in 10 schools in which
learners completed activity sheets and wrote a test and both were marked and

69
analysed. Interviews were conducted with 3 learners but because the sample is too
small no inferences/conclusions could be made from these interviews.
Therefore in order to answer the first research question namely;
1. Which aspects of the topic Doppler Effect do the teachers find challenging?
a) What are the challenges that the teachers have in terms of content
delivery?
b) Which teaching methods do teachers use when delivering lessons on the
Doppler Effect?
Data collected from the teachers` questionnaire, interview with the subject advisor,
was analysed. From the teacher`s questionnaire the following information is
highlighted:
The majority of teachers (50%) have an ACE teaching qualification (See appendix 15
table 16). This could be a problem regarding teachers` lack of content knowledge
and has been reflected by teachers` lack of confidence in teaching the Doppler
Effect. The total percentage of teachers who find the topic Doppler Effect difficult and
very difficult is 62.5%. This could explain why learners also perform badly in this
topic (paragraph 4.2 question 6). When teachers were asked how they would rank
their understanding of the formula describing the Doppler Effect 53.1% indicated only
a “satisfactory” and only 9.4% understood and could interpret the formula.
In terms of professional development, little assistance is given to teachers. A total of
53.1% of the teachers have never attended any workshop on Doppler Effect and
9.4% who attended indicated that they benefited very little from the workshop.
Physics is a practical subject and it has to be taught as such, the study revealed that
71.9% have never done any experiments or demonstrations on the Doppler Effect.
On the issue of textbooks, 50% teachers indicate that there are enough books but
irrelevant in the sense that they do not have information on the Doppler Effect.
Studies (paragraph 4.2 question 15) have shown the importance of textbooks to
learners.
The teacher needs to transform the knowledge of the content into a structure that the
learners can understand (Shulman, 1986) by using effective teaching approaches.
On teaching approaches, 65.6% gave explanations, definition of terms and notes to

70
learners. A significant number (18.8%) of teachers were not linking the concepts to
learners` everyday experiences. The data reveal that there is limited teaching for
understanding because 25% of the teachers indicated that they rush to finish the
syllabus and 31.2% concentrated on drilling the learners on past examination
papers.
Only 6.3% do demonstrations apart from giving notes and explanations. The cause
of not doing demonstration/practicals might be that of lack of apparatus and
equipment, since 71.8% said they don’t have apparatus/equipment at all.
Interviewing involved asking of questions orally to respondents and its limitation was
the small sample. An interview was conducted with the subject advisor who also
pointed to the lack of content knowledge of the teachers (appendix 11 lines 11, 16,
17 and 27 ) and lack of science equipment in schools (appendix 11 lines 36-38) as
factors contributing to the poor performance of learners in the examinations.
The second research question was;
What is the effectiveness of teaching the Doppler effect using developed learner-centred activities? The developed activities were effective; the learners enjoyed the lessons and
performed well in the marked activities. This finding confirmed the findings of other
researchers (Berenfeld et al., 2004; Ingvarson et al., 2004; Kimbrough, 1995).
The data collected from 216 learners indicated that only 8 (3.7%) learners got below
30% when activity sheets where marked. Whereas when tests results were analysed
46 (21.3%) learners got below 30% pass mark (paragraph 4.4 table 14). The better
performance of learners in the activities indicated to an extent their effectiveness.
When interviewed after the lesson in which learners used EDR activities (paragraph
4.5), all 3 learners said they enjoyed the lesson and that they understood the
concepts more when they used the equipment to do the demonstrations. However,
there was still a problem that the learners could not answer all questions in the
written tests correctly as good as they did on the practical activities (Angell et al.,
2004; Trey & Khan, 2008). The possible reason might be that they did not
understand the topic.

71
4.7 Summary This chapter presented the results and the analysis of the questionnaire for teachers,
interview with the subject advisor and activity sheets and test. Finally, a summary of
the findings was done.
4.8 Projection for the next chapter
The implications of the analysis of the results and findings will be discussed in the
next chapter. Conclusions and recommendations for further study are also
presented.

72
CHAPTER 5: DISCUSSIONS AND CONCLUSIONS
5.1 Introduction
This chapter presents answers to the research questions and provides a summary,
conclusions and discussions. The chapter ends by giving some recommendations
and concluding remarks.
5.2 Summary
Teaching of Science
Science education need to be improved by the science community to make it
effective and relevant, improving science education would produce more scientists
and engineers (Wieman & Perkins, 2005). The teachers are the key contributors to
the transformation of education and they are expected to be qualified, competent,
dedicated and caring for their learners (Department of Education, 2003).
A teacher needs amongst others:
• Content knowledge which consists of mental representation of ideas that the
teacher has constructed on the subject (van de Walle, 2004). Lack of content
knowledge by the teacher will hinder his/her effectiveness and
competitiveness (see paragraph 2.2 sub section 2.2.3). The teachers who
took part in the study had the following qualifications; 6 with diplomas, 16 ACE
qualification and 10 had science degrees. However, 20 teachers found the
topic Doppler Effect difficult (and very difficult) to teach (paragraph 4.2,
question 6). In addition, 17 teachers rated their understanding of the formula
as satisfactory and only three teachers said that their understanding of the
formula was very good (paragraph 4.2, question 7). Therefore, the majority of
the teachers lacked content knowledge of the subject.
• Teaching approaches: It is important for a teacher to have a variety of
teaching approaches depending on what the teacher wants to achieve. The
study revealed that teachers were not using learner centred teaching
approaches, 8 teachers would rather rush to finish the syllabus and 10
teachers would drill the learners on past examination papers. Of serious

73
concern is that 23 teachers (see paragraph 4.2 question 12) indicated that
they have never done any experiment or demonstration on the Doppler Effect
with their learners. Doing activities contributes to a learner centred lesson.
• Curriculum: The Department of Education in every country describe their
curriculum. The curriculum in South Africa has changed several times and the
NCS curriculum had its first examination written in 2008. The activities set in
this study are in support of the LO’s of the physical science as set out by the
Department of Education, (2003). Both the NCS curriculum and OBE
approach, point to the importance of a learner centred approach.
• Professional development: In Vhembe District teachers are encouraged to
enrol for further studies. According to the subject advisor the DOE is having
logistical challenges in organising and executing effective workshops for
teachers (see appendix 11 lines 46-48).
• Resources: Textbooks and science equipment are necessary for the effective
learning of science (see paragraph 4.2 questions 15 and 18). In Vhembe the
situation is bad; 16 teachers say the textbooks are there but not relevant with
regards to the Doppler Effect. Equally bad is the fact that 23 teachers out of
32 teachers indicate that they do not have science equipment at all. As a
result, this study has contributed to development of activities for use in
schools so that learners are actively involved in the learning process.
EDR Activities
The activities were developed to integrate content knowledge, learner centred
approach and all LOs. The use of apparatus that are not expensive yet readily
available was incorporated. The activities were tried out in 2 schools and the refined
activities were then tried out in 10 schools. Learners performed well and this was
reflected in the presentation of their achievement in the marked activity sheets.
Results of the analysis of the questionnaire have revealed the teaching approaches
which some teachers used. Some teachers are still using the traditional teaching
methods and are neglecting the three physical science learning outcomes. The study
has revealed that the learners understand more and perform actively when the
lesson is taught using EDR activities. There is a direct correlation between EDR

74
activities and solving of problems on the topic Doppler Effect. Those learners who
did well in practical activities also did well in the test. However, the learners scored
high marks in EDR activities indicating that the topic can be understood more when
learners actively participate in the learning process. The teachers lack the content
knowledge of the topic and they found the topic difficult to teach.
The theoretical framework guiding the study was formulated in chapter two which
enabled the researcher to keep focused on the link between the theory and the
developed EDR activities.
As regards the empirical referent, the learners were able to manipulate apparatus,
which meant they possessed the phenomenotechnic component (experimental
ability). What learners require is science equipment and clear instructions to guide
them. Learners confirmed that they understood better the Doppler Effect phenomena
when they carried out the activities (i.e. the phenomenological component). They
were able to explain, describe and interpret the Doppler Effect phenomenon (i.e. the
interpretive elaboration). What was encouraging was that learners were able to
explain the meaning of the symbols in the Doppler Effect formula and to draw
diagrams representing sound waves. Finally, the learners were able to merge the
theory and experimental knowledge in constructing their knowledge (cognitive
matrix).
5.3 Conclusions
Content knowledge:
A significant number of teachers find the topic Doppler Effect difficult to teach. The
Subject Advisor also indicated that teachers do lack content knowledge of the topic.
As a result the teachers rush to finish the syllabus and some resort to drilling the
learners on past examination papers.
This topic was not dealt with by some of the teachers in their initial training at
Colleges. The majority of teachers have never attended any workshops on the
Doppler Effect in this district. Those who attended the workshop indicated that they
benefited very little. According to the subject advisor there have been challenges
such as time and resources in organising workshops on the topic to assist the
teachers.

75
Teaching approach:
The findings indicate that the teachers do not use learner centred approaches.
The majority of the teachers fail to do class demonstrations/practical activities citing
lack of apparatus as the main cause. The findings show that the teachers have never
done any experiment/demonstrations when teaching the Doppler Effect. A significant
number of teachers never discuss applications of the Doppler Effect in everyday life
with their learners.
Activities and written tests:
The performance of learners in the given developed activities was good (see
paragraph 4.4 table 14). The learners were actively participating in the learning
process (paragraph 4.5) as seen by the fact that they all participated in the activities
and completed the activity sheets. The learners were empowered with the learning
outcomes (see paragraph 1.1) in physical science. There is a high correlation (r =
0.65) between activities and the written tests. Some learners who did well in activity
questions also performed well in solving of problems on the Doppler Effect.
5.4 Discussion
The study investigated the challenges and prospects of teachers when teaching the
Doppler Effect to grade 12 learners. Challenges such as lack of content knowledge
and hence confidence in teaching the topic were prevalent. The majority of the
teachers were in need of professional development in order to acquire the needed
skills, content knowledge and effective teaching approaches. In addition the teachers
faced the challenge of the lack of science laboratories, science equipment and
textbooks.
Prospects in teaching the Doppler Effect by means of the developed activities seem
to be effective. Teachers were provided with handouts that supplied them with the
necessary content knowledge as well as introducing learner centred activities. The
learners enjoyed the activities and they understood the concepts better (see
paragraph 4.6) when they observed demonstrations and actually handled the
apparatus doing the experiment by themselves (Grouws, & Cebulla, 2000; Ingvarson
et al., 2004).

76
5.5 Recommendations
1. Recommendations for practice: Implications for teaching and learning.
Professional development programmes should enhance teachers’ content
knowledge. Science is dynamic and therefore teachers use new effective
teaching approaches. According to this study the professional development
with regards to workshops was not effective in the Vhembe district. This
agrees with earlier findings by Little & McLaughlin (1993) that professional
development for teachers was not effective. Professional development
programmes should include teaching activities in their lessons for better
understanding of the science concepts by the learners and engage learners’
hands on and minds on during the lessons. In addition, teachers need to
teach for understanding and opportunities should be offered for lifelong
learning experiences.
2. Recommendations for the design of learner activities
To facilitate conceptual understanding the activities should be designed
making use of materials which are readily available within learners`
environment. The physical phenomenon being studied should be linked to the
learners` everyday experiences and examples to be drawn from what they
observe in the area in which they live.
3. Recommendations for further research
This study recommends that future researchers should use a bigger sample of
teachers and learners. During the development of the design-based activities,
teachers should be involved so as to instil a sense of ownership in them. The
activities are not to be imposed on them but produced by the teachers
themselves. Also when designing learner activities the researcher should take
into consideration the science equipment available in targeted schools. Most
secondary schools in Vhembe district have computers therefore; this study
recommends computer simulations on the Doppler Effect to be used together
with hands on practical experiments.

77
5.6 Concluding words
This study is the first of its kind in the selected district in the Limpopo province.
Therefore, in order to make a meaningful contribution to the community, an
instructional manual on the Doppler Effect has been produced. This study has also
proved that a laboratory is not a requirement to conduct experiments on the Doppler
Effect. Moreover, the learners understood more by using the materials in their
environment and their everyday experiences.

78
REFERENCES
• Alexander, P., & Murphy, P. (2000). The research base for APA's leaner-
centered psychological principles. In N. Lambert, & B. McCombs (Eds.), How
students learn (pp. 25-60). Washington, D.D.: American Psychological
Association.
• Andriessen, D. (2007). Combining design-based research and action research
to test management solutions. Paper presented at the 7th World Congress
Action Learning, Action Research and process Management, Groningen, 22-
24 August, 2007. Holland.
• Angell, C., Guttersrud, Q., Henriksen, E. K., & Isnes, A. (2004). Physics:
Frightful, But Fun. Pupils and Teachers` View of Physics and Physics
Teaching. Science Education. 88, pp 683-706.
• Arion, D., Crosby, K., & Murphy, E. (2000). Case study experiments in the
introductory Physics curriculum. The Physics teacher, 38(6), 373-376
• Babbie, E., & Mouton, J. (2009). The practice of social research. Oxford
University Press. South African Edition.
• Ball, E.R., Lubienski, S. T., & Mewborn, D. S. (2001). Research on teaching
mathematics: The unsolved problem of teachers` mathematical knowledge. In
V. Richardson (Ed.), Handbook of research on teaching. Washington DC:
AERA.
• Barab, S., & Squire, B. (2004). Design-based research: Putting a stake in the
ground. The Journal of the Learning Sciences, 13 (1), 1-14. Retrieved
January, 2011 from http://inkido.education.wisc.edu/kdsquire/manuscripts/jls-
barab-squire-design.pdf.
• Bayraktar, S. (2002). A meta-analysis of the effectiveness of computer-
assisted instruction in science education. Journal of Research in Technology,
34(2), 173-188.
• Berenfeld, B., Pallant, A., Tinker, B., Tinker, R., & Xie, Q. (2004). From
genetic code to protein shape using dynamic modelling. Proceedings of the

79
77th Annual Meeting of the National Association for Research in Science
Teaching (NARST), Vancouver, Canada.
• Berns, B. B., & Swanson, J. (2000). Middle School Science: Working in a
confused context. Paper presented at the annual meeting of the American
Educational Association, New Orleans, L.A.
• Betts, J. R., Zau, A. C., & Rice, L.A. (2003). Determinants of student
achievement: New evidence from San Diego. San Francisco, CA: Public
Policy Institute of California.
• Bless & Higson-Smith. (1995). Fundamentals of Social Research Methods. An
African perspective. Second Edition. Juta.
• Blumberg, P. (2008). Developing Learner-Centered Teachers: A Practical
Guide for Faculty. San Francisco: Jossey-Bass.
• Borich, G. (1996). Effective teaching methods (3rd Ed). New York: Macmillan
• Brown, C. A., Smith, M. S., & Stein, M. K. (1995). Linking teacher support to
enhanced classroom instruction. Paper presented at the annual meeting of
the American Educational Research Association. New York.
• Bybee, R.W. (1997). Achieving scientific literacy: From purposes to practices.
Portsmouth, NH: Heineman.
• Chandralekha, S., Laura, M., & Christian D. S. (2010). Introduction to Physics
teaching for Science and Engineering undergraduates. Retrieved May 22,
2010 from http://www.phy.ilstu.edu.jpteo/
• Choi, E., & Park, J. (2003). Conditions for the Effective use of Simulations and
its Applications to Middle-School Physics Inquiry Activities. Journal of Korean
Physical Society, 24 (3), 318-324.
• Cobb, P., Confrey, J., diSessa, A., Lehrer, R., & Schauble, L. (2003). Design
Experiments in Educational Research. Educational Researcher, 32(1), 9-13.
Retrieved November 18, 2010 from http://er.aera.net
• Collias, K., Pajak, E., & Rigden, D. (2000). One cannot teach what one does
not know: Training teachers in the United States who know their subjects and
know how to teach their subjects. Retrieved January 17, 2011, from
http://www.c-b-e.org/PDF/OneCannotTeach.pdf.

80
• Corter, J. E., Nickerson, J. V., Esche, S. K., Chassapis, C., Im, S., & Ma, J.
(2007). Constructing reality: A study of remote, hands-on, and Simulated
Laboratory. ACM Transactions on Computer-Human Interaction, 14(2), 4-25.
• Darling-Hammond, L. D. (1997). The quality of teaching matters most. Journal
of Staff Development, 18(1), 38-41
• Darling-Hammond, L.D. (2000). Teacher quality and student achievement: A
review of state Policy Evidence, Educational Policy Analysis Archives, 8(1), 1-
44 from http://epaa.asu.edu/epaa/v8nl/
• Department of Education, (2003). National curriculum Statement Grades 10-
12 (General). Physical Sciences. Government printer Pretoria.
• Department of Education, (2010). Curriculum and assessment Policy
Statement (CAPS). Government printer Pretoria.
• Department of Education, (2011). Educational measurement, Assessment
and public examinations. Report on the national Senior Certificate
Examination Results. Republic of South Africa.
• Design-based Research Collective. (2004). Design-Based Research: An
emerging paradigm for educational inquiry. Educational Researcher, 32(1), 5-
8.
• Edelson, D.C. (2002). Design research: What we learn when we engage in
design. The Journal of the Learning Sciences, 11(1), 105-121
• Erikcson, G. (2001). Research programs and the students` science learning
literature. Improving science education. In R. Millor, J. Lemch, & J. Osborn
(Eds.), The Contribution of Research. pp271-292. Buckingham: Open
University Press.
• Farrow, K. M. (1999). The relationship of science teachers` beliefs to their
classroom strategie. In Wahyudi (2004). Investigation of teaching and learning
science in two rural secondary schools in Indonesia form cooperative learning
perspective. Retrieved October 10, 2010 from
http://www.iasce.net/Conference2004/Conference2004Program.shtml.
• Flick, L. B. (1993). The meanings of hands-on science. Journal of Science
Teacher Education, 4 (1), 1-8. Also reprinted in Rezba, R. (1994). Readings

81
for teaching science in elementary and middle schools. Dubuque, IA:
Kendall/Hunt Publishing Company.
• Flick, L. B. & Bell, R. (2000). Preparing Tomorrow`s Science Teachers to use
Technology; Guidelines for Science Educators. Contemporary Issues in
Technology and Teacher Education. 1(1). Retrieved January 24, 2012 from
http://www.citejournal.org/vol1/iss1/currentissues/science/article1.htm
• Fonseca, J. M. B. & Conboy, J. E. (1999). Introductory physics for nonphysics
majors- A case study: Continuous engagement and a supportive environment-
Reversing negative trends at a Portuguese University. Journal of College
Science Teaching, 272-277
• Friedler, Y. & Tamir, P. (1990). Life in science laboratory classrooms at
secondary level, in Hegarty-Hazel, E (Ed.) 1990. The student laboratory and
the science curriculum, London: Routledge, pp 337-356
• Fullan, M. G. (1991). The meaning of educational change. New York:
Teachers College Press.
• Ganaras, K., Dumon, A., & Larcher, C. (2008). Conceptual integration of
chemical equilibrium by prospective physical science teachers. The Royal
Society of Chemistry 2008, 9, 240-249.
• Garet, M. S., Porter, A. C., Desimone, L., Birman, B. F., & Yoon, K. S. (2001).
What makes professional development effective? Result from a national
sample of teachers. American educational research journal, 38(4), 915-945.
• Gavaghan, H. (1997). Invasion of Dragons needed. Nature. 390, pp 203-204.
• Gibbs, K. (1997). Advanced Physics. Second Edition. Cambridge University
Press.
• Gilbert, J. K., Justi, R., & Aksela, M. (2003). The visualisation of models: A
metacognitive competence in the learning of chemistry. Paper presented at
the 4th European Science Education Research Association.
• Gimenez, M. H., Vidaurre, A., Riera, J., & Monsoriu, J. A. (2008). Visualising
the Doppler Effect. Latin-American Journal of Physics Education, 2(1), 37-39.
• Grayson, D. J. (1996). A holistic approach to preparing disadvantaged
students to succeed in tertiary science studies. Part I. Design of the Science

82
Foundation Programme (SFP). International Journal of Science Education,
18(8), 993-1013.
• Greemwald, R., Hedges, L. V., & Laine, R. D. (1996). The effect of school
resources on student achievement. Review of Educational research, 66(3),
361-396.
• Grossman, P. L. (1990). The making of teacher: Teacher knowledge and
teacher education. New York: Teachers College Press.
• Grouws, D. A. & Cebulla, K. J. (2000). Improving students` achievement in
mathematics Part 1: Research findings. Columbus OH: Eric/Csmee.
• Hand, B., & Vance, K. (1995). Implementation of constructivist approaches
within the science classroom. Australian Science Teachers Journal. 41(4), 37-
43
• Hartley, M. S., Treagust, D. F., & Ogunniyi, M. B. (2007). The application of a
CAL strategy in science and mathematics for disadvantaged grade 12
learners in South Africa. International Journal of Educational Development
(doi:1016/j.ijedudev. )
• Hegarty-Hazel, E. (1990). Learning technical skills in the science laboratory,
in Hegarty-hazel, E. (Ed.) 1990. The student laboratory and the science
curriculum, London: Routledge, pp75-94
• Hein, G. E. (1996). Constructivist learning theory. The Museum and the needs
of the people CECA (International Committee of Museum Educators)
Conference. Jerusalem, Israel, 15-22 October, 1991. Exploratorium, 3601
Lyon St., San Francisco. Retrieved September 12, 2011 from
http://www.exploratorium.edu/ifi/resources/constructivistlearning.html
• Hendricks, A., Sadeck, M., & Spies, A., (2007). Focus on Physical Sciences
Grade 12. Maskew Miller Longman, Cape Town, p54.
• Hendry, G. D. (1996). Constructivism and educational practice. Australian
Journal of Education. 40(1), 19-45
http://www.teachernet.gov.uk/docbank/index.cfm?id=4129
• Ingvarson, L., Beavis, A., Bishop, A.., Peck, R., & Elsworth, G. (2004).
Investigation of Effective Mathematics teaching and learning in Australian
Secondary Schools. Australia: Australian Council for Educational Research.

83
• Jimoyiannis, A., & Komis, V. (2001). Computer simulations in physics
teaching: a case study on students` understanding of trajectory motion.
Computers and Education, 36, 183-204.
• Johnson, B., & Christensen, L. (2000). Educational Research: Quantitative
and Qualitative approaches. Allyn & Bacon, Boston.
• Joyce, B., & Showers, B. (1988). Student Achievement Through Staff
Development. New York: Longman
• Juuti, K., & Lavonen, J. (2006). Design-based Research in Science
Education: One Step Towards Methodology. University of Helsinki, Finland.
Nordina
• Khutorskoi, A. V. (2006). The place of the textbook in the didactic system.
Russian Education and Society 48(3), 78–93.
• Kibler, R. J., Cegala, D. J., Watson K.W., Barkel, L.L., & David, T. M. (1981).
Objectives for instruction and evaluation. Allyn and Bacon Inc. Toronto, USA
• Killen, R. (2007). Teaching Strategies for Outcome-Based Education. (2nd
ed.). Juta & Co. Ltd.
• Killoran, I. (2003). Why is your homework not done? How theories of
development affect your approach in the classroom. Journal of Instructional
Psychology, 30(4), 309-315
• Kimbrough, D. R. (1995). Project design factors that affect student
perceptions of the success of a science research project. Journal of Research
in Science Teaching, 32 (2), 157-175
• King, E. A. (2002). Science teachers `belief about teaching and reform: Case
studies from a restructured high school. In Wahyudi (2004).
Investigation of teaching and learning science in two rural secondary schools
in Indonesia from cooperative learning perspective.
http://www.iasce.net/Conference2004/Conference2004Program.shtml.
• Klassen, S. (2006). A theoretical framework for contextual Science teaching.
Interchange, 37(1–2), 31–62.
• Kriek, J. (2005). Construction and evaluation of a holistic model for the professional development of physics teachers via distance education. Unpublished doctoral dissertation, University of South Africa, South Africa.

84
• Kriek, J., & Basson, I. (2008). Implementation of the new FET Physical
Sciences curriculum: teachers' perspectives. African Journal of Research in
Mathematics, Science and Technology Education, 12, 63 – 76
• Kriek, J., & Grayson, D. J. (2009). A holistic professional development model
for South African physical science teachers. South African Journal of
Education 29(2), 185 - 204.
• Lambert, N., & McCombs, B. (2000). Introduction: Learner-centered schools
and classrooms as a direction for school reform. In N. Lambert, & B.
McCombs (Eds.), How students learn (pp. 1-15). Washington, D.C.: American
Psychological Association.
• Lemmer, M., Edwards, J.A., & Rapule, S., (2008). Educators’ selection and
evaluation of Natural Science textbooks, South African Journal of Education
28, 175–187.
• Lemke, J. L. (1990). Talking science: Language and learning values,
Norwood, N J: Ablex Publishing.
• Levine, D. (1985). Improving student achievement through Mastery
programmes. San Francisco: Jossey-Bass
• Little, J., & McLaughlin, M. (Eds.). (1993). Teachers` work: Individuals
colleagues and context. New York: Teachers College Press.
• Lombard, k., & Grosser, M. (2008). Critical thinking: are the results of OBE
failing us or are we failing the ideals of OBE? South African Journal of
Education. 28 (4).
• Loucks-Horsley, S., Hewson, P. W., Love, N., & Stiles, K. E. (1998).
Designing Professional development for teachers of science and
mathematics. California: Crownin Press, Inc.
• Lowe, T. L., & Rounce, J. F. (1997). Calculations for A-Level Physics. (3rd
ed.). Stanley Thornes (Publishers) Ltd.
• Luke, L. (2010). Self-monitoring to minimize student resistance to inquiry.
Retrieved January 18, 2011, from http://www.phy.ilstu.edu.jpteo/
• Ma, X., & Wilkins, J. L.M. (2002). The development of science achievement in
middle and high school: Individual differences and school effects. Evaluation
Review, 26(4), 395-417.

85
MacBeath, J., & Galton, M. (2004). With Susan Steward, Charlotte Page and
Janet Edwards. A Life in Secondary Teaching: Finding Time for Learning
(Cambridge: Cambridge Printing) Report for National Union of Teachers.
Retrieved July 10, 2011 from www.educ.cam.ac.uk/download/aLiSTreport.pdf
• Makgato, M., & Mjii, A. (2006). Factors associated with high school learners`
poor performance: a spotlight on mathematics and physical science. South
African Journal of Education, 26(1), 253-266.
• Maxwell, W. E. (1998). Supplemental instruction, learning communities and
students studying together. Community College Review (Fall), retrieved
September, 3, 2011 from www.findarticles.com
• Mayer, D., Mullens, J & Moore, M. (2001). Monitoring school quality: An
indicators report. Education Statistics Quarterly, 3(1), retrieved October 5,
2010,from http://nces.ed.gov/programs/quarterly/vol_3/3_1/q4_4asp#top>
• Mayo, P., Donnelly, M.B., Nash, P.P., & Schwartz, R.W. (1993). Student
perceptions of tutor effectiveness in problem based surgery clerkship.
Teaching and learning in Medicine, 5(4), 227-233
• Mbajiorgu, N., & Reid, N. (2006). Report of literature review. Factors
influencing curriculum development in Higher Education Physics. Centre.
Unversity of Glasgow, Higher Education Academy Physical Sciences.
• McDermott, L. C. (1998). Research in physics education.APS News 7(1),
1998; Education Outreach, p.8
• Mulder, J. C. (1993). Statistical techniques in education. Soft cover edition.
Haum Tertiary Publishers.
• National Research Council (2005). How students learn. History, Mathematics,
and Science in the classroom. Donovan, M., S & John D. Bransford, J., D.
(Eds.); Committee on how people learn, A targeted report for teachers,
Washington, DC: National Academy Press.
• Ng`ambi, D., & Johnston, K. (2006). An ICT-mediated Constructivist Approach
for increasing academic support and teaching critical thinking skills.
Educational Technology & Society, 9(3), 244-253.
• Nieveen, N. (2007). Formative Evaluation in Education Design Research. An
Introduction to Educational Design Research. Proceedings of the seminar

86
conducted at the East China Normal University, Shanghai (PR China),
November 23-26, 2007
• Nui, N. W., & Wahome, A. N. (2005). SMASSE Project. Strengthening of
Mathematics and Sciences in Secondary education. Kenya.
• Osborne, J. (1996). Untying the Gordian knot: Diminishing the role of practical
work. Physics Education. 31(5), 271-278.
• Pangratios, P. (2010). A visual demonstration of the Doppler Effect. The
Physics Teacher, 48(6), 428.
• Park, H., Khan, S., & Petrina, S. (2008). ICT in Science Education: A quasi-
experimental study of achievement, attitudes toward science, and career
aspirations of Korean middle school students. International Journal of Science
Education, iFirst Article, 1-20.
• Patterson, M. (2010). Understanding Doppler Effect. Retrieved January 31,
2011 from,
http://www.schools.utah.gov/curr/sci/GIST/Understanding%20Doppler%20Eff
ect%20.pdf.
• Perkins, K., Adams, W., Dubsom, M., Finkelstein, N., Reid, S., Wieman, C. &
LeMaster, R. (2006). PhET: Interactive simulations for Teaching and Learning
Physics. The Physics Teacher, 44(1), 18-23.
• Ping, Z-L. (2002). Changing the approach. Physics Education, News, p 182
• Rapudi, M. A. (2004). The effects of cooperative learning on the development
of learners` science process skills: a case study. MED thesis in Natural
Science Education. University of South Africa, Pretoria.
• Rice, J. K. (2003). Teacher quality: Understanding the effectiveness of
Teacher attributes. The Economic Policy institute. Retrieved October 12, 2010
from http://epinet.org/content.cfm?id=1500.
• Romme, A. G. (2003). Making a difference: Organisation as design.
Organisation Science: A Journal of the Institute of Management Sciences, 14,
558-573.
• Ryder, M. (2011). Instructional Design models and theories. Retrieved
November 2, 2011 from

87
http://www.instructionaldesigncentral.com/htm/IDC_instructionaldesignmodels
.htm
• Sadler, P. M., & Tai, R. H. (2001). Success in Introductory college physics:
The role of high school preparation. Science Education, 85(2), 111-136.
• Sandoval, W. A., & Bell, P (2004). Design-Based Research Methods for
Studying Learning in Context: Introduction. Educational Psychologist, 39(4),
199-201
• Schmidt, W., & Cogan, L. (1996). Development the TIMSS Context
questionnaires, in M. Martin & D. Kelly, (eds.). Third International
Mathematics and Science Study (TIMSS) Technical report, Volume 1: Design
and Development, Boston College, Chestnut Hill, MA.
• Sekaran, U. (2000). Research methods for business. New York: John Wiley &
Sons, Inc.
• Shulman, L. S. (1987). Knowledge and teaching: Foundations of the new
reform. Harvard Educational Review, 57(1), 1-22.
• Slavin, R. E. (1990). Cooperative learning theory, research and practice.
Needham Heights, MA: Allyn and Bacon.
• Smith, D. L., & Lovat, T. J. 1995. Curriculum Action on reflection revisited.
Third edition. Katoomba: Social Science Press
• Soulsby, D., & Swain, D. (2003) A Report on the Award-Bearing INSET
scheme. Retrieved March 2, 2010 from
• http://www.teachernet.gov.uk/docbank/index.cfm?id=4129.
• Sparks, D., & Hirsh, S. (2000). A national plan for improving Professional
Development. Retrieved August 7, 2010 from
• http://www.nsdc.org/library/NSDCPlan.html.
• Stern, L., & Roseman, E. (2001). Textbook alignment, The Science Teacher
68, 52–57.
• Strategic Plan 2007-2011. Statement by Minister of Education, Mrs Naledi
Pandor, MP. Department of Education.
• Surendra, P., (2001). Teaching Form 7 Physics in secondary schools in Fiji:
Current Difficulties and some proposed solutions.

88
• Thornton, R. K., & Sokoloff, D. R. (1998). Assessing student learning of
Newton`s laws: The force and Motion Conceptual Evaluation and the
Evaluation of Active Learning Laboratory and Lecture Curricula. American
Journal of Physics, 66(4), 338-352. University Press.
• Touger, J. S., Dufresne, R. J., Gerace, W. J., Hardiman, P. T. & Mestre, J. P.
(1995). How novice physics students deal with explanations. International
Journal of Science Education, 17(2), 255-269.
• Trey, L., & Khan, K. (2008). How science students can learn about
unobservable phenomena using computer-based analogies. Computers &
Education, 51 (2008), 519-529.
• UNESCO 1, (1999). Declaration on Science and the use of scientific
knowledge. UNESCO, Budapest.
• UNESCO 2, (1999). Science agenda—framework for action. UNESCO,
Budapest.
• Van Aken, J. E. (2004). Management research based on the paradigm of the
design sciences: The quest for field-tested and grounded technological rules.
Journal of Management Studies, 41, 219-246
• Van de Walle, J. (2004). Elementary and Middle School Mathematics:
Teaching developmentally. Boston: Pearson
• Van den Akker, J. (1999). Principles and methods of development research.
In J. van den Akker, R. Branch, K. Gustafson, N. Nieveen, and T. Plomp
(Eds.), Design approaches and tools in education and training (pp. 1–15).
Dordrecht: Kluwer Academic Publishers.
• Von Glasersfeld, E. (1989). An exposition of constructivism: why some like it
radical. In R. B Davis (Ed.), Constructivist view on teaching and learning of
mathematics: JRME.
• Wademan, M. (2005). Utilizing development research to guide people
capability maturity model adoption considerations. Unpublished doctoral
dissertation. Syracuse: Syracuse University.
• Weimer, M. (2002). Learner-centered teaching. San Francisco: Jossey-Bass.
• Wenglinsky, H. (2000). How teaching matters: Princeton, NJ: Educational
Testing Service.

89
• Wenglinsky, H. (2002). How schools matter: The link between teacher
classroom practices and student academic performance. Education Policy
Analysis Archives, 10 (12). Retrieved August 13, 2010 from
http://epaa.asu.edu/epaa/v10n12
• Wenning, C. (2005). Minimizing resistance to inquiry-oriented science
instruction: The importance of climate setting. Journal of Physics Teacher
Education Online, 3(2), 10-15. Retrieved October 12, 2010 from
http://www.phy.ilstu.edu/jpteo
• Wieman, C., & Perkins, K. (2005). Transforming Physics Education. Physics
Today. American Institute of Physics. Retrieved September 4, 2011 from
http://www.physicstoday.org
• Wiley, D., & Yoon, B. (1995). Teacher reports of opportunity to learn: Analysis
of the 1993 California Learning Assessment System, Educational Evaluation
and Policy Analysis, 17(3), 355-370.
• Wilson, S. M., & Floden, R. E. (2003). Creating effective teachers: concise
answers to hard questions. Washington: American Association of Colleges of
Teacher Education.
• Worthen, B. R., Sanders, R., & Fitzpatrick, J. L., (1997). Program evaluation,
Longman, New York
• Wright J. C., & Wright C.S. (2000). A commentary on the profound changes
envisioned by the national science standards. Teachers College Record,
100(1), 122-143.

90
APPENDICES
Appendix 1: Questionnaire for Teachers
Sure Mupezeni is a student at UNISA and conducting a research in the
Thohoyandou Cluster in Limpopo Province in the Vhembe district on Challenges and
Prospects of teaching Doppler Effect in grade 12. The findings of this research may
assist Curriculum Advisors, Examiners, Subject Advisors and teachers. You are
kindly requested to answer all questions to the best of your ability and sincerity.
Please note that your responses are going to be treated with strict confidentiality and
that answering these questions is not obligatory. Contact no.0847838451.
Personal Information
1. Gender
Female
Male
2. Science teaching experience in years
0-5
6-10
11-15
16-20
Above 20
3. Indicate your qualifications
Diploma

91
ACE
Degree
4. Location of the school where you are teaching
5. Total number of learners in your grade 12 physical science class
Content, support and teaching method(s)
Tick the appropriate box
6. How do you rate the level of difficulty of teaching the topic Doppler effect?
Very easy
Easy
Difficult
Very difficult
7. How do you rate your understanding of the formula
Rural
Urban
Semi-urban/semi-rural
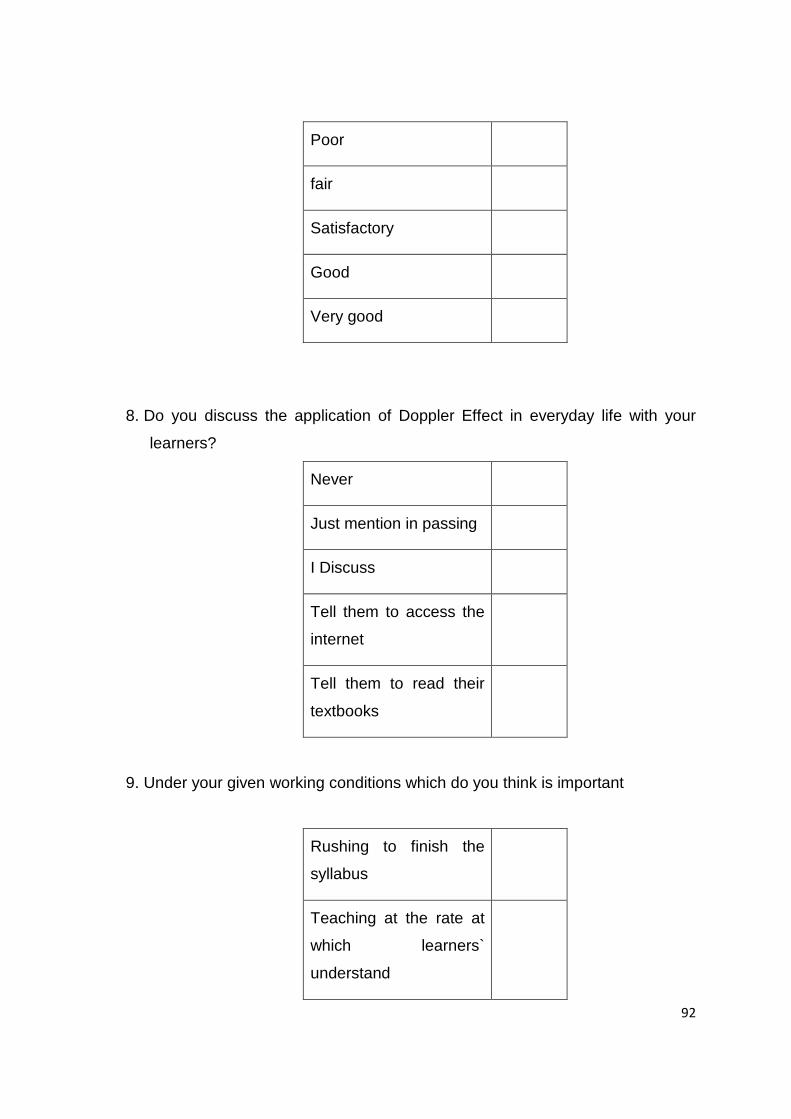
92
Poor
fair
Satisfactory
Good
Very good
8. Do you discuss the application of Doppler Effect in everyday life with your
learners?
Never
Just mention in passing
I Discuss
Tell them to access the
internet
Tell them to read their
textbooks
9. Under your given working conditions which do you think is important
Rushing to finish the
syllabus
Teaching at the rate at
which learners`
understand

93
Drilling learners on past
examination papers
10. Have you ever been trained while you were still at college or university on the
topic Doppler Effect?
Yes
No
11. How have organised workshops on Doppler effect enhanced your teaching
skills on the topic ?
Very little
Little
A lot
I have never attended a
workshop on the
Doppler effect
12. Have you ever done an experiment/demonstration for your learners on the
Doppler Effect?
Sometimes
Never
Always

94
13. Do you have access to computers to teach the topic?
Yes
No
14. Are you using the computer to teach the topic?
Yes
No
15. How would you comment on the text books that you have with regards to
Doppler Effect?
Not enough
Enough but irrelevant
Enough and relevant
16. Briefly describe how you would teach the topic Doppler Effect?
............................................................................................................................
............................................................................................................................
............................................................................................................................
17. How would you know the learners understand the Doppler Effect?
............................................................................................................................
............................................................................................................................
............................................................................................................................

95
18. Comment on the availability of science apparatus and equipment at your
school
.................................................................................................................................
.................................................................................................................................
..............................................................................................................................

96
Appendix 2: Interview schedule: Physical Science Subject Advisor
Greetings and Introductions
Purpose of the interview stress that all responses are going to be treated with
utmost confidentiality.
Expected outcomes of the study
1. Sir, for how long have you been a Science subject Advisor?
2. May you comment on the learners `performance in NSC final examinations in
Physical Science?
3. According to your opinion what might be the causes of such performance by
the learners?
4. Please comment on teacher qualifications and experience in the subject in
your district?
5. What are the teachers’ main concerns regarding the topic Doppler Effect?
6. What do you consider as main challenges regarding the topic Doppler Effect?
7. Which method(s) are the teachers using when teaching this topic?
8. Which method would you suggest to be most effective when teaching this
topic Doppler Effect?
9. What guidance or support is available to teachers to help them with the topic?
10. Any observations regarding the teaching of Doppler Effect that you have
made over the years, which you might want to share?
Thank the interviewee and promise to share with him/her the findings of the
research.

97
Appendix 3: Lesson on Doppler Effect
Lesson 1 Topic: The Doppler Effect.
Duration of lesson: 2 class periods (1 hour)
Lesson objectives
i. Learners should be able to list the factors which affect the wavelength of a
wave.
ii. Learners should be able to explain the relationship between wavelength and
frequency.
iii. Learners should be able to explain what the Doppler Effect is.
Materials needed
i. Ordinary trays , or ripple tank trays
ii. Slinky
iii. Eyedroppers
Pre-Activity assessment
Ask the learners how they perceive the sound of vehicles as they move towards
them, pass close to them and speed away. Ask learners` opinion on how the traffic
officers can be able to detect the speed of vehicles. Help learners to link this with the
Doppler Effect.
Activity Assessment/evaluation
Learners will be given activity sheets which have clear instructions to carry out
various tasks and activities. The activity sheets have questions and blank spaces
where learners can write or draw depending on the question. The questions require
learners to predict, observe and explain a phenomenon and in some cases draw
diagrams to illustrate their answers (appendices 4, 5, and 6).
Post-Activity assessment
All the completed activity sheets to be marked and analysed
Activity extensions

98
• Learners to research on the subsonic speed, supersonic speed and
sonic boom and determine its relationship to the Doppler Effect.
• Research on application of the Doppler Effect in a field of choice.
• How does a blind bat detect the flying insects and be able to fly without
colliding with objects?
Table of Activities and objectives
Activity Objectives of the activity
Activity sheet No.
Slinky spring
Teacher Activity
• Use a slinky spring, to
demonstrate with the help of a
learner how to construct a
transverse wave. Ask a
learner to draw the diagram of
the wave on the board, ask
other learners to identify and
define: trough, crests,
frequency and wavelength.
i. to ensure that the
learners can
practically
identify troughs
and crests
ii. the learners
should be able to
define the terms
frequency and
wavelength
basing their
definition on what
they would have
observed.
iii. the learners
should be able to
observe
1
Learners` activity
Divide the learners into groups of 5-
i. The learners
should be able to

99
6. Each group gets a slinky. By
experimenting the learners should
find out how they can change the
wavelength of the wave.
find the
relationship
between the
frequency and
wavelength.
ii. The learner
should be able to
observe that the
higher the
frequency, the
shorter the
wavelength.
1
Water waves.
Teacher activity:
Divide class into groups of 5-6 and give
each group a tray and an eyedropper. Ask
the learners to fill the tray with water of
about 1cm deep.
Learners’ activity:
1. Use an eyedropper to drop water in
the tray at regular intervals (eye
dropper to remain stationary).
2. Draw your observations and write
them down
3. Move the eyedropper in one
direction along the tray while
dropping the water.
4. Record and draw your observations.
i. The learner
should predict what happens
when the drop
falls onto the
water
ii. The learner
should be able to
observe what
happens.
iii. the learner should
be able to explain
what is happening
2
2

100
Teacher demonstration:
• Set up the ripple tank.
• Produce waves by squeezing
drops of water out of the
dropper at regular intervals.
(Explain that this is the
frequency of the wave).
• Continue to construct waves
while moving the source
towards the end of the tray
marked by a lump of
plasticine.
• Repeat the demonstration
until the learners have
accurately observed the
Doppler Effect with the
teacher making the link.
i. Repetition of
learners’ activity
to check on their
understanding of
wavelength and
frequency.
ii. Learners should
understand that
the regular
interval of drops
represents the
frequency of the
wave.
Extra activity: Passing vehicles
• Take learners by the road side and
ask them to observe cars passing by
and to describe what they hear.
• If the school is far from the road, ask
a learner to ride on a bicycle
mounted with a cell phone (with
external speaker) playing a high
pitched tone at loud volume. The
learner should start from afar and
ride past the learners and continue
The learners should be
able to predict that there
will be a change in
frequency of the sound
as the source of sound
approaches or moves
away
3

101
for a longer distance. Ask the
learners to describe what they hear
Doppler Effect calculations
The learners will be given sheet of
questions on the Doppler effect. The
questions resemble those from the past
examination papers.
4
Teachers` notes:
The teacher should help the learners to link the activities with the formula. The
learners should be able to understand the following:
(a). The frequency affects the wavelength :
Faster frequency → shorter wavelengths
Slower frequency → longer wavelengths
(b) Movement affects wavelength:
Moving towards observer → shortens wavelength
Moving away from the observer → lengthen wavelength.
1. When the source of the wave is stationary, the distance between the waves
are the same at both ends of the tray.
1. As the source of the wave moves, the distance between the waves will be
shorter in the direction of the movement of the source and longer behind.
2. This is the Doppler Effect.

102
Appendix 4: Slinky
Activity Sheet 1
1. Draw the wave demonstrated by the teacher with the help of your peer and
indicate on your diagram the crest, trough and wavelength,
2. How may you change the frequency of the wave? Indicate the effect it would
have on the wavelength.
3. Define frequency in terms of the slinky that you have observed being moved.
How were you changing the frequency of the wave?
4. Relate wavelength and frequency
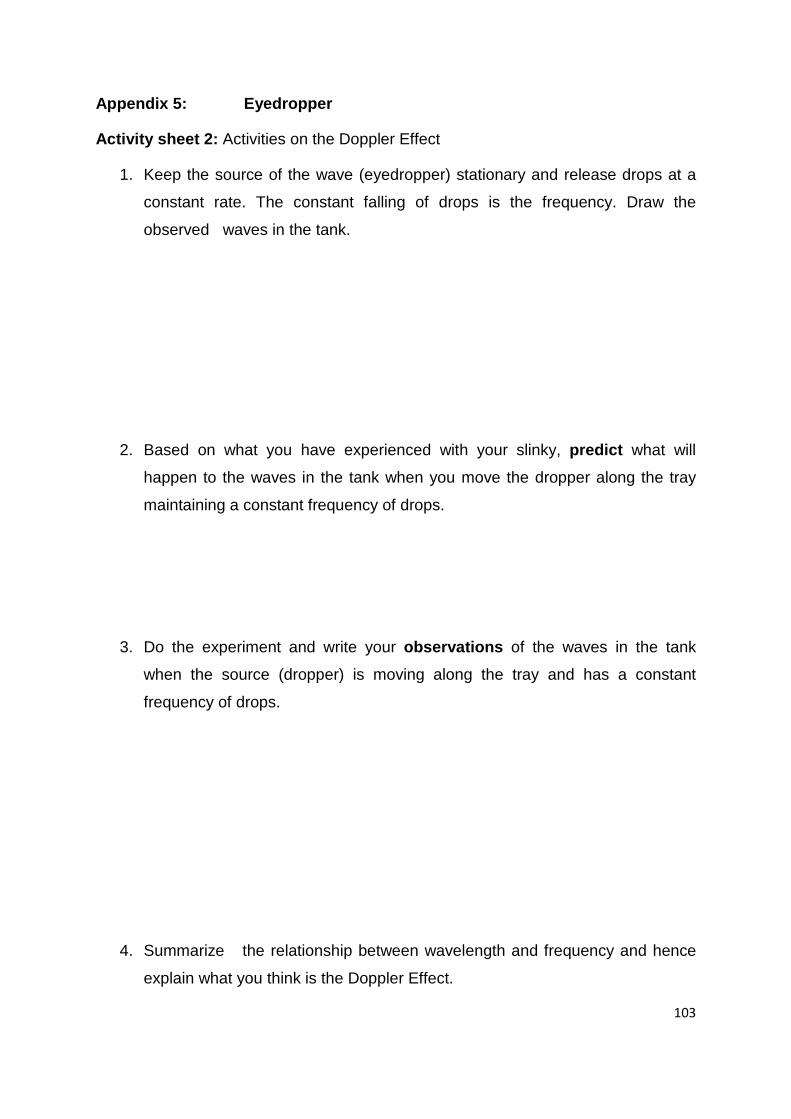
103
Appendix 5: Eyedropper
Activity sheet 2: Activities on the Doppler Effect
1. Keep the source of the wave (eyedropper) stationary and release drops at a
constant rate. The constant falling of drops is the frequency. Draw the
observed waves in the tank.
2. Based on what you have experienced with your slinky, predict what will
happen to the waves in the tank when you move the dropper along the tray
maintaining a constant frequency of drops.
3. Do the experiment and write your observations of the waves in the tank
when the source (dropper) is moving along the tray and has a constant
frequency of drops.
4. Summarize the relationship between wavelength and frequency and hence
explain what you think is the Doppler Effect.

104
5. Give 3 examples of the Doppler Effect in everyday life.

105
Appendix 6: Bicycle
Activity sheet 3
1. Write down your predictions of the changes in sound (if any) if a bicycle
mounted with a ringing cell phone moves towards your stationary position and
then away from you.
2. Write down as many observations as you can about the sound as the bicycle
moves towards you and then pass you.
3. Illustrate by means of diagrams the sound waves as the bicycle mounted
with the ringing cell phone approach you. On the diagram indicate the position
of the bicycle and your stationary position. What will happen if the bicycle
stands still and you move towards or away from the bicycle?

106
4. Describe the Doppler Effect in terms of sound and make a comparison
between water drops and the slinky spring.

107
Appendix 7: Grid code for computer SPSS data analysis
ID Q1 Q2 Q3 Q4 Q5 Q6 Q7 Q8 Q9 Q10 Q11 Q12 Q13 Q14 Q15 Q16 Q17 Q18
1 0 4 2 1 3 1 4 3 2 0 3 1 1 0 2 2 0 1
2 1 4 2 2 2 1 4 3 2 1 1 0 0 0 0 2 0 0
3 0 3 2 2 6 2 3 3 2 0 2 1 1 0 0 2 2 0
4 1 3 2 2 6 0 4 3 2 1 2 0 1 1 2 2 2 1
5 1 2 0 0 2 1 2 3 2 1 3 0 1 0 0 1 0 1
6 1 1 1 2 2 2 2 2 3 0 3 1 0 0 1 0 0 0
7 1 2 0 0 2 2 1 1 1 0 3 1 0 0 1 0 1 0
8 1 3 1 2 3 2 1 1 3 0 3 1 0 0 1 2 0 3
9 1 3 1 2 2 3 1 1 1 0 3 1 0 0 1 0 1 0
10 1 1 1 0 6 1 3 3 3 0 2 1 0 0 2 0 0 1
11 1 3 1 2 6 2 1 2 2 0 3 1 0 0 0 3 0 0
12 1 0 2 0 3 1 3 4 2 1 3 1 0 0 0 0 0 0
13 1 2 2 2 2 1 3 3 2 0 3 1 0 0 2 0 0 3
14 1 1 0 2 3 2 2 1 1 1 0 1 1 0 1 0 0 0
15 1 2 0 0 2 2 2 2 3 0 1 1 0 0 0 0 0 0
16 1 4 1 2 3 1 3 3 2 1 2 0 1 1 1 2 2 0
17 1 2 0 0 4 3 2 2 1 1 1 2 0 0 0 0 1 0
18 1 2 1 0 2 2 2 4 3 1 3 1 0 0 1 0 0 0
19 1 3 1 0 3 0 2 2 1 0 3 1 0 0 0 0 0 0
20 1 2 1 2 4 2 2 1 2 0 0 1 1 1 1 2 2 0

108
21 1 2 1 0 3 2 2 3 3 0 3 1 0 0 0 0 0 3
22 1 3 2 2 2 1 2 4 2 1 1 0 1 0 1 0 2 0
23 1 2 1 0 4 3 3 3 3 1 3 1 0 0 0 0 0 0
24 1 2 2 2 2 2 2 5 1 1 1 1 1 1 1 1 0 0
25 1 3 1 2 2 1 2 2 3 0 3 1 0 0 0 2 0 0
26 1 2 0 0 3 2 2 5 2 0 0 1 0 0 1 0 1 0
27 1 3 1 2 2 1 3 3 1 0 3 2 1 1 1 0 0 0
28 1 2 1 2 2 2 2 4 3 1 1 1 0 0 1 0 0 3
29 1 2 2 0 4 2 2 5 2 0 2 0 0 0 1 0 2 0
30 1 3 2 2 2 2 2 3 3 0 3 0 1 1 1 0 0 0
31 1 2 1 0 3 3 3 4 2 1 1 1 0 0 0 0 1 0
32 1 2 1 0 3 2 2 1 1 1 3 1 0 0 1 0 0 3

109
Appendix 8: Codes used in SPSS computer software for responses for the teachers` questionnaire
Personal Information
1. Gender
N=32
Gender Total % code
Female 2 6.3 0
Male 30 93.7 1
2. Science teaching experience in years
Total % code
0-5 1 3.1 0
6-10 3 9.4 1
11-15 15 46.9 2
16-20 10 31.3 3
Above 20 3 9.4 4

110
3. Teacher qualifications
Total % code
Diploma 6 18.8 0
ACE 16 50.0 1
Degree 10 31.2 2
4. Type of school where the teacher is working.
5. Total number of learners in grade 12 physical science classes
216
Content, support and teaching method(s)
6. How do you rate the level of difficulty of teaching the topic Doppler Effect?
Total % code
Very easy 2 6.3 0
Type of school Total % code
Rural 14 43.8 0
Urban 1 3.1 1
Semi-urban/semi-rural 17 53.1 2

111
Easy 10 31.2 1
Difficult 16 50.0 2
Very difficult 4 12.5 3
7. How do you rate your understanding of the formula?
fl = (v±vl)/(v±vs) .fs
Total % code
Poor 0 0 0
fair 4 12.5 1
Satisfactory 17 53.1 2
Good 8 25.0 3
Very good 3 9.4 4
8. Do you discuss the application of Doppler Effect in everyday life with your
learners?
Total % code
Never 6 18.8 1
Just mention in passing 6 18.8 2
I Discuss 12 37.5 3

112
Tell them to access the
internet
5 15.6 4
Tell them to read their
textbooks
3 9.3 5
9. Under your given working conditions which do you think is important?
Total % code
Rushing to finish the
syllabus
8 25.0 1
Teaching at the rate
at which learners`
understand
14 44.8 2
Drilling learners on
past examination
papers
10 31.2 3
10. Have you ever been trained while you were still at college or university on the
topic Doppler Effect?
Total % code
Yes 14 43.7 1
No 18 56.3 0

113
11. How have organised workshops on Doppler Effect enhanced your teaching
skills on the topic?
Total % code
Very little 3 9.4 0
Little 7 21.9 1
A lot 5 15.6 2
I have never
attended a
workshop on the
Doppler effect
17
53.1
3
12. Have you ever done any experiment/demonstration for your learners on the
Doppler Effect?
Total % code
Sometimes 7 21.8 0
Never 23 71.9 1
Always 2 6.3 2
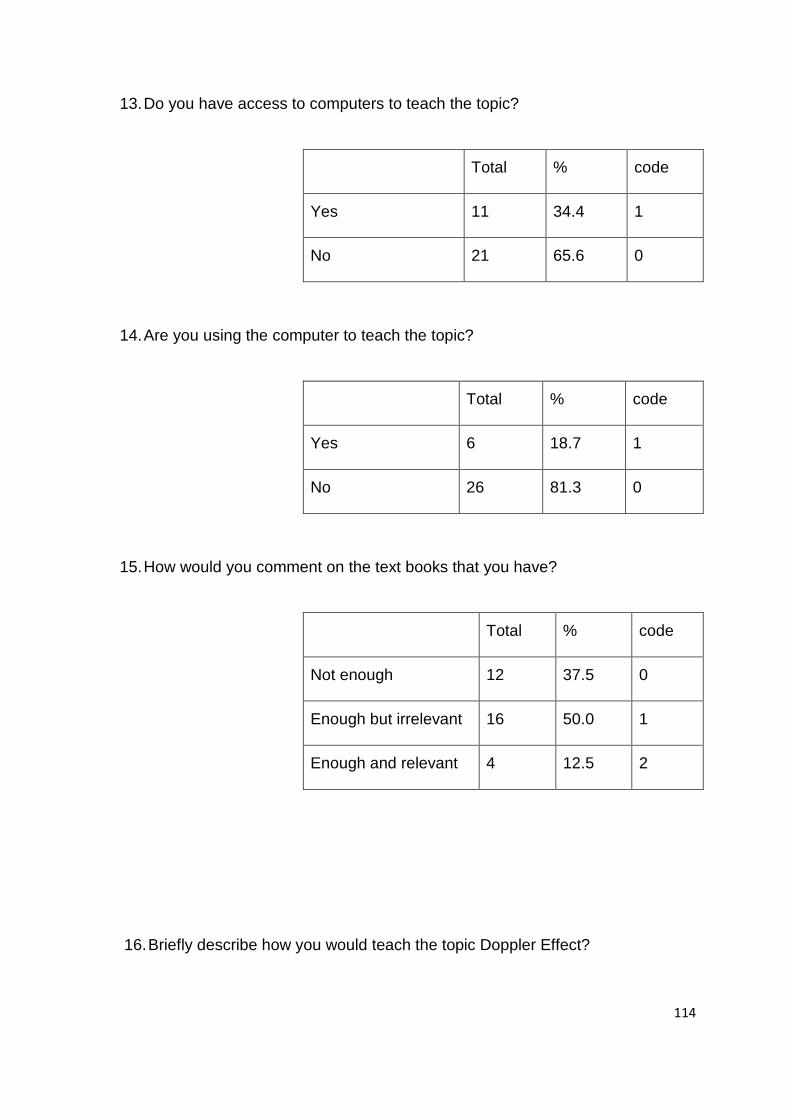
114
13. Do you have access to computers to teach the topic?
Total % code
Yes 11 34.4 1
No 21 65.6 0
14. Are you using the computer to teach the topic?
Total % code
Yes 6 18.7 1
No 26 81.3 0
15. How would you comment on the text books that you have?
Total % code
Not enough 12 37.5 0
Enough but irrelevant 16 50.0 1
Enough and relevant 4 12.5 2
16. Briefly describe how you would teach the topic Doppler Effect?

115
Method/activity Total % code
Explain, give notes, define terms 21 65.6 0
Explain, give notes, do practicals/ demonstrations 2 6.3 1
Explain, give notes, work out problems, discuss
applications
8 25.0 2
No idea 1 3.1 3
17. How would you know the learners understood the Doppler Effect?
Method used to check Total % code
Giving tests, class work, homework 21 65.6 0
Asking of questions during lesson 5 15.6 1
Application of knowledge, discussions, correctly
solved problems
6 18.8 2
18. Comment on the availability of science apparatus and equipment at your
school
Comment Total % code
No equipment/apparatus 23 71.8 0
Few, not enough 4 12.5 1
Enough equipment/apparatus 0 0 2
Available but irrelevant to the topic 5 15.6 3

116
Appendix 9: Application letter for permission to conduct study Azwifarwi Secondary School
P.O. Box 2512
Thohoyandou
0950
29 July 2010
The District Senior Manager
Department of Education
P. B. X2260. 0970
Limpopo Province
REF: ADMINISTARTION OF RESEARCH INSTRUMENTS TO LEARNERS, SUBJECT ADVISORS
AND TEACHERS.
Dear Sir
I hereby apply for permission to conduct my research in the Thohoyandou cluster. The title of my
research is: Challenges and prospects in teaching the Doppler Effect at Grade 12.
The answers to the questionnaires and interviews may bring out important information which will be
used to establish the challenges faced by teachers in teaching this topic.
I am a student at UNISA and my student number is 4550 3923. My supervisor is Prf. J Kriek. I am
also a Physical Science and mathematics teacher at Azwifarwi Secondary School, in the
Thohoyandou cluster. I would like to inform you of the following:
• Only teachers in the Thohoyandou cluster are going to complete one questionnaire each.
• Learners will carry-out experiments and complete activity sheets on the Doppler Effect.
• The interviewing (for subject advisors). Administration of questionnaires (for teachers) and
collection of questionnaires is going to be done by myself.
• Teachers are not going to be forced to complete the questionnaires and confidentiality is to be
maintained.
Once permission is granted in the District I will also ask permission from the principals of the schools
concerned.
The results of the findings will be made available to you and these might help in improving
on the teachers` effectiveness and learner performance.
Yours Faithfully
Mr. Sure Mupezeni
My cell number: 084 3363 655

117
Appendix 10 A: Permission letter to conduct the study
118
Appendix 10 B: Ethical clearance letter

119
Appendix 11: Verbatim analysis of the interview with the subject advisor
1. Sir, for how long have you been a Science subject Advisor?
2. Not very long under this current post, less than 3 years
3. May you comment on the learners `performance in NSC final examinations in
4. Physical Science?
5. The performance is not pleasing in most of the schools, but we have some 6.
6. schools which are doing very well, but in general the performance is not what
7. we would want, the pass rate is still too low.
8. According to your opinion what might be the causes of such performance by
9. the learners?
10. There are many factors in play, but the main ones are that teachers lack
11. content knowledge and that some teachers are under qualified to teach the
12. subject. The other thing is that our learners are not motivated; they need to
13. be constantly motivated.
14. Please comment on teacher qualifications and experience in the subject in
15. your district?
16. As I have said some teachers are under qualified so their content knowledge
17. is questionable, but we try to help them with supplementary teaching
18. materials and study guides. We are ensuring that every grade 12 teacher is
19. qualified to teach the subject he/she will be teaching and I am sure almost all
20. schools will be having competent teachers soon in mathematics and physical
21. science.
22. What are the teachers’ main concerns regarding the topic Doppler Effect?
23. The problem is on the calculations, use of the formula, how the formula
24. changes under a given situation, also linking the theory with the practical real
25. life situations for the learners to understand.
26. What do you consider as main challenges regarding the topic Doppler Effect?
27. Understanding of the topic, teachers lack content knowledge on the topic and
29. this will make it difficult for them to explain to the learners remember this is a
30. new topic to most teachers.
31. Which method(s) are the teachers using when teaching this topic?

120
32. Really teachers use different methods, but we encourage them to use learner
33. centred methods, not just talking and talking, learners need to participate,
34. they must take part in the learning process, science is a practical subject. We
35. would like teachers to carryout experiments to show learners the practical
36. side of the theories. We are aware that not all schools have science
37. laboratories and those with the laboratories might not have all the necessary
38. equipment. Efforts are being made to equip the schools.
39. Which method would you suggest to be most effective when teaching this
40. topic Doppler Effect?
41. Where possible demonstrations and practicals would be better, because
42. learners will understand and remember more what they see and do.
43. What guidance or support is available to teachers to help them with this
44. topic?
45. We supply schools with study guides, we sometimes do workshops, there are
46. so many things for us to do, so at times the planned workshops are not done
47. due to different reasons, we are aware of the teachers problems. Doppler
48. Effect is a difficult topic workshops must be organised to assist teachers.
49. Any observations regarding the teaching of Doppler Effect that you have
50. made over the years, which you might want to share?
51. Just like any topic the learners need to understand the link with their everyday
52. life, why we learn the topic in the first place, and at times teachers just teach
53. the theory with no experiments or demonstrations.

121
Appendix 12: Test on Doppler Effect Calculations
Lesson 2: Calculations on the Doppler Effect
Duration of Lesson: 1 class period (30 minutes)
Lesson objectives
1) Learners should be able to read and understand the questions.
2) Learners should be able to diagrammatize the situation being portrayed in the
question.
3) Learners should be able to solve problems using the Doppler effect equation.
Pre-activity assessment
Discuss with learners their everyday experiences with the Doppler Effect. Let the
learners explain how Doppler Effect can help the blind people.
Activity assessment/ Evaluation
The learners will be issued with question papers. They will answer the questions on
the spaces provided on the question paper. The teacher will collect the completed
answers and mark them.
Post- activity assessment
All answer sheets will be marked and analysed.
Activity extensions
Learners to be given an assignment set from final grade 12 past examination papers.

122
Activity sheet 4:
Marks: 18
Question 1
A blind lady is standing at a bus stop, a police car moving at 45m.s-1, sounding its
siren approaches the bus stop. The siren of the police car emits sound waves at a
frequency of 360 Hz. As the car approaches the lady, the pitch of sound that she
hears gets higher and decreases as the car passes her and moves off.
Show why the pitch of the sound that the blind lady hears is
1 Higher as the car approaches her, use a sketch of wave fronts. (2)
2 Lower as the car moves away from her (2)
1.3 Determine the apparent frequency of the sound waves that the lady hears while
the police car approaches her. Take speed of sound in air as 344 m.s-1 (5)

123
1.4 Name this phenomenon and explain how it can help the blind lady. (2)
Question 2
An ambulance with its siren on is moving at 25m.s-1 towards the hospital. A traffic
officer standing next to the road with a detector, measures the frequency of the
sound emitted by the siren to be 370 Hz. The measured frequency is LOWER than
the frequency of the sound emitted by the siren.
2.1 State whether the ambulance is moving toward or away from the traffic
policeman? (1)
2.2 Explain why the registered frequency is lower. (1)
2.3 If the speed of sound in air is 320 ms-1, calculate the frequency of the siren. (4)

124
Suggested answers to questions 1 and 2
Question 1
1.1
The car approaches the lady
1.2
The car moves away from the lady
1.3
= ( ) x360

125
= 414 Hz
1.4 The Doppler Effect. The lady can be able to tell whether a car is near or far
away, if she hears a low pitch of sound this tells her that the car is far and she can
cross the road safely.
Question 2
2.1 Moving away from the traffic officer
2.2 The low frequency indicates that the ambulance is going away; where the
waves are compressed it shows point of high frequency and shorter wavelength.
2.3
370=( )x fs
fs = 397.85Hz

126
Appendix 13: Correlation
Table 20: Pearson`s product moment Correlation
Mark range D Q D2 Q2 DQ
90-100 1.9 0.8 3.6 1.71
80-89 8.3 3.2 68.9 10.2 26.56
70-79 15.7 4.6 246.5 21.2 72.22
60-69 24.5 6.4 600.3 41.0 156.8
50-59 26.4 16.1 697.0 259.2 425.04
40-49 15.3 19.9 234.1 396.0 304.47
30-39 5.1 26.4 26.0 697.0 134.64
20-29 3.7 15.2 13.7 231.0 56.24
10-19 6.0 0 36.0 0
0-9 0 0 0 0
216
(N)
99.9
(∑D)
99.7
(∑Q)
1887.3
(∑D2)
1695.2
(∑Q2)
1177.68
(∑DQ)
Using the above figures and the formula the value of r has been calculated; r =
0.649394384 which is approximately r = 0.65 and this indicates a high correlation
according to description below (Mulder, 1993:73).
1.00 - perfect correlation
0.80 to 0.99 - very high correlation
0, 60 to 0.79 - high correlation

127
0.40 to 0.59 - moderate correlation
0.20 to 0.39 - low correlation
0.01 to 0.19 - very low correlation
0.00 - no correlation

128
Appendix 14: Interview questions for teachers and learners after the Lesson
After the lesson some teachers were asked this question:
What is your opinion on the lesson?
A few learners were randomly picked and asked this question:
How was the lesson?

129
Appendix 15: SPSS statistical analysis of teachers’ questionnaire
gender * type of school Crosstabulation
Count
type.of.school
Total rural urban semi-urban
gender female 0 1 1 2
male 14 0 16 30
Total 14 1 17 32
Table 15
qualification * type.of.school Crosstabulation
Count
type.of.school
Total rural urban semi-urban
qualification diploma 5 0 1 6
ACE 7 0 9 16
degree 2 1 7 10
Total 14 1 17 32
Table 16
level.of.difficulty * understanding.formular Crosstabulation
Count
understanding.formular Total

130
fair satisfactory good very good
level.of.difficulty very easy 0 1 0 1 2
easy 0 3 5 2 10
difficult 3 12 1 0 16
very difficult 1 1 2 0 4
Total 4 17 8 3 32
Table 17
Correlations
availability.equipm
ent
exp.demonstratio
ns
availability.equipment Pearson Correlation 1 .055
Sig. (2-tailed) .765
N 32 32
exp.demonstrations Pearson Correlation .055 1
Sig. (2-tailed) .765
N 32 32

131
Table 18
Correlations
availability.equipm
ent
exp.demonstratio
ns
Spearman's rho availability.equipment Correlation Coefficient 1.000 -.027
Sig. (2-tailed) . .885
N 32 32
exp.demonstrations Correlation Coefficient -.027 1.000
Sig. (2-tailed) .885 .
N 32 32
Table 19
INSTRUCTIONAL MANUAL
PHYSICS: THE DOPPLER EFFECT
SURE MUPEZENI JEANNE KRIEK

1
Foreword
In view of the critical role that science, mathematics and technology play in the social,
economic and industrial development this instruction manual attempts to encourage
learners to learn practically, to link science phenomenon with their every day
experiences. This manual covers only the topic Doppler Effect. It provides a guide to
enhance the capacity of teachers to improve on the understanding by learners of the
Doppler Effect.
We hope you will enjoy using this manual and that it will help improve the learner
performance in Physical Science and build a stronger foundation for the development of
South Africa.

2
TABLE OF CONTENTS
The Doppler Effect ................................................................................................................... 3
Scenarios illustrating the Doppler Effect: .............................................................................. 4
Why the Doppler Effect is sometimes included under light and sometimes with sound? . 7
Applications .......................................................................................................................... 8
Lesson 1: The Doppler Effect ............................................................................................10
Activity 1: Slinky spring .....................................................................................................15
Activity 2: Eyedropper ......................................................................................................16
Activity 3: The Bicycle .....................................................................................................18
Lesson 2: Calculations on the Doppler Effect ................................................................20
Activity 4: Doppler Effect Calculations ...........................................................................22
Suggested answers to questions 1 and 2 .............................................................................24
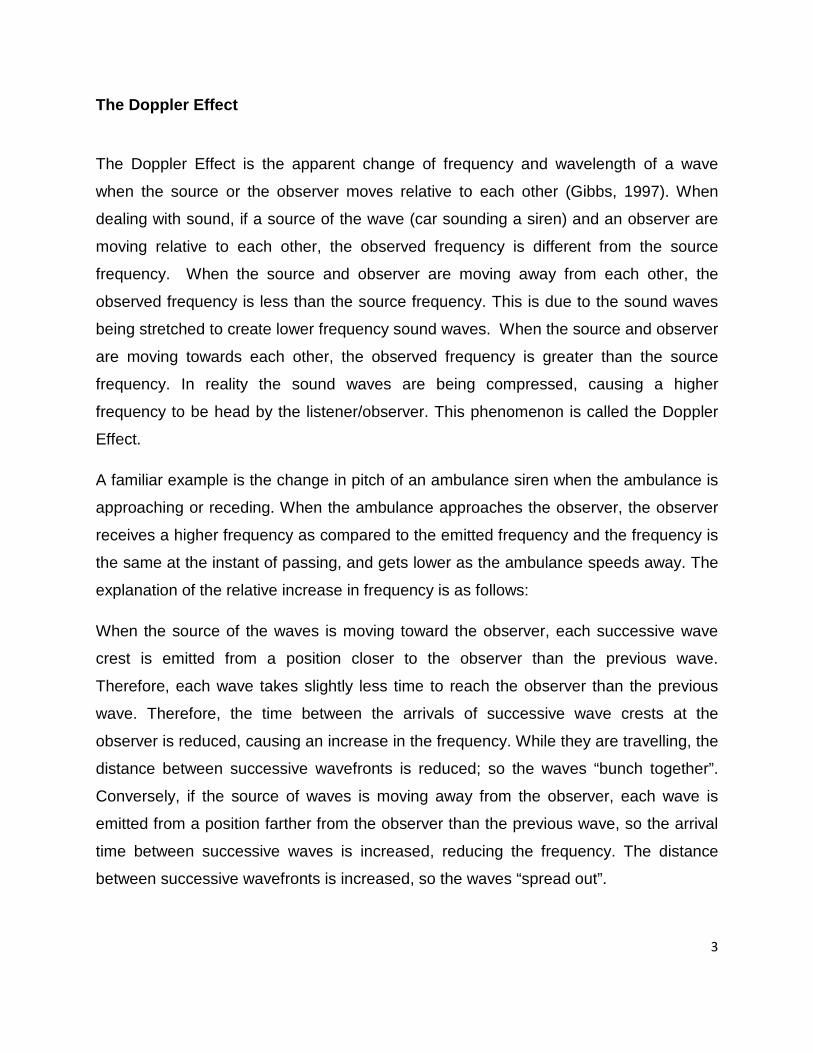
3
The Doppler Effect
The Doppler Effect is the apparent change of frequency and wavelength of a wave
when the source or the observer moves relative to each other (Gibbs, 1997). When
dealing with sound, if a source of the wave (car sounding a siren) and an observer are
moving relative to each other, the observed frequency is different from the source
frequency. When the source and observer are moving away from each other, the
observed frequency is less than the source frequency. This is due to the sound waves
being stretched to create lower frequency sound waves. When the source and observer
are moving towards each other, the observed frequency is greater than the source
frequency. In reality the sound waves are being compressed, causing a higher
frequency to be head by the listener/observer. This phenomenon is called the Doppler
Effect.
A familiar example is the change in pitch of an ambulance siren when the ambulance is
approaching or receding. When the ambulance approaches the observer, the observer
receives a higher frequency as compared to the emitted frequency and the frequency is
the same at the instant of passing, and gets lower as the ambulance speeds away. The
explanation of the relative increase in frequency is as follows:
When the source of the waves is moving toward the observer, each successive wave
crest is emitted from a position closer to the observer than the previous wave.
Therefore, each wave takes slightly less time to reach the observer than the previous
wave. Therefore, the time between the arrivals of successive wave crests at the
observer is reduced, causing an increase in the frequency. While they are travelling, the
distance between successive wavefronts is reduced; so the waves “bunch together”.
Conversely, if the source of waves is moving away from the observer, each wave is
emitted from a position farther from the observer than the previous wave, so the arrival
time between successive waves is increased, reducing the frequency. The distance
between successive wavefronts is increased, so the waves “spread out”.

4
This relationship can be summarized mathematically by an equation below;
fl )fs
Where
v= speed of sound in the medium
vs = the velocity of source of sound
vl = the velocity of observer
fs = the frequency emitted by source of sound
fl = the frequency heard by the observer/listener
Note that the above formula can only be used for sound waves provided the speeds of
the receiver and source relative to the medium are lower than the speed of sound.
Doppler Effect is applied differently for sound and light waves due to the following two
reasons:
a) Sound waves are mechanical and require a medium to travel, whereas light
waves are electromagnetic and do not require any medium for their propagation.
b) The velocity of light is the same in all inertial frames of reference, but the velocity
of sound is not.
Scenarios illustrating the Doppler Effect:
1. Stationary source , stationary listener

5
fl fs
The frequency heard by observer is equal to the frequency emitted by the source
if they are close together.
2. Moving listener, stationary source
• the plus sign applies when listener moves towards the source as shown below:
• The negative sign applies when the listener moves away from the source of
sound.

6
3. Stationary listener, moving source
• the plus sign applies when source moves away from the listener
• the negative sign when source of sound moves towards the listener

7
4. Moving listener, moving source
• the upper sign positive and lower sign negative apply to source/ listener
moving towards each other.
• The upper sign negative and lower sign positive apply to listener/source
moving away from each other (Lowe & Rounce, 1997).
Why the Doppler Effect is sometimes included under light and sometimes with sound?
There are two reasons for the difference in the application of the Doppler Effect for
sound and light waves. Firstly, the sound waves are mechanical and they require a
medium to travel through. Secondly, the velocity of light waves is the same in all inertial
frames of references but the velocity of sound is not. The formula;

8
applies to sound waves, if and only if the speeds of the source of sound and the
observer relative to the medium are slower than the speed of sound (Lowe & Rounce,
1997).
However, the Doppler Effect is also included under the topic light where the speed of
the wave is far greater than the relative speeds of source and observer, the example is
that of electromagnetic waves, the Doppler Shift. The Doppler Effect for electromagnetic
waves like light is used in astronomy to show a red shift or a blue shift. The spectra of
stars are not continuous; instead they exhibit absorption lines that are not always at the
frequencies that are obtained from the spectrum of a stationary light source. Red light
has a lower frequency than blue light, the spectral lines of an approaching astronomical
light source exhibit a blue shift and those of receding light source exhibit a red shift. This
has helped scientists to realize that galaxies were moving away, they concluded that the
universe is expanding.
Applications 1. Astronomy. The Doppler Effect for light has helped scientists in realizing that the
earth is expanding. It was discovered that the distant a galaxy is, the faster it is
moving away from the earth (Thinkquest, 2009). The Doppler Effect for light
results in either a redshift or a blue shift. The use of Doppler Effect in space
research depends on the fact that spectra of stars are not continuous therefore
they exhibit absorption lines at well defined frequencies. It is known that blue
light has a higher frequency than red light, the spectral lines of a receding
astronomical light source exhibit a redshift and an approaching light source
exhibit a blue shift.
2. Medicine: An echocardiogram produces an assessment of the direction of blood
flow and the velocity of blood and cardiac tissue at any point on a human body
using Doppler Effect. The measurement of blood flow rate in veins and arteries
based on Doppler Effect is used for diagnosis of vascular problems like stenosis
(Evans & McDicken, 2000).

9
3. Radar: Doppler Effect is used to measure the velocity of detected objects like
cars (by traffic policemen) or airplanes.
4. Underwater acoustics: The speed of a submarine can be calculated by the
Doppler shift in military applications.
A worked example:
If you are standing at the bus stop you can tell whether a distant bus is approaching or
moving away by listening to the pitch (frequency) of the sound produced by the bus
engine.
a) The phenomenon above describes which property of waves?
b) A man at a football game observes a boy blowing a vuvuzela and running
towards him at a speed of 0.95ms-1 . The vuvuzela produces a note of frequency
790Hz. If the speed of sound is 340ms-1 on that day, calculate the frequency
heard by the man.
Answers:
a) The Doppler Effect
b) The source of sound (vuvuzela) is moving towards the man.
fl )fs = 340/(340-0.95) x 790 = 792,2Hz

10
Lesson 1: The Doppler Effect Duration of lesson: 2 class periods
Lesson objectives
i. Learners should be able to list the factors which affect the
wavelength of a wave.
ii. Learners should be able to explain the relationship between
wavelength and frequency.
iii. Learners should be able to explain what the Doppler Effect is.
Materials needed
i. ripple tank trays
ii. Slinky springs
iii. Eyedroppers
Pre-Activity assessment
Discuss with the learners their life experiences of the Doppler Effect. Ask the
learners how they perceive the sound of vehicles as they move towards them,
pass close to them and speed away.
Activity Assessment/evaluation
Learners use activity sheets. Learners fill out the Doppler Effect activity sheets
copied from this manual.
Post-Activity assessment
All the completed activity sheets to be marked and analyzed
Activity extensions
• Learners to research supersonic speed, Mach number, sonic boom and
determine its relationship to the Doppler Effect.
• Research on application of the Doppler Effect in a field of choice.

11
Table of Activities and objectives
Activity Objectives of the activity Activity
sheet No.
Slinky spring
Teacher Activity
• Use a slinky spring,
to demonstrate with
the help of a learner
how to construct a
transverse wave.
Ask a learner to
draw the diagram of
the wave on the
board, ask other
learners to identify
and define: trough,
crests, frequency
and wavelength.
i. to ensure that the
learners can
practically identify
troughs and crests
ii. the learners should
be able to define
the terms frequency
and wavelength
basing their
definition on what
they would have
observed.
iii. the learners should
be able to observe during the
experiments.
1
Learners` activity
Divide the learners into
groups of 5-6. Each group
gets a slinky. By
experimenting the learners
should find out how they
can change the wavelength
of the wave.
i. The learners should
be able to find the
relationship
between the
frequency and
wavelength.
ii. The learner should
be able to observe
that the higher the
frequency, the
1

12
shorter the
wavelength.
Water waves.
Teacher activity:
Divide class into groups of 5-6 and
give each group a tray and an
eyedropper. Ask the learners to fill
the tray with water of about 1cm
deep.
Learners’ activity:
1. Use an eyedropper to drop
water in the tray at regular
intervals (eye dropper to
remain stationary).
2. Draw your observations
and write them down.
3. Move the eyedropper in
one direction along the tray
while dropping the water.
4. Record and draw your
observations.
i. The learner should
predict what
happens when the
drop falls onto the
water.
ii. The learner should
be able to observe what happens.
iii. the learner should
be able to explain
what is happening
2
2
Teacher demonstration:
• Set up the ripple
tank.
• Produce waves by
squeezing drops of
water out of the
i. Repetition of
learners’ activity to
check on their
understanding of
wavelength and
frequency.
ii. Learners should
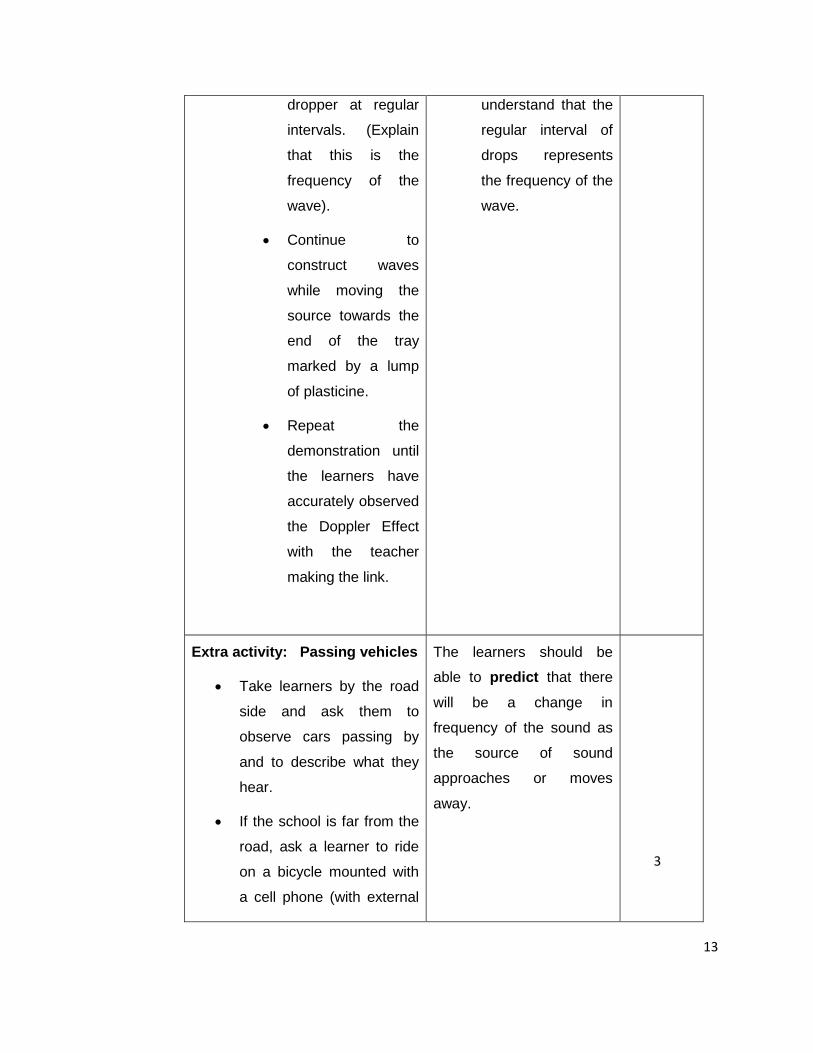
13
dropper at regular
intervals. (Explain
that this is the
frequency of the
wave).
• Continue to
construct waves
while moving the
source towards the
end of the tray
marked by a lump
of plasticine.
• Repeat the
demonstration until
the learners have
accurately observed
the Doppler Effect
with the teacher
making the link.
understand that the
regular interval of
drops represents
the frequency of the
wave.
Extra activity: Passing vehicles
• Take learners by the road
side and ask them to
observe cars passing by
and to describe what they
hear.
• If the school is far from the
road, ask a learner to ride
on a bicycle mounted with
a cell phone (with external
The learners should be
able to predict that there
will be a change in
frequency of the sound as
the source of sound
approaches or moves
away.
3

14
speaker) playing a high
pitched tone at loud
volume. The learner should
start from afar and ride
past the learners and
continue for a longer
distance. Ask the learners
to describe what they hear.
Doppler Effect calculations
The learners will be given sheet of
questions on the Doppler effect.
The questions resemble those
from the past examination papers.
4
Teachers` notes:
The teacher should help the learners to link the activities with the formula. The
learners should be able to understand the following:
(a). The frequency affects the wavelength :
Faster frequency → shorter wavelengths
Slower frequency → longer wavelengths
(b) Movement affects wavelength:
Moving towards observer → shortens wavelength
Moving away from the observer → lengthen wavelength.
1. When the source of the wave is stationary, the distance between the waves are
the same at both ends of the tray.

15
1. As the source of the wave moves, the distance between the waves will be shorter
in the direction of the movement of the source and longer behind.
Activity 1: Slinky spring
1. Draw the wave demonstrated by the teacher with the help of your peer and label
the crest, trough and wavelength,
2. List the ways found to change the wavelength of the wave and the effect it had
on the wavelength.

16
3. Define frequency. How did you change the frequency of the wave?
Activity 2: Eyedropper
1. Keep the source of the wave (eyedropper) stationary and releasing constant
frequency of drops. Draw and list five observations of the waves in the tank.
2. Based on what you have experienced with your slinky spring, predict what will
happen to the waves when you move the dropper along the tray maintaining a
constant frequency of drops.

17
3. Draw and list 5 observations of the waves in the tank when the source (dropper)
is moving and has a constant frequency of drops.
4. Summarize what the Doppler Effect is.
5. Give 3 example of the Doppler Effect in everyday life.

18
Activity 3: The Bicycle
1. Write down your predictions of the changes in sound (if any) if a bicycle
mounted with a ringing cell phone moves towards your stationary position and
then away from you.
2. Write down as many observations as you can about the sound as the bicycle
moves towards you and then pass you.
3. Illustrate by means of diagrams the sound waves as the bicycle mounted with
the ringing cell phone approach you. On the diagram indicate the position of the
bicycle and your stationary position.

19
4. Describe the Doppler Effect in terms of sound and make a comparison between
water drops and the slinky spring.

20
Lesson 2: Calculations on the Doppler Effect
Duration of Lesson: 2 class periods
Lesson objectives
1) Learners should be able to read and understand the questions.
2) Learners should be able to draw diagrams representing the situation being
portrayed in the question.
3) Learners should be able to solve problems using the Doppler Effect equation.
Materials needed
Question papers, answer sheets, calculators
Pre-activity assessment
Discuss with learners their everyday experiences with the Doppler Effect. Let the
learners explain how Doppler Effect can help the blind people.
Activity assessment/ Evaluation
The learners will answer questions from activity sheet.
Post- activity assessment
All answer sheets will be marked and analyzed.
Activity extensions
Learners to be given an assignment in the form of questions; which are similar to those
of the physical science final examinations.

21
Introduction to calculations on the Doppler Effect
Carefully observe the two diagrams below and indicate in which diagram would the
observer hear a lower frequency?
→
Approaching truck with compressed sound waves
Receding truck with stretched sound waves.

22
Activity 4: Doppler Effect Calculations
Question 1
A blind lady is standing at a bus stop, a police car moving at 45m.s-1 , sounding its siren
approaches the bus stop. The siren of the police car emits sound waves at a frequency
of 360 Hz. As the car approaches the lady, the pitch of sound that she hears gets higher
and decreases as the car passes her and moves off.
Show why the pitch of the sound that the blind lady hears is
1.1 Higher as the car approaches her, use a sketch of wave fronts. (2)
1.2 Lower as the car moves away from her (2)
1.3 Determine the apparent frequency of the sound waves that the lady hears while the
police car approaches her. Take speed of sound in air as 344 m.s-1 (5)

23
1.4 Name this phenomenon and explain how it can help the blind lady. (2)
Question 2
An ambulance with its siren on is moving at 25m.s-1 towards the hospital. A traffic officer
standing next to the road with a detector, measures the frequency of the sound emitted
by the siren to be 370 Hz. The measured frequency is LOWER than the frequency of
the sound emitted by the siren.
2.1 State whether the ambulance is moving toward or away from the traffic
policeman?(1)
2.2 Explain why the registered frequency is lower. (2)

24
2.3 If the speed of sound in air is 320 m.s-1, calculate the frequency of the siren. (4)
Suggested answers to questions 1 and 2 Question 1
1.1
The car approaches the lady
1.2

25
The car moves away from the lady
1.3 fo = ( ) f
= ( )x360
= 414 Hz
1.4 The Doppler Effect. The lady can be able to tell whether a car is near or far away, if
she hears a low pitch of sound this tells her that the car is far and she can cross the
road safely.
Question 2
2.1 Moving away from the traffic officer
2.2 The low frequency indicate that the ambulance is going away, where the waves
are compressed it shows point of high frequency and shorter wavelength

26
2.3 fo = ( ) fs
370=( )x fs
fs = 398.91Hz

27
References
• Evans, D. H., & McDicken W. N., 2000. Doppler Ultrasound. Second Edition. John Wiley and Sons.
• Gibbs, K. (1997). Advanced Physics. Second Edition. Cambridge University
Press.
• Lowe, T. L., & Rounce, J. F. (1997). Calculations for A-Level Physics. Third
Edition. Stanley Thornes (Publishers) Ltd.
• Patterson, M. Understanding Doppler Effect. Retrieved January 31, 2011 from,
http://www.schools.utah.gov/curr/sci/GIST/Understanding%20Doppler%20Effect
%20.pdf.
• Thinkquest, 2009. Doppler Effect. Retrieved February 12, 2011 from
http://library.thinkquest.org/C006027/html-ver/op-dop.html