Challenges and opportunities in the use of hydrological ... · Catalogo Nacional de Estaciones de...
31
Challenges and opportunities in the use of hydrological modelling to provide status and outlook information – Examples from Sweden, Europe, Niger River, Arctic, India, and WorldWide-HYPE Dr. Jafet Andersson Swedish Meteorological and Hydrological Institute (SMHI), Hydrology Research [email protected]
Transcript of Challenges and opportunities in the use of hydrological ... · Catalogo Nacional de Estaciones de...

Challenges and opportunities in the use of hydrological modelling to provide status and outlook information –
Examples from Sweden, Europe, Niger River, Arctic, India, and WorldWide-HYPE
Dr. Jafet Andersson Swedish Meteorological and Hydrological Institute (SMHI), Hydrology Research
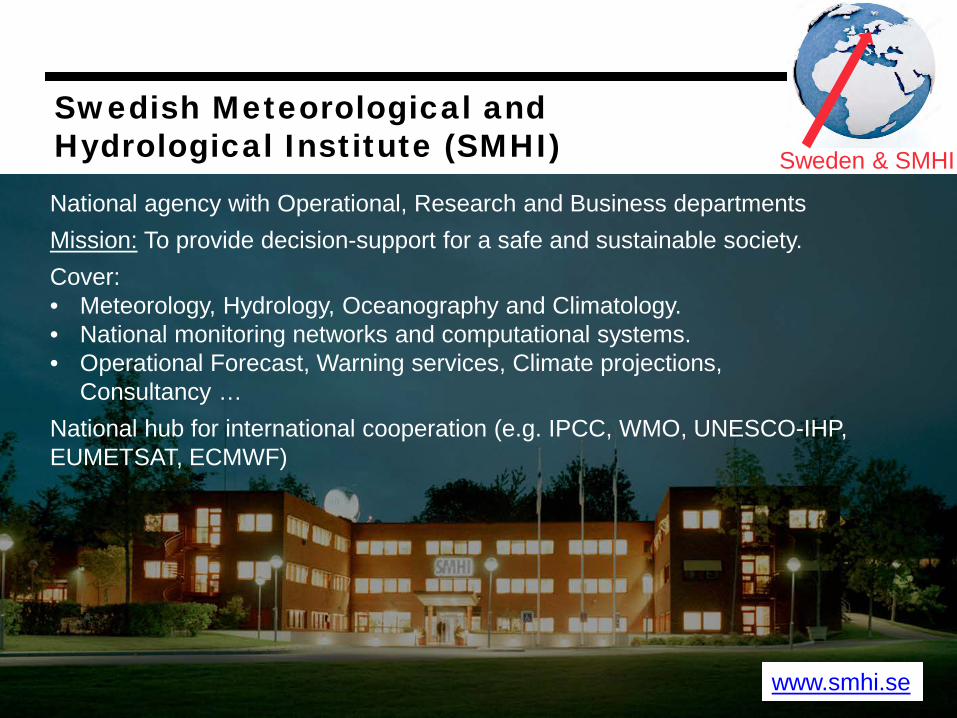
Swedish Meteorological and Hydrological Institute (SMHI) National agency with Operational, Research and Business departments Mission: To provide decision-support for a safe and sustainable society. Cover: • Meteorology, Hydrology, Oceanography and Climatology. • National monitoring networks and computational systems. • Operational Forecast, Warning services, Climate projections,
Consultancy … National hub for international cooperation (e.g. IPCC, WMO, UNESCO-IHP, EUMETSAT, ECMWF)
www.smhi.se
Sweden & SMHI
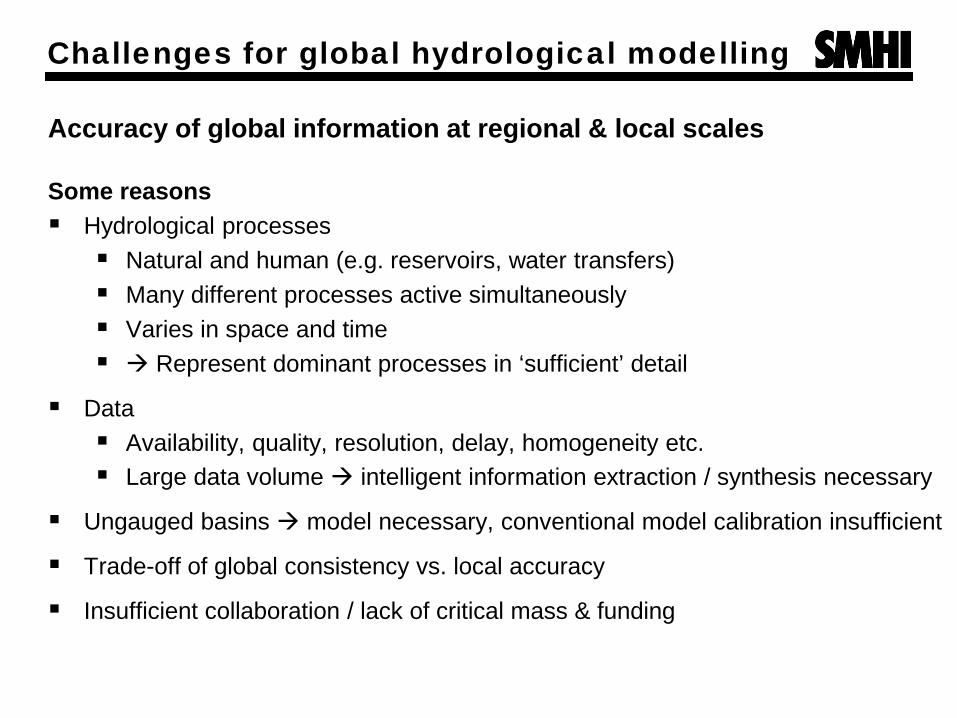
Challenges for global hydrological modelling
Accuracy of global information at regional & local scales
Some reasons Hydrological processes Natural and human (e.g. reservoirs, water transfers) Many different processes active simultaneously Varies in space and time Represent dominant processes in ‘sufficient’ detail
Data Availability, quality, resolution, delay, homogeneity etc. Large data volume intelligent information extraction / synthesis necessary
Ungauged basins model necessary, conventional model calibration insufficient
Trade-off of global consistency vs. local accuracy
Insufficient collaboration / lack of critical mass & funding

Suggestions for HydroSOS Use multiple hydrological models Distributed production Data delivery to HydroSOS using
standardised data format / API HydroSOS: synthesize, visualize and
distribute data & information to users (also low data size info.).
Benefits: Improved accuracy, Clarified uncertainty, Operational redundancy, Resource efficiency, Quick start of production, Easier to use, Critical mass, Open for new participants
Integrate observations and model data operationally Tailored operational meteorological inputs
(e.g. GFD, daily meteo. data) Data assimilation of hydrological variables
(e.g. discharge, soil moisture.) In each case, use multiple data types (in situ,
earth observations etc.)
Evaluate participating models Accuracy: performance vs. hydrological
observations, multiple variables Operational reliability: delay, missing data,
data format Openness of code/model: transparency,
better development, easier for new groups to contribute
Evaluate global models at regional & local scales, standardised protocols
Communicate skill Community Critical mass of developers, producers and
users at global, regional and local scales Each NMS/NHS test global information in
their country & provide feedback (e.g. evaluation results, suggested improvements, implemented improvements)
Versions
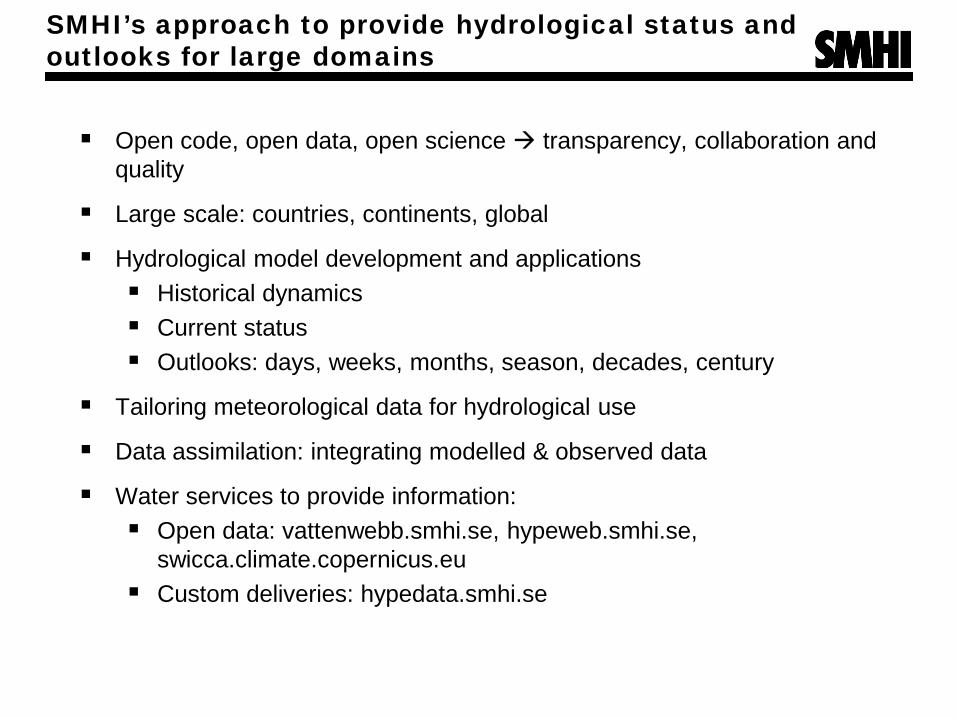
SMHI’s approach to provide hydrological status and outlooks for large domains
Open code, open data, open science transparency, collaboration and quality
Large scale: countries, continents, global
Hydrological model development and applications Historical dynamics Current status Outlooks: days, weeks, months, season, decades, century
Tailoring meteorological data for hydrological use
Data assimilation: integrating modelled & observed data
Water services to provide information: Open data: vattenwebb.smhi.se, hypeweb.smhi.se,
swicca.climate.copernicus.eu Custom deliveries: hypedata.smhi.se

The hydrological model HYPE
Aims Simulate the land phase
of the water cyle Capture dynamics of
water flow and water storage (and WQ)
Hydrological fluxes & stores Streamflow (discharge) Precipitation Snow and glaciers Infiltration Soil moisture Evapotranspiration Runoff (surface & sub-
surface) Routing Lakes Floodplains Reservoirs Irrigation …
Semi-distributed River basins Catchments Hydrologic
Response Units (HRUs)
Open-source: http://hypecode.smhi.se Process detail: keep it simple, capture major dynamics, balanced complexity
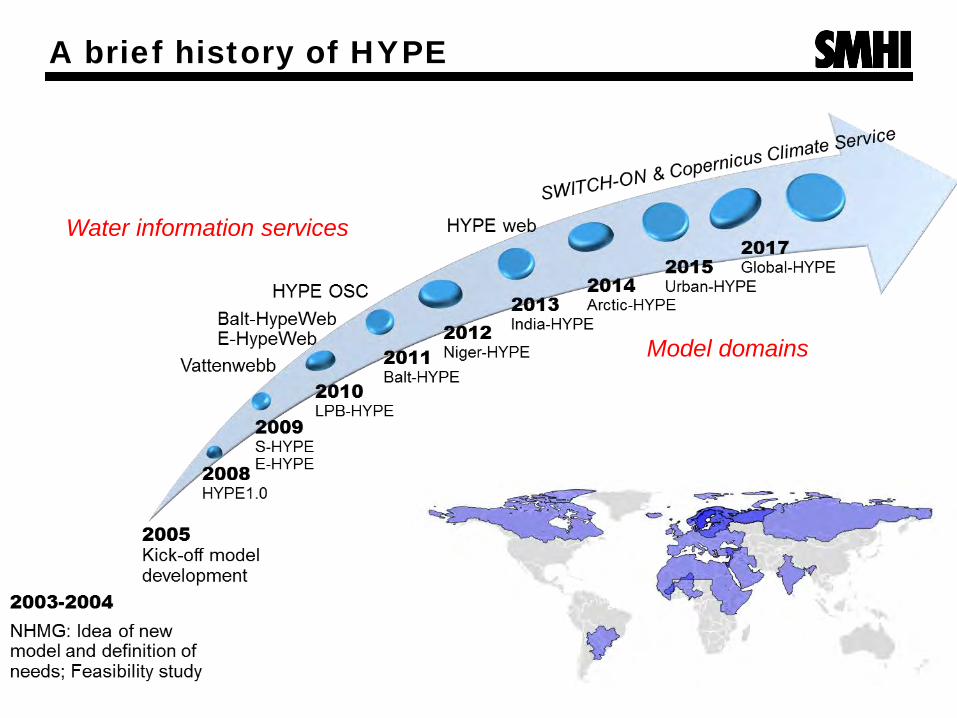
A brief history of HYPE
Water information services
Model domains

Current status & outlooks in Sweden and beyond
Source: http://vattenwebb.smhi.se/
Quick overview Interactive details for each catchment
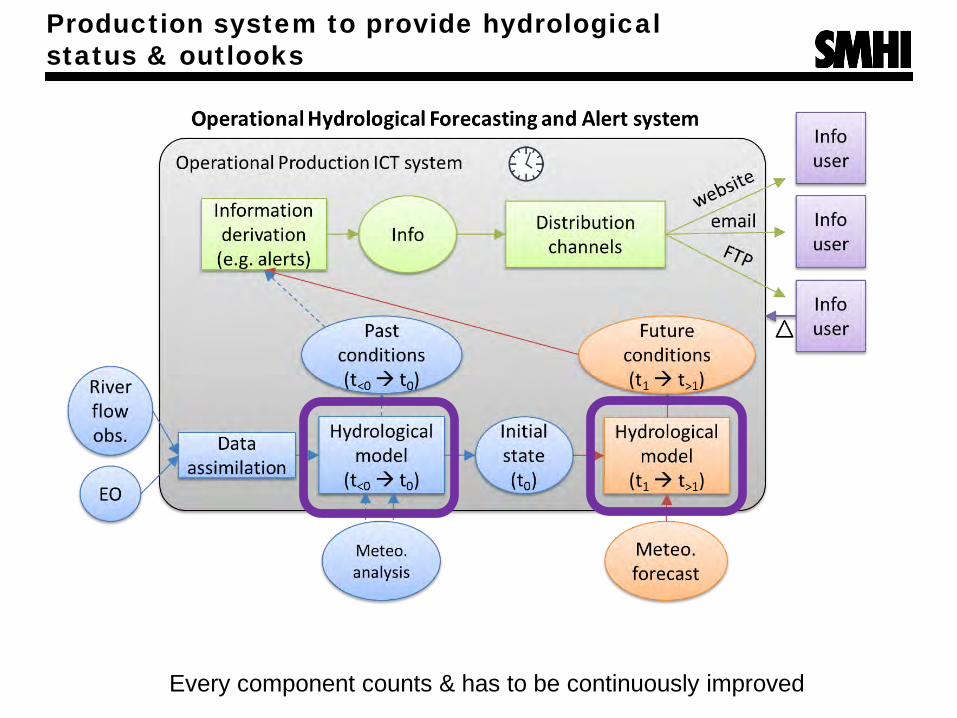
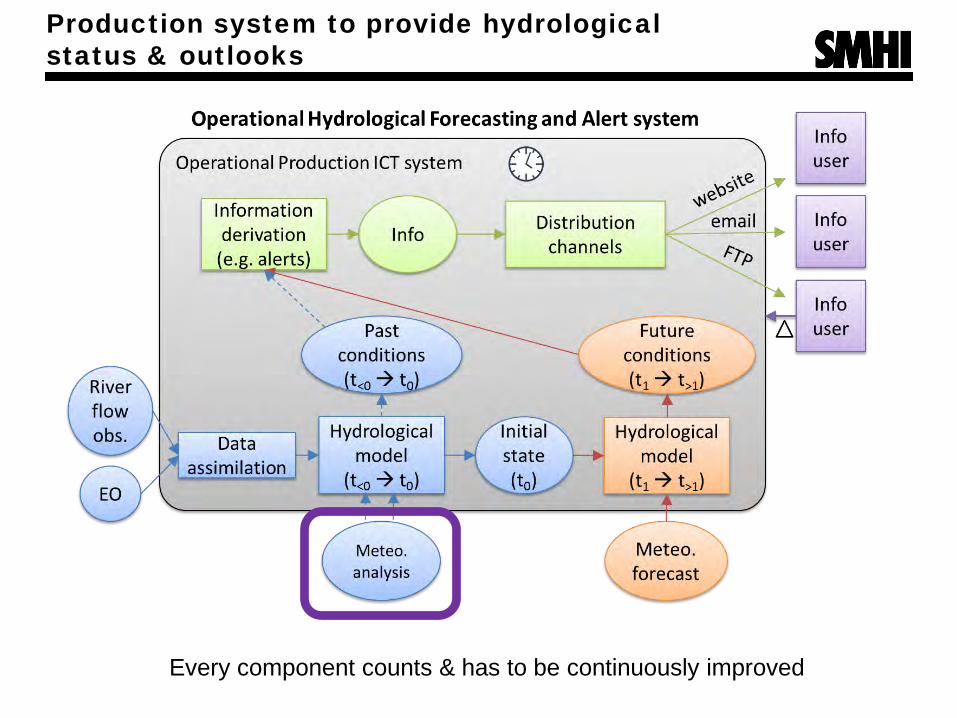
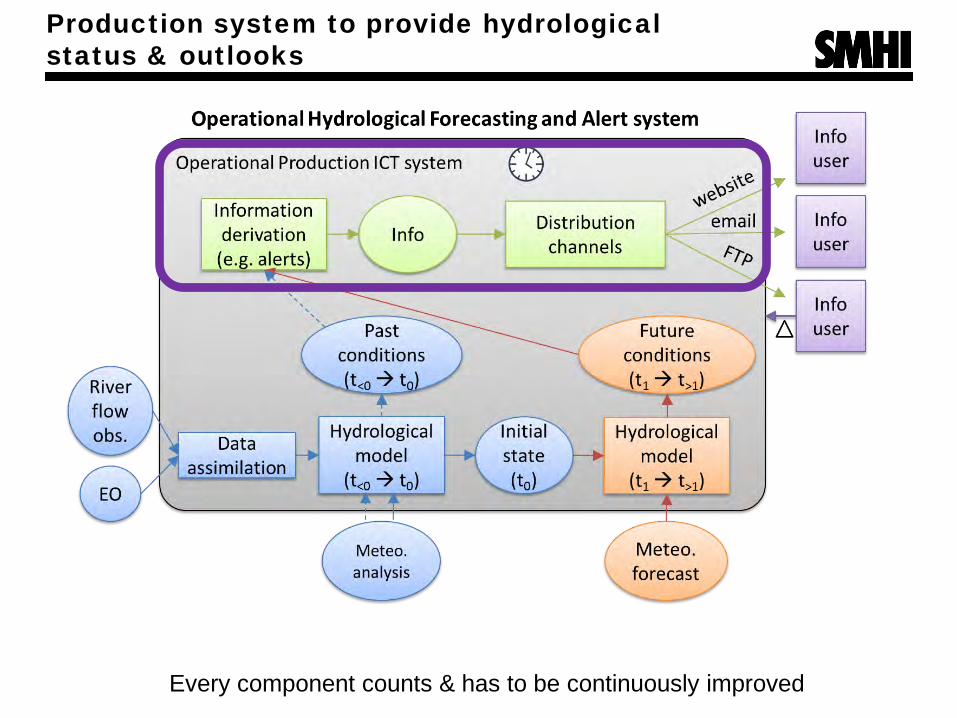
Production system to provide hydrological status & outlooks
Every component counts & has to be continuously improved

Collaboration to refine process descriptions: example of floodplain dynamics in Niger River, West Africa
Inner Niger Delta >30000 km2 in Mali Annual flooding processes: floodplain
with dynamic area, river area & atmospheric exchange, post-flood evaporation
Regional collaboration AGRHYMET: process understanding SMHI: process conceptualization and
programming of open-source solution Results Increased model performance Increases local understanding and
confidence in model (status/outlooks)
Andersson et al. (2017) http://dx.doi.org/10.1016/j.pce.2017.02.010
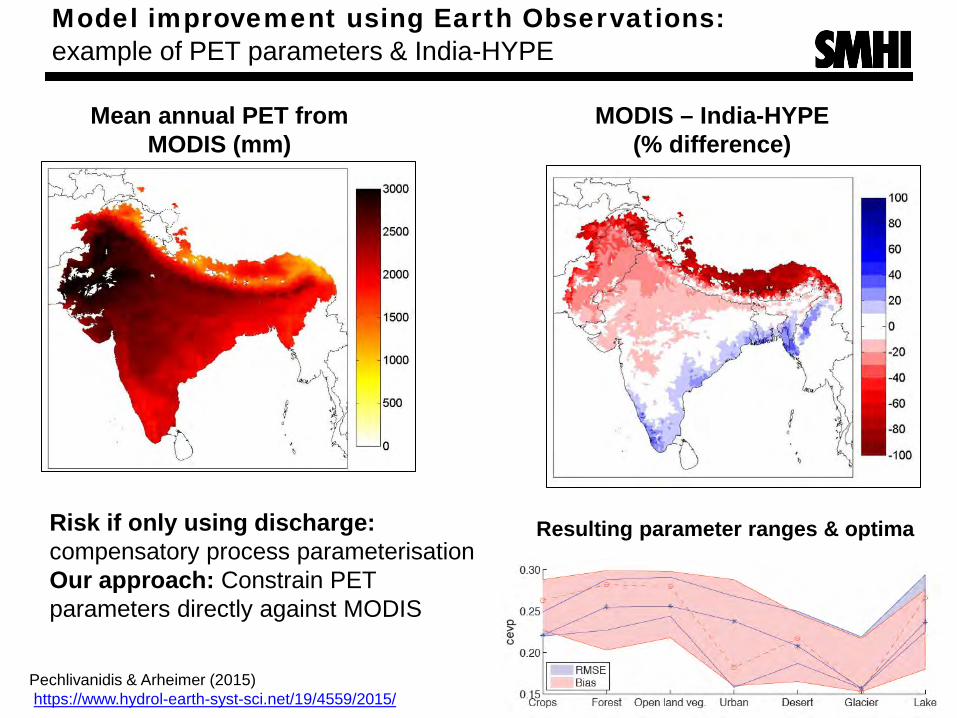
Model improvement using Earth Observations: example of PET parameters & India-HYPE
Mean annual PET from MODIS (mm)
Resulting parameter ranges & optima Parameter identicevp identifiability for each land use class
MODIS – India-HYPE (% difference)
Risk if only using discharge: compensatory process parameterisation Our approach: Constrain PET parameters directly against MODIS
Pechlivanidis & Arheimer (2015) https://www.hydrol-earth-syst-sci.net/19/4559/2015/
Production system to provide hydrological status & outlooks
Every component counts & has to be continuously improved
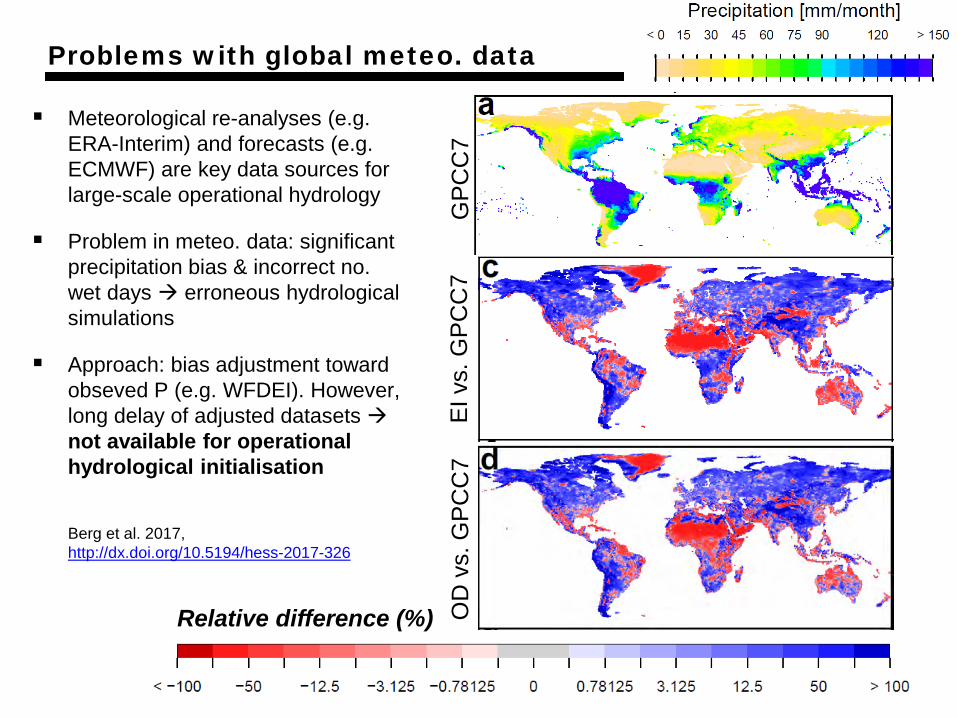
Problems with global meteo. data
Meteorological re-analyses (e.g. ERA-Interim) and forecasts (e.g. ECMWF) are key data sources for large-scale operational hydrology
Problem in meteo. data: significant precipitation bias & incorrect no. wet days erroneous hydrological simulations
Approach: bias adjustment toward obseved P (e.g. WFDEI). However, long delay of adjusted datasets not available for operational hydrological initialisation
GP
CC
7 E
I vs.
GP
CC
7 O
D v
s. G
PC
C7
Relative difference (%)
Berg et al. 2017, http://dx.doi.org/10.5194/hess-2017-326
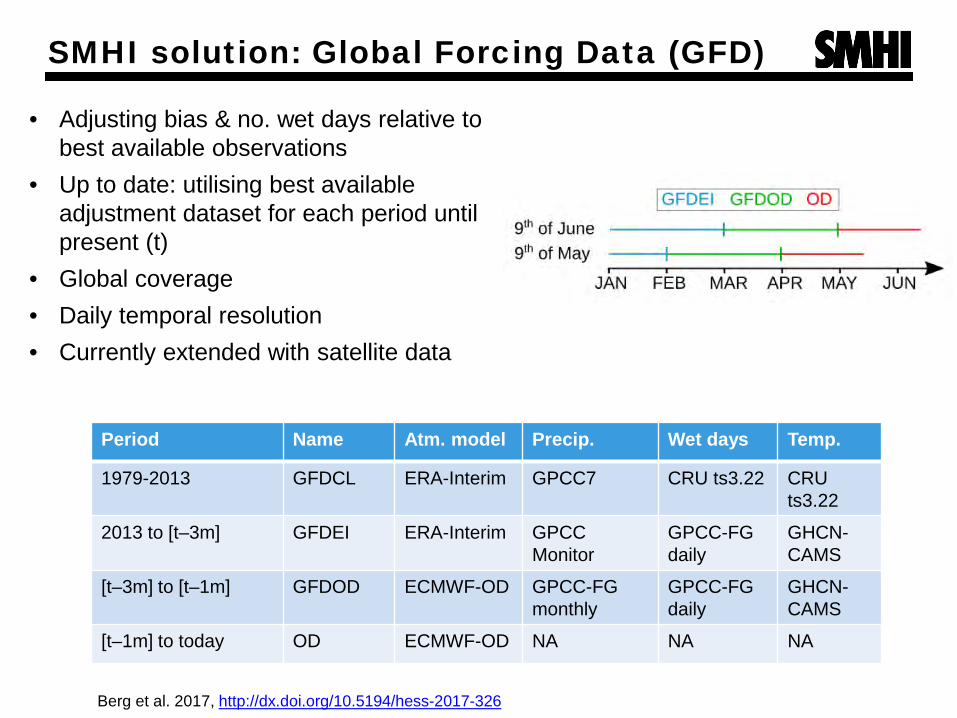
SMHI solution: Global Forcing Data (GFD)
Berg et al. 2017, http://dx.doi.org/10.5194/hess-2017-326
• Adjusting bias & no. wet days relative to best available observations
• Up to date: utilising best available adjustment dataset for each period until present (t)
• Global coverage • Daily temporal resolution • Currently extended with satellite data
Period Name Atm. model Precip. Wet days Temp.
1979-2013 GFDCL ERA-Interim GPCC7 CRU ts3.22 CRU ts3.22
2013 to [t–3m] GFDEI ERA-Interim GPCC Monitor
GPCC-FG daily
GHCN-CAMS
[t–3m] to [t–1m] GFDOD ECMWF-OD GPCC-FG monthly
GPCC-FG daily
GHCN-CAMS
[t–1m] to today OD ECMWF-OD NA NA NA
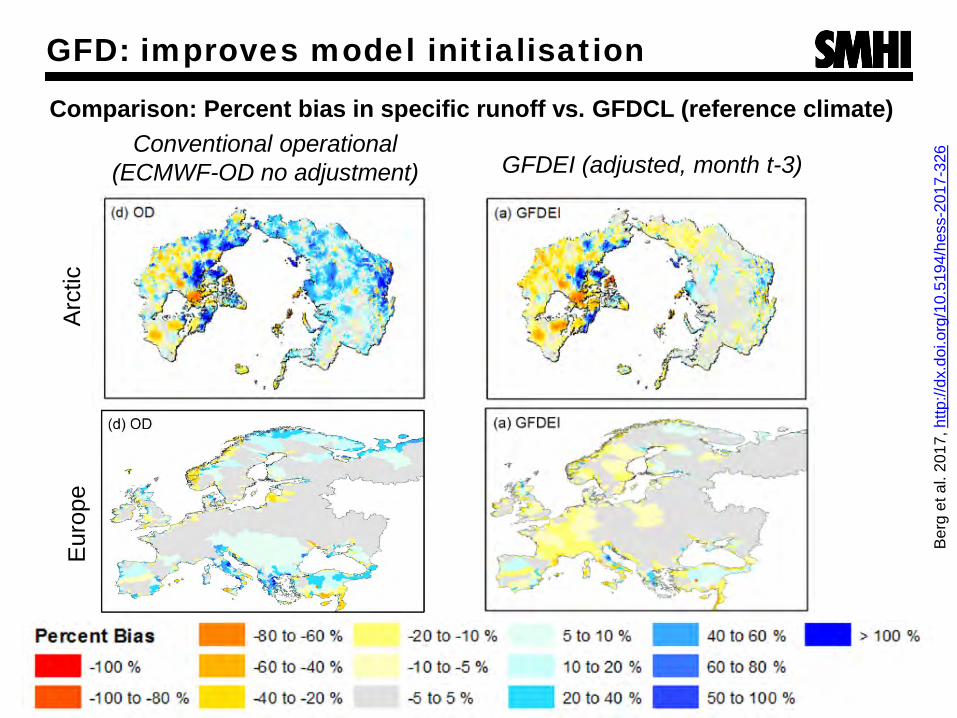
GFD: improves model initialisation
Conventional operational (ECMWF-OD no adjustment)
Arc
tic
Eur
ope
GFDEI (adjusted, month t-3)
Comparison: Percent bias in specific runoff vs. GFDCL (reference climate)
Ber
g et
al.
2017
, http
://dx
.doi
.org
/10.
5194
/hes
s-20
17-3
26

Production system to provide hydrological status & outlooks
Every component counts & has to be continuously improved

Improving status & outlooks by integrating modelled & observed data (Sweden)
Lindström et al. The power of simple downstream updating, submittted
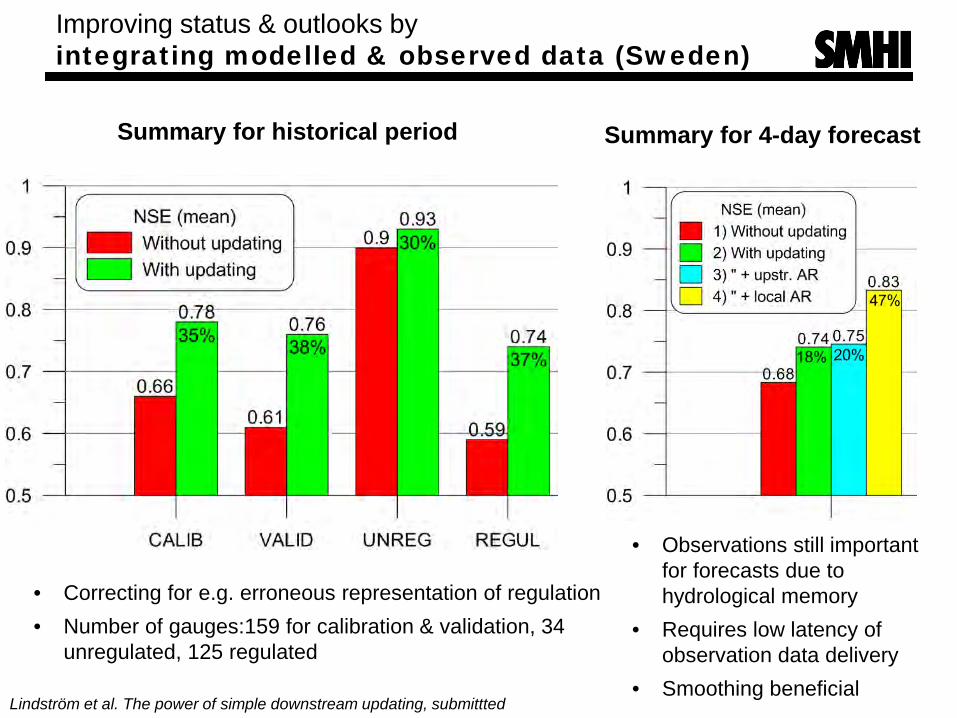
Summary for historical period
• Correcting for e.g. erroneous representation of regulation • Number of gauges:159 for calibration & validation, 34
unregulated, 125 regulated
Summary for 4-day forecast
Lindström et al. The power of simple downstream updating, submittted
• Observations still important for forecasts due to hydrological memory
• Requires low latency of observation data delivery
• Smoothing beneficial
Improving status & outlooks by integrating modelled & observed data (Sweden)

Production system to provide hydrological status & outlooks
Every component counts & has to be continuously improved
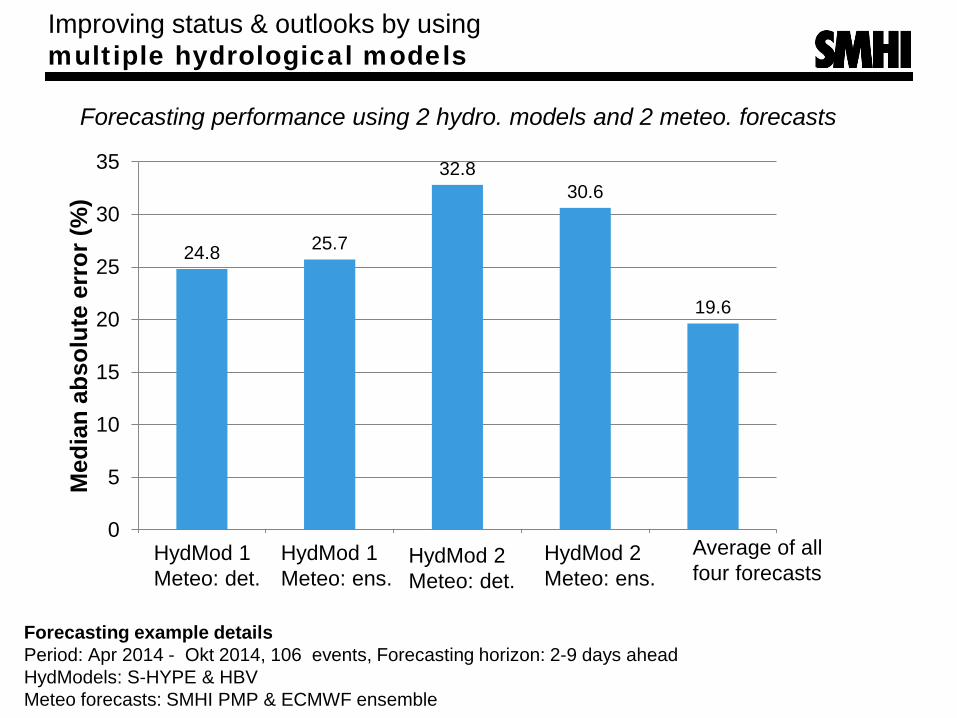
Forecasting example details Period: Apr 2014 - Okt 2014, 106 events, Forecasting horizon: 2-9 days ahead HydModels: S-HYPE & HBV Meteo forecasts: SMHI PMP & ECMWF ensemble
24.8 25.7
32.8 30.6
19.6
0
5
10
15
20
25
30
35
SH-PMP SH-EPS HBV-PMP HBV-EPS MEDEL
Med
ian
abso
lute
err
or (%
)
HydMod 1 Meteo: det.
HydMod 1 Meteo: ens.
HydMod 2 Meteo: det.
HydMod 2 Meteo: ens.
Average of all four forecasts
Improving status & outlooks by using multiple hydrological models
Forecasting performance using 2 hydro. models and 2 meteo. forecasts
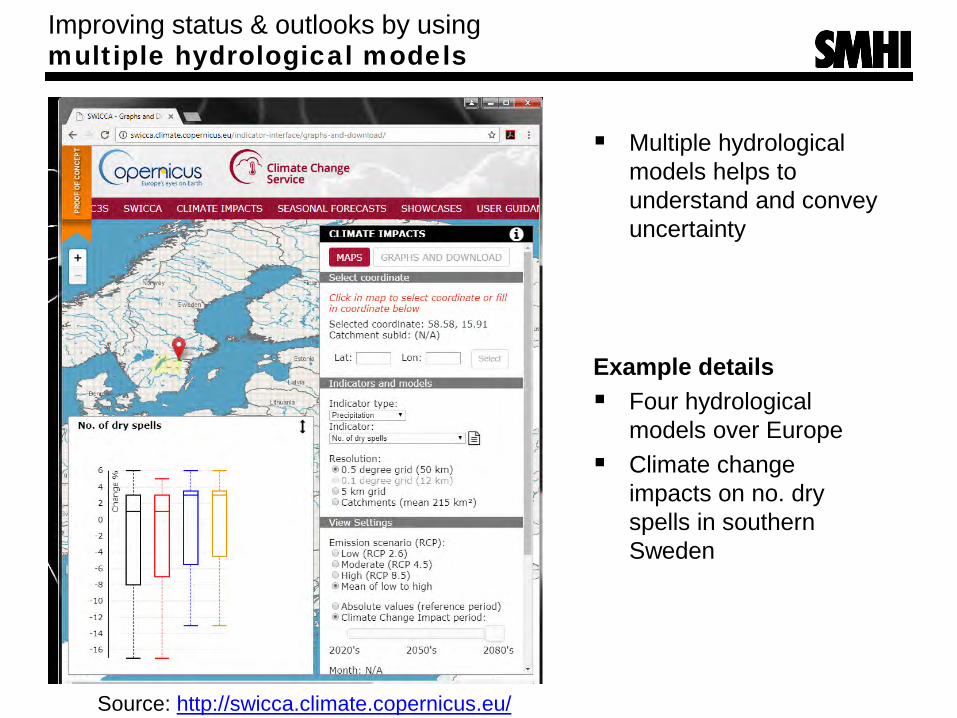
Multiple hydrological models helps to understand and convey uncertainty
Example details Four hydrological
models over Europe Climate change
impacts on no. dry spells in southern Sweden
Source: http://swicca.climate.copernicus.eu/
Improving status & outlooks by using multiple hydrological models
Production system to provide hydrological status & outlooks
Every component counts & has to be continuously improved
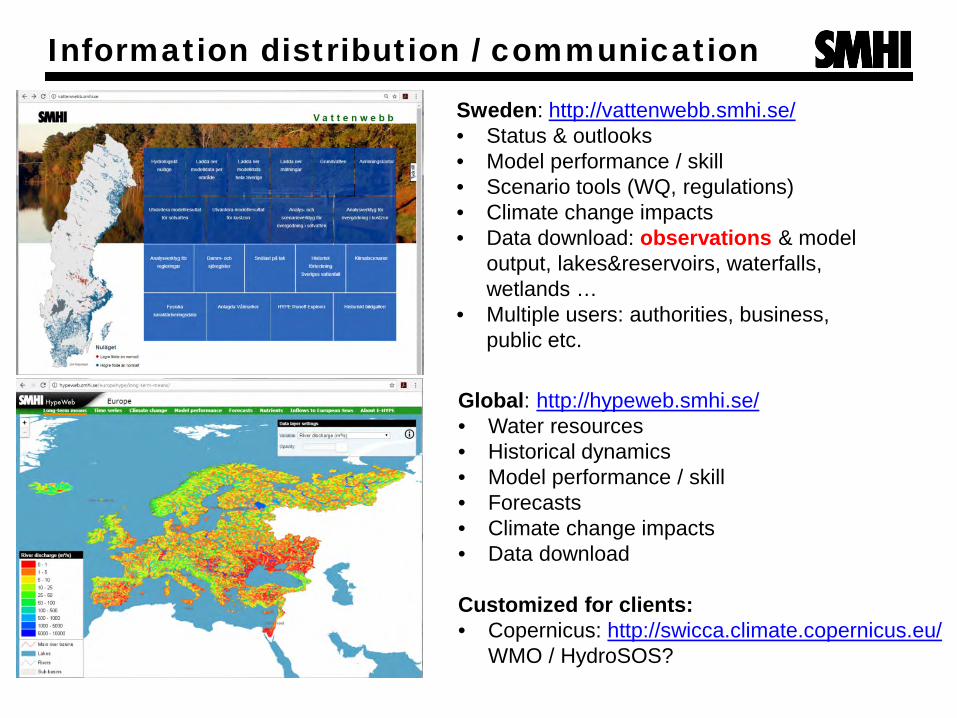
Information distribution / communication
Sweden: http://vattenwebb.smhi.se/ • Status & outlooks • Model performance / skill • Scenario tools (WQ, regulations) • Climate change impacts • Data download: observations & model
output, lakes&reservoirs, waterfalls, wetlands …
• Multiple users: authorities, business, public etc.
Global: http://hypeweb.smhi.se/ • Water resources • Historical dynamics • Model performance / skill • Forecasts • Climate change impacts • Data download
Customized for clients: • Copernicus: http://swicca.climate.copernicus.eu/
WMO / HydroSOS?
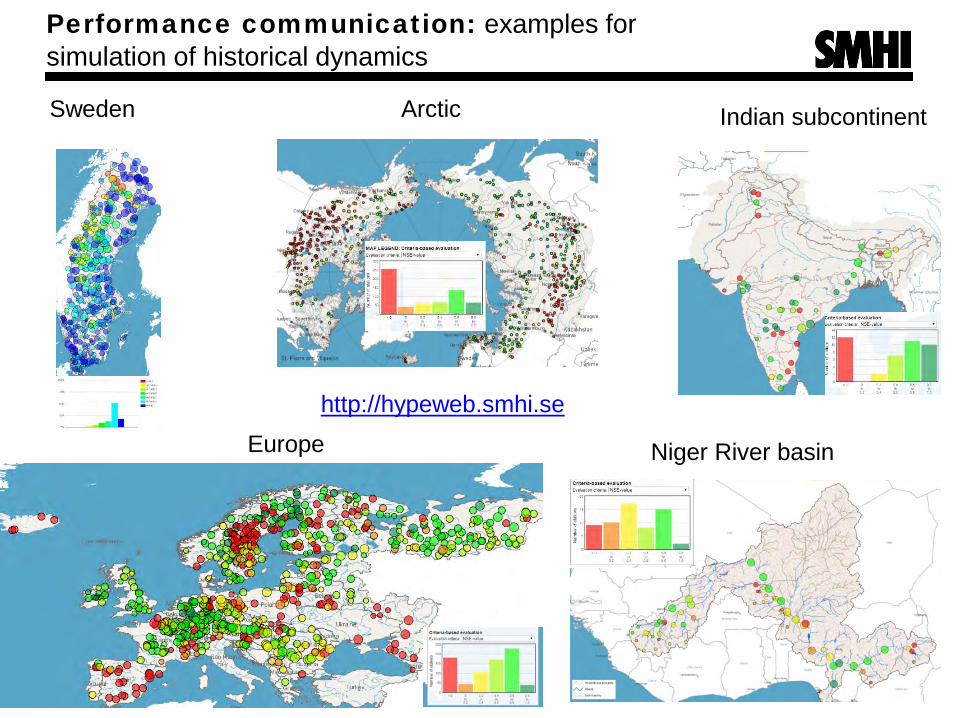
Performance communication: examples for simulation of historical dynamics
Niger River basin
Indian subcontinent Arctic
Europe
Sweden
http://hypeweb.smhi.se
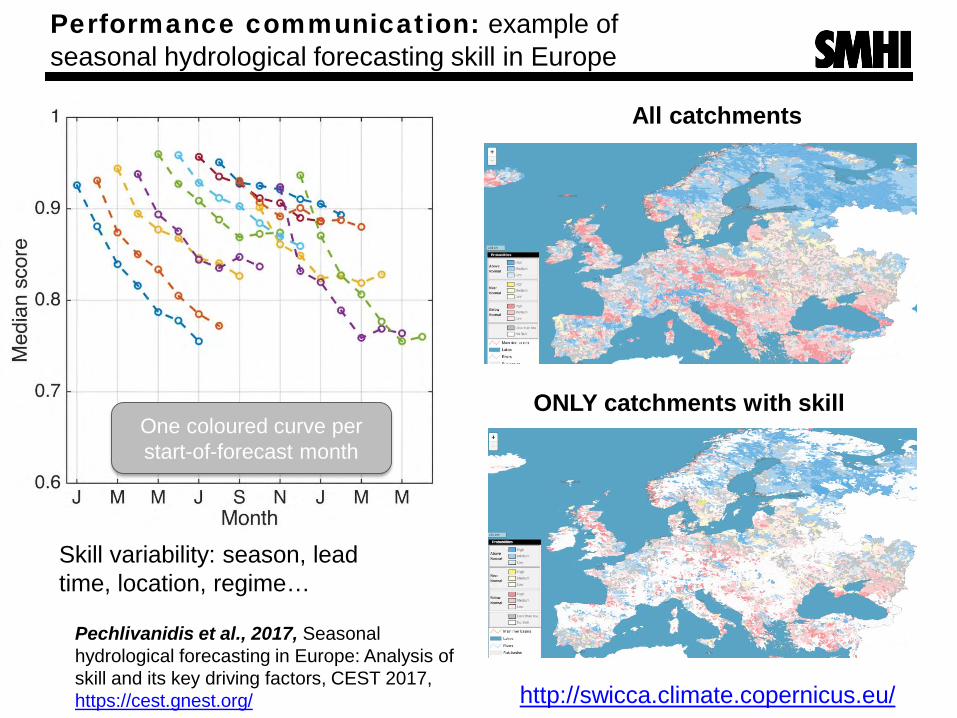
Performance communication: example of seasonal hydrological forecasting skill in Europe
Pechlivanidis et al., 2017, Seasonal hydrological forecasting in Europe: Analysis of skill and its key driving factors, CEST 2017, https://cest.gnest.org/
One coloured curve per start-of-forecast month
ONLY catchments with skill
All catchments
Skill variability: season, lead time, location, regime…
http://swicca.climate.copernicus.eu/
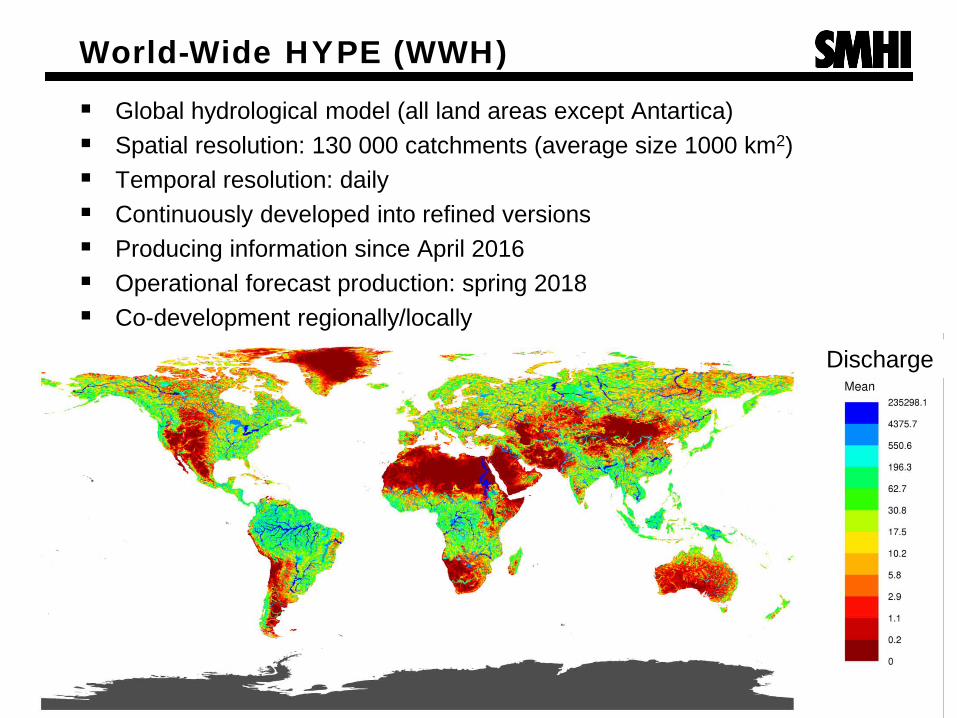
World-Wide HYPE (WWH)
Global hydrological model (all land areas except Antartica) Spatial resolution: 130 000 catchments (average size 1000 km2) Temporal resolution: daily Continuously developed into refined versions Producing information since April 2016 Operational forecast production: spring 2018 Co-development regionally/locally
Discharge
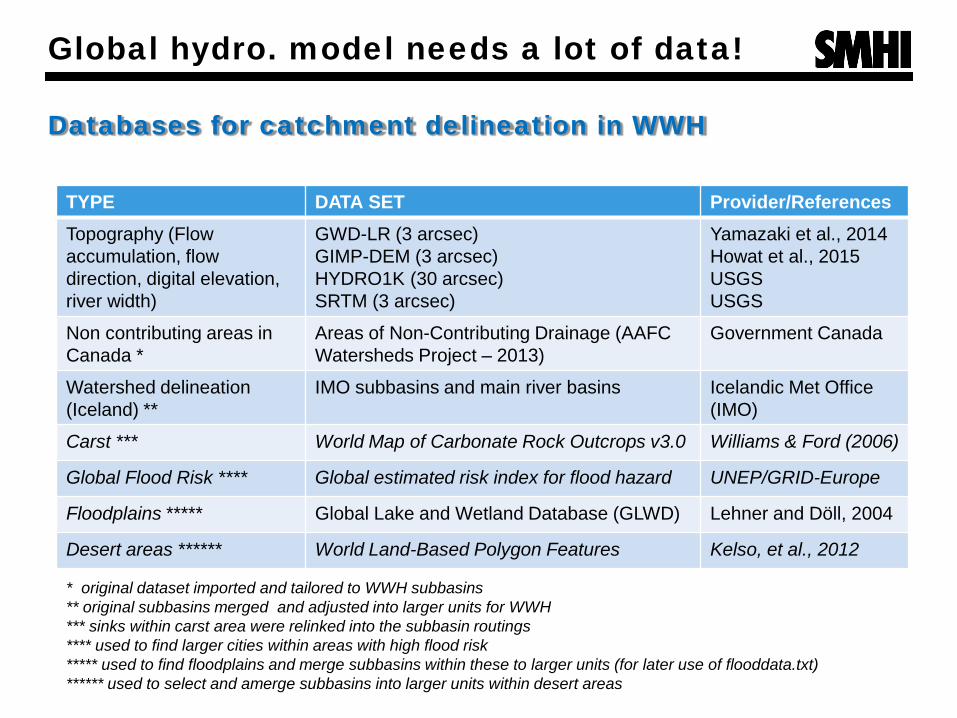
Global hydro. model needs a lot of data! Databases for catchment delineation in WWH
TYPE DATA SET Provider/References Topography (Flow accumulation, flow direction, digital elevation, river width)
GWD-LR (3 arcsec) GIMP-DEM (3 arcsec) HYDRO1K (30 arcsec) SRTM (3 arcsec)
Yamazaki et al., 2014 Howat et al., 2015 USGS USGS
Non contributing areas in Canada *
Areas of Non-Contributing Drainage (AAFC Watersheds Project – 2013)
Government Canada
Watershed delineation (Iceland) **
IMO subbasins and main river basins Icelandic Met Office (IMO)
Carst *** World Map of Carbonate Rock Outcrops v3.0 Williams & Ford (2006)
Global Flood Risk **** Global estimated risk index for flood hazard UNEP/GRID-Europe
Floodplains ***** Global Lake and Wetland Database (GLWD) Lehner and Döll, 2004
Desert areas ****** World Land-Based Polygon Features Kelso, et al., 2012
* original dataset imported and tailored to WWH subbasins ** original subbasins merged and adjusted into larger units for WWH *** sinks within carst area were relinked into the subbasin routings **** used to find larger cities within areas with high flood risk ***** used to find floodplains and merge subbasins within these to larger units (for later use of flooddata.txt) ****** used to select and amerge subbasins into larger units within desert areas

Global hydro. model needs a lot of data! Databases for land cover, lakes & reservoirs in WWH
TYPE DATA SET Provider/References Land cover characteristics
ESA CCI Landcover v 1.6.1 epoch 2010 (300 m)
ESA Climate Change Initiative - Land Cover project
Glaciers* Randolph Glacier Inventory (RGI) v 5.0 Arendt et al., 2015
Lakes** ESA CCI-LC Waterbodies 150 m 2000 v 4.0
ESA Climate Change Initiative - Land Cover project
Lakes** Global Lake and Wetland Database 1.1 (GLWD)
Lehner and Döll, 2004
Lake depths Global Lake Database v2(GLDB) Kourzeneva, 2010, 2012, Oulga, 2014
Reservoirs and dams**
Global Reservoir and Dam database v 1.1 (GRanD)
Lehner et al., 2011
Irrigation*** GMIA v5.0 Siebert et al., 2013
* Added as a land cover class in the land cover grid ** Combination of databases resulting in: A new world lakes database for global hydrological modelling, Piementel et al., EGU 2017. *** Irrigated/nonirrigated cropland has been updated with information from GMIA v5.0

Global hydro. model needs a lot of data! Databases: meteorological inputs in WWH
TYPE DATA SET Provider/References Precipitation MSWEP v1.1* (Multi-Source Weighted-
Ensamble Precipitation) Beck, H.E et al. (2016)
Temperature GFD (Global Forcing Data) Berg et al., in review 2017
Climate classification*
Köppen-Geiger Climate classification, 1976-2000, v June 2006
Institute for Veterinary Public Health, Vienna
• Used for linking subbasins to optimal PET (Potential EvapoTranspiration) model option in HYPE.
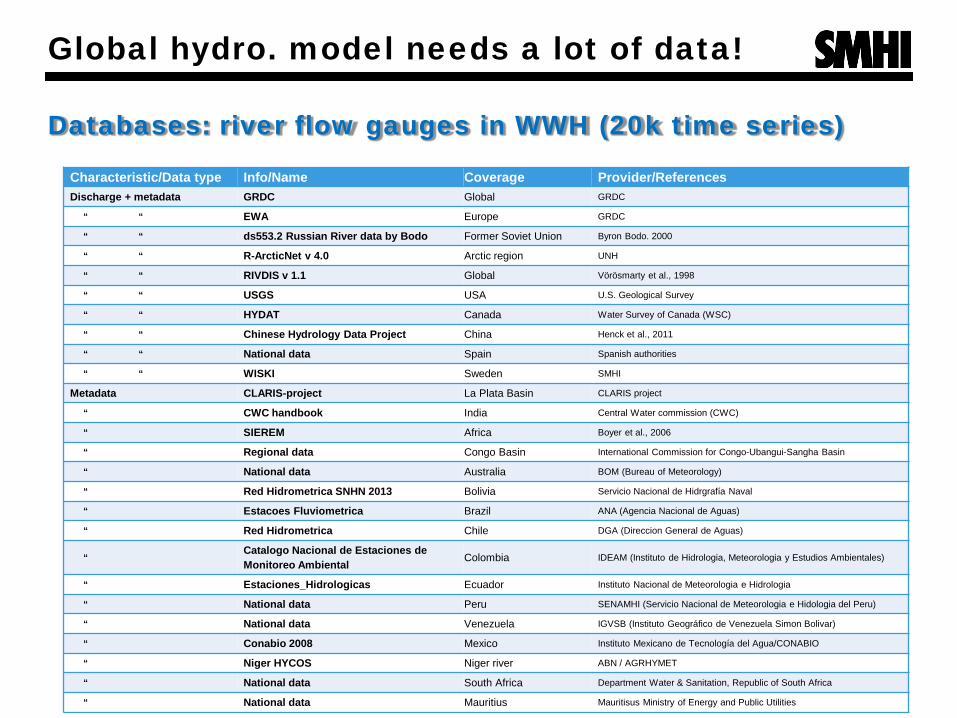
Global hydro. model needs a lot of data! Databases: river flow gauges in WWH (20k time series)
Characteristic/Data type Info/Name Coverage Provider/References Discharge + metadata GRDC Global GRDC
“ “ EWA Europe GRDC
“ “ ds553.2 Russian River data by Bodo Former Soviet Union Byron Bodo. 2000
“ “ R-ArcticNet v 4.0 Arctic region UNH
“ “ RIVDIS v 1.1 Global Vörösmarty et al., 1998
“ “ USGS USA U.S. Geological Survey
“ “ HYDAT Canada Water Survey of Canada (WSC)
“ “ Chinese Hydrology Data Project China Henck et al., 2011
“ “ National data Spain Spanish authorities
“ “ WISKI Sweden SMHI
Metadata CLARIS-project La Plata Basin CLARIS project
“ CWC handbook India Central Water commission (CWC)
“ SIEREM Africa Boyer et al., 2006
“ Regional data Congo Basin International Commission for Congo-Ubangui-Sangha Basin
“ National data Australia BOM (Bureau of Meteorology)
“ Red Hidrometrica SNHN 2013 Bolivia Servicio Nacional de Hidrgrafía Naval
“ Estacoes Fluviometrica Brazil ANA (Agencia Nacional de Aguas)
“ Red Hidrometrica Chile DGA (Direccion General de Aguas)
“ Catalogo Nacional de Estaciones de Monitoreo Ambiental Colombia IDEAM (Instituto de Hidrologia, Meteorologia y Estudios Ambientales)
“ Estaciones_Hidrologicas Ecuador Instituto Nacional de Meteorologia e Hidrologia
“ National data Peru SENAMHI (Servicio Nacional de Meteorologia e Hidologia del Peru)
“ National data Venezuela IGVSB (Instituto Geográfico de Venezuela Simon Bolivar)
“ Conabio 2008 Mexico Instituto Mexicano de Tecnología del Agua/CONABIO
“ Niger HYCOS Niger river ABN / AGRHYMET
“ National data South Africa Department Water & Sanitation, Republic of South Africa
“ National data Mauritius Mauritisus Ministry of Energy and Public Utilities

Suggestions for HydroSOS Use multiple hydrological models Distributed production Data delivery to HydroSOS using
standardised data format / API HydroSOS: synthesize, visualize and
distribute data & information to users (also low data size info.).
Benefits: Improved accuracy, Clarified uncertainty, Operational redundancy, Resource efficiency, Quick start of production, Easier to use, Critical mass, Open for new participants
Integrate observations and model data operationally Tailored operational meteorological inputs
(e.g. GFD, daily meteo. data) Data assimilation of hydrological variables
(e.g. discharge, soil moisture.) In each case, use multiple data types (in situ,
earth observations etc.)
Evaluate participating models Accuracy: performance vs. hydrological
observations, multiple variables Operational reliability: delay, missing data,
data format Openness of code/model: transparency,
better development, easier for new groups to contribute
Evaluate global models at regional & local scales, standardised protocols
Community Critical mass of developers, producers and
users at global, regional and local scales Each NMS/NHS test global information in
their country & provide feedback (e.g. evaluation results, suggested improvements, implemented improvements)
SMHI wants to participate with our experience, operational production system, and communication platforms
Versions