CHALLENGES AND LEARNING SUPPORT NEEDS OF MATHS, RESEARCH ... · challenges and learning support...
12
Sept. 2013. Vol. 3, No.1 ISSN 2307-227X International Journal of Research In Social Sciences © 2013 IJRSS & K.A.J. All rights reserved www.ijsk.org/ijrss 77 CHALLENGES AND LEARNING SUPPORT NEEDS OF MATHS, RESEARCH METHODS AND STATISTICS ODL STUDENTS: THE CASE FOR ZOU-MIDLANDS REGION Silvanos Chirume Department of Mathematics and Statistics, Faculty of Science and Technology Zimbabwe Open University, Midlands Region. [email protected] ABSTRACT Statistics and Research Methods are offered in almost all modules of the Zimbabwe Open University programmes while Mathematics is offered in a few programmes. However, all these courses seem to be a challenge to the students no matter what programme or year of study they are in. This is so because the mark profiles show poor achievement and the students display negative attitudes to these courses during their registration and studies as seen from personal observations. This paper investigated the challenges that these students face as they learn through the open and distance learning mode. The targeted sample was 76 students out of 228 who had registered for these modules in the second semester of 2012. All students who had come for tutorials were asked to complete a questionnaire but only 59 responded. Four students, conveniently selected and each belonging to one of the four faculties, constituted the focus group interview panel. SPSS version 11.5 was used to analyse data. It was found that most students faced big challenges pertaining to the administration or management, financial, family and work pressures, library and internet, and their peers. Tutor, module and ‘personal’ related challenges were less prevalent. The study also revealed that students’ success depends on the quality and type of the learning support the university should give and which the students, on their part, must fully utilize to their benefit. The respondents’ most pertinent needs were in the areas of having revised modules, having a user-friendly and clear fee payment plan, having a clear policy on release and publication of results, and on updating and improving library and internet facilities. The focus group interview produced similar results. The university authorities are hereby challenged to have a clear ODL policy that ensures quality, sustainability and continual improvement so as to help students and their communities meet social and economic challenges. Suggestions and recommendations for the learning support students should be given are outlined in this study. These could help to inform policy and improve quality in open and distance learning universities in Africa. African universities have the potential to become ‘world class’ but it seems some lack clear policy guidelines. Key Terms: statistics anxiety, challenges, learning support, Maths, Statistics, Research Methods, ODL mode, ODL policy INTRODUCTION Zimbabwe Open University (ZOU) is a multi- disciplinary and inter-faculty institution that was mandated by the Zimbabwe Government through an Act of Parliament in March 1999 to offer open and distance learning (ODL) to youth and adult learners in Zimbabwe and elsewhere (ZOU General Information and Regulations, 2007). In the second semester of 2012, ZOU had more than 30 diploma and degree programmes on offer. Most of these programmes have Research Methods, or Research Methods and Statistics, or Mathematics modules that the learners must do and pass. However, during registration and tutorials, this researcher has observed that most of these learners show high anxiety and negative attitude to these courses. They procrastinate on assignments and their mark profiles depict poor achievement. It has been shown that about 80% of graduate students suffer from statistics anxiety which reduces their performance in statistics and research methodology courses (Onwuegbuzie, 2004). The ZOU learners would have to register again for these and other
-
Upload
truonghuong -
Category
Documents
-
view
218 -
download
4
Transcript of CHALLENGES AND LEARNING SUPPORT NEEDS OF MATHS, RESEARCH ... · challenges and learning support...
Sept. 2013. Vol. 3, No.1 ISSN 2307-227X International Journal of Research In Social Sciences © 2013 IJRSS & K.A.J. All rights reserved www.ijsk.org/ijrss
77
CHALLENGES AND LEARNING SUPPORT NEEDS OF MATHS,
RESEARCH METHODS AND STATISTICS ODL STUDENTS: THE
CASE FOR ZOU-MIDLANDS REGION
Silvanos Chirume
Department of Mathematics and Statistics, Faculty of Science and Technology
Zimbabwe Open University, Midlands Region.
ABSTRACT
Statistics and Research Methods are offered in almost all modules of the Zimbabwe Open University
programmes while Mathematics is offered in a few programmes. However, all these courses seem to be a
challenge to the students no matter what programme or year of study they are in. This is so because the mark
profiles show poor achievement and the students display negative attitudes to these courses during their
registration and studies as seen from personal observations. This paper investigated the challenges that these
students face as they learn through the open and distance learning mode. The targeted sample was 76 students
out of 228 who had registered for these modules in the second semester of 2012. All students who had come for
tutorials were asked to complete a questionnaire but only 59 responded. Four students, conveniently selected
and each belonging to one of the four faculties, constituted the focus group interview panel. SPSS version 11.5
was used to analyse data. It was found that most students faced big challenges pertaining to the administration
or management, financial, family and work pressures, library and internet, and their peers. Tutor, module and
‘personal’ related challenges were less prevalent. The study also revealed that students’ success depends on the
quality and type of the learning support the university should give and which the students, on their part, must
fully utilize to their benefit. The respondents’ most pertinent needs were in the areas of having revised modules,
having a user-friendly and clear fee payment plan, having a clear policy on release and publication of results,
and on updating and improving library and internet facilities. The focus group interview produced similar
results. The university authorities are hereby challenged to have a clear ODL policy that ensures quality,
sustainability and continual improvement so as to help students and their communities meet social and
economic challenges. Suggestions and recommendations for the learning support students should be given are
outlined in this study. These could help to inform policy and improve quality in open and distance learning
universities in Africa. African universities have the potential to become ‘world class’ but it seems some lack
clear policy guidelines.
Key Terms: statistics anxiety, challenges, learning support, Maths, Statistics, Research Methods, ODL mode,
ODL policy
INTRODUCTION
Zimbabwe Open University (ZOU) is a multi-
disciplinary and inter-faculty institution that was
mandated by the Zimbabwe Government through
an Act of Parliament in March 1999 to offer open
and distance learning (ODL) to youth and adult
learners in Zimbabwe and elsewhere (ZOU General
Information and Regulations, 2007). In the second
semester of 2012, ZOU had more than 30 diploma
and degree programmes on offer. Most of these
programmes have Research Methods, or Research
Methods and Statistics, or Mathematics modules
that the learners must do and pass. However,
during registration and tutorials, this researcher has
observed that most of these learners show high
anxiety and negative attitude to these courses. They
procrastinate on assignments and their mark
profiles depict poor achievement. It has been
shown that about 80% of graduate students suffer
from statistics anxiety which reduces their
performance in statistics and research methodology
courses (Onwuegbuzie, 2004). The ZOU learners
would have to register again for these and other
Sept. 2013. Vol. 3, No.1 ISSN 2307-227X International Journal of Research In Social Sciences © 2013 IJRSS & K.A.J. All rights reserved www.ijsk.org/ijrss
78
courses in the coming semester, a scenario that
leaves them financially worse off and calls for
more anxiety again.
According to Mnyanyi and Mbwette (2009) there is
need to remove barriers in ODL in developing
countries. The above situation has led this
researcher to investigate the challenges that these
learners face and the learning support they need.
CONTEXTUAL AND THEORETICAL
FRAMEWORKS
The primary aim of ODL is to open the world of
higher education learning to all, deprived by time,
place and poverty (Odeyemi, 2012). In developing
countries such as Zimbabwe ODL is of vital
importance as a means towards professional
development. It might also contribute to equality in
education by widening women’s opportunities to
learn (Commonwealth of Learning & Asian
Development Bank (COL & ADB), 1999) and may
lead to poverty reduction if programmes are
properly managed and well funded (Mnyanyi &
Mbwette, 2009).
Unlike conventional learning in the classroom
where the lecturer is there to lecture and explain
and the student takes down notes, ODL can be
delivered in various modes. The most common are
face-to-face meetings or tutorials, use of modules,
mixed media courseware, two-way communication
(COL & ADB, 1999) and online classes (Odeyemi,
2012). Using these modes, instructors of research
methods can address students’ statistics anxiety by
imparting in undergraduates, - skills to apply basic
numerical and statistical concepts through
integration of scientific/statistical analyses and
other areas (Yan, 2012). They should teach
students in ways that will facilitate the
development of their statistical reasoning; the
reasoning which incorporates comprehension,
planning, execution, evaluation and interpretation
(Garfield, 2002). Structural and personal barriers to
mathematics (Brown, Brown & Bibby, 2008) can
be overcome by increasing learner confidence, self
efficacy and encouraging more positive attitude to
mathematics.
Simond (2008) and Thorpe (1993) point out several
challenges that ODL learners face. Some of them
according to Simond (2008) are:
failing to balance the combination of
work, family and education,
not acquiring go online distance study
habits,
having no one around to monitor
procrastination in the ‘culprit,’
failing to motivate themselves due to
isolation from tutors and peers,
difficulty in forming study groups due to
differences in how they use time,
failure to cope with distance learning
strategies like video/audio tapes material,
and internet,
inadequate preparation for examinations
due to laziness and improper time budgets,
inability to properly use the library.
These challenges may contribute to students’
statistics, mathematics or research anxiety. They
can be overcome through proper planning, time
management, avoiding procrastination and having a
positive attitude.
Thorpe (1993) separates the challenges into
learner-associated and institution-associated
factors. Those due to learners include reasons that
the courses are overloaded, too difficult, not
sufficiently advanced or that the content is
uninteresting. The institutional factors are that there
is not enough tuition counselling available, no
adequate facilities, schedules are disorganised and
individual tutors are problematic. She suggests that
the ODL institutions should provide proper learner
support systems and that the learners need effective
counselling and tutoring services.
While students generally view statistics as the
worst course taken in college or university (Hogg,
1991 cited in Wiberg, 2009) and some ‘would
rather die than continue their study of mathematics’
(Brown, Brown & Bibby, 2008, p. 10), statistics
and mathematics cannot be avoided because of
their importance and use in our daily lives (O’kwu
& Anyagh, 2010; Garfiled, 2002). Research
Methods undergraduate students also think that
research is about punching numbers and sitting
through advanced derivations (Yan, 2012).
Therefore they express overwhelming anxiety
about learning research (Einbinder, 2012), hence
there is need to make students more interested in
statistics and mathematics and to help them see the
importance of using statistics (Schacht, 1990) or
using research in social work (Einbinder, 2012).
To overcome mathematics/statistics/research
anxiety in college or university students and
especially in ODL institutions such as ZOU,
learners need support in one or several forms.
Learner support is defined or can be viewed as
meeting the needs of learners by providing learning
Sept. 2013. Vol. 3, No.1 ISSN 2307-227X International Journal of Research In Social Sciences © 2013 IJRSS & K.A.J. All rights reserved www.ijsk.org/ijrss
79
experiences in terms of guidance, planning and
feedback that are necessary for continued student
motivation and completion of the course (Sampson,
2003). COL & ADB (1999) give two kinds of
support that distance educators need to offer to the
learners. These are intellectual support or tuition,
organisational support and emotional support or
counselling. These kinds of support can be
provided through face to face tutorials, by
telephone, by email and computer conference, by
fax and post, by audio cassette and/or by video
conference.
Support personnel include full time academic staff,
part time tutors, counsellors and advisors,
administrative staff, library staff, friends, family
members, staff of collaborating institutions and
other learners or peers (COL & ADB, 1999). The
support structures need to be in place and well
managed and tuition givers and counselling
personnel need to be well versed with their tasks.
They should have qualities of warmth,
genuineness, acceptance, empathy, organisational
skills, explicating skills and listening skills.
ODL learners need institutional identity which
makes them feel that they are part of a body of
learners of a recognised and accredited institution,
hence the need for quality assurance in ODL (COL
& ADB, 1999). Quality is a characteristic of
products and services an organisation offers.
Quality assurance is a process directed towards
achieving that characteristic while quality control
implies an inspection or removing faulty products
that fail to conform to a predetermined standard
(COL & ADB, 1999). Quality control, quality
assurance and the assessment of quality systems
(monitoring, evaluation and auditing of procedures)
all lead to total quality management which is
necessary for institutions or organisations to
produce desired results, continue functioning or
even to improve. The institution should have a
quality policy manual that spells out its aims, goals,
objectives, vision, mission, core values and
strategic plan. The procedure manuals with clear-
cut job descriptions, roles, rules, regulations and
procedures should be available and accessible to
staff members and well understood.
Barasa (2012) points out that African ODL
institutions widen access to education but do not
assure success because of some dilemmas, one
being lack of proper ODL policies. In Zimbabwe
an ODL policy was launched in August 2012 by
the Ministry of Higher and Tertiary Education with
one of its aims being the training of Mathematics
and Science teachers through ODL (Bwititi, 2012).
This seems a good idea but it would be interesting
to monitor how the system will work. In Australia,
McGillivray (2008) believes that, due to the
importance and usefulness of mathematics and
statistics in life and across university faculty
disciplines and due to the fact that many students
have weaknesses in mathematics and statistics, it is
time for learning support in these subjects to be
part of universities’ core business.
In view of the above observations, one would ask
whether ODL institutions such as ZOU have in
place effective quality management systems and
ODL policies. Are the institutions providing the
various forms of learner support that students need,
especially in critical areas such as mathematics,
statistics and research methods? When this research
was being conducted ZOU had such a quality
policy manual in place (Revision 0), but whether
staff members understood it or whether they were
implementing the procedures effectively is not
clear. This researcher has been self-motivated to
carry out a study on these and other related
questions.
PURPOSE OF THE STUDY
The purpose of the study was to find out if ZOU
students had challenges in Mathematics, Statistics
and Research Methods through ODL and, if so,
how big and what was the nature and form of the
challenges? The study also investigated the kinds
of learning support that the students needed and the
contents of ODL policies and quality management
systems for African universities.
MATERIALS AND METHODS
Research Design
This study used the quantitative descriptive survey
design to investigate whether ODL learners of
Mathematics, Statistics and Research Methods at
ZOU faced any challenges, how ‘serious’ the
challenges were and how they were related.
Descriptive surveys are cost-effective and ‘things are
measured as they are’ (Hopkins, 2000). However,
descriptive surveys are not very informative research
designs because they do not always uncover
straightforward answers to problems where there is
an underlying factor or cause (REACT 2000 in
Russell, 2007) and they do not allow researcher
intervention in an effort to control the independent
variable (Davis 2005 in Russell, 2007). To overcome
this shortfall, respondents were asked to freely give,
in the open-ended sections of the questionnaire, their
opinions, worries, suggestions and recommendations
about the causes of the challenges and the learning
support they required. Furthermore, an informal
focus group interview was carried out with a few
Sept. 2013. Vol. 3, No.1 ISSN 2307-227X International Journal of Research In Social Sciences © 2013 IJRSS & K.A.J. All rights reserved www.ijsk.org/ijrss
80
students in order to check on the authenticity of the
questionnaire data.
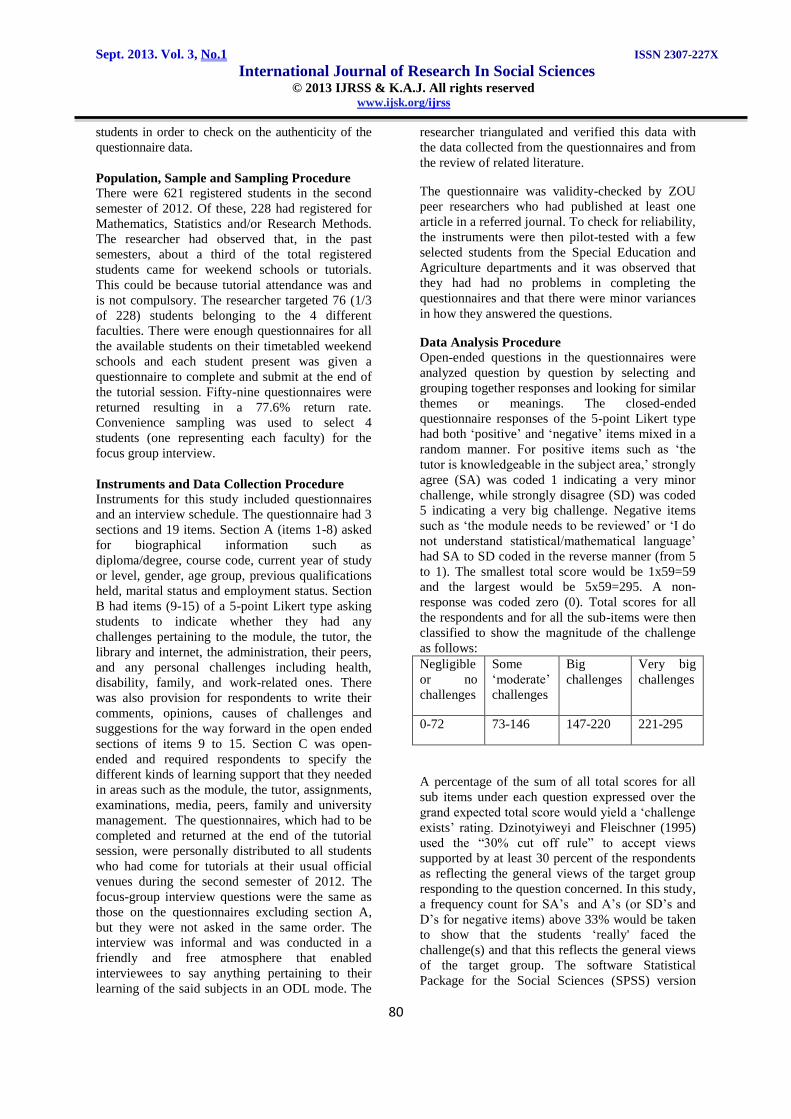
Population, Sample and Sampling Procedure
There were 621 registered students in the second
semester of 2012. Of these, 228 had registered for
Mathematics, Statistics and/or Research Methods.
The researcher had observed that, in the past
semesters, about a third of the total registered
students came for weekend schools or tutorials.
This could be because tutorial attendance was and
is not compulsory. The researcher targeted 76 (1/3
of 228) students belonging to the 4 different
faculties. There were enough questionnaires for all
the available students on their timetabled weekend
schools and each student present was given a
questionnaire to complete and submit at the end of
the tutorial session. Fifty-nine questionnaires were
returned resulting in a 77.6% return rate.
Convenience sampling was used to select 4
students (one representing each faculty) for the
focus group interview.
Instruments and Data Collection Procedure
Instruments for this study included questionnaires
and an interview schedule. The questionnaire had 3
sections and 19 items. Section A (items 1-8) asked
for biographical information such as
diploma/degree, course code, current year of study
or level, gender, age group, previous qualifications
held, marital status and employment status. Section
B had items (9-15) of a 5-point Likert type asking
students to indicate whether they had any
challenges pertaining to the module, the tutor, the
library and internet, the administration, their peers,
and any personal challenges including health,
disability, family, and work-related ones. There
was also provision for respondents to write their
comments, opinions, causes of challenges and
suggestions for the way forward in the open ended
sections of items 9 to 15. Section C was open-
ended and required respondents to specify the
different kinds of learning support that they needed
in areas such as the module, the tutor, assignments,
examinations, media, peers, family and university
management. The questionnaires, which had to be
completed and returned at the end of the tutorial
session, were personally distributed to all students
who had come for tutorials at their usual official
venues during the second semester of 2012. The
focus-group interview questions were the same as
those on the questionnaires excluding section A,
but they were not asked in the same order. The
interview was informal and was conducted in a
friendly and free atmosphere that enabled
interviewees to say anything pertaining to their
learning of the said subjects in an ODL mode. The
researcher triangulated and verified this data with
the data collected from the questionnaires and from
the review of related literature.
The questionnaire was validity-checked by ZOU
peer researchers who had published at least one
article in a referred journal. To check for reliability,
the instruments were then pilot-tested with a few
selected students from the Special Education and
Agriculture departments and it was observed that
they had had no problems in completing the
questionnaires and that there were minor variances
in how they answered the questions.
Data Analysis Procedure
Open-ended questions in the questionnaires were
analyzed question by question by selecting and
grouping together responses and looking for similar
themes or meanings. The closed-ended
questionnaire responses of the 5-point Likert type
had both ‘positive’ and ‘negative’ items mixed in a
random manner. For positive items such as ‘the
tutor is knowledgeable in the subject area,’ strongly
agree (SA) was coded 1 indicating a very minor
challenge, while strongly disagree (SD) was coded
5 indicating a very big challenge. Negative items
such as ‘the module needs to be reviewed’ or ‘I do
not understand statistical/mathematical language’
had SA to SD coded in the reverse manner (from 5
to 1). The smallest total score would be 1x59=59
and the largest would be 5x59=295. A non-
response was coded zero (0). Total scores for all
the respondents and for all the sub-items were then
classified to show the magnitude of the challenge
as follows:
Negligible
or no
challenges
Some
‘moderate’
challenges
Big
challenges
Very big
challenges
0-72 73-146 147-220 221-295
A percentage of the sum of all total scores for all
sub items under each question expressed over the
grand expected total score would yield a ‘challenge
exists’ rating. Dzinotyiweyi and Fleischner (1995)
used the “30% cut off rule” to accept views
supported by at least 30 percent of the respondents
as reflecting the general views of the target group
responding to the question concerned. In this study,
a frequency count for SA’s and A’s (or SD’s and
D’s for negative items) above 33% would be taken
to show that the students ‘really' faced the
challenge(s) and that this reflects the general views
of the target group. The software Statistical
Package for the Social Sciences (SPSS) version
Sept. 2013. Vol. 3, No.1 ISSN 2307-227X International Journal of Research In Social Sciences © 2013 IJRSS & K.A.J. All rights reserved www.ijsk.org/ijrss
81
11.5 was used to do all the computations, cross-
tables, correlations, regression analyses and
statistical tests.
According to Stewart (2006) there is no one best or
correct approach to the analysis of focus group
data. The nature of the analysis should be
determined by the research question(s) and the
purpose for which data are collected. In this study
the focus group interview data were qualitatively
analysed by looking for main ideas or concepts and
using key-words-in context analysis
(Onwuegbuzie, 2009). The procedures followed
were transcribing the data, conceptualising and
categorizing it, examining relationships and
comparing them with those mentioned in the
questionnaires and in literature review for the
purpose of triangulation or checking on the validity
and reliability of the given information.
RESULTS AND DISCUSSION
Biographical Data
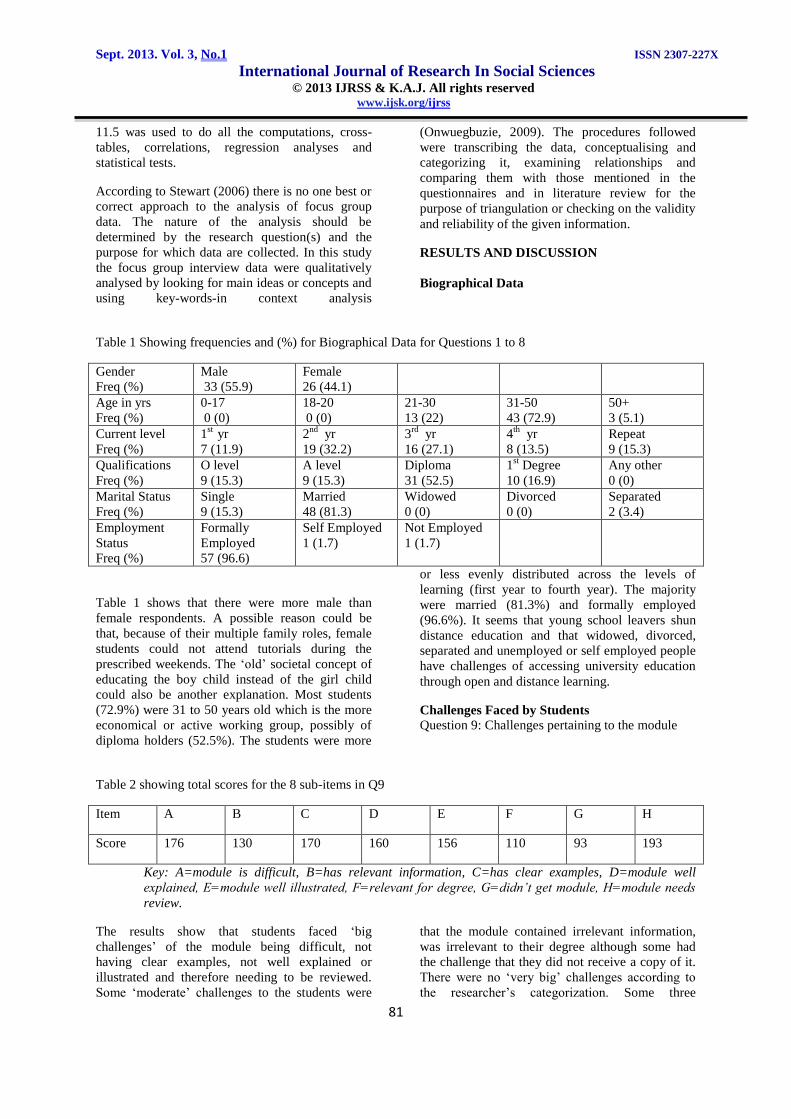
Table 1 Showing frequencies and (%) for Biographical Data for Questions 1 to 8
Gender
Freq (%)
Male
33 (55.9)
Female
26 (44.1)
Age in yrs
Freq (%)
0-17
0 (0)
18-20
0 (0)
21-30
13 (22)
31-50
43 (72.9)
50+
3 (5.1)
Current level
Freq (%)
1st
yr
7 (11.9)
2nd
yr
19 (32.2)
3rd
yr
16 (27.1)
4th
yr
8 (13.5)
Repeat
9 (15.3)
Qualifications
Freq (%)
O level
9 (15.3)
A level
9 (15.3)
Diploma
31 (52.5)
1st Degree
10 (16.9)
Any other
0 (0)
Marital Status
Freq (%)
Single
9 (15.3)
Married
48 (81.3)
Widowed
0 (0)
Divorced
0 (0)
Separated
2 (3.4)
Employment
Status
Freq (%)
Formally
Employed
57 (96.6)
Self Employed
1 (1.7)
Not Employed
1 (1.7)
Table 1 shows that there were more male than
female respondents. A possible reason could be
that, because of their multiple family roles, female
students could not attend tutorials during the
prescribed weekends. The ‘old’ societal concept of
educating the boy child instead of the girl child
could also be another explanation. Most students
(72.9%) were 31 to 50 years old which is the more
economical or active working group, possibly of
diploma holders (52.5%). The students were more
or less evenly distributed across the levels of
learning (first year to fourth year). The majority
were married (81.3%) and formally employed
(96.6%). It seems that young school leavers shun
distance education and that widowed, divorced,
separated and unemployed or self employed people
have challenges of accessing university education
through open and distance learning.
Challenges Faced by Students
Question 9: Challenges pertaining to the module
Table 2 showing total scores for the 8 sub-items in Q9
Item A B C D E F G H
Score 176 130 170 160 156 110 93 193
Key: A=module is difficult, B=has relevant information, C=has clear examples, D=module well
explained, E=module well illustrated, F=relevant for degree, G=didn’t get module, H=module needs
review.
The results show that students faced ‘big
challenges’ of the module being difficult, not
having clear examples, not well explained or
illustrated and therefore needing to be reviewed.
Some ‘moderate’ challenges to the students were
that the module contained irrelevant information,
was irrelevant to their degree although some had
the challenge that they did not receive a copy of it.
There were no ‘very big’ challenges according to
the researcher’s categorization. Some three
Sept. 2013. Vol. 3, No.1 ISSN 2307-227X International Journal of Research In Social Sciences © 2013 IJRSS & K.A.J. All rights reserved www.ijsk.org/ijrss
82
respondents, however, commented that the module
was too shallow and not related to their field of
study. Combining all eight items, a computation of
total scores gave a ‘challenge exists’ rating of
50.3%. However by considering only SA or A
ticks, 31.1% of the respondents agreed to having
challenges relating to the Maths, Statistics or
Research Methods module. It can thus be
concluded that challenges pertaining to the module
were less pertinent than expected. Thus ZOU
modules can generally be considered to be good. In
agreement, Sampson (2003), in a different study
though, found that 91% of the MEd students at a
British university were satisfied with their course
modules. Module writers need to be aware that
courses materials which are difficult or overloaded
or uninteresting provide a challenge which can lead
to student drop out (Thorpe, 1993).
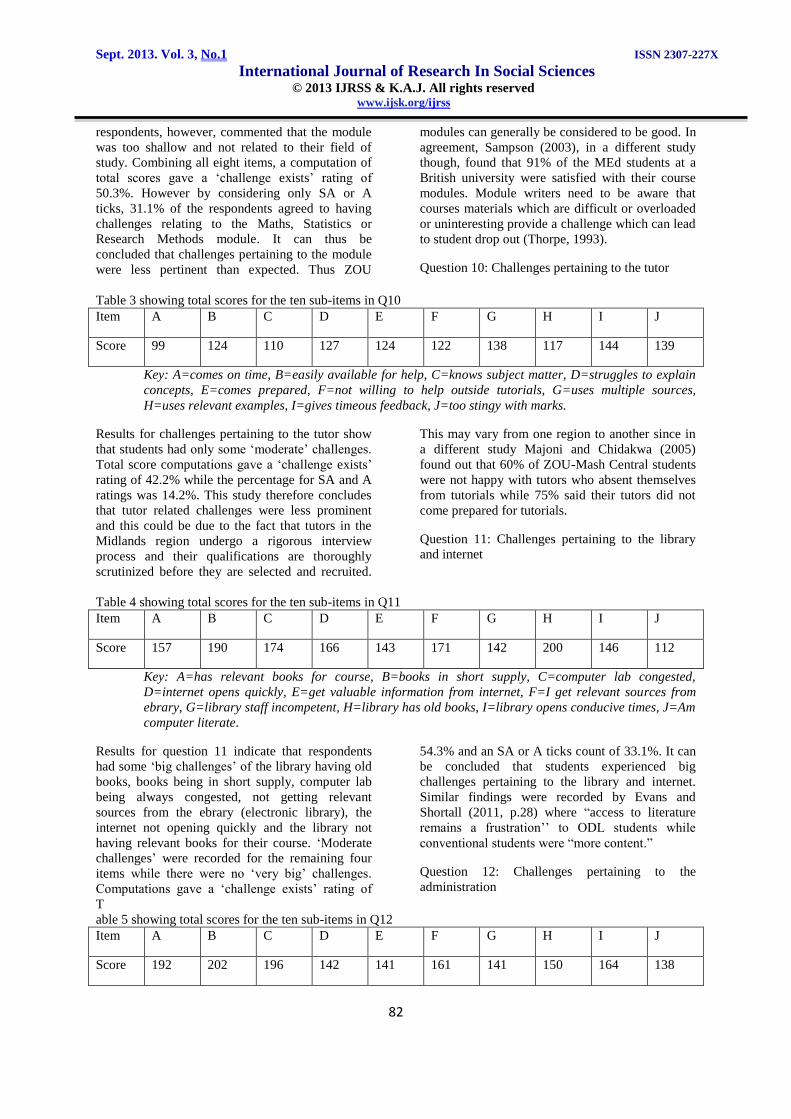
Question 10: Challenges pertaining to the tutor
Table 3 showing total scores for the ten sub-items in Q10
Item A B C D E F G H I J
Score 99 124 110 127 124 122 138 117 144 139
Key: A=comes on time, B=easily available for help, C=knows subject matter, D=struggles to explain
concepts, E=comes prepared, F=not willing to help outside tutorials, G=uses multiple sources,
H=uses relevant examples, I=gives timeous feedback, J=too stingy with marks.
Results for challenges pertaining to the tutor show
that students had only some ‘moderate’ challenges.
Total score computations gave a ‘challenge exists’
rating of 42.2% while the percentage for SA and A
ratings was 14.2%. This study therefore concludes
that tutor related challenges were less prominent
and this could be due to the fact that tutors in the
Midlands region undergo a rigorous interview
process and their qualifications are thoroughly
scrutinized before they are selected and recruited.
This may vary from one region to another since in
a different study Majoni and Chidakwa (2005)
found out that 60% of ZOU-Mash Central students
were not happy with tutors who absent themselves
from tutorials while 75% said their tutors did not
come prepared for tutorials.
Question 11: Challenges pertaining to the library
and internet
Table 4 showing total scores for the ten sub-items in Q11
Item A B C D E F G H I J
Score 157 190 174 166 143 171 142 200 146 112
Key: A=has relevant books for course, B=books in short supply, C=computer lab congested,
D=internet opens quickly, E=get valuable information from internet, F=I get relevant sources from
ebrary, G=library staff incompetent, H=library has old books, I=library opens conducive times, J=Am
computer literate.
Results for question 11 indicate that respondents
had some ‘big challenges’ of the library having old
books, books being in short supply, computer lab
being always congested, not getting relevant
sources from the ebrary (electronic library), the
internet not opening quickly and the library not
having relevant books for their course. ‘Moderate
challenges’ were recorded for the remaining four
items while there were no ‘very big’ challenges.
Computations gave a ‘challenge exists’ rating of
54.3% and an SA or A ticks count of 33.1%. It can
be concluded that students experienced big
challenges pertaining to the library and internet.
Similar findings were recorded by Evans and
Shortall (2011, p.28) where “access to literature
remains a frustration’’ to ODL students while
conventional students were “more content.”
Question 12: Challenges pertaining to the
administration
T
able 5 showing total scores for the ten sub-items in Q12
Item A B C D E F G H I J
Score 192 202 196 142 141 161 141 150 164 138
Sept. 2013. Vol. 3, No.1 ISSN 2307-227X International Journal of Research In Social Sciences © 2013 IJRSS & K.A.J. All rights reserved www.ijsk.org/ijrss
78
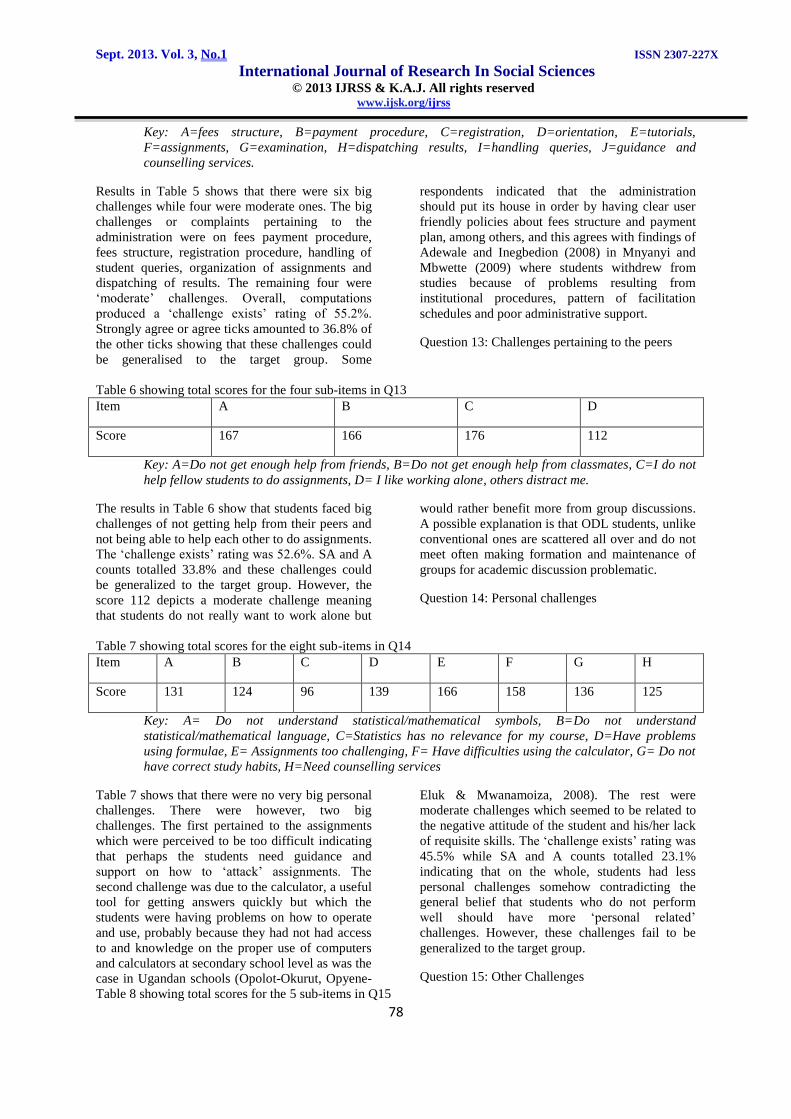
Key: A=fees structure, B=payment procedure, C=registration, D=orientation, E=tutorials,
F=assignments, G=examination, H=dispatching results, I=handling queries, J=guidance and
counselling services.
Results in Table 5 shows that there were six big
challenges while four were moderate ones. The big
challenges or complaints pertaining to the
administration were on fees payment procedure,
fees structure, registration procedure, handling of
student queries, organization of assignments and
dispatching of results. The remaining four were
‘moderate’ challenges. Overall, computations
produced a ‘challenge exists’ rating of 55.2%.
Strongly agree or agree ticks amounted to 36.8% of
the other ticks showing that these challenges could
be generalised to the target group. Some
respondents indicated that the administration
should put its house in order by having clear user
friendly policies about fees structure and payment
plan, among others, and this agrees with findings of
Adewale and Inegbedion (2008) in Mnyanyi and
Mbwette (2009) where students withdrew from
studies because of problems resulting from
institutional procedures, pattern of facilitation
schedules and poor administrative support.
Question 13: Challenges pertaining to the peers
Table 6 showing total scores for the four sub-items in Q13
Item A B C D
Score 167 166 176 112
Key: A=Do not get enough help from friends, B=Do not get enough help from classmates, C=I do not
help fellow students to do assignments, D= I like working alone, others distract me.
The results in Table 6 show that students faced big
challenges of not getting help from their peers and
not being able to help each other to do assignments.
The ‘challenge exists’ rating was 52.6%. SA and A
counts totalled 33.8% and these challenges could
be generalized to the target group. However, the
score 112 depicts a moderate challenge meaning
that students do not really want to work alone but
would rather benefit more from group discussions.
A possible explanation is that ODL students, unlike
conventional ones are scattered all over and do not
meet often making formation and maintenance of
groups for academic discussion problematic.
Question 14: Personal challenges
Table 7 showing total scores for the eight sub-items in Q14
Item A B C D E F G H
Score 131 124 96 139 166 158 136 125
Key: A= Do not understand statistical/mathematical symbols, B=Do not understand
statistical/mathematical language, C=Statistics has no relevance for my course, D=Have problems
using formulae, E= Assignments too challenging, F= Have difficulties using the calculator, G= Do not
have correct study habits, H=Need counselling services
Table 7 shows that there were no very big personal
challenges. There were however, two big
challenges. The first pertained to the assignments
which were perceived to be too difficult indicating
that perhaps the students need guidance and
support on how to ‘attack’ assignments. The
second challenge was due to the calculator, a useful
tool for getting answers quickly but which the
students were having problems on how to operate
and use, probably because they had not had access
to and knowledge on the proper use of computers
and calculators at secondary school level as was the
case in Ugandan schools (Opolot-Okurut, Opyene-
Eluk & Mwanamoiza, 2008). The rest were
moderate challenges which seemed to be related to
the negative attitude of the student and his/her lack
of requisite skills. The ‘challenge exists’ rating was
45.5% while SA and A counts totalled 23.1%
indicating that on the whole, students had less
personal challenges somehow contradicting the
general belief that students who do not perform
well should have more ‘personal related’
challenges. However, these challenges fail to be
generalized to the target group.
Question 15: Other Challenges
Table 8 showing total scores for the 5 sub-items in Q15
Sept. 2013. Vol. 3, No.1 ISSN 2307-227X International Journal of Research In Social Sciences © 2013 IJRSS & K.A.J. All rights reserved www.ijsk.org/ijrss
84
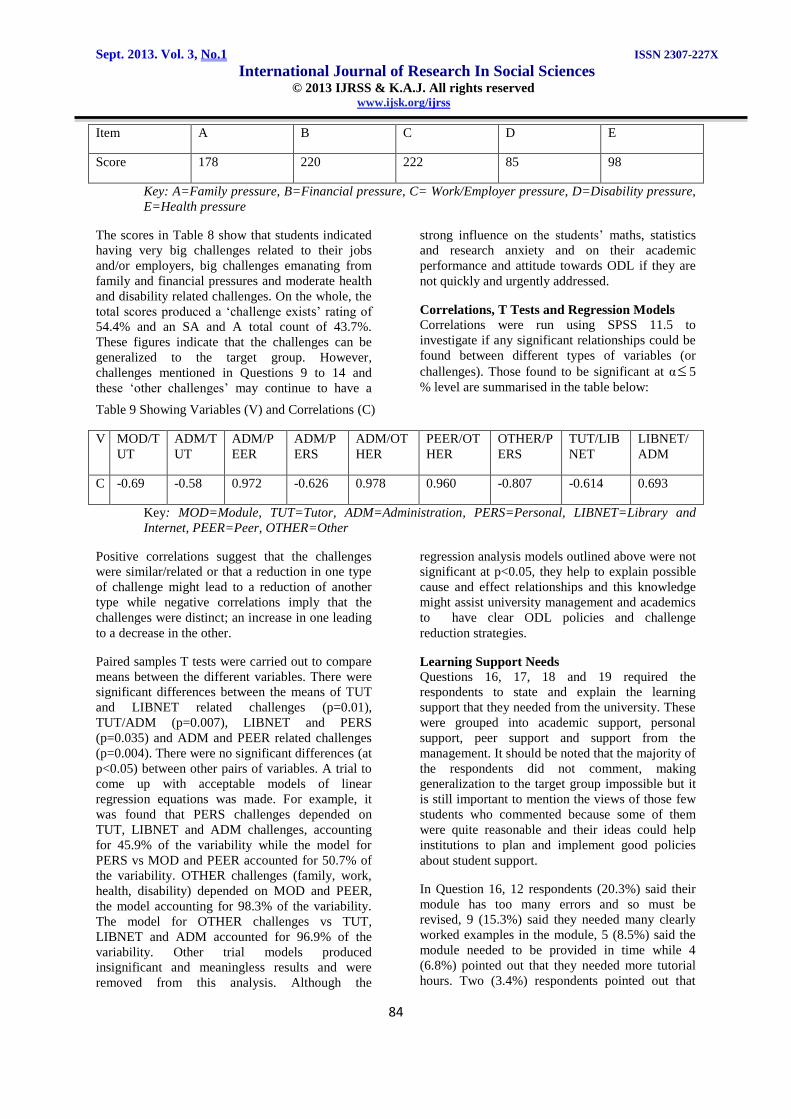
Item A B C D E
Score 178 220 222 85 98
Key: A=Family pressure, B=Financial pressure, C= Work/Employer pressure, D=Disability pressure,
E=Health pressure
The scores in Table 8 show that students indicated
having very big challenges related to their jobs
and/or employers, big challenges emanating from
family and financial pressures and moderate health
and disability related challenges. On the whole, the
total scores produced a ‘challenge exists’ rating of
54.4% and an SA and A total count of 43.7%.
These figures indicate that the challenges can be
generalized to the target group. However,
challenges mentioned in Questions 9 to 14 and
these ‘other challenges’ may continue to have a
strong influence on the students’ maths, statistics
and research anxiety and on their academic
performance and attitude towards ODL if they are
not quickly and urgently addressed.
Correlations, T Tests and Regression Models
Correlations were run using SPSS 11.5 to
investigate if any significant relationships could be
found between different types of variables (or
challenges). Those found to be significant at α 5
% level are summarised in the table below:
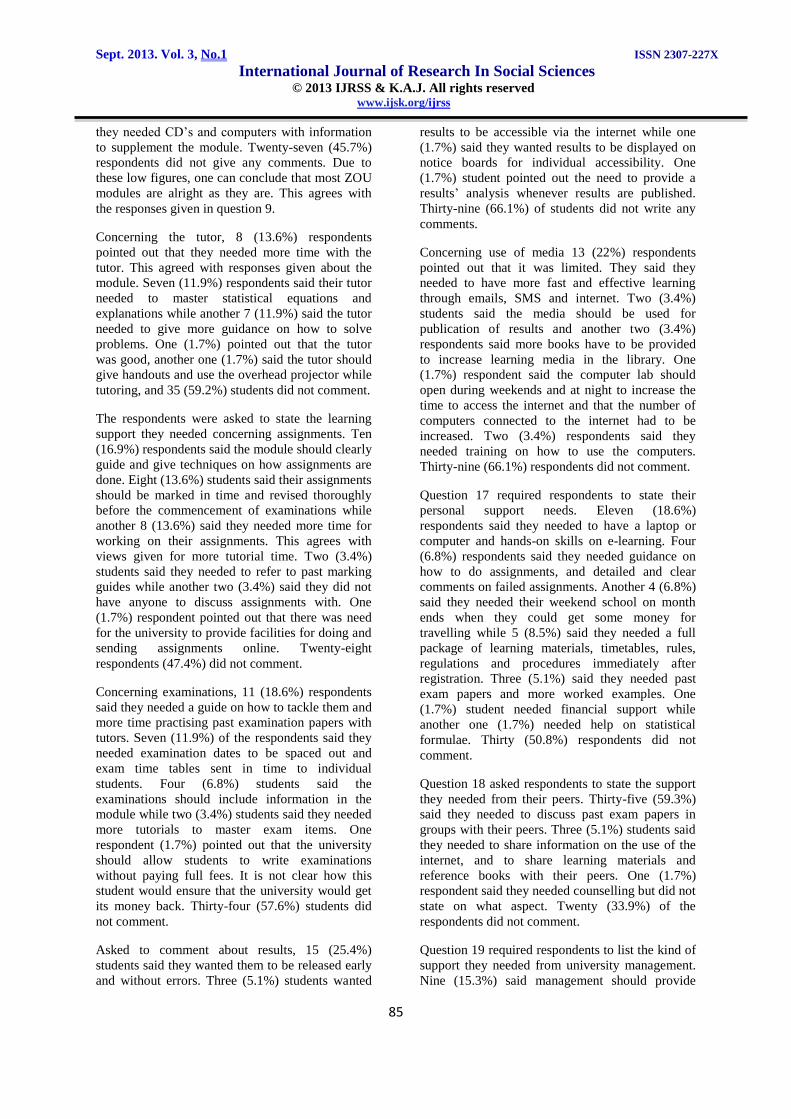
Table 9 Showing Variables (V) and Correlations (C)
V MOD/T
UT
ADM/T
UT
ADM/P
EER
ADM/P
ERS
ADM/OT
HER
PEER/OT
HER
OTHER/P
ERS
TUT/LIB
NET
LIBNET/
ADM
C -0.69 -0.58 0.972 -0.626 0.978 0.960 -0.807 -0.614 0.693
Key: MOD=Module, TUT=Tutor, ADM=Administration, PERS=Personal, LIBNET=Library and
Internet, PEER=Peer, OTHER=Other
Positive correlations suggest that the challenges
were similar/related or that a reduction in one type
of challenge might lead to a reduction of another
type while negative correlations imply that the
challenges were distinct; an increase in one leading
to a decrease in the other.
Paired samples T tests were carried out to compare
means between the different variables. There were
significant differences between the means of TUT
and LIBNET related challenges (p=0.01),
TUT/ADM (p=0.007), LIBNET and PERS
(p=0.035) and ADM and PEER related challenges
(p=0.004). There were no significant differences (at
p<0.05) between other pairs of variables. A trial to
come up with acceptable models of linear
regression equations was made. For example, it
was found that PERS challenges depended on
TUT, LIBNET and ADM challenges, accounting
for 45.9% of the variability while the model for
PERS vs MOD and PEER accounted for 50.7% of
the variability. OTHER challenges (family, work,
health, disability) depended on MOD and PEER,
the model accounting for 98.3% of the variability.
The model for OTHER challenges vs TUT,
LIBNET and ADM accounted for 96.9% of the
variability. Other trial models produced
insignificant and meaningless results and were
removed from this analysis. Although the
regression analysis models outlined above were not
significant at p<0.05, they help to explain possible
cause and effect relationships and this knowledge
might assist university management and academics
to have clear ODL policies and challenge
reduction strategies.
Learning Support Needs
Questions 16, 17, 18 and 19 required the
respondents to state and explain the learning
support that they needed from the university. These
were grouped into academic support, personal
support, peer support and support from the
management. It should be noted that the majority of
the respondents did not comment, making
generalization to the target group impossible but it
is still important to mention the views of those few
students who commented because some of them
were quite reasonable and their ideas could help
institutions to plan and implement good policies
about student support.
In Question 16, 12 respondents (20.3%) said their
module has too many errors and so must be
revised, 9 (15.3%) said they needed many clearly
worked examples in the module, 5 (8.5%) said the
module needed to be provided in time while 4
(6.8%) pointed out that they needed more tutorial
hours. Two (3.4%) respondents pointed out that
Sept. 2013. Vol. 3, No.1 ISSN 2307-227X International Journal of Research In Social Sciences © 2013 IJRSS & K.A.J. All rights reserved www.ijsk.org/ijrss
85
they needed CD’s and computers with information
to supplement the module. Twenty-seven (45.7%)
respondents did not give any comments. Due to
these low figures, one can conclude that most ZOU
modules are alright as they are. This agrees with
the responses given in question 9.
Concerning the tutor, 8 (13.6%) respondents
pointed out that they needed more time with the
tutor. This agreed with responses given about the
module. Seven (11.9%) respondents said their tutor
needed to master statistical equations and
explanations while another 7 (11.9%) said the tutor
needed to give more guidance on how to solve
problems. One (1.7%) pointed out that the tutor
was good, another one (1.7%) said the tutor should
give handouts and use the overhead projector while
tutoring, and 35 (59.2%) students did not comment.
The respondents were asked to state the learning
support they needed concerning assignments. Ten
(16.9%) respondents said the module should clearly
guide and give techniques on how assignments are
done. Eight (13.6%) students said their assignments
should be marked in time and revised thoroughly
before the commencement of examinations while
another 8 (13.6%) said they needed more time for
working on their assignments. This agrees with
views given for more tutorial time. Two (3.4%)
students said they needed to refer to past marking
guides while another two (3.4%) said they did not
have anyone to discuss assignments with. One
(1.7%) respondent pointed out that there was need
for the university to provide facilities for doing and
sending assignments online. Twenty-eight
respondents (47.4%) did not comment.
Concerning examinations, 11 (18.6%) respondents
said they needed a guide on how to tackle them and
more time practising past examination papers with
tutors. Seven (11.9%) of the respondents said they
needed examination dates to be spaced out and
exam time tables sent in time to individual
students. Four (6.8%) students said the
examinations should include information in the
module while two (3.4%) students said they needed
more tutorials to master exam items. One
respondent (1.7%) pointed out that the university
should allow students to write examinations
without paying full fees. It is not clear how this
student would ensure that the university would get
its money back. Thirty-four (57.6%) students did
not comment.
Asked to comment about results, 15 (25.4%)
students said they wanted them to be released early
and without errors. Three (5.1%) students wanted
results to be accessible via the internet while one
(1.7%) said they wanted results to be displayed on
notice boards for individual accessibility. One
(1.7%) student pointed out the need to provide a
results’ analysis whenever results are published.
Thirty-nine (66.1%) of students did not write any
comments.
Concerning use of media 13 (22%) respondents
pointed out that it was limited. They said they
needed to have more fast and effective learning
through emails, SMS and internet. Two (3.4%)
students said the media should be used for
publication of results and another two (3.4%)
respondents said more books have to be provided
to increase learning media in the library. One
(1.7%) respondent said the computer lab should
open during weekends and at night to increase the
time to access the internet and that the number of
computers connected to the internet had to be
increased. Two (3.4%) respondents said they
needed training on how to use the computers.
Thirty-nine (66.1%) respondents did not comment.
Question 17 required respondents to state their
personal support needs. Eleven (18.6%)
respondents said they needed to have a laptop or
computer and hands-on skills on e-learning. Four
(6.8%) respondents said they needed guidance on
how to do assignments, and detailed and clear
comments on failed assignments. Another 4 (6.8%)
said they needed their weekend school on month
ends when they could get some money for
travelling while 5 (8.5%) said they needed a full
package of learning materials, timetables, rules,
regulations and procedures immediately after
registration. Three (5.1%) said they needed past
exam papers and more worked examples. One
(1.7%) student needed financial support while
another one (1.7%) needed help on statistical
formulae. Thirty (50.8%) respondents did not
comment.
Question 18 asked respondents to state the support
they needed from their peers. Thirty-five (59.3%)
said they needed to discuss past exam papers in
groups with their peers. Three (5.1%) students said
they needed to share information on the use of the
internet, and to share learning materials and
reference books with their peers. One (1.7%)
respondent said they needed counselling but did not
state on what aspect. Twenty (33.9%) of the
respondents did not comment.
Question 19 required respondents to list the kind of
support they needed from university management.
Nine (15.3%) said management should provide
Sept. 2013. Vol. 3, No.1 ISSN 2307-227X International Journal of Research In Social Sciences © 2013 IJRSS & K.A.J. All rights reserved www.ijsk.org/ijrss
86
easy access to more learning materials on time.
Eight (13.5%) respondents said management
should provide more time for students to interact
with their tutors and discuss problems encountered.
Five (8.5%) said that management should provide a
conducive learning environment in terms of a nice
geographical space, good buildings, more library
books and up to date computer facilities. Two
(3.4%) were worried about the calibre of their
tutors and needed management to recruit skilled
and competent staff and to thoroughly supervise
them. Two (3.4%) required management to put in
place new market driven programmes like a degree
in social work. One (1.7%) respondent said
management should initiate thorough reviewing of
the statistics modules. Thirty-two (54.2%)
respondents did not comment.
If the support needs mentioned in Questions 16-19
are met, students’ maths, statistics and research
anxieties may be reduced and performance in these
courses improved.
Focus Group Interview
Four students, one from each of the faculties of
Science and Technology (ST), Commerce and Law
(CL), Applied Social Science (SS), and Arts and
Education (AE) constituted the members of the
group. They were asked to state the challenges they
faced as ODL learners, how those challenges could
be overcome and any general information they
thought could help to improve the system. Some of
their responses were very similar to those echoed
by their counterparts in the questionnaires. Here
only different ones are going to be discussed. ST
said the BSc Maths and Statistics programme had
the weakness of being too theoretical, with no
project component and no computer applications. If
these were incorporated, it could be upgraded to an
honours degree programme. CL mentioned that
workbooks were not readily available upon
registration and she doubted if any had ever been
printed. She said there was nothing on the e-
learning. She wanted the Statistics and Research
Methods tutor not to assume too much background
knowledge in his students since she did
mathematics and statistics a long time ago. SS said
he sometimes experiences stomach and head ache
problems as a result of study, family, social and
work pressures. He hoped that the university
authorities would build a bigger library and bigger
computer lab and stork them with up to date and
adequate learning materials and equipment. He also
said that these should be manned by well qualified
staff. Finally, in his exact words AE said,
“The administration need to be specific on
the diploma which they offer. It is stated
invalid in media which is very disturbing.
And it should have in place an updated
university prospectus which gives clear
regulations and information about how
worth and important the programme is.”
Conclusion and Recommendations
This research sought to find out whether ZOU
students who do programmes or courses involving
Maths, Statistics and Research Methods are facing
any challenges and if so what could be the
magnitude and form of those challenges. In the
questionnaires all respondents had challenges
which they stated clearly but a few commented on
the learning support that they needed. Probably
they were not aware of what exactly the ODL
institution should provide them as learning support.
They could have been influenced by people who
have the notion that with ODL one does everything
alone and one must fend for oneself or that ODL is
a jungle in which only the fittest survive. Findings
from the questionnaires were that students faced
big challenges pertaining to the administration or
management, financial, family and work pressures,
library and internet, and their peers. Tutor, module
and ‘personal’ related challenges were less
prevalent. ‘Personal’ here means of the students’
own making or relating to themselves. Although
ZOU students experienced these difficulties,
research has shown that ODL is not an inferior
form of study and that the learners do not perform
poorer than their conventional counterparts
(Lionarakis & Papademetriou, 2003; Sampson,
2003). ODL learners’ disadvantages can be
overcome through careful planning by the course
provider and the individual student (Evans &
Shortall, 2011).
The respondents were asked to state their learner
support needs. On average, about 46.5% of them
commented. They said they needed adequate and
up to date resources and equipment related to the
library, computers and the internet. They said the
management needed to provide a clear and user-
friendly fees payment plan since most students,
although formally employed, had their own
families and were usually cash strapped. Most
modules, especially the Statistics ones had to be re-
written in simplified language and symbolism and
to be more practical (related to the world of work)
rather than being too theoretical and difficult as
most respondents said they were. This tallies with
ideas of Sampson (2003) who believes that in the
absence of the tutor and a well stocked library, the
role of learning materials like modules and readers
is very important and they should be carefully
prepared.
Sept. 2013. Vol. 3, No.1 ISSN 2307-227X International Journal of Research In Social Sciences © 2013 IJRSS & K.A.J. All rights reserved www.ijsk.org/ijrss
87
The focus group interview produced similar results
to those from the questionnaires. However, a
student from the faculty of Arts and Education
(AE) wanted the university to respond to negative
public media coverage about its programmes and to
make it clear, maybe in its prospectus, “how worth
and important the programme is.” These ideas
could help the university to market its programmes,
design new ones and increase enrolment.
Basing on these research findings and on the
review of related literature, the following
recommendations are made:
1. ZOU (Midlands) should convince ZOU
(National Centre) to have a clear ODL
policy that guides all ZOU operations
taking into cognisance aspects of access,
quality and success. The policy should
have such key aspects as a clear and
student friendly fees payment plan, and
the nature and worth of programmes
offered.
2. ICT’s, internet and library services should
be married strongly with the ODL delivery
mode since they have become a necessity
in this technological age. Equipment,
buildings and learning materials for these
areas are inadequate in ZOU (Midlands)
and should be sourced and improved.
3. Tutors should be staff developed on how
to prepare e-learning materials and how to
conduct e-tutoring.
4. ZOU should increase the number of face
to face contact hours for tutorials from the
current 6 to at least 10 per semester.
5. ZOU should have a Research Methods and
Statistics Centre in each of its
geographical regions and an “Online
Centre” for the Virtual Region. These
centres should be serviced by well
qualified and dedicated staff members
(maybe starting with two) who should be
able to assist any student or staff member
doing research or needing help on any
aspect of statistics. The centre should be
equipped with computers connected to the
internet and installed with various
statistical software for quantitative or
qualitative data. It should also have some
books on research methods. This centre
could ultimately end up being a
consultancy centre for any one, thus
generating money for ZOU.
6. Since this research was conducted only at
the ZOU Midlands regional centre, there
is need for further research in other
regions and maybe using different
instruments and target groups.
References
1. Barasa, F.S. (2012). Promoting Open and
Distance Learning in Africa: A Critical
Reflection on Rhetoric, Real and
Ideal. ACDE.
2. Brown, M., Brown, P., & Bibby, T. (2008). “I
would rather die”: Reasons given by 16-year
olds for not continuing their study of
mathematics, Research in Mathematics
Education, 10(1), 3-18
3. Bwititi, K. (2012). ODL to change face of
education. The Sunday Mail, Friday 7
September 2012.
4. Commonwealth of Learning & Asian
Development Bank (1999). Learner Support in
Open and Distance Learning, Trainers’
Toolkit 006. Vancouver, BC. Commonwealth
of Learning.
5. Dzinotyiweyi, H.A.M., & Fleischner, H.
(1995). Mathematics Curriculum Development
For Higher Secondary Education and
Universities in the Southern African
Development Community (SADC) pp. 1 - 89
[Unpublished Report].
6. Einbinder, S.D. (2012). Reducing research
anxiety among MSW students. [Accepted for
publication in Journal Of Teaching
in Social Work, March 2012]
7. Evans, D. & Shortall, T. (2011). Students’
views on the advantages and disadvantages of
a. Open Distance Learning versus
traditional On-Campus Learning in a
Master’s degree course for language
teachers in a British university.
Journal of Nursing Studies NCNJ.
10(1), 23-30.
8. Garfield, J. (2002). The Challenges of
Developing Statistical Reasoning. Journal Of
Statistics Education. 10(3). Retrieved on
07/11/2012 from
www.armstat.org/publications/jse/v1
0n3/garfield.html
9. Hopkins, W.G. (2000). Quantitative Research
Design. Sportscience 4(1).
10. Lionarakis, A. & Papademetriou, D. (2003).
The quality of learning experience: A
comparative study between open
distance and conventional education. Turkish
Online Journal of Distance Education-
Sept. 2013. Vol. 3, No.1 ISSN 2307-227X International Journal of Research In Social Sciences © 2013 IJRSS & K.A.J. All rights reserved www.ijsk.org/ijrss
88
TOJDE. 4(2). Retrieved on 7/12/12 from
www.tojde.anadolu.edu.tr/tojde10/art
icles/lionarakis.htm
11. Majoni, C. & Chidakwa, C. (2005). Students’
Views on the Role of Tutorials in Teaching
and Learning at the Zimbabwe Open
University. International Journal Of Open and
Distance Learning. (2), 7-11.
12. McGillivray, H. (2008). Learning Support in
Mathematics and Statistics in Australian
Universities: A guide for the
university sector. Strawberry Hills, NSW.
Australian Learning and Teaching
Council Ltd.
13. Mnyanyi, C.B.F. & Mbwette, T.S.A. (2009).
Open and Distance Learning in Professional
Development in Third World
Countries. Retrieved on 07/11/12 from
www.ou.nl/Docs/Campaigns/.../Pape
rs/Final_paper_296Cosmas.pdf
14. Odeyemi, O.J. (2012). Facilitation in Open and
Distance learning: A Catalyst for qualitative
Learning. International Journal Of
Social Science and Education. 2(2), 73-81.
15. O’kwu, E.I. & Anyagh, P.I. (2010). Effect of
career-related Instruction on Students’
Mathematics Achievement in Senior
Secondary Schools in Benue State, Nigeria.
Educational Research. 1(7), 206-
209.
16. Onwuegbuzie, A.J. (2004). Academic
procrastination and statistics anxiety.
Assessment and Evaluation in higher
Education. 29(1). Carfax Publishing, Taylor
and Francis Group.
17. Opolot-Okurut, C., Opyene-Eluk, P. &
Mwanamoiza, M. (2008). The current teaching
of statistics in schools in Uganda. In C.
Batanero, G. Burrill, C. Reading, & A.
Rossman (Eds.), Joint ICMI/IASE Study:
Teaching Statistics in School Mathematics.
Challenges for Teaching and Teacher
Education. Proceedings of the ICMI Study 18
and 2008 IASE Round Table
Conference.
18. Russell, M. (2007). Strengths and Weaknesses
of Research Designs. Retrieved on 11/01/13
from
http://www.voices.yahoo.com/strengths-
weaknesses-research-designs-405
19. Sampson, N. (2003). Meeting the needs of
distance learners. Language Learning and
Technology. 7(3), 103-118
20. Schacht, S. & Stewart, B.J. (1990). What’s
funny about statistics? A technique for
reducing student anxiety. Teaching Sociology.
18(1), 52-56.
21. Simond, M. (2008). Issues and challenges in
Open and Distance Learning. Retrieved on
07/11/12 from
http://www.ezinearticles.com/?Issues-and-
Challenges-in-Open-and-Distance-
Learning&id=979598
22. Stewart, (2006). Analysing Focus Group Data.
Retrieved on 15/02/13 from
http://www.sagepub.com/upm-
data/1107_Chapter_7.pdf
23. Thorpe, M. (1993). Evaluating Open and
Distance Learning (2nd Ed.). Longman. Essex,
UK.
24. Wiberg, M. (2009). Teaching Statistics in
Integration with Psychology. Journal of
Statistics Education. 17(1). Retrieved on
01/11/12 from
http://www.amstat.org/publications/j
se/v17n1/wiberg.html
25. Yan, J.C. (2012?) Overcoming Statistics
Anxiety in a Research Methods Class in
Journalism
a. and Mass Communication
Curriculum: Theories and
Techniques. HIED 546 Inquiry
b. Project. Retrieved on 29/10/12 from
http://www.personal.psu.edu/cxy170/
e-portfolio/teach%20methods.pdf
26. ZOU (2007). General Information and
Regulations. ZOU. Harare.