Chaire développement durable EDF-Ecole polytechnique |
38
1 EU Emissions Trading and the cement sector: a spatial competition analysis Jean Pierre Ponssard a and Neil Walker b1 May 2008 (forthcoming in Climate Policy) a Laboratoire d’Économétrie, École Polytechnique and CNRS, route de Saclay, 91128 Palaiseau, France b School of Geography, Planning and Environmental Policy, University College Dublin, Belfield, Dublin 4, Ireland Abstract : We describe an oligopoly competition model which illustrates the potential effect of EU Emissions Trading and transport issues on the production decisions and the profitability of cement producers in a typical Western European country market. The role of geography is introduced through three features, namely the existence of regional markets, the fact that EU producers may operate multiple plants across these regions, and the possibility of production capacity constraints. A typical EU state is divided into a coastal region which is initially exposed to international competition, and an inland region which is initially protected. Assuming pure auctioning of EU Allowances and a range of CO 2 prices up to €50/Tonne, our model predicts a large increase of imports into the coastal region. Consequences for the inland producers include reduced attractiveness of the coastal market, as well as increased competition from coastal producers and from non-EU imports. The model includes a number of simplifications and therefore does not claim to offer definitive predictions, but our results do suggest that an increase in non EU imports could feasibly offset more than 70% of the decrease in EU cement sector emissions. We consider the likely impact on producer profits in each region, and we briefly review the advantages and disadvantages of potential mitigating policy measures which relate either to the EU Allowance allocation process or to border adjustments on cement products. Keywords: EU Emissions Trading Scheme, Cement, Clinker, Competitiveness, Carbon Leakage JEL: Q5, L13 1 Corresponding author.
Transcript of Chaire développement durable EDF-Ecole polytechnique |

1
EU Emissions Trading and the cement sector: a spatial competition analysis
Jean Pierre Ponssarda and Neil Walkerb1
May 2008
(forthcoming in Climate Policy)
a Laboratoire d’Économétrie, École Polytechnique and CNRS, route de Saclay, 91128 Palaiseau, France
b School of Geography, Planning and Environmental Policy, University College Dublin, Belfield, Dublin 4, Ireland
Abstract : We describe an oligopoly competition model which illustrates the potential effect of EU Emissions Trading and transport issues on the production decisions and the profitability of cement producers in a typical Western European country market. The role of geography is introduced through three features, namely the existence of regional markets, the fact that EU producers may operate multiple plants across these regions, and the possibility of production capacity constraints. A typical EU state is divided into a coastal region which is initially exposed to international competition, and an inland region which is initially protected. Assuming pure auctioning of EU Allowances and a range of CO2 prices up to €50/Tonne, our model predicts a large increase of imports into the coastal region. Consequences for the inland producers include reduced attractiveness of the coastal market, as well as increased competition from coastal producers and from non-EU imports. The model includes a number of simplifications and therefore does not claim to offer definitive predictions, but our results do suggest that an increase in non EU imports could feasibly offset more than 70% of the decrease in EU cement sector emissions. We consider the likely impact on producer profits in each region, and we briefly review the advantages and disadvantages of potential mitigating policy measures which relate either to the EU Allowance allocation process or to border adjustments on cement products.
Keywords: EU Emissions Trading Scheme, Cement, Clinker, Competitiveness, Carbon Leakage
JEL: Q5, L13
1 Corresponding author.

2
1. Introduction
1.1 Background and Objectives
There has been much debate during the run-up to the EU Emissions Trading Scheme (EU ETS) regarding its effect on the EU economy as a whole, and in particular the competitiveness of energy-intensive industries within the Trading Sector.
In this regard, The European Commission (2004) defines industrial competitiveness as ‘the ability of an industrial sector to defend and/or gain market share in open international markets by relying on price and/or the quality of goods’. Reinaud (2005) likewise considers international industrial competitiveness effects primarily in terms of loss of manufacturing output.
Grubb and Neuhoff (2006) identify two criteria for assessing, as first step, the degree to which the competitiveness of a particular industrial sector might be affected by EU ETS. One is value at stake, which is the potential impact of EU Allowance costs expressed as a percentage of value-added before any mitigation or pass-through into prices. The other is import intensity, expressed as the percentage of market demand met from non-EU imports. Within the Trading Sector, cement stands out as being one of two industries having a relatively high value at stake2 although its import intensity may significantly differ between Member States.
European cement producers have been at the forefront of the competitiveness debate, and they continue to lobby for measures to mitigate what is evidently regarded as a threat to the long term viability of their industry. For example, the industry association (Cembureau, 2006) asserts that ‘the unilateral initiative of the EU to launch its ETS is leading to major problems of competitiveness for the EU cement industry and will not succeed in reducing global CO2 emissions’. Although some earlier industry lobbying had cited Russia as a competitive threat, more recently the emphasis has been on China. A number of European cement producers apparently espouse the view that the absolute cap on emissions inherent in the EU ETS should be abandoned in favour of a benchmarking approach based on industry-specific negotiated agreements.
Major European cement producers are equally concerned about what emissions trading regime might follow the 2008-12 Trading Period. For example, it is reported that the French-owned firm Lafarge has recently frozen capital projects totaling €1 Billion pending greater clarity on the EU’s longer term climate policy framework3.
We aim to contribute to the ongoing policy debate by providing empirical and theoretical insights into the likely effect of EU ETS on cement sector competitiveness.
2 The other industry is electricity generation. The aluminium industry, although not included in the Trading Sector, has high value indirectly at stake by virtue of its intensive consumption of electricity. 3 http://www.nce.co.uk/news/2008/02/emissions_row_forces_lafarge_to_suspend_investment.html

3
More specifically, our model assesses its potential impact on the short-run production decisions, and the longer term investment decisions, of cement producers competing in the markets of Western European (EU15) countries. It builds on a generic oligopoly competition framework which has previously been discussed in this journal (Smale et al, 2006) in the context of several energy-intensive industries in the UK. We add to the literature by allowing for the competitive effect of marine transportation costs and road freight costs, the fact that EU firms typically operate multiple plants across each country market, and through the modelling of production capacity constraints. We consider the effect of CO2 costs on domestic market share and profitability to be a relevant metric for competitiveness, and the carbon leakage rate to be an appropriate measure of environmental effectiveness. In this regard, we calculate the leakage rate as the ratio between increases in cement sector emissions in non-EU countries as a consequence of the CO2 cost and decreases in cement sector emissions within the EU ETS as a consequence of the CO2 cost. This definition excludes any incremental emissions in the Non-Trading sector arising from marine freight bunker fuel.
1.2 Overview of the model
The Cement Trade and Competition (CTC) model represents a stylised EU country with two distinct regions (‘coastal’ and ‘inland’) each with a homogeneous cement market exhibiting Cournot-Nash equilibrium. In the absence of CO2 costs, customers in the coastal region are served both by local and inland EU producers, as well as by non-EU producers. However, because of the land transportation barrier between the two regions, inland customers are initially served only by local and coastal producers. From this starting point, the model calculates how the pattern of trade, and the number of competitors active in each region, would change in response to rising EU ETS costs. We consider two types of competitive structure, namely:
• a base case where there is no overlap between the EU firms which operate inland and coastal plants; and
• a more general and more realistic case where each EU firm operates plants in both regions of the country.
The model parameters are calibrated using empirical data on production and trade in Portland cement and its energy-intensive precursor (clinker) and they refer to a typical EU country where the coastal and inland regions have similar populations. The model can readily be adapted, however, to allow consideration of cases where the absolute level of market prices, or the proportion of the total market volume located in proximity to a seaport, differ from the European average. Our analysis takes account of the sensitivity of results to uncertainties in the estimated elasticity of demand.
We discuss the model’s implications for the impact of EU ETS costs on producer profits and patterns of international trade at two different CO2 prices (€20 and €50 per Tonne). Under the assumption of auctioned EU Allowances, we find that non-EU imports of cement and/or clinker increase significantly even in inland markets that were originally relatively protected. The inability of EU firms to pass CO2 costs through to their

4
customers without losing market share, and the relatively high fixed costs associated with clinker production, combine to generate negative cash flows for coastal producers and greatly reduced operating profits for inland producers even at moderate EU Allowance prices. This suggests the potential for short term leakage through increased imports, and the prospect of longer term leakage because of the impact on investment decisions.
1.3 Structure of paper
In order to place the discussion into context, we start by presenting some information about the production process for cement, the nature of emissions abatement options, the current level of market prices and recent patterns of trade within the EU. Section 2 also sets out a preliminary ex post empirical assessment of the impact of EUA costs on market prices in selected country markets during the First Trading Period4. The results, although not entirely conclusive, do highlight an apparent link between the Allowance allocation process and the degree to which marginal CO2 costs are either passed through or absorbed by producers.
Section 3 reviews the literature on ex-ante modelling frameworks used by other researchers during the run-up to EU ETS. Section 4 revisits the rationale for our own model in light of this literature but giving due consideration to the role of geography for the cement industry. It also explains how the scenarios we consider were calibrated. Section 5 presents and discusses preliminary results from a range of feasible scenarios. Section 6 discusses the limitations of the model and briefly considers some of the policy implications, particularly those relating to the design of any post-2012 ETS. Section 7 summarises the scope for further work, suggesting possible refinements to the modelling approach.
2. Characteristics of the European cement industry and the EU ETS
Appendix 1 provides a brief overview of how the EU ETS creates efficient economic incentives for producers to reduce their emissions of CO2 and for customers to seek less CO2-intensive substitute products. The remainder of this section explains how such principles would apply in the cement industry.
2.1 Cement manufacturing process
A highly simplified mass balance for the production of ‘CEM II’ grade Portland is shown in Figure 1. Raw materials, mainly consisting of crushed limestone, are fed into a calcining chamber and thence into a rotary kiln, being directly heated by counter-current gases from a burner (typically fuelled with pulverised coal or petroleum coke) located at the outlet end. The sintered clinker which leaves the kiln is cooled before being milled into a fine powder and blended with limestone or other additives. Modern rotary kiln plants operate continuously and are highly automated, so labour and maintenance can be regarded as fixed costs. Due to substantial economies of scale, there are only a few
4 The authors believe this is the first such analysis to have been published.

5
hundred kilns currently operating in the EU, the majority of which are controlled by a group of seven multinational firms.
2.2 Abatement, substitution and leakage
The relative magnitude of abatement and substitution effects will depend on four empirical factors, namely:
• marginal abatement costs of the production technology; • scope for using substitute products; • own-price elasticity of demand for the product; and • the nature of competition between firms in the market.
In considering the marginal abatement cost, we focus on the first step in the cement manufacturing process, which involves the conversion of raw materials into clinker in a rotary kiln. From a kiln operator’s viewpoint, opportunities for emissions abatement arise from improved energy efficiency or the use of less carbon-intensive kiln fuels. The corollary, however, is that kiln operators would regard any market trend towards finished cements with reduced clinker content as being a form of product substitution rather than kiln emissions abatement. The same consideration applies to any initiative by concrete producers to incorporate higher levels of cementitious additives such as Pulverised Fly Ash or Blast Furnace Slag (BFS) in the concrete mix.
These different perspectives on the industry explain the contrasting advice provided to the UK Government (Future Energy Solutions and the Carbon Consortium, 2005) and to the Irish Government (ICF Consulting and Byrne Ó Cléirigh, 2006) during the preparation of NAPs for the Second Trading Period. In the UK, the cost-effective abatement potential for kiln operators is estimated to be less than 50,000 Tonnes, corresponding to just 0.5% of current annual emissions. In Ireland, the CO2 abatement potential at a marginal cost €15 per Tonne is estimated to be 704,000 Tonnes per annum, i.e. nearly one-fifth of current emissions. However, most of this is expected to be achieved by replacing clinker with additives in finished cement, implying a concerted switch from CEM I type (95% clinker content) to CEM II type (~80% clinker content) as the standard product for use in concrete, and an increased use of CEM III (60% clinker content) in specialist applications5. The residual abatement (80,000 Tonnes) is to be achieved from kiln fuel switching6. None of it is expected to arise from improved kiln design.
In considering the own-price elasticity, we note a lack of consensus in the literature. One empirical estimate for finished cement (La Cour and Mollgaard, 2002) suggests that demand is highly inelastic (ε = -0.27). The validity of this figure has been called into question. (Hepburn et al, 2006). Furthermore, we recognise that the technical scope for using reduced clinker cements may imply a relatively elastic demand for clinker (as 5 Walker and Richardson (2007) conclude that this target is technically feasible, but that a number of institutional or logistical factors may prevent it from being achieved. 6 Ireland’s livestock industry provides a ready source of Meat and Bone Meal for use as a biomass fuel.

6
opposed to cement) over the longer term. In short run, however, a widespread move towards low clinker cements in Europe may be limited by national technical regulations and/or constraints on the economic availability of cementitious additions such as BFS.
With regard to the nature of inter-firm competition, we note that cement may be imported as a finished product, or that imported clinker may be milled and blended into cement at the point of arrival. In the former case, the production cost of imported cement is completely unaffected by the EUA price; in our model, the exporting country is assumed not to have any carbon tax or emissions trading system affecting cement producers. In the case of imported clinker, the production cost of finished cement is indirectly affected by the EUA price, although only to the extent that it increases the unit cost of electricity required for local milling and blending of clinker granules into powdered cement.
2.3 Trends in production, market prices and trade patterns
Eurostat’s production statistics7 indicate a steady growth in the volume of cement products within EU15 countries over recent years. The current annual output is circa 200 Million Tonnes of which various grades of Portland cement account for about 85%.
Cembureau’s members firms ceased publishing annual national price lists in 2002, possibly motivated by a desire to avoid any appearance of collusion. Since then, contract prices between producers and their major customers (concrete producers and builders’ merchants) have been negotiated on a bilateral basis. Nevertheless, an analysis of Eurostat production data reveals substantial and persistent differences in average market prices8 between adjacent countries (Figure 2). This does not appear to reflect differences in kiln technology or energy cost, although it may partly reflect the relatively high cost of transporting cement by road. Indeed, given that cement plants typically serve customers within a 150km radius, there may be price variations even within a country9. As Walker (2006) suggests, such price variations may reflect heterogeneity in the utilisation of kiln capacity rather than differences in the unit cost of production. Indeed, it is conceivable that a local scarcity of kiln capacity would result in higher market prices, even though the resulting efficiency of utilisation would reduce the average fixed costs of production.
An analysis of Eurostat trade data (Figure 3) reveals a declining trend in the annual imports of non-EU cement, especially from Turkey. However, as shown in Figure 4, an increasing proportion of the cement produced within EU15 uses clinker imported from non-EU countries. Pinatel and Godet (2006) explain that much of this activity is taking place in Spain, where the growth in demand for cement over the past two decades has not been matched by increases in kiln capacity. Indeed, the trend in kiln investments and
7 http://epp.eurostat.ec.europa.eu/portal/page?_pageid=0,1136217,0_45571467&_dad=portal&_schema=PORTAL 8 Consumption volumes and corresponding Euro values are inferred by adding production to imports and then deducting exports. The figures do not capture monthly fluctuations or variation between customers. 9 Oxera (2004) recognizes this possibility, but nevertheless considers cement markets in Europe to be essentially national in scale, citing relevant competition law cases to support this view.

7
closures, as reported in various editions of Cembureau’s World Cement Directory, suggests that the ratio of annual cement consumption to clinker production capacity in Spain has more than doubled over this period (Walker, 2008).
Figure 4 highlights how the main sources of non-EU clinker have sequentially changed in recent years, suggesting a degree of opportunism by the importing firms. The quantity from Turkey started to decline in 2003, coinciding with the country’s transition from economic stagnation to rapid growth. Rising domestic consumption of cement may have soaked up kiln capacity which would otherwise be available for exports. The resulting gap in supply was temporarily filled by imports from Egypt although by 2006 these too were in decline10. Once again, the resulting gap was filled by imports from a new non-EU source, namely China. However, there are two reasons why this source may also prove to be temporary. Firstly, the freight cost for long-haul bulk cargoes, as measured by the Baltic Dry Index, quadrupled in US$ terms between 2003 and 2007 (Figure 5). Even allowing for recent currency movements, this significantly reduces the net revenue received by a Chinese clinker exporter. Secondly, the availability of Chinese clinker for export coincided with a government austerity drive designed in part to slow down its booming building sector. Since then, the Chinese government has reduced favourable export credits on cement and clinker, presumably to encourage greater supply to its domestic market.
In summary, Europe’s growing reliance on clinker imports has, to date, prevented cement prices in Europe from rising as fast as they otherwise would have, and it may have discouraged investment in new kilns. However, it does not appear to have discouraged local investment in grinding and blending equipment. From Eurostat data presented in Figure 6, it is evident that the conversion of a Tonne of clinker into circa 1.25 Tonnes of cement is capable of adding considerable value. The recent upward trend in EU cement market prices may therefore reflect a gradual tightening of clinker supply relative to grinding capacity.
It is unclear whether the 800,000 Tonnes of cement imported by sea from Russia to Spain could be augmented in the event of supply shortages11. It is possible that as-yet untapped supply sources may come to the fore, especially in developing countries where new kiln investment, including some by Europe’s multinational firms, may temporarily outstrip local market growth. However, the risk of supply shortages (and associated price spikes) in Europe may depend on the timing of such projects.
2.4 Pass-through of EU Allowance costs into cement prices
10 This trend appears to precede the Egyptian government’s decision in 2007 to impose an export tax on clinker and cement. It appears that rising demand (and sharply increasing domestic prices) in Egypt were starting to make it more profitable to serve the local market rather than to export. http://www.businesstodayegypt.com/article.aspx?ArticleID=7296 11 There are also currently exports totalling 400,000 Tonnes into Eastern Europe from Belarus, Ukraine and Russia but these consist mainly of local land-based trade.

8
Walker et al (2007a) have suggested that, by comparing point estimates of market price12 and controlling for the cost of electricity and kiln fuel, it is possible to obtain approximate estimates of the percentage-pass-through rate for EU Allowance costs during the First Trading Period. They conclude that the pass-through rate of marginal costs in the major country markets was substantially lower than the value of 83% predicted for the UK by Oxera’s model. In five out of seven cases13 the value appears to be less than 30%.
The observed low pass-through rate is consistent with Eurostat data for intra-EU15 cement trade. Figure 7 shows a steady upward trend in monthly import prices over the period 2002 to 2006. No disturbance of this price trend was evident during the second half of 2005 when EU Allowance price increased by nearly €23 per Tonne of CO2. Nor did the trend appear to be affected when the price of EU Allowances collapsed to near zero during the summer of 2006.
The apparent insensitivity of EU country market prices to Allowance costs may be interpreted as due to a combination of factors such as:
• the use of average, rather than marginal costing by cement producers in respect of their freely allocated EU Allowances;
• an unwillingness to raise prices for fear of losing market share to non-EU firms; and • a degree of price inertia due, possibly, to the prevalence of annual contracts; and • the dampening influence of local capacity scarcity on cement contract prices.
The first two of these interpretations are supported by anecdotal evidence from the authors’ discussions with leading cement producers in France and Ireland14. Moreover, the apparent accounting treatment of free EU Allowances as ‘soft’ costs would be consistent with an earlier ex ante analysis by Reinaud (2003), albeit in the context of the power sector. The distinction between ‘hard’ and ‘soft’ costs may become less relevant in any post-2012 ETS if, as expected15, the level of free allowances is progressively reduced over the eight year period to 2020. Given that the expected economic life of a new cement kiln is up to 40 years, the implications of this proposal are presumably being factored into current investment decisions. For this reason we initially model the impact of Allowance costs under full auctioning. The hypothesis of contractual inertia is outside the scope of our model, but the fourth possibility (capacity scarcity) will be explicitly considered.
12 The authors were given access to a proprietary database of European cement market prices allowing an estimate of the price increase between late 2004 and early 2006. The price levels and trends in each country turned out to be in close agreement with those inferred from Eurostat annual production statistics. 13 France, Spain, Italy, Portugal and Greece. The two exceptions were Germany, where cement prices were in any case recovering after a price war, and the UK, whose largest cement producer had been allowed to opt out of the pilot phase EU ETS. 14 Personal communication with Lafarge Ciments and Irish Cement. 15 European Commission memo 08/34, 23rd January 2008
9
3. Competitiveness issues in the cement industry: a review of ex-ante models
A review of the literature suggests that the selection of an ex ante methodology to address EU ETS competitiveness issues involves making a trade-off between the scope of sectors considered, and the amount of detail specific to each sector. For example, an analysis could involve several industry sectors to emphasize possible substitution between different products, or could instead focus on the competitive structure of a particular sector.
The former type frequently involves Computable General Equilibrium (CGE) modelling, typically calibrated using the GTAP database16. CGE models ignore transition effects, so are less complex than Macroeconomic models, but even so can be difficult to specify without simplifying assumptions such as perfect competition. The specification may also be sensitive to assumed values of key parameters such as substitution elasticity (Demailly and Quirion, 2007). Such models are nevertheless useful in assessing the medium or long term impact of EU ETS on welfare measures such as GDP growth, as well as the broad impact on industrial output. Examples of EU-wide studies of this type include Klepper and Peterson (2004, 2006), and COWI (2004).
The latter type more usually involves Partial Equilibrium (PE) modelling. In such cases, assumptions may need to be made about the nature of the inter-firm competition both within and between countries. For example, cement firms might act as Cournot (quantity-setting) or Bertrand (price-setting) competitors. Depending on whether transport costs are significant, bidding for customers may be on the basis of delivered prices, or of factory gate prices. Similarly, firms which produce in more than one geographic region may (or may not) require their production plants to co-operate rather than to compete for customers17.
Szabo et al (2003, 2006) have modelled in detail the potential impact of emissions trading on the cement industry. Their bottom-up framework (CEMSIM) is derived from the European Commission’s POLES model. Demailly and Quirion (2005) have combined CEMSIM with a global transport model to derive predictions about patterns of cement trade. Their GEO-CEMSIM framework assumes that Cournot competition exists between competitors within each country market, that Bertrand competition exists between countries, and that the demand curve is iso-elastic (ε = -0.20) implying that firms achieve a constant percentage-mark-up over marginal costs if not subjected to international competition. Demailly and Quirion (2006) present a similar analysis but assume that Cournot competition applies throughout all regions, and that the inverse demand function for cement is linear. This implies that the percentage mark-up is not constant as marginal costs increase, even in the absence of international competition. Indeed, in such circumstances, the rate of pass-through of incremental costs in to prices (∆P / ∆C) at the new Cournot equilibrium market prices depends only on the number of EU and non-EU competitors active in the given market (see Kimmel, 1992, or Ten Kate and Niels, 2005).
16 https://www.gtap.agecon.purdue.edu/ 17 Sister plants may, nevertheless, be competing with each other over funding for new capital projects.

10
This result was applied by Oxera (2004) to model EUA cost pass-through rates in a range of UK industries18. Oxera included the mitigating effect of lump-sum free allocations (‘grandfathering’) of allowances when estimating the likely net impact on the profitability of firms. Oxera’s analysis suggests that cement firms (in the UK at least) will generally achieve increased operating profits from EU ETS despite an overall reduction in market demand. This is due to three factors, namely:
• a relatively high predicted value (83%) for cost pass-through • the lump-sum endowment effect of grandfathered EU Allowances, and • that initially there are no non-EU cement imports19.
Demailly and Quirion (2006) similarly conclude that the European cement sector under EU ETS can maintain or improve its profitability as a result of free allocation, but (in contrast to the main Oxera findings) they predict significant production losses and carbon leakage.
The methodology followed in this paper lies intermediate between the Oxera approach (which uses a simple Cournot model to characterise oligopolistic competition) and the Demailly-Quirion approach (which combines a very large number of local Cournot models with detailed features of worldwide competition and trade, and is therefore highly data-intensive and difficult to calibrate).
4. Cement Trade and Competition (CTC) Model
4.1 Preliminaries: geography, technology and the allocation mechanism
To provide a more systematic assessment of the role of geography, we estimate in Table 1, for selected EU Member States, the proportion of total cement demand accounted for by coastal regions, assuming that it to be proportional to the population. There are wide variations between the five countries selected, suggesting the potential for different levels of competitive exposure. An analysis of Eurostat trade data also reveals wide variations between these countries in terms of the current level of non-EU cement and clinker imports. As might be expected, Spain and Italy have relatively high non-EU imports, while Germany has none. Interestingly, though, the UK also has virtually none despite the market being effectively 100% coastal.
There are two other important features of the cement industry which reflect the role of geography. Firstly, most competitors are multi-plant firms operating in many markets, some of them all over the world. This creates some dependence among regional markets and makes the identification of the relevant market in an economic sense quite difficult. Secondly, capacity constraints encourage firms to deliver their production close to their
18 Oxera’s model did not explicitly consider product differentiation, and effectively treated each product as a uniform commodity. We believe that this assumption is reasonably valid for cement and clinker. 19 Oxera (2004) does, however, briefly discuss an alternative ‘downside’ case in which the initial level of non-EU imports is non-zero, and suggests that this may be relevant to certain other EU countries.

11
plants. (Table 1 gives an indication of the degree to which kiln capacity might be constrained in each EU country.)
Roughly speaking these two features generate regional oligopolies with long haul trade flows to balance regional disequilibrium between supply and demand. The local impacts of such flows on regional competition may vary depending on strategic entry barriers (vertical integration, control of logistics, product differentiation, etc.), the modelling of which is beyond the scope of this paper. In spite of this limitation (and various others which we discuss in Section 6) we believe that our model contributes to a better understanding of the issues by introducing transportation, plant ownership and capacity constraints into the Cournot framework developed by Oxera (2004) and Smale et al (2006).
As for abatement, we closely follow Oxera (2004) in assuming that the inclusion of emissions abatement measures has a negligible impact on the profits20 of cement firms at the EUA prices considered likely for the 2008-12 Trading Period, implicitly accepting the case presented by Future Energy Solutions and the Carbon Consortium, namely that short-term abatement opportunities for kiln operators are very limited. Hence the estimates of Carbon leakage rates in our model are based on expected short-run reductions in cement consumption and changes in Cournot competitor market shares and the cement price as a result of EU Allowance costs.
Finally, in line with our previous discussion of allocation, we assume that any post-2012 ETS will (eventually) operate as a pure auctioning scheme and we model the cement sector accordingly.
4.2 Structure of the model and choice of scenarios
The general framework to be used relies on Laye and Laye (2007). N firms interact on a number of regional markets. A regional market, denoted as market i, is characterized by a linear inverse demand function:
pi = ai – biQi
in which pi denotes the market price, Qi denotes the total quantity and ai and bi are two parameters.
A firm may operate several plants. A plant, denoted as plant j, may send part of its production to any market i. Let qji be the part sent to market i and qj its total production. Denote Cj (qj ) the supply cost of plant j. It is characterized by a linear function which consists of two components: the marginal production cost and the transportation cost:
Cj (qj ) = cj qj +Σι tji qji
20 Oxera refer to Earnings Before Interest, Depreciation, Interest, Tax and Amortisation. We refer instead to gross profits (which are before the deduction of fixed costs) or to operating profits (before interest and tax).

12
in which cj and tji are parameters. Plants are capacity constrained. For each j, there is a parameter Kj such that qj ≤ Kj.
This general framework is further specified using a number of assumptions relevant to our study.
• Each national EU market is independent of the other EU markets, consistent with the observed wide variation in country market prices;
• A national EU market is sub-divided into two regional markets: a coastal one and an inland one, the latter being more protected from imports than the former
• There are three sets of firms: coastal firms, inland firms and importers. Only the first two types of firms incur an increase in variable cost due to CO2.
Two stylized cases are considered, namely:
• the Base Case in which each EU firms has plants only in one regional market (and no importing plant); and
• the Multi-plant Multi-market Case in which each EU firms has plants in the two EU submarkets (and no importing plant).
The impact of price elasticity and the issue of clinker versus cement importation are discussed as variants of the Base Case. Capacity constraints are discussed as a variant to the Multi-market case.
4.3 Calibration of the model and reference data
The calibration of the model is based on some key reference data (to be detailed and justified shortly). These data correspond to a situation with a zero CO2 price. Cement prices and quantities consumed in the coastal and inland markets are given, as well as the initial percentage of imports to the coastal market. (Initially there are no importers active in the inland market because their delivered cost would be higher than the market price). The same price elasticity of demand is assumed for both markets. The cost functions are known and it is assumed that the total transportation cost incurred by importers to move cement to the inland market equals the marine freight to the coastal market plus road freight from the coastal market to the inland market.
The Base Case is calibrated as follows. From the reference data the inverse demand functions in the coastal and the inland markets can be inferred as well as the number of firms of each type (see Appendix 2). The market structure which is inferred from our procedure reflects the degree of competition in each market and not necessarily the actual number of competitors. The Multi-plant Multi-market Case is then derived from the Base Case simply by assuming that firms operate in both EU regional markets. Cement prices and quantities are adjusted accordingly, and there is a clear impact on the intensity of competition.

13
With regard to the reference data, we have arbitrarily specified equal volumes of consumption in the inland and coastal regions. As shown in Table 1, this is broadly representative of France, Spain and Italy. To give a sense of the financial exposure for a medium-sized country market, we specify consumption of 11.2 Million Tonnes in the coastal and likewise in the inland region. In the Base Case this initially corresponds to an output of about 2.5 Million Tonnes per indigenous producer. As Appendix 2 demonstrates, the number of regional producers active in each market depends only on the specified market prices and the coastal import rate. Therefore, the cost pass-through rates and gross margins are independent of the absolute and relative sizes of the coastal and inland markets21. The carbon leakage rate, calculated for the country as a whole, does, however, depend on the relative size of each regional market.
The Base Case reference cement prices of circa €65 per Tonne (coastal region) and €76 per Tonne (inland region) are chosen such that the average value is typical of the range of country market prices shown in Figure 2. Our decision to specify an inland price €11 higher than the coastal price is consistent with the empirical findings of Walker (2006) who econometrically estimated the relative price of marine and inland cement imports22.
In the absence of any CO2 obligation, we specify the short-run variable production costs to be €25/Tonne for EU producers. This includes raw materials, kiln fuel and electricity for the grinding raw materials and finished cement. However, it excludes all other operating costs. The specified figure is consistent with Walker et al (2007a) who estimated the combined variable cost to be €22.50 per Tonne of cement in 2006. After adjustment for recent movements of electricity prices, coal prices and exchange rates, it is also consistent with an earlier estimate by Reinaud (2005) who presents the following figures for a modern European cement plant operating at 85% kiln utilisation:
• raw materials, fuel and electricity: US$20.92 per Tonne • fixed cash costs (including labour & maintenance): US$26.83 per Tonne • non-cash fixed costs (i.e. depreciation): US$7.71 per Tonne.
Slightly lower variable cost figures (€15 per Tonne excluding freight) are assumed for non-EU producers. The assumed €10 per Tonne cost differential between EU and non-EU is justified by reference to Pinatel and Godet (2006) who report ‘cash’ unit costs of cement production23 to be US$30/Tonne in Western Europe, US$15/Tonne in the Far East and just US$12/Tonne in North Africa (excluding any export tax).
The assumed marine freight cost of €34 per Tonne of cement includes loading, discharge and port fees and is based on historical average freight costs for bulk cargoes of
21 The market in Great Britain, effectively being 100% coastal, is one obvious exception to this principle. 22 One possible exception to this is Germany, where inland prices may have fallen further than coastal prices during 2003 because of incipient over-capacity. 23 Since these costs are not precisely defined, some of the differential may arise from direct labour.
14
similar products on short-haul Mediterranean routes24. The historical data is presented in Table 2. In the case where clinker is imported for milling and blending, the effective freight cost is reduced by 20%. (In principle, some of the freight saving may be offset by higher electricity costs for milling the final product, but we ignore this.)
The assumed road freight cost of €32 per Tonne between the inland and coastal markets implies a fixed journey length of roughly 400km. In the Base Case, this allows some cross hauling of cement between the two EU regions but none from the importers to the inland EU region.
Following Oxera, we have assumed a price elasticity of demand of -0.27 in the Base Case. However, we also run a variant ‘Higher Elasticity’ scenario in which it is instead assumed to be -0.40 but where the initial import rate and the regional market prices are unchanged from Base Case.
Our assumption of a 20% coastal import rate from non-EU countries is consistent with the average level of non-EU exports of cement and clinker to EU15 countries, expressed as a proportion of cement production in those countries. However, we recognise that the patterns of trade in cement and clinker differ significantly between Member States.
We have assumed a direct emissions intensity of 0.70 Tonnes of CO2 per Tonne of cement (equivalent to 0.875 Tonnes per Tonne of clinker). This is somewhat lower than the value for the UK suggested by Oxera, but it is consistent with estimates reported by Cembureau (1999) and by the European Commission (2001).
5. Results from the CTC Model
5.1 The Base Case scenario
Table 3 shows the initial specification of the Base Case as well as the competitive impact of EU Allowance prices of €20 and €50. The cement market prices have been fine-tuned to ensure that the inferred structure corresponds to an integer number of firms active in each region. There are four independent producers located in the coastal region and another four in the inland region; all eight initially compete in both markets. In addition, the coastal market is served by three producers located outside the EU.
At very low EU Allowance prices, the marginal cost pass-through rate in the coastal market would be 67% because eight out of the eleven active firms are subject to the cost, whereas in the inland market it would be 89% because all eight of the active firms are subject to the cost25. However, if the price of EU Allowances were to rise above
24 Freight rates for such routes have been less volatile than those for the much larger oceanic vessels. We implicitly assume that in the longer term, non-EU imports will come from around the Mediterranean. 25 Recall the general formula for cost pass-through for linear Cournot models. At the outset, a number of firms are active in the market. Suppose a subset of those firms, (J2) incur an increase ∆c in variable cost while the cost functions of the other J1 active firms are unaffected. Further suppose that all the J2 firms

15
€6 per Tonne the inland market price would be above the marginal supply cost for non-EU producers, which therefore start to enter the inland market. The pass-through rate would then be 67% in both regions. If the price of EU Allowances were to rise beyond €27 per Tonne, inland producers would find unprofitable to continue serving their coastal customers. The marginal cost pass-through rate in the coastal region would then fall to 50%. The regional cost pass-through rates reported in Table 3 for each EU Allowance price are weighted averages of these marginal rates.
In the Cournot-Nash equilibrium, the regional market share of each producer varies in proportion to its gross margin when supplying that region. The total consumption in each region is calculated by reference to the assumed elasticity and the percentage change in market price. From these, it is possible to calculate the amount of EU-produced and non-EU-produced cement which is consumed in each region at any given EU Allowance price. Assuming all producers use similar kiln technology and kiln fuel, and hence have the same CO2 emissions intensity, the leakage rate (for the EU country as a whole) is calculated as the ratio between the increase in non-EU imports and the decrease in output from indigenous firms. Table 3 shows it to be 70% at an EU Allowance price of €20 and to be 73% at an Allowance price of €50. We acknowledge, however, that this result is partly a function of the assumed short-run own-price elasticity, which predicts a demand reduction of just 10% given a 33% increase in market prices. We also accept the possibility that a novel abatement technology such as Carbon Capture & Storage might in due course prove to be economic for kiln operators given a sustained EUA price of €50 per Tonne (IEA, 2006), and that this would have the effect of reducing the leakage rate significantly26.
As shown in Table 4, in the absence of EU Allowance costs the coastal and inland producers would achieve aggregate gross profits of €360 Million and €432 Million respectively. Taking the figures quoted by Reinaud (2005) as a guide, we assume additional fixed costs of €20 per Tonne, and depreciation of €6 per Tonne, so the aggregate operating profit for coastal producers would be circa €84 Million for coastal firms (on a combined turnover of €718 Million) and for inland producers it would be circa €178 Million (also on a combined turnover of €718 Million).
An Allowance price of €20 would reduce the aggregate gross profit of coastal producers by 24% and that of inland producers by 15%. In financial terms, this could reduce the operating profits of coastal producers to zero and those of inland producers to €120 Million. However, at an Allowance price of €50 the gross profits of coastal and inland producers would be reduced by 60% and 38% respectively. In this case, the operating profits of inland producers would be reduced to €19 Million; they could survive, but the return on capital would be too low to justify any new investment. However, the coastal producers would suffer operating losses of €129 Million and would
remain active at the new equilibrium. The change in equilibrium price is then given by: ∆pi / ∆c = J2 / (J1 + J2 +1) 26 Due to the calcining process emissions, the concentration of CO2 in kiln flue gases is higher than that observed in other coal-fired combustion installations. This may enable cheaper recovery techniques.

16
incur large negative cash flows even after adding back the depreciation charge. It is therefore likely that some would be forced to close. We acknowledge, however, that this outcome would be contingent on the availability of unused cement/clinker export capacity in non-EU countries, and that such capacity would not be directly or indirectly controlled by European multinationals.
5.2 Variant 1 of Base Case scenario: clinker import
We re-run the Base Case with unchanged reference market prices and coastal import rate, but assuming that clinker rather than cement is imported. Because each importing firm now has slightly lower marine freight costs, it achieves a higher market share in the coastal market. However, since the specified import rate is unchanged, the inferred virtual market structure now involves only two non-EU producers27. The results on pass-through rates, leakage rates and adverse impact on gross profits turn out to be similar to those in the Base Case.
5.3 Variant 2 of Base Case scenario: higher elasticity
We re-run the Base Case with unchanged reference market prices and coastal import rate, but assuming the elasticity of demand to be -0.40 rather than -0.27. Again, the inferred virtual market structure turns out slightly different from Base Case, but the pass-through rates at each EU Allowance price are similar to Base Case. The main difference from Base Case is that consumption is reduced more sharply as prices increase; this leads to slightly lower leakage rates (56% and €20/Tonne and 67% at €50/Tonne) but also to significantly worsened impacts on the gross profit of coastal and inland producers.
5.4 The Multi-plant Multi-region Case
In this case, there are four EU firms, each of which simultaneously operates in both the coastal and the inland markets. This would tend to soften competition compared with Base Case, since each plant will supply cement only to local customers. As a consequence, the initial prices in each market turn out to be higher than the Base Case28. Table 4 shows that the EU firms initially achieve higher profits than in the Base Case in spite of the fact that non-EU imports are higher (25% rather than 20% in the coastal market and 7% rather than 0% in the inland market).
Using this situation as a new reference we re-analyze the impact of the EU Allowance costs at CO2 prices of €20/Tonne and €50/Tonne. The cost pass-through rates (also shown in Table 4) are lower than in the Base Case due to the change in market structure. For any given CO2 price, the firms’ profits decline more sharply than in the Base Case. Put differently, the networking by multi-plant firms reduces domestic
27 Of course, the importation of clinker would not necessarily reduce the number of available non-EU suppliers. Rather, it indicates that the same competitive effect can be achieved with fewer importers. 28 The initial coastal price is €69 while the inland price is just below €88.

17
competition but in doing so it makes the overall national market more vulnerable to EU Allowance costs.
5.5 Variant 1 of the Multi-plant Multi-region Case: capacity constraint
We re-run the model assuming that some EU firms in the coastal market are capacity constrained. This is in line with the situation in Spain (and to a lesser extent with France and the UK). The capacity constraint generates an increase in the coastal price which triggers more imports and, depending on the degree of toughness of the constraint, a flow of product from inland producers to serve the coastal market. The Cournot equilibrium may be quite complex to determine algebraically but it can be done numerically thanks to Laye and Laye (2007)29.
Table 4 shows the impact on gross profit in a case where the two out of the four EU firms are assumed to be constrained to 80% of what they would otherwise initially produce. The coastal market price is initially €4 higher than in the unconstrained case. However, because two of the coastal firms are not initially strategic, the cost pass-through rate is lower for all four coastal firms.
Coincidentally, for any given CO2 price, the aggregate gross profits of the EU industry are the same as in the unconstrained case, with the loss in market share to importers being compensated overall by the increased price. The unconstrained firms initially make higher profits than the constrained ones but there is a new repartition of the profits between the EU firms as CO2 costs are introduced. For example, the two unconstrained coastal plants would incur a 35% reduction in gross profit when the price of CO2 climbs from €0/Te to €20/Te whereas the average reduction for all four coastal producers is just 29%. As the CO2 price increases further, though, the relative disadvantage experienced by the two unconstrained firms gradually decreases. Eventually, the market consumption decreases to a point where the capacity constraint will no longer be binding. Symmetry is then restored between the four EU firms.
6. Discussion and Policy Implications
29 The literature on imperfect competition under capacity constraints was initiated by Kreps and Scheinkman (1983) who showed that quantity pre-commitment followed by Bertrand competition would result in an outcome equivalent to that of Cournot competition. A natural way to think of the situation would be to assume that, at the first stage, firms have to decide capacities without perfectly knowing the demand function and that, at the second stage, they compete in prices or in quantities knowing the demand function but under capacity constraints (Gabszewicz and Poddar, 1997). Our formulation focuses on the second stage, more specifically on Cournot competition under capacity constraints. It differs from Gabszewicz and Poddar in the sense that there are multiple markets. The derivation of a Nash equilibrium cannot be obtained through an analytical treatment but requires numerical calculations. We use the result of Laye and Laye which proves that with linear demand and linear cost (and transport) functions, there exists a unique capacity Cournot Nash equilibrium. Laye and Laye also showed that this equilibrium can be obtained as the maximum of a concave function over a convex region. We have derived this function for the situation at hand and its maximum has been calculated through a standard algorithm.

18
In this Section, we outline some of the model’s limitations before seeking to summarize what the results of the CTC model would imply for the competitiveness of cement producers under a hypothetical EU ETS with full auctioning. We also consider how this would impact on the investment decisions of multinational firms. We then consider the mitigating effect of free allocations or border adjustments, either of which might feature in the post-2012 ETS.
6.1 Caveats about the realism of the CTC model
In comparison to the generic (multi-industry) non-spatial Cournot model applied by Oxera, the CTC model includes a number of commercial and logistical features specific to the cement sector which are intended to make it more realistic as a tool for policy analysis. Its main contribution is a qualitative one in that it highlights the risk of being overly simplistic by considering the EU market as a single region largely protected from imports because of transportation cost barriers and a concentrated industry structure. Such a simplification might induce a global judgement that this industry could easily pass through the CO2 cost and should not be considered as a sensitive one. Our model, in contrast, depicts an industry consisting of interdependent regional markets. There are differences in competitive exposure between regions which result from a complex interaction between local factors (demand and supply, capacity constraints, market concentration) and non-local factors such as competition from adjacent regions and through long haul cement flows. However, even though our model is calibrated with industry data, it is unlikely to capture all of the ‘real world complexities’ which Harrison et al (2007) consider to be relevant in the appropriate allocation design for an emissions trading scheme. For example, the CTC model does not currently address the following issues:
• the competitive impact of intra-EU trade across land borders • the assumption of profit maximising (rather than sales maximising behaviour) by
kiln operators in different firms • the degree to which European cement customers regard non-EU cement or clinker
as an imperfect substitute • the relative emissions intensity of EU kilns and exporting non-EU kilns • the relative potential for substitute kiln fuels or clinker substitutes in each EU
country market • the extent to which kiln capacity is constrained in EU countries other than those
discussed in this paper • the existence of strategic entry barriers that may be used by EU firms to deter non
EU firms (for example, vertical integration, control of logistics, and the threat of retaliatory action in the non-EU market)
• the political and other risk factors involved in any relocation decision by a European multinational firm.
The CTC model therefore does not claim to be a quantitative tool for EU-wide policy decisions on the design of an allocation method for post-2012 Allowances. Instead, our approach can be regarded as a starting point to identify some of the possible

19
consequences associated with imposing a harmonized approach across the EU27. We briefly return to this point in Section 7.
6.2 Competitiveness impact under full auctioning
The main results from our model may be summarized as follows:
• at the level of EU Allowances prices currently prevailing for 2008 (circa €20 per Tonne) there would be a large adverse effect on profitability and market share for coastal plants, and a risk of longer term leakage through relocation;
• the stronger any capacity constraints for the coastal producers are, the lower the cost pass through rate in these regions and the lower the incentives to expand capacities;
• the competitiveness impact for inland producers is somewhat mitigated by the additional transportation barrier, although as EU Allowance price increase they will increasingly face import competition;
• if very high EUA prices (say €50/Tonne) were experienced, there could be immediate leakage through plant mothballing or closure of coastal plants, although only to the extent that export capacity was immediately available in non-EU countries.
The condition attaching to the fourth of these points is ultimately an empirical question, and the answer may be contingent on the economic growth cycle in potential exporting countries. For example, a global economic slowdown could quickly free up a very large amount of kiln capacity. The situation in cement trade could then be reminiscent of what happened in the mid 1980s when the technology of bulk maritime transportation enabled large export flows from countries with excess capacity such as Greece and Turkey into European markets such as France and the UK (Dumez and Jeunemaître, 2000). A number of years later, major French and British cement firms acquired some Greek and Turkish firms (Ponssard et al, 2007). That consolidation move reduced the degree of competition between these EU regions. There is, however, one important difference. The Greek and Turkish producers were not intrinsically more cost efficient, whereas in the current situation, producers which do not incur the social cost of CO2 emissions would enjoy an absolute advantage over EU-based producers. Therefore, any future consolidation move by EU producers may involve a partial relocation of production.
6.3 Mitigating effect of free allocations
Elementary economics suggests that cement firms would apply different measures of cost depending on the type of decision being made. For example, a firm considering whether to reduce the clinker output of its kilns would simply compare the local cement market prices against the short-run marginal cost. In contrast, the same firm considering whether to construct new capacity within the region would presumably compare the projected market prices against long run marginal cost, including the mitigating effect of free Allowances received under a New Entrant Reserve (NER).
Depending on the mechanism by which free allocations of EU Allowances are issued, firms may use them either to compensate for a loss of market share, or to reduce the level

20
of such loss. For example, suppose that 75% of the EU Allowances required for ‘Business as Usual’ were grandfathered on the basis of historic consumption. The coastal firms (which in aggregate produce 10.5 Million Tonnes of cement and emit 7.35 Million Tonnes of CO2) would be given 5.5 million EU Allowances per annum. Similarly, the inland firms (emitting 6.8 Million Tonnes of CO2) would be given 5.1 million EU Allowances. The value of such lump-sum allocations depends on the prevailing market price of allowances. However, the marginal cost of production remains unchanged, and the loss of market share should therefore be the same as under full auctioning, unless of course the firms were to make decisions based on average rather than marginal costs.
If the allocation were made on the basis of current (or very recent) production, the free allowances would effectively be ‘earned’ by producing clinker30 in accordance with an appropriate technology benchmark (Neuhoff et al, 2006). The marginal cost of allowances under such Output Based Allocation (OBA) would then be equal to the average cost; consequently, the loss of market share would be reduced, although the overall operating profits of firms would not improve. Kiln operators would still have an incentive for fuel switching and better energy efficiency under OBA but their customers would have less of an incentive to switch to reduced clinker cements.
A multi-national firm’s consideration of the preferred EU location for any new kiln could be influenced by the level of Allowances allocated under the NERs in each Member State. It may also be distorted by any local provisions covering the closure of installations. As Bouttes et al (2007) note, the arrangement whereby individual Member States determine the allocation rules for grandfathered EU Allowances could result in all of the NAPs moving towards the ‘lowest common denominator’. Cement firms would be better able to lobby successfully for a more generous free allocation on the basis of securing future investments in kiln capacity in the domestic market rather than outside the EU. It is partly for this reason that the European Commission has recently indicated its intention to centralise the allowance allocation process in any post-2012 scheme.
It remains unclear what level of EU kiln investments would be made over the next few years in the absence of EU ETS costs (the ‘counterfactual’). Pinatel and Godet (2006) report that only four new kilns have been built in Western Europe in recent years and that two of these were replacing obsolete plants31. The apparent trend over the past decade, particularly in Spain and Italy, has been for growing demand to be met by the importation of clinker. Local firms thereby avoid potentially long term risky investments but retain control of the final stage in which the clinker is milled and blended into cement.
Nevertheless, given the potential adverse consequences of EU Allowance costs, it is not surprising that cement producers lobbied so hard for generous allocations. It is also
30 The alternative, whereby the allocation was in proportion to the output of blended cement, would actually provide a perverse incentive for CO2 leakage through the importation of non-EU clinker. 31 This analysis excludes two relatively recent cement plants built in Ireland, a country whose building sector has experienced rapid growth over the past decade.

21
understandable that some of them favour a move away from historic grandfathering in favour of sector-specific benchmarks, possibly outside the scope of EU ETS altogether.
6.4 Advantages and disadvantages of border adjustment
A border tax adjustment specific to the cement sector is among the policy measures reportedly being considered by the EU Commission. (Point Carbon 2006a). Cembureau reportedly favours such a proposal as a temporary measure (Point Carbon 2006b) although in the longer term it would still prefer to see a global scheme for the cement sector based on benchmarking.
The underlying principle of border adjustment, in its ‘tax’ version, is that EU producers would receive a partial or complete refund of EU Allowance charges incurred in respect of exports to non-EU countries, while importers from non-EU countries would face a tax based on the CO2 emissions embedded in their products. As proposed by Ismer and Neuhoff (2004) the notional embedded emissions could be determined by reference to the best available technology in the EU. In the case of imported cement, the tax would need to be applied per Tonne of embedded clinker.
From an economic perspective, border adjustment has the potential to be very efficient at the global level (see for example Hoel, 1996 and Mæstad, 1998) because it prevents carbon leakage while allowing full internalization of the emission cost in the price of CO2 intensive products. It emerges as a first best solution as long as the EU remains the only global region with an active emissions trading scheme for CO2. In fact it may be argued that it is an encouragement for inducing other regions to participate to such a scheme (Godard, 2007)
Although cap and trade obligations can probably be regarded as legally equivalent to an environmental product tax rather than a producer tax (Pauwelyn, 2007) it would not be politically feasible for the EU to impose more a stringent regime on importers than on indigenous firms. For this reason, any such arrangements should probably be accompanied by full auctioning of Allowances. Nevertheless, the compatibility of this measure with WTO rules, even with full auctioning, is debatable (see Cros, 2007 and Ismer and Neuhoff, 2004). Moreover, the potential for unintended effects such as international trade conflict should be obvious.
7. Conclusions
The CTC model highlights that for countries already facing significant non-EU cement imports, there is a prospect of serious competitive damage as the level of grandfathered allowances is progressively reduced after 2012. There are two broad options (OBA and border adjustments) which could at least partly address the concerns expressed by the cement industry. However, these posited alternatives to grandfathering do carry environmental costs and/or political risks.

22
• OBA is capable of preventing carbon leakage without discouraging emissions abatement, but it potentially dilutes the desired effects of product substitution. It remains to be seen whether a hybrid benchmark, based on some carefully-chosen combination of clinker and cement output, might be capable of preventing relocation without discouraging clinker content reduction and innovation.
• Border adjustments are capable of preventing carbon leakage, while encouraging emissions abatement and product substitution, but they risk being regarded as protectionist measures by non-EU countries. Careful judgements therefore need to be made as to what, if any, level of adjustment is achievable without provoking retaliatory responses.
We believe that further analysis of such mitigating measures using the CTC model could be a worthwhile contribution to the policy debate regarding post-2012 arrangements. The impact of geography could be refined, for example, by considering a more finely graded differentiation between coastal and inland markets by means of Geographic Information Systems. It could also be empirically re-calibrated on a country-by-country basis to achieve a greater degree of realism in the results. Given that Eurostat production data for Portland cement is not available for all of the countries, it may be necessary to rely on other indirect data sources such as annual emissions recorded in the Community Independent Transaction Log.
Finally, we would offer some advice to policymakers. On the one hand, the potential for wide variations in regional competitive exposure suggests the need for targeted rather than uniform mitigating measures. For example, it might be possible to allocate proportionately more free allowances to installations in EU regions which are deemed to be more exposed to non-EU imports. (It would be difficult, though, to envisage a border adjustment on non-EU imports which targeted only the more exposed regions.) On the other hand, the potential for gaming for free allocations and the complexities of the strategic interactions between coastal and inland regions suggests that a differential approach to allocations will have unforeseen, possibly unintended, consequences. Further research, combining geography with more political aspects, may help to decide which alternative would be the more appropriate policy measure in the event that the cement sector were to be deemed sensitive post-2012.
Acknowledgements
We wish to acknowledge the contribution of Damien Demailly (previously at CIRED, Paris) to an earlier draft, and the helpful suggestions of three anonymous referees. We also gratefully acknowledge the assistance of Clémence Christin, Chloé Dahiot and Gwennaël Solard in operating and refining the CTC model. Jean-Pierre Ponssard’s research on this project has been partly supported by the Ecole Polytechnique chair for Business Economics and the EDF chair for Sustainable Development. Neil Walker’s PhD research at UCD was funded by an IRCSET Scholarship. The material in Section 2 is largely drawn from a working paper by Walker et al (2007a) with permission from its authors.

23
References
Bouttes, J-P, Trochet, J-M and Dassa, F, 2007, Assessment of EU CO2 regulations, IFRI Energy Breakfast Roundtable, Brussels, 30th January 2007
Cembureau (1999), “Environmental Benefits of Using Alternative Fuels in Cement Production: A Life-Cycle Approach”, February 1999. www.cembureau.be
Cembureau, 2006, Climate Change – CO2 Emissions Trading: Points of convergence within the Cement Industry, 29 March 2006, www.cembureau.be
COWI Consultants - Copenhagen (2004), Competitiveness and EU Climate Change Policy. Interim report produced for UNICE
Cros, C., 2007. Protection de la compétitivité industrielle, politique climat et OMC. Collection « Études et synthèses », Ministère de l’Ecologie et du Développement Durable, Direction Etudes Economiques et Evaluation Environnementale.
Demailly, D and Quirion, P, 2005, The Competitiveness Impact of CO2 Emissions Reduction in the Cement Sector, report to OECD Environment Directorate – Centre for Tax Policy and Administration, November 16th 2005
Demailly, D and Quirion, P, 2006, CO2 abatement, competitiveness and leakage in the European cement industry under the EU ETS: Grandfathering versus output-based allocation, Climate Policy 6(2006)
Demailly, D and Quirion, P, 2007, Allocation of CO2 allowances and competitiveness: a case study on the European iron and steel industry, forthcoming in Energy Economics
Dumez, H, and Jeunemaitre, A, 2000, Understanding and Regulating the Market at a Time of Globalization: The Case of the Cement Industry, Palgrave (McMillan), Basingstoke.
European Commission (2001), Integrated Pollution Prevention and Control (IPPC) Reference Document on Best Available Techniques in the Cement and Lime Manufacturing Industries, December 2001
European Commission, 2004, European Competitiveness Report, Enterprise Publications SEC(2004)1397
Future Energy Solutions and the Carbon Consortium, 2005, Industrial Sector Carbon Dioxide: a report for DEFRA, November

24
Gabszewicz, JJ and Poddar, S, 1995, Demand fluctuations and capacity utilisation under duopoly, Economic Theory, Springer vol 10(1) pp131-146
Godard, O, 2007, Unilateral European Post-Kyoto climate policy and economic adjustment at EU borders, presented to Research Workshop on the Impacts of Climate Change Policy on Industrial Competitiveness, École Polytechnique, Paris, June 12th 2007.
Grubb, M and Neuhoff, K, 2006, Allocation and competitiveness in the EU Emissions Trading Scheme: policy overview, Climate Policy 6(2006)
Harrison, DH, Klevnas, P, and Radov, D, 2007, Complexities of Allocation Choices in a Greenhouse Gas Emissions Trading Program, NERA Economic Consulting
Hepburn, C, Quah, JKH and Ritz, RA, 2006, Emissions Trading and Profit Neutral Grandfathering, University of Oxford Department of Economics, Discussion Paper Series, No 295, December 2006
Hoel, M., 1996. Should a carbon tax be differentiated across sectors?, Journal of Public Economics, 59(1), 17-32
ICF Consulting and Byrne Ó Cléirigh, 2006, Determining the Share of National Greenhouse Gas Emissions for Emissions Trading in Ireland 2008-12, submitted to the Department of Environment Heritage and Local Government
IEA, 2006, Energy Technology Perspectives in support of the G8 plan of action: strategies and scenarios to 2050, International Energy Agency, Paris
Ismer, R., Neuhoff, K., 2004. Border tax adjustments: A feasible way to address nonparticipation in emission trading. Cambridge Working Papers in Economics CWPE 0409
Kimmel, S, 1992, Effects of cost changes on oligopolists' profits. The Journal of Industrial Economics, 40:441-449.
Klepper, G and Peterson, S, 2004, The EU Emissions Trading Scheme. Allowance Prices, Trade Flows, Competitiveness Effects, Kiel Institute (Working Paper 1195)
Klepper, G and Peterson, S, 2006, Emissions Trading, JI, CDM and More: The Climate Strategy of the EU, Energy Journal 27(2)
Kreps, D and Scheinkman, J, 1983, Quantity Precommitment and Bertrand Competition yield Cournot Outcomes, Bell Journal of Economics 14 pp326-337
La Cour, L F and Mollgaard, H P, 2002, Market domination – tests applied to the Danish cement industry, European Journal of Law and Economics (14) 99-127.

25
Laye, J and Laye M, 2007, Uniqueness and characterization of capacity-constrained Cournot-Nash Equilibrium, Operations Research Letters (accepted 25th May 2007)
Mæstad, O, 1998, On the Efficiency of Green Trade Policy, Environmental and Resource Economics 11, 1-18.
Neuhoff, K., Keats, K., Sato, M., 2006. Allocation, incentives and distortion: the impact of EU ETS emission allowance allocations to the electricity sector. Working Paper, Cambridge University.
Oxera Consulting, 2004, CO2 emissions trading: How will it affect UK industry? Report prepared for the UK Carbon Trust, July www.oxera.com/main.aspx?id=239
Pauwelyn, J, 2007, US Federal Climate Policy and Competitiveness Concerns: the Limits and Options of International Trade Law, working paper NI WP 07/02, Nicholas Institute for Environmental Policy Solutions, Duke University
Pinatel, A and Godet, N, 2006, Building Materials Equities Research Report, Exane BNP Paribas, 20th March 2006
Point Carbon, 2006a, EC tables a border tax proposal from non-ETS areas, 6th October 2006
Point Carbon, 2006b, Cembureau advocates global market-based CO2 scheme for cement sector, 9th October 2006
Ponssard, J-P, Sevy, D and Tanguy, H, 2007, Economie de l’entreprise, Editions de l’Ecole Polytechnique, Paris, 2nd edition, , pp 45-51
Reinaud, J, 2003, Emissions Trading and its Possible Impacts on Investment Decisions in the Power Sector, IEA Information Paper
Reinaud, J, 2005, Industrial Competitiveness under the European Emissions Trading Scheme, International Energy Agency, Information Paper
Smale, R, Hartley, M, Hepburn, C, Ward, J and Grubb, M, 2006, The impact of CO2 emissions trading on firm profits and market prices, Climate Policy 6 (2006) 29-46
Szabo, L, Hidalgo, I, Ciscar, JC, Soria, A and Russ, P, 2003, Energy Consumption and CO2 emissions from the world cement industry, Technical Report Series EUR 20769, Institute for Prospective Technological Studies (IPTS), Seville, June 2003
Szabo, L, Hidalgo, I, Ciscar, JC, Soria, A, 2006, CO2 emission trading within the European Union and Annex B countries: the cement industry case, Energy Policy 34(2006) pp 72-87

26
Ten Kate, A and Niels, G, 2005, To What Extent are Cost Savings Passed on to Consumers? An Oligopoly Approach, European Journal of Law and Economics (20): 323-337
Walker, N (2006), Concrete Evidence? An empirical approach to quantify the impact of EU Emissions Trading on cement industry competitiveness, working paper PEP06/10, UCD School of Geography, Planning and Environmental Policy, 2006
Walker, N, 2007, Emissions Trading and Cement: What does the empirical data suggest?, presented to Research Workshop on the Impacts of Climate Change Policy on Industrial Competitiveness, École Polytechnique, Paris, June 12th 2007
Walker, N, Convery, F J, Bazilian, M and Ó Gallachóir, B P, 2007a, The Impact of the EU Emissions Trading Scheme on Competitiveness and Trade in the European Cement Sector, mimeo (available on request)
Walker, N and Richardson, M, 2007, Developing national standards for durability, performance and environmental sustainability of concrete: an Irish case study, mimeo (available on request)
Walker, N, 2008, CO2 Price Effects on EU Industry, presented at CEEPR workshop ‘The EU ETS: perspectives and lessons’, Washington DC, January 24-25
Appendix 1. Overview of the EU ETS
Economic Principles
The EU Emissions Trading Scheme, which came into full force in January 2008 following a three-year Pilot Phase, places a cap on the aggregate annual emissions of circa 11,500 installations above 20MW thermal rating, or operating in specified industry sectors. It requires such installations to surrender EU Allowances (EUAs) for every Tonne of the greenhouse gas CO2 emitted in each calendar year of the Second Trading Period (2008-12). These EUAs are issued by individual Member States in accordance with published National Allocation Plans (NAPs).
The obligation to surrender tradable emissions permits provides a financial incentive for installations to undertake abatement projects whose marginal cost per avoided Tonne of CO2 is below the current or expected EUA market price. In turn, the market price is driven by the need for the Trading Sector (in aggregate) to achieve a level of emissions reduction which is sufficient to equalise the overall supply and expected demand for allowances over the relevant Trading Period.
In theory, the same abatement incentive should exist for each individual installation, regardless of whether it already holds sufficient allowances for the Business As Usual (BAU) requirement. By reducing emissions, such installations can either reduce their purchases, or generate a surplus of EUAs which can be sold into the marketplace. The

27
‘opportunity cost’ argument partly explains why the European Commission agreed that at least 90% of allowances in the Second Trading Period should be allocated to participating installations free of charge. This was viewed as helping to make the EU ETS more acceptable to participants without undermining its environmental effectiveness.
To the extent that an installation’s cash cost of EUA purchases (or its opportunity cost of CO2 emissions) is passed on to customers by means of higher product prices, a second effect is also observed, whereby customers consume less of the product, and may eventually switch to using alternative (less CO2-intensive) goods.
EU Allowance prices
The market price of EUAs in the First Trading Period climbed from circa €7 per Tonne in January 2005 to a peak of €30 in March 2006, but subsequently collapsed when new information released by the European Commission indicated that there had been an overly generous allocation of allowances to the Trading Sector32. In an attempt to reduce the risk of a similar over-allocation in the Second Trading Period, the European Commission imposed of 6.5% average downward adjustment of the allocations initially proposed by Member States for the Second Trading Period. This appears to have been successful in that the forward prices of EUAs for the Second Trading Period decoupled from spot prices of those for the First Trading Period. The price of 2008 vintage allowances, for example, ranged between €20 and €24 per Tonne during the final six months of 2007. The daily closing spot prices as reported by Point Carbon during the early months of 2008 show a similar pattern.
Appendix 2. Calibration of the Base Case parameters.
Let Q*i and p*i respectively refer to the total consumption and equilibrium price observed in market i. The parameter ε denotes the price elasticity of demand for cement, assumed to be the same in both regional markets.
From Section 4.2, the parameters ai and bi are obtained as:
bi = - p*i / εQ*i
ai = p*i + biQ*i
Let π ti be firm gross margin of a firm of type t on market i and q ti be its production quantity sold into that market. From the Cournot assumption we have, for all t and i, the first order condition δπ ti /δq ti = 0.
These equations can be used to derive a unique virtual market structure. Consider the number of importers (type 1 firms). On the coastal market (market 2) we have: 32 EUAs for the First Trading Period could not be ‘banked’ for use in the Second Trading Period. Therefore, as it became increasing clear that the aggregate allocation of free allowances for 2005-07 exceeded BAU emissions, the market price of allowances progressively reduced towards zero.
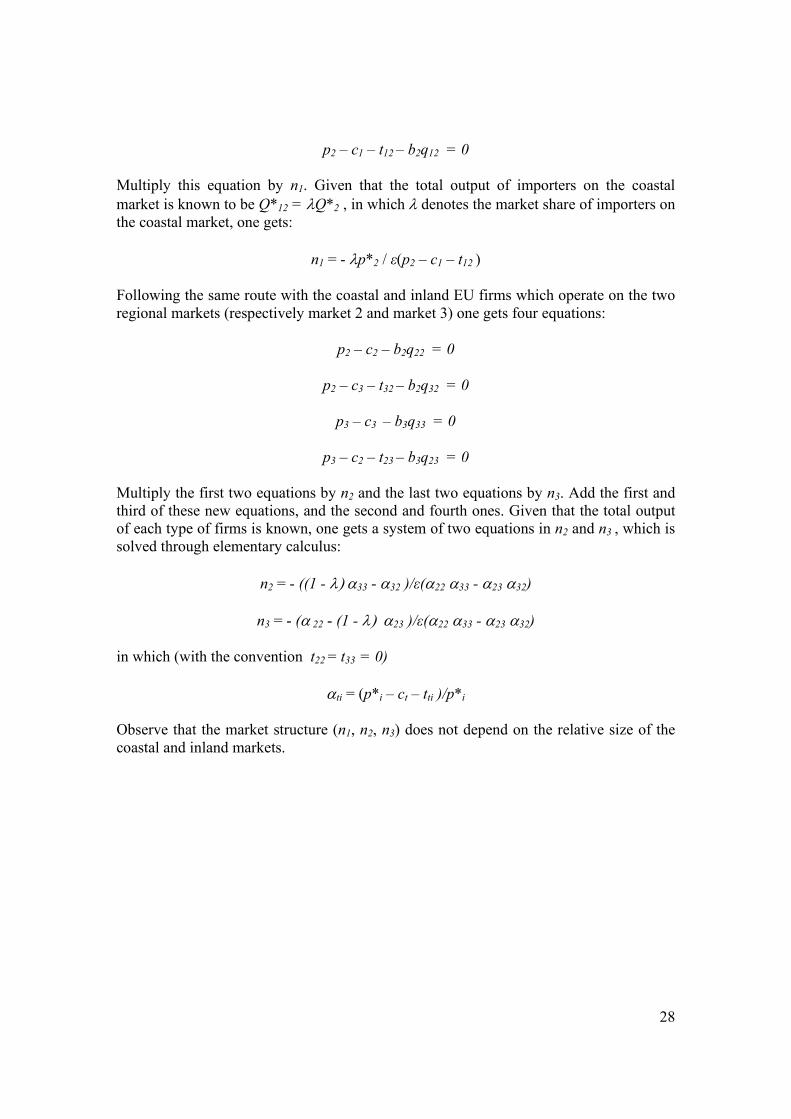
28
p2 – c1 – t12 – b2q12 = 0
Multiply this equation by n1. Given that the total output of importers on the coastal market is known to be Q*12 = λQ*2 , in which λ denotes the market share of importers on the coastal market, one gets:
n1 = - λp*2 / ε(p2 – c1 – t12 )
Following the same route with the coastal and inland EU firms which operate on the two regional markets (respectively market 2 and market 3) one gets four equations:
p2 – c2 – b2q22 = 0
p2 – c3 – t32 – b2q32 = 0
p3 – c3 – b3q33 = 0
p3 – c2 – t23 – b3q23 = 0
Multiply the first two equations by n2 and the last two equations by n3. Add the first and third of these new equations, and the second and fourth ones. Given that the total output of each type of firms is known, one gets a system of two equations in n2 and n3 , which is solved through elementary calculus:
n2 = - ((1 - λ) α33 - α32 )/ε(α22 α33 - α23 α32)
n3 = - (α 22 - (1 - λ) α23 )/ε(α22 α33 - α23 α32)
in which (with the convention t22 = t33 = 0)
αti = (p*i – ct – tti )/p*i
Observe that the market structure (n1, n2, n3) does not depend on the relative size of the coastal and inland markets.

29
Table 1. Spatial Distribution of Cement Demand and Production Capacity in 2006.
Country Cement consumption
Million Tonnes
Ratio of consumption to kiln capacity
Proportion of national consumption in coastal region
Proportion of national capacity in coastal region
Market share of non-EU imports
Spain
Italy
Germany
France
UK
55.7
45.5
27.8
24.1
14.0
135%
88%
62%
104%
103%
64%
77%
7%
46%
100%
57%
67%
5%
48%
100%
20%
9%
0%
6%
1%
Sources: Cembureau and Eurostat. http://epp.eurostat.ec.europa.eu/portal/page?_pageid=1996,39140985&_dad=portal&_schema=PORTAL&screen=detailref&language=en&product=Yearlies_new_regio&root=Yearlies_new_regio/F/fa/faa/faa10000
Table 2. Freight rates for bulk cargoes routed N. Africa to NW Europe.
Period Freight Rate Comment
2001/02
2002/03
2003/04
2004/05
2005/06
2006/07
Average
€21/Tonne
€24/Tonne
€21/Tonne
€32/Tonne
€27/Tonne
€24/Tonne
€25/Tonne
Prices are for 3000-5000 Tonne cargoes.
Figures exclude port charges, which are
typically €9/Tonne (of which €4/Tonne is for loading and €5 is for discharge.
Source: personal communication with fertilizer industry representative.

30
Table 3. Specified cost/price parameters and inferred trade pattern in Base Case.
EUA price €0 €20 €50Region Coast Inland Total Coast Inland Total Coast Inland TotalMarket price €65.06 €76.16 €74.40 €86.71 €86.59 €100.71
Marginal cost of non-EU plants €49.00 €81.00 €49.00 €81.00 €49.00 €81.00Marginal cost of coastal plants €25.00 €57.00 €39.00 €71.00 €60.00 €92.00Marginal cost of inland plants €57.00 €25.00 €71.00 €39.00 €92.00 €60.00
Non-EU producers active in region 3 0 3 3 3 3Coastal producers active in region 4 4 4 4 4 4Inland producers active in region 4 4 4 4 0 4
Market share - coastal producers 67% 27% 61% 23% 49% 14%Market share - inland producers 13% 73% 6% 70% 0% 63%Import rate 20% 0% 33% 6% 51% 23%
100% 100% 100% 100% 100% 100%
Change in regional consumption % -3.9% -3.7% -8.9% -8.7%
EU product consumed 8.96 11.20 20.16 7.22 10.10 17.32 4.95 7.87 12.82Non-EU product consumed 2.24 0.00 2.24 3.55 0.68 4.23 5.25 2.35 7.60Total consumed Million Te 11.20 11.20 22.40 10.77 10.78 21.55 10.20 10.23 20.42
Implied Carbon Leakage rate 70% 73%

31
Table 4. Gross profits and pass-through rates under Base Case and Multi-plant scenarios
EU Allowance price€ 0 € 20 € 50
Coastal 360 276 144Inland 432 368 268Total EU firms 792 644 412
Coastal 365 258 133Inland 629 496 326Total EU firms 994 754 459
Coastal (unconstrained) 218 141 66Coastal (constrained) 144 116 66Coastal (combined) 362 258 133Inland 628 496 326Total EU firms 990 753 459
Base case Coastal 67% 62%Inland 75% 70%Coastal 50% 50%Inland 50% 50%Coastal 33% 38%Inland 50% 50%
€ Million Gross profits: Base case
€ Million gross profits: Multi-plant
unconstrained
EU Allowance cost pass -through rates
Multi-plant unconstrained
Multi-plant constrained
€ Million gross profits: Multi-plant
constrained

32
Figure 1. Simplified Mass Balance for Portland Cement production.
Fuel + Air Gypsum, Slag, Limestone additions
0.2 Tonnes
Raw materials Clinker CEM II Cement
1.1 Tonnes 0.8 Tonnes 1.0 Tonnes
Fuel-derived CO2
0.28 Tonnes
Process-derived CO2
0.42 Tonnes
emissions

33
Figure 2. Producer Price Trends for Selected EU countries.
0
20
40
60
80
100
120
1995
1996
1997
1998
1999
2000
2001
2002
2003
2004
2005
2006
Euro
per
Ton
ne FranceGermanyItalyUKSpain
Source: Eurostat Production database DS-043408
Product code 26511230 (Gray Portland Cement including blends)

34
Figure 3. Portland Cement Imports to EU15 from Non-EU Sources.
0.0
1.0
2.0
3.0
4.0
5.0
6.0
1995 1996 1997 1998 1999 2000 2001 2002 2003 2004 2005 2006
Mill
ion
Tonn
es
TurkeyRussiaCroatiaTunisiaEgyptThailandSouth AfricaRomaniaIndiaChinaBulgaria
Source: Eurostat

35
Figure 4. Clinker Imports to EU15 from Non-EU Sources.
0.0
2.0
4.0
6.0
8.0
10.0
12.0
1995 1996 1997 1998 1999 2000 2001 2002 2003 2004 2005 2006
Mill
ion
Tonn
es
ChinaEgyptThailandTurkeyVenezuelaIsraelCroatiaBulgariaIndiaMoroccoTunisiaSaudi ArabiaRomaniaJapan
Source: Eurostat

36
Figure 5. Long haul bulk cargo freight rates.
Source: Bloomberg
0
2000
4000
6000
8000
10000
12000
Jan-95 Jan-96 Jan-97 Jan-98 Jan-99 Jan-00 Jan-01 Jan-02 Jan-03 Jan-04 Jan-05 Jan-06 Jan-07
BD
I val
ue
0
10
20
30
40
50
60
70
Frei
ght c
ost U
S$/T
onne
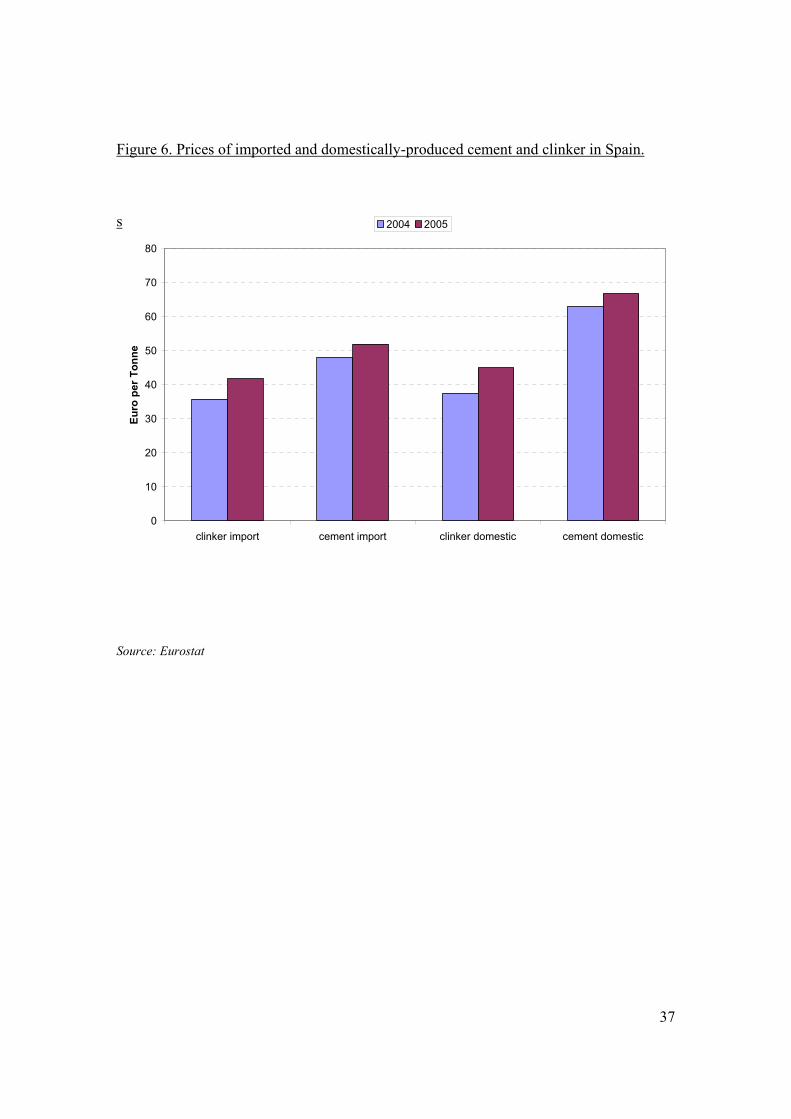
37
Figure 6. Prices of imported and domestically-produced cement and clinker in Spain.
s
Source: Eurostat
0
10
20
30
40
50
60
70
80
clinker import cement import clinker domestic cement domestic
Euro
per
Ton
ne
2004 2005

38
Figure 7. Intra EU15 Monthly Cement prices and Marginal Production Costs.
Source: Eurostat (cement and energy unit costs) and Point Carbon (EUA unit costs)
Pass-through rate appears very low if it is assumed that the marginal cost per emitted Tonne of CO2 is 0.7xEUA price