CH4 EMISSIONS FROM ENTERIC FERMENTATION · also known as enteric fermentation, produces methane as...
24
Good Practice Guidance and Uncertainty Management in National Greenhouse Gas Inventories CH 4 Emissions from Enteric Fermentation 297 CH 4 EMISSIONS FROM ENTERIC FERMENTATION A CKNOWLEDGEMENTS This paper was written by Michael J. Gibbs and David Conneely (ICF Incorporated), Don Johnson (Colorado State University), Keith R. Lasse (National Institute of Water and Atmospheric Research, New Zealand), and M. J. Ulyatt (New Zealand Pastoral Agriculture Research Institute). ABSTRACT Livestock are produced throughout the world, and are a significant source of global methane (CH 4 ) emissions. The amount of methane emitted is driven primarily by the number of animals, the type of digestive system, and the type and amount of feed consumed. The Revised 1996 IPCC Guidelines for National Greenhouse Gas Inventories (IPCC Guidelines) recommend that CH 4 emissions from enteric fermentation be estimated by multiplying the number of animals for each animal type by an appropriate emissions factor. The IPCC Guidelines recommend two general methods to estimating emissions factors. The Tier 1 method involves using default emissions factors, while the Tier 2 method involves using country-specific information to calculate the emissions factors. The Tier 2 method is more accurate than the Tier 1 method because it incorporates country-specific information. The Tier 2 method is recommended to estimate methane emissions for countries with large cattle or sheep populations. The key challenge to using the Tier 2 method lies in data collection. Generally, collecting data for Tier 2 requires a high level of effort. Below is a description of the data needed for Tier 1 and Tier 2. Tier 1 To estimate emissions using Tier 1 method, data on the number of animals for each livestock group are needed. These data are generally collected by the ministries of agriculture or related bodies. If data are not available from in-country sources, they are available through the Food and Agriculture Organization (FAO, 1999). Tier 2 To estimate emissions using Tier 2 method, the following data are needed: • Animal Population Data. Data on the number of animals for each livestock group are needed. As mentioned previously, the data are generally available. If not, data are available through the FAO. • Animal and Feed Characteristics Data. The Tier 2 method requires country-specific data on animal and feed characteristics. Generally, the data on animal and feed characteristics can be collected in two ways. The recommended method is to have a government organization, such as the ministry of agriculture or a related body, collect representative field data. However, this requires a high level of effort. Alternatively, data may be collected by interviewing key industry and university experts. However, data collected from interviews are generally less reliable. Quality assurance (QA) and quality control (QC) activities need to occur at several steps in the emission estimation process. Key activities include internal quality control of the animal population, animal characteristics, and feed characteristics data, as well as documenting transparently the data and methods for reviewers. The inventory agency must ensure the accuracy of the activity data and emissions factors calculations as well as the compiled inventory. It is also responsible for providing documentation and sufficient information to the United Nations Framework Convention on Climate Change (UNFCCC). One or more types of external review may also be appropriate.
Transcript of CH4 EMISSIONS FROM ENTERIC FERMENTATION · also known as enteric fermentation, produces methane as...

Good Practice Guidance and Uncertainty Management in National Greenhouse Gas Inventories
CH4 Emissions from Enteric Fermentation 297
CH4 EMISSIONS FROM ENTERIC FERMENTATION ACKNOWLEDGEMENTS This paper was written by Michael J. Gibbs and David Conneely (ICF Incorporated), Don Johnson (Colorado State University), Keith R. Lasse (National Institute of Water and Atmospheric Research, New Zealand), and M. J. Ulyatt (New Zealand Pastoral Agriculture Research Institute).
A B S T R A C T Livestock are produced throughout the world, and are a significant source of global methane (CH4) emissions. The amount of methane emitted is driven primarily by the number of animals, the type of digestive system, and the type and amount of feed consumed. The Revised 1996 IPCC Guidelines for National Greenhouse Gas Inventories (IPCC Guidelines) recommend that CH4 emissions from enteric fermentation be estimated by multiplying the number of animals for each animal type by an appropriate emissions factor.
The IPCC Guidelines recommend two general methods to estimating emissions factors. The Tier 1 method involves using default emissions factors, while the Tier 2 method involves using country-specific information to calculate the emissions factors. The Tier 2 method is more accurate than the Tier 1 method because it incorporates country-specific information. The Tier 2 method is recommended to estimate methane emissions for countries with large cattle or sheep populations. The key challenge to using the Tier 2 method lies in data collection. Generally, collecting data for Tier 2 requires a high level of effort. Below is a description of the data needed for Tier 1 and Tier 2.
Tier 1
To estimate emissions using Tier 1 method, data on the number of animals for each livestock group are needed. These data are generally collected by the ministries of agriculture or related bodies. If data are not available from in-country sources, they are available through the Food and Agriculture Organization (FAO, 1999).
Tier 2
To estimate emissions using Tier 2 method, the following data are needed:
• Animal Population Data. Data on the number of animals for each livestock group are needed. As mentioned previously, the data are generally available. If not, data are available through the FAO.
• Animal and Feed Characteristics Data. The Tier 2 method requires country-specific data on animal and feed characteristics. Generally, the data on animal and feed characteristics can be collected in two ways. The recommended method is to have a government organization, such as the ministry of agriculture or a related body, collect representative field data. However, this requires a high level of effort. Alternatively, data may be collected by interviewing key industry and university experts. However, data collected from interviews are generally less reliable.
Quality assurance (QA) and quality control (QC) activities need to occur at several steps in the emission estimation process. Key activities include internal quality control of the animal population, animal characteristics, and feed characteristics data, as well as documenting transparently the data and methods for reviewers. The inventory agency must ensure the accuracy of the activity data and emissions factors calculations as well as the compiled inventory. It is also responsible for providing documentation and sufficient information to the United Nations Framework Convention on Climate Change (UNFCCC). One or more types of external review may also be appropriate.

Background Paper
Agricultural Sector 298
1 I N T R O D U C T I O N
1 . 1 N a t u r e , ma g ni t u d e , a n d d i s t r i b u t io n o f so u r c e Overview of Emissions from Enteric Fermentation Livestock are produced throughout the world, and are an important agricultural product in virtually every country. Methane is emitted as a by-product of the normal livestock digestive process, in which microbes resident in the animal’s digestive system ferment the feed consumed by the animal. This fermentation process, also known as enteric fermentation, produces methane as a by-product. The methane is then eructated or exhaled by the animal. Within livestock, ruminant livestock (cattle, buffalo, sheep, and goats) are the primary source of emissions. Other livestock (swine and horses) are of lesser importance for nearly all countries. The number of animals and the type and amount of feed consumed are the primary drivers affecting emissions. Consequently, improvements in management practices and changes in demand for livestock products (mainly meat and dairy products) will affect future methane emissions.
India has the largest livestock population, followed by Brazil, the US, and China (FAO, 1999). Industry restructuring is affecting livestock production and methane emissions in a variety of countries. For example, livestock industries in many developed countries are undergoing significant restructuring, particularly in Western Europe, the US and Australia, where governments are reducing financial supports on livestock production. Also, Eastern European countries are experiencing significant reductions in livestock production as part of the restructuring of their economies.
Process Description Ruminant animals are the principal source of emissions because they produce the most methane per unit of feed consumed. What makes ruminant animals unique is their “fore-stomach” or rumen, a large, muscular organ. The rumen is characterized as a large fermentation vat where approximately 200 species and strains of micro organisms are present. The microbes ferment the plant material consumed by the animal through a process known as enteric fermentation. The products of this fermentation provide the animal with the nutrients it needs to survive, enabling ruminant animals to subsist on coarse plant material. Methane is produced as a by product of the fermentation and is expelled.
“Monogastric” animals produce small amounts of methane as the result of incidental fermentation that takes place during the digestion process. “Non-ruminant herbivores” produce methane at a rate that is between monogastric and ruminant animals. Although these animals do not have a rumen, significant fermentation takes place in the large intestine, allowing significant digestion and use of plant material.
2 M E T H O D O L O G I C A L I S S U E S
2 . 1 S e l e c t io n o f go o d p r ac t i c e me t h o d s IPCC Guidelines provide a general approach to estimate CH4 emissions from livestock, in which the number of animals is multiplied by an emissions factor. Thus the basic formula is:
CH4 Emissions = Number of Animals ● CH4 Emissions Factor
The three main steps to estimate methane emissions for livestock are as follows: a) Collect animal population and animal characteristics data; b) Estimate the emissions factor for the animal type; and c) Multiply the emission factor estimate by the population to get the total methane emission estimate for the population. The first two steps can be completed at various levels of detail and complexity. IPCC recommends the following two approaches (IPCC, 1996):
Tier 1
The Tier 1 approach relies on default emissions factors. Only readily available data on the animal populations are needed for Tier 1. Uncertainty in the Tier 1 method is generally high because the emissions factors are not based on country-specific conditions.
Good Practice Guidance and Uncertainty Management in National Greenhouse Gas Inventories
CH4 Emissions from Enteric Fermentation 299
Tier 2
The Tier 2 approach is more complex than Tier 1 because it draws upon country-specific information on animal and feed characteristics. Tier 2 methods can be used to estimate methane emissions from cattle and sheep. . The Tier 2 approach is recommended to estimate methane emissions for countries with large cattle and sheep populations because cattle and sheep populations and management practices often vary significantly by country. Tier 2 is also recommended for countries with significant emissions from these sources.
2 . 2 E mi s s i o n fa c to r s The emissions factors are an estimate of the amount of methane produced (kg) per animal. Emission factors are based on animal and feed characteristics data. Specifically, the emissions factors are based on the average energy requirement of the animal, the average feed intake to satisfy the energy requirements, and the quality of the feed consumed. There are two methods by which to estimate emissions factors. The Tier 1 method relies on the default emissions factors in the IPCC Guidelines. These emissions factors are highly uncertain because they are not based on country-specific information. The Tier 2 method involves collecting data to calculate the emissions factor. By using the Tier 2 method, uncertainty in the emissions factors is generally lower because these emissions factors are based on country-specific conditions. The Tier 1 and Tier 2 methods are described below.
Tier 1
Tier 1 relies on default emission factors based on previous studies, and organized by region to facilitate use. The emissions factors for Tier 1 are based on the following:
• Feed Intake: The feed intake is estimated based on the energy requirements of the animal for maintenance (the basic metabolic functions needed to stay alive) and production, which includes growth, lactation, work, and gestation. The livestock characteristics used to estimate feed intake are based on country and regional studies, which include: population structure (portion of adults and young), weight, rate of weight gain, amount of work performed, portion of cows giving birth each year, and milk production per cow.
• Conversion of Feed Energy to Methane: The rate at which feed energy is converted to methane depends on the quality of the feed. Generally, low quality feeds have a higher rate of conversion than high quality feeds. Feed quality is assessed in terms of digestibility for each region.
IPCC Guidelines present default emissions factors for cattle and non-cattle. To account for the variation in cattle characteristics among regions, there are emissions factors for eight regions: North America, Western Europe, Eastern Europe, Oceania, Latin America, Asia, Africa and Middle East, and Indian Subcontinent. The emissions factors and a description for each region are presented in Annex 1.
Non-cattle livestock are responsible for a smaller portion of methane emissions from livestock. Consequently, there are emissions factors for two types of countries: developed and developing countries (Crutzen et. al., 1986). These emissions factors are presented in Annex 1(Table 7).
Tier 2
The Tier 2 emissions factors are based on country-specific data on nutrient requirements, feed intake, and the methane conversion rate for the specific feed type. For estimating emissions from cattle, IPCC recommends using the net energy system described in the National Research Council (NRC, 1984, 1989, and 1996). To estimate emissions from sheep, IPCC recommends using the energy system prepared by the UK Agricultural and Food Research Council (AFRC) Technical Committee on Responses to Nutrients (AFRC, 1993). The net energy system estimates metabolic requirements based on the following:
• Maintenance;
• Growth;
• Lactation;
• Pregnancy;
• Work (for cattle only), and
• Fleece production (for sheep only).
The equations used to estimate the metabolic requirements for cattle and sheep are presented in Annex 2 and Annex 3, respectively. To use Tier 2 successfully, detailed data on feed and animal characteristics are required to characterize the cattle and sheep populations. The availability of the necessary data limits the ability to use this detailed method.
Background Paper
Agricultural Sector 300
2 . 3 A c t i v i ty da t a Tier 1 requires data on the number of animals only, while Tier 2 requires data on the number of animals and on feed and animal characteristics. The feed and animal characteristics collected for Tier 2 are used to calculate the emissions factors (see equations in Annex 2 and Annex 3). The specific Tier 1 and Tier 2 methods are described below.
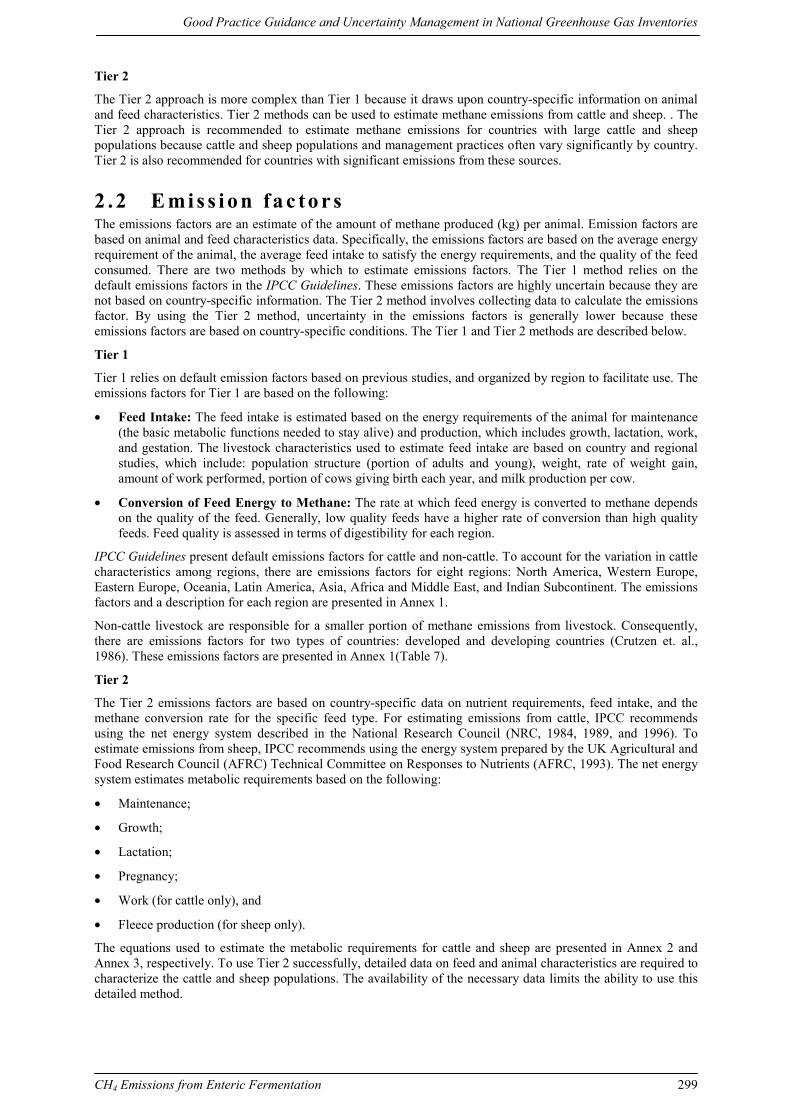
Tier 1 For Tier 1, countries are required to collect data on the average number of animals for each animal group presented in Table 1. It is recommended that countries collect their own population data. Care should be taken to record data that represent an average population estimate for the entire year. Because the number of animals recorded depends on the time at which the census is taken, adjustments may be required to produce an annual average. For example, a census taken before most calves are born yields a lower number of animals than the annual average.
TABLE 1
ANIMAL POPULATION DATA COLLECTED IN TIER 1
Livestock Population (number of head) Milk Production (kg/head/yr) Dairy Cows Average Annual Population Milk Production per Head
Non-Dairy Cattle Average Annual Population Not Applicable (NA)
Buffalo Average Annual Population (NA)
Sheep Average Annual Population (NA)
Goats Average Annual Population (NA)
Camels Average Annual Population (NA)
Horses Average Annual Population (NA)
Mules and Asses Average Annual Population (NA)
Swine Average Annual Population (NA)
Poultry Average Annual Population (NA) Data can be obtained from the FAO Production Yearbook, the FAO Statistical Database on the Internet, and country-specific livestock census reports. Source: IPCC (1996).
IPCC recommends recording data on dairy cows separate from other cattle. Dairy cows are defined as mature cows that have calved at least once and are being kept to produce milk.
In some countries, there are two types of dairy cows: high-producing, “improved” breeds in commercial operations and low-producing breeds managed with traditional methods. If possible, countries can separate the dairy cow population into two groups. The dairy cow group does not include cows used mainly for producing calves or for draft power. These cows are accounted for in non-dairy cattle.
Data on average milk production for dairy cows is also needed. Milk production data are expressed in terms of kilograms of whole milk produced per year per dairy cow1 and can be obtained from FAO or similar country reports. Average milk production per cow is required for each group if the dairy cow group is separated into one or more categories.
Tier 2
For Tier 2, countries are required to collect data on the population, animal characteristics, and feed characteristics for cattle and sheep.
The following information is required for the Tier 2 method:
• Animal Population (number of head). The annual average population for each animal type;
• Average Daily Feed Intake (megajoules (MJ) per day and kg per day of dry matter), and
• Methane Conversion Rate (percentage of feed energy converted to methane).
1 “Whole milk” refers to milk with 4% fat content, and is also referred to as 4% fat corrected milk (4%FCM).

Good Practice Guidance and Uncertainty Management in National Greenhouse Gas Inventories
CH4 Emissions from Enteric Fermentation 301
Population: When collecting cattle population data, IPCC recommends dividing the cattle population into the categories listed in Table 2.
TABLE 2
RECOMMENDED REPRESENTATIVE CATTLE TYPES
Main Categories Subcategories
Mature Dairy Cows Dairy Cows are defined as only cows that have calved at least once and are kept to produce milk.
Mature Non-Dairy Cattle Mature Females:
Beef Cows: used principally for producing beef steers and heifers
Multiple-use Cows: used for milk production, draft power, and other uses
Mature Males:
Breeding Bulls: used principally for breeding purposes
Draft Bullocks: used principally for draft power
Young Cattle Pre-Weaned Calves
Growing Heifers, Steers/Bullocks and Bulls
Feedlot-Fed Steers and Heifers on High-Grain Diets Source: IPCC (1996).
The cattle population in Table 2 is separated into homogeneous groups because the cattle in each group emit different amounts of methane from other cattle. If data are available, the population should be divided beyond the three main categories: Mature Dairy Cows, Mature Non-Dairy Cattle, and Young Cattle. In particular, the sub-population of cows supplying milk to calves is useful, because a significant amount of energy is needed for this purpose. In addition, the population of cattle in feedlots is useful to account for the high-grain diet fed in feedlots. The high quality, high-grain diets normally yield lower methane emissions per unit of feed consumed.
For sheep, the recommended approach is to disaggregate the national flock into groups presented in Table 3 according to animal class (breeding ewes, milking ewes, other adults greater than 1 year of age, weaned juveniles to 1-year of age), and to major pastureland or management class.
Average Daily Feed Intake: Data should be collected to estimate average daily feed intake because average daily feed intake data are generally unavailable. These data may be available through production and agricultural statistics sources. When collecting weight data, care should be taken to make sure that weight data is live weight data and not slaughter weight data. The following data are required:
• weight (kg);
• average weight gain (or loss) per day (kg);
• feeding situation: confined animals, animals grazing good quality pasture; and animals grazing over very large areas;
• milk production per day (kg/day);
• percentage of females that give birth in a year, and
• feed digestibility (percent).
TABLE 3
RECOMMENDED REPRESENTATIVE SHEEP TYPES
Mature Ewes Breeding Ewes
Milking Ewes
Other Mature Sheep Greater than 1 year of age
Young Sheep Weaned sheep less than 1 year of age
Background Paper
Agricultural Sector 302
Methane Conversion Rate: The rate at which feed energy is converted to methane depends on the quality of the feed. If methane conversion rates are unavailable, the following approach is recommended to estimate rates for cattle and sheep:
For cattle, use the following approach:
• Developed Countries: A 6 percent conversion rate (± 0.5 percent) is recommended for all cattle in developed countries, except feedlot cattle. A conversion rate of 4 percent (± 0.5 percent) is recommended for feedlot cattle. When good feed is available (i.e., high digestibility and high energy value) the lower bounds are used. When poorer feed is available, the higher bounds are more appropriate.
• Developing Countries: The following methods are recommended for estimating the methane conversion rates:
• The methane conversion rate for dairy cows and young cattle is 6 percent (± 0.5 percent). Dairy cows and young cattle are generally the best-fed cattle in the region.
• All Non-Dairy Cattle, other than young stall-fed animals, consuming low-quality crop by-products, are recommended to have a conversion rate of 7 percent (± 0.5 percent) because feed resources are particularly poor in many cases in these regions.
• Grazing cattle are recommended to have a conversion rate of 6 percent (±0.5 percent), except for grazing cattle in Africa, which are recommended to have a rate of 7 percent (±0.5 percent) because of the poor quality forage characteristics found in many parts of tropical Africa.
These general estimates are a rough guide based on the general feed characteristics and production practices found in many developed and developing countries. Country-specific data should be taken into consideration as necessary based on detailed data from cattle experts.
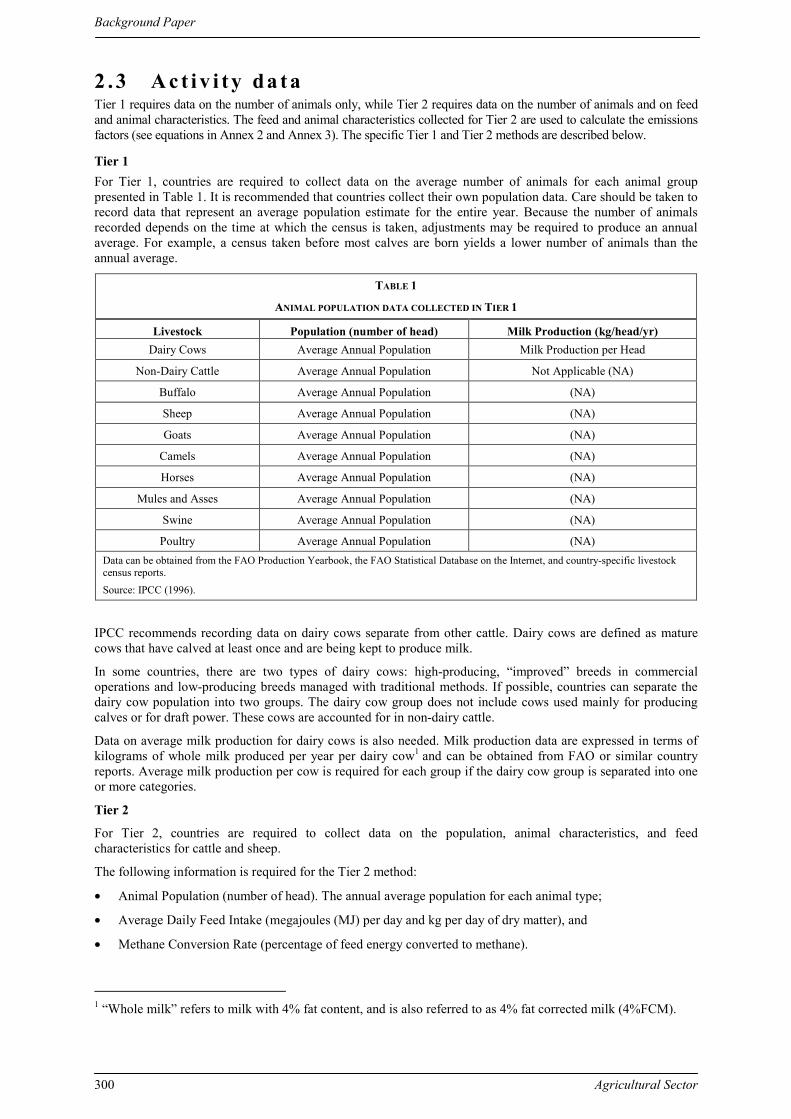
For sheep, Table 4 presents methane conversion rates according to feed quality (as measured by digestibility) and sheep maturity. They are based on data by Lassey et al. (1997), and on unpublished data from the same research group (K.R. Lassey and M.J. Ulyatt, personal communication):
TABLE 4
METHANE CONVERSION VALUES FOR SHEEP Low digestibility (<65%) High digestibility (>65%)
Lambs (<1 yr old) 5.5%–6.5% 4.5 %–5.5 %
Mature sheep Needs to be determined 6.0%–8.0%
It is recommended that the median of each range be adopted, including 7 percent for mature sheep on all pastures. These values are consistent with measurements by other researchers (Murray et al., 1978; Leuning et al., 1999).
2.3.1 Tier 2 data collection issues The greatest challenge to estimating emissions using the Tier 2 method is to collect the necessary animal and feed characteristics data. There are primarily two data collection methods: sampling and interviews. They are presented below.
Sampling Methods
Sampling methods generally involve collecting data on animal and feed characteristics in a statistically valid manner.
Farm Surveys: Generally, the most reliable method to collecting most of the data needed for Tier 2 is through surveying. To do this, the ministry of agriculture or a related body surveys a representative and random sample of the farmers. The primary challenge to performing a survey is lack of resources. Surveys require a high level of resources and often take a long time to complete, analyze, and report.
Feed and Forage Sampling: Governmental and non-governmental organizations often analyse the quality of feed and forage to assist farmers in creating the appropriate diets for their animals. The process generally involves collecting random and representative samples and then analysing them in a laboratory. If data are collected, the data are often stored in a database and published. The challenge to performing this work is that it requires a high level of effort.
Good Practice Guidance and Uncertainty Management in National Greenhouse Gas Inventories
CH4 Emissions from Enteric Fermentation 303
Interviews of Industry and Academic Experts
The alternative to surveying farmers is to perform interviews of key industry and academic experts. Generally, experts for each region and each segment of the industry are interviewed. The advantage of this method is that it requires fewer resources than performing a survey. However, this method is less reliable and repeatable.
2 . 4 U n c e r t a i n t y Parallel to the IPCC sector-specific meetings on good practice guidance, the IPCC is completing a programme of work on emissions inventory uncertainty. This work will result in recommendations to the UNFCCC on approaches to assessing and managing uncertainty. During the IPCC Inventory Experts Group Meeting in Paris (October 1998), technical experts in the uncertainty program developed a series of questions to be answered in the sector workshops. Specifically, the sector workshops should provide answers to these questions in the individual source context. The questions are listed in the general background paper. Below is a description of the major uncertainty issues for the Tier 1 and Tier 2 IPCC methodologies.
Tier 1
Given that the emissions factors for Tier 1 are not based on country-specific data, they may not represent accurately the livestock characteristics for each country. The emissions factors are highly uncertain as a result.
Tier 2
The primary source of uncertainty in the Tier 2 emissions factors is the livestock characteristics. The level of confidence in the livestock characteristics data depends on the methods used to collect the data for each country. The second source of uncertainty lies in the equations used to calculate the emissions factor (presented in Annex 2 and Annex 3). Generally, uncertainty in the equations is low compared to the uncertainty in the livestock characteristics data. Consequently, efforts undertaken to reduce uncertainty should focus first on improving livestock characteristics data.
2 . 5 C o mp l e t e n e s s Given that the different livestock species are distinct and population data are generally available, each country is expected to create a complete inventory comprised of emissions estimates for each required livestock species. if population data are unavailable, countries can use data collected by FAO (FAO, 1999)
2 . 6 O t h e r i mp o r t a n t i s s u es
2.6.1 Baseline An emission baseline is an important component of an inventory programme. Below is a description of issues related to creating a baseline for the Tier 1 and Tier 2 methods recommended by IPCC.
Tier 1
Developing a baseline for Tier 1 requires collecting and compiling animal population data during the baseline period. For the Tier 1 methodology, difficulties arise when:
• animal population data are not available for the baseline period;
• animal population data during the baseline period are not broken down into the animal groups recommended by IPCC, and
• over time, changes in livestock characteristics affect methane emissions.
Approaches to overcoming these include collecting aggregate historical data from FAO and using current data to break out historical population data into the animal groups. If changes in livestock characteristics affect methane emissions significantly, the Tier 1 method is unreliable, and the Tier 2 method should be used.
Tier 2
Developing a baseline for Tier 2 requires the collection and compilation of cattle and sheep population and animal and feed characteristics data during or following the baseline period. For the Tier 2 methodology, difficulties arise when:
• population data are not available for the baseline period;
Background Paper
Agricultural Sector 304
• population data during the baseline period are not broken down into the animal groups recommended by IPCC, and
• Estimation methods used during the baseline period differ from methods used after the baseline period. This occurs when:
(i) Tier 1 methods are used during the baseline period but Tier 2 methods are used after the baseline period; or
(ii) For Tier 2, methods used to collect animal and feed characteristics during the baseline period differ from methods used after the baseline period.
Approaches to overcoming these include collecting aggregate historical data from FAO and using current data to break out historical population data into the animal groups. If the estimation methods used during the baseline period differ from methods used after the baseline period, baseline and all post-baseline emissions should be estimated and reported using the new methodology. Generally, an appropriate method involves creating trends on animal and feed characteristics with data collected with the post-baseline methods. The trends can be used to back-estimate the animal and feed characteristics for the baseline and post-baseline periods. The estimated characteristics are then used to estimate baseline emissions.
2.6.2 Accounting for the effects of mitigation options The extent to which a national inventory is sensitive to the effects of mitigation efforts depends on the quality of the livestock characterization. A national inventory that is based on a well-characterized livestock industry is highly reliable and sensitive to efforts to mitigate methane emissions. In contrast, an inventory based on a poorly characterized livestock industry is not sensitive to mitigation efforts.
The level of effort needed to characterize the livestock industry depends on the size and diversity of the industry. If resources are limited, it is recommended that resources be allocated to the area of the livestock industry responsible for the greatest source of emissions and where mitigation efforts can have the greatest impact.
3 R E P O R T I N G A N D D O C U M E N T A T I O N A recent report from the UNFCCC Secretariat “Methodological Issues Identified While Processing Second National Communications” (UNFCCC/SBSTA/1998/7) noted that almost all countries reported methane emissions from enteric fermentation, and all countries, with the exception of two countries, reported emissions from enteric fermentation separate from manure. Specifically, Belgium included emissions from manure with emissions from enteric fermentation and Estonia reported methane emissions from all agriculture rather than separating each agricultural source (Estonia, 1998).
Reporting methods transparently is an important part of the inventory process. Towards this end, countries should indicate whether they use Tier 1 or Tier 2 methods to estimate emissions from cattle. In addition, it is important that all information used to estimate emissions be available either directly in National Communications or indirectly by citing other documents. For Tier 1 and Tier 2, countries should report the number of animals for each livestock group for which population data were collected. Countries should also report the source of the population data and describe the data collection methods. For Tier 2 only, countries should report the methods used to collect the necessary animal and feed characteristics data. It is also recommended that animal and feed characteristics be reported in either the National Communication or in another document cited in the National Communication.
3 . 1 C u r r e n t I P CC r e p o r t i n g g u i d e l in e s The IPCC Guidelines are used to guide countries in the preparation and submissions of annual greenhouse gas emissions inventories to the UNFCCC. The Guidelines establish:
• standard tables, definitions, units, and time intervals for reporting all types of emissions;
• necessary documentation to enable comparison of national inventories, including worksheets, major assumptions, methodological descriptions, and enough data to allow a third party to reconstruct the inventory from national activity data and assumptions, and
• an uncertainty assessment.
Good Practice Guidance and Uncertainty Management in National Greenhouse Gas Inventories
CH4 Emissions from Enteric Fermentation 305
CH4 emissions from livestock are reported in Table 4: Enteric Fermentation and Manure Management, which calls for entries for the number of animals for each animal group, emissions estimates for each animal group, and the emissions factor used to estimate emissions for each group.
3 . 2 C o n f i d en t i a l b u s i n es s i n f o rma t i o n In isolated cases, reporting population data and information on management practices may be a problem in regions with a small number of large, commercial operations. Confidentiality is not expected to be a significant issue for this source.
4 I N V E N T O R Y Q U A L I T Y
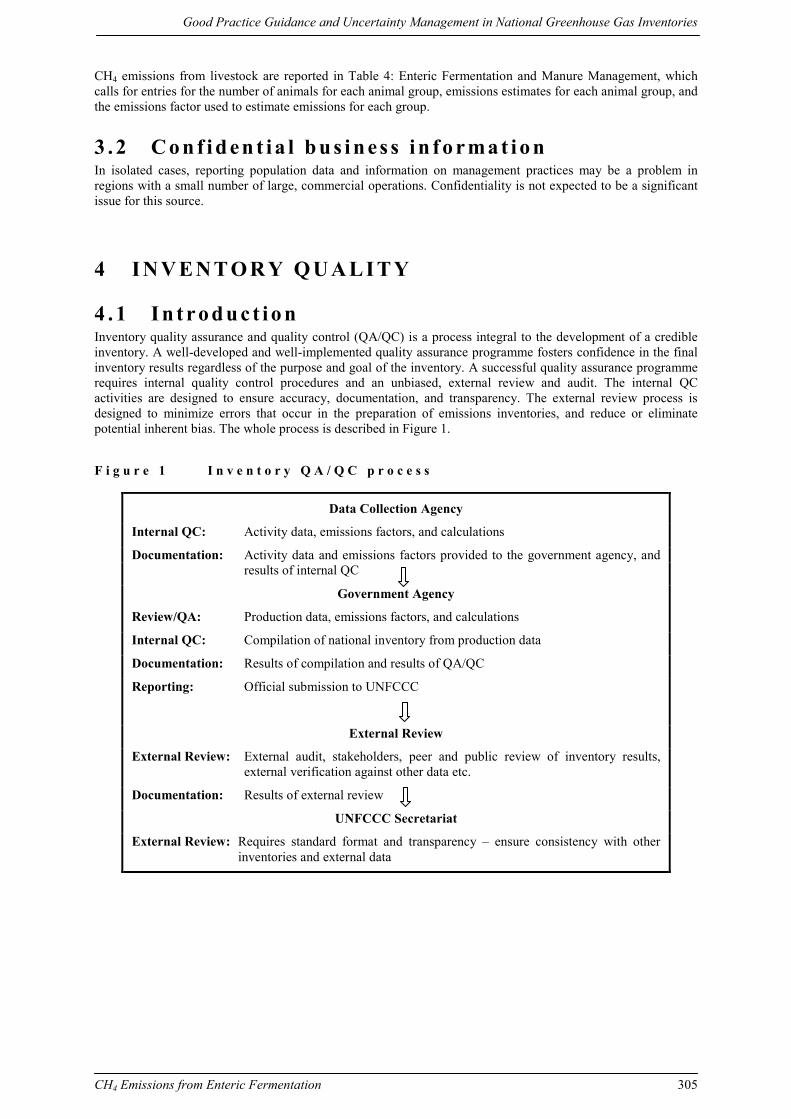
4 . 1 I n t r o d u c t i o n Inventory quality assurance and quality control (QA/QC) is a process integral to the development of a credible inventory. A well-developed and well-implemented quality assurance programme fosters confidence in the final inventory results regardless of the purpose and goal of the inventory. A successful quality assurance programme requires internal quality control procedures and an unbiased, external review and audit. The internal QC activities are designed to ensure accuracy, documentation, and transparency. The external review process is designed to minimize errors that occur in the preparation of emissions inventories, and reduce or eliminate potential inherent bias. The whole process is described in Figure 1.
F i g u r e 1 I n v e n t o r y Q A / Q C p r o c e s s
Data Collection Agency
Internal QC: Activity data, emissions factors, and calculations
Documentation: Activity data and emissions factors provided to the government agency, and results of internal QC
Government Agency
Review/QA: Production data, emissions factors, and calculations
Internal QC: Compilation of national inventory from production data
Documentation: Results of compilation and results of QA/QC
Reporting: Official submission to UNFCCC
External Review
External Review: External audit, stakeholders, peer and public review of inventory results, external verification against other data etc.
Documentation: Results of external review
UNFCCC Secretariat
External Review: Requires standard format and transparency – ensure consistency with other inventories and external data
Background Paper
Agricultural Sector 306
4 . 2 I n t e r na l i nv en t o ry QA / QC s ys t e ms
4.2.1 Emissions factors Emissions Factors QC Tier 1
The emissions factors are based on default data. QC procedures include reviewing the available default values and documenting the rationale for selecting specific values. Other QC procedures are not required.
Tier 2
QC procedures for the Tier 2 emissions factors involve checking the equations and calculations used to calculate the emissions factor. The Tier 2 emissions factors are based on country-specific information on animal and feed characteristics. QC procedures on these data are described below in the Activity Data section.
Emissions Factors Documentation Documentation is a crucial component of the review process because it enables reviewers to identify mistakes and suggest improvements. Among others, a detailed description of the equations used to estimate emissions factors is needed. In addition, a standardized reporting form is recommended to provide transparent information on the steps taken to calculate the emissions factor. Each step should contain the numbers used in each calculation, including the source of any data collected.
4.2.2 Activity data Activity Data QC Tier 1 and Tier 2
Livestock Population Data: The annual livestock population data are generally collected by a country’s ministry of agriculture or a similar organization focused on the agriculture sector. The data are generally not collected for greenhouse gas inventories. The personnel that collect data are responsible for reviewing the data collection methods, checking the data to ensure they were collected and aggregated correctly, and cross-checking the data with previous years to ensure the data are reasonable. In addition to a description of weak spots and suggestions for improvement, the basis for the estimates, whether statistical surveys or “desk estimates,” must be reviewed and described as part of the QC effort.
Tier 2
Animal and Feed Characteristics Data
There are generally two approaches to collecting animal and feed characteristics data: a) a government agency or related body collects the data by surveying farms; or b) the agency or related body interviews industry and university experts. The QC activities for the two approaches are described below:
• Farm Survey: Government agencies, such as the ministry of agriculture or a related body, collect the animal and feed characteristics data required for the inventory. The personnel collecting the data are responsible for reviewing the collection methods, checking to ensure that the data were collected and aggregated correctly, and comparing collected data with data from previous years to ensure the data are reasonable.
• Industry and University Experts: Animal and feed characteristics data may be obtained by interviewing industry and university livestock experts. The personnel collecting the data are responsible for reviewing surveys used to collect the data to make sure the survey is appropriate for the data needs. Questions used in interviews should also be reviewed. In addition, personnel are responsible for comparing data with historical animal characteristics to ensure the data are reasonable.
It is recommended that activity data QC take place annually. Even if data collection methods remain constant, it is important to assess annually whether the data collection methods, such as surveys and interviews, accurately represent the livestock industry.
Activity Data Documentation
Documentation is a crucial component of the review process, because it enables reviewers to identify mistakes and suggest improvements. Among others, the following information is needed by the reviewing/auditing agency:
• A highly detailed description of the methods used to collect the activity data, and
Good Practice Guidance and Uncertainty Management in National Greenhouse Gas Inventories
CH4 Emissions from Enteric Fermentation 307
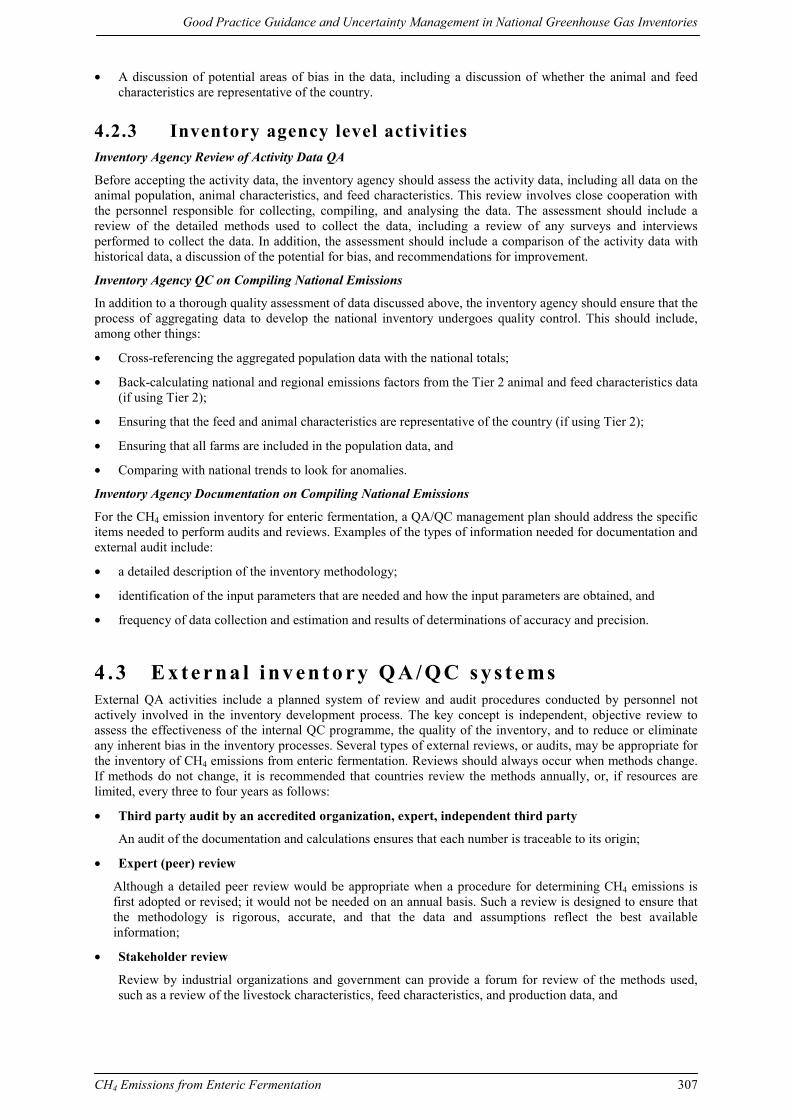
• A discussion of potential areas of bias in the data, including a discussion of whether the animal and feed characteristics are representative of the country.
4.2.3 Inventory agency level activities Inventory Agency Review of Activity Data QA
Before accepting the activity data, the inventory agency should assess the activity data, including all data on the animal population, animal characteristics, and feed characteristics. This review involves close cooperation with the personnel responsible for collecting, compiling, and analysing the data. The assessment should include a review of the detailed methods used to collect the data, including a review of any surveys and interviews performed to collect the data. In addition, the assessment should include a comparison of the activity data with historical data, a discussion of the potential for bias, and recommendations for improvement.
Inventory Agency QC on Compiling National Emissions
In addition to a thorough quality assessment of data discussed above, the inventory agency should ensure that the process of aggregating data to develop the national inventory undergoes quality control. This should include, among other things:
• Cross-referencing the aggregated population data with the national totals;
• Back-calculating national and regional emissions factors from the Tier 2 animal and feed characteristics data (if using Tier 2);
• Ensuring that the feed and animal characteristics are representative of the country (if using Tier 2);
• Ensuring that all farms are included in the population data, and
• Comparing with national trends to look for anomalies.
Inventory Agency Documentation on Compiling National Emissions
For the CH4 emission inventory for enteric fermentation, a QA/QC management plan should address the specific items needed to perform audits and reviews. Examples of the types of information needed for documentation and external audit include:
• a detailed description of the inventory methodology;
• identification of the input parameters that are needed and how the input parameters are obtained, and
• frequency of data collection and estimation and results of determinations of accuracy and precision.
4 . 3 E x t e r na l i nv en t o ry QA / QC s ys t e ms External QA activities include a planned system of review and audit procedures conducted by personnel not actively involved in the inventory development process. The key concept is independent, objective review to assess the effectiveness of the internal QC programme, the quality of the inventory, and to reduce or eliminate any inherent bias in the inventory processes. Several types of external reviews, or audits, may be appropriate for the inventory of CH4 emissions from enteric fermentation. Reviews should always occur when methods change. If methods do not change, it is recommended that countries review the methods annually, or, if resources are limited, every three to four years as follows:
• Third party audit by an accredited organization, expert, independent third party
An audit of the documentation and calculations ensures that each number is traceable to its origin;
• Expert (peer) review
Although a detailed peer review would be appropriate when a procedure for determining CH4 emissions is first adopted or revised; it would not be needed on an annual basis. Such a review is designed to ensure that the methodology is rigorous, accurate, and that the data and assumptions reflect the best available information;
• Stakeholder review
Review by industrial organizations and government can provide a forum for review of the methods used, such as a review of the livestock characteristics, feed characteristics, and production data, and
Background Paper
Agricultural Sector 308
• Public review
Some countries make their entire inventory available for public review and comment. This process may result in a range of comments and issues broader than those from other review processes.
Confidential Business Information (CBI) Issues
Confidentiality is not a major issue when private parties review the data. However, in areas with several large, commercial producers, there may be opposition to releasing the activity data to the public.
5 U P D A T E S T O E S T IM A TI ON M E T HOD S At the IPCC meeting held in the Netherlands on February 24-26, 1999, participants recommended updates to the Tier 2 method used to estimate methane emissions from livestock. The updates to the cattle method were recommended to improve the feed intake estimates. Additionally, a Tier 2 method for sheep was proposed. The updated methods for cattle and sheep are presented in Annex 2 and Annex 3, respectively. The following summarizes the updates to the cattle method.
Updated NEg equation
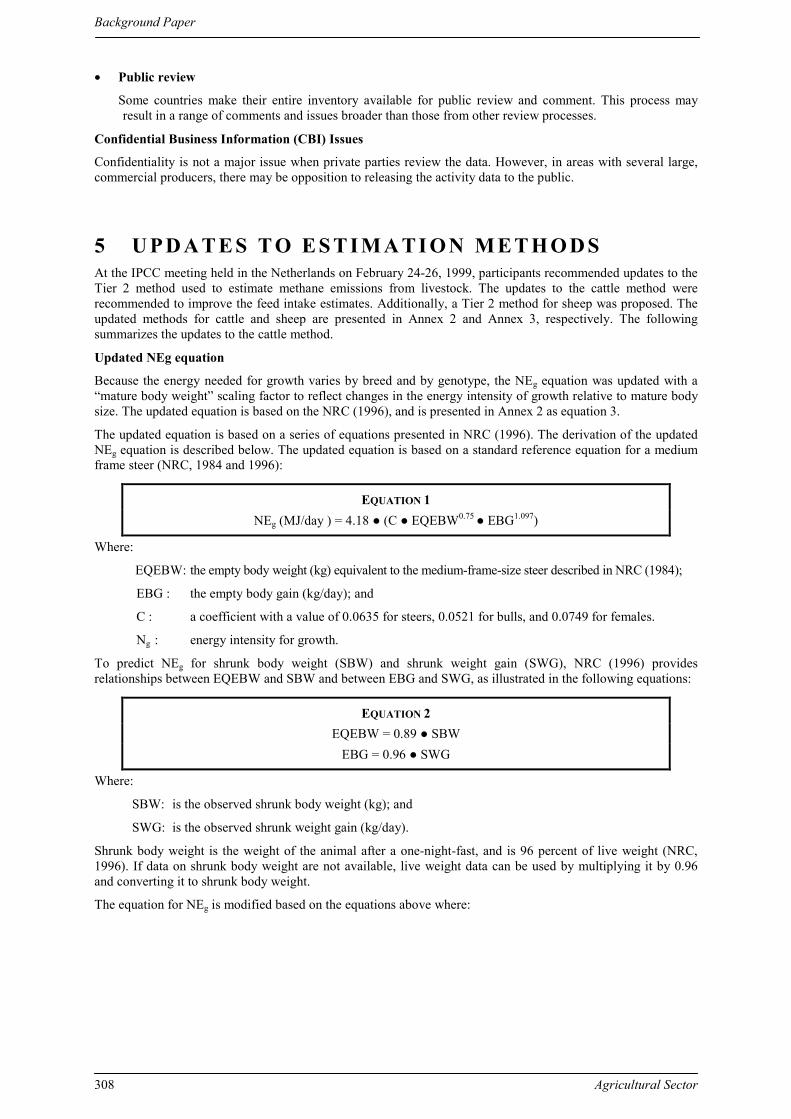
Because the energy needed for growth varies by breed and by genotype, the NEg equation was updated with a “mature body weight” scaling factor to reflect changes in the energy intensity of growth relative to mature body size. The updated equation is based on the NRC (1996), and is presented in Annex 2 as equation 3.
The updated equation is based on a series of equations presented in NRC (1996). The derivation of the updated NEg equation is described below. The updated equation is based on a standard reference equation for a medium frame steer (NRC, 1984 and 1996):
EQUATION 1 NEg (MJ/day ) = 4.18 ● (C ● EQEBW0.75 ● EBG1.097)
Where:
EQEBW: the empty body weight (kg) equivalent to the medium-frame-size steer described in NRC (1984);
EBG : the empty body gain (kg/day); and
C : a coefficient with a value of 0.0635 for steers, 0.0521 for bulls, and 0.0749 for females.
Ng : energy intensity for growth.
To predict NEg for shrunk body weight (SBW) and shrunk weight gain (SWG), NRC (1996) provides relationships between EQEBW and SBW and between EBG and SWG, as illustrated in the following equations:
EQUATION 2 EQEBW = 0.89 ● SBW
EBG = 0.96 ● SWG
Where:
SBW: is the observed shrunk body weight (kg); and
SWG: is the observed shrunk weight gain (kg/day).
Shrunk body weight is the weight of the animal after a one-night-fast, and is 96 percent of live weight (NRC, 1996). If data on shrunk body weight are not available, live weight data can be used by multiplying it by 0.96 and converting it to shrunk body weight.
The equation for NEg is modified based on the equations above where:

Good Practice Guidance and Uncertainty Management in National Greenhouse Gas Inventories
CH4 Emissions from Enteric Fermentation 309
EQUATION 3 NEg (MJ/day) = 4.18 ● {C ● (0.89 ● SBW)0.75 ● (0.96 ● SWG)1.097}
To predict NEg for all cattle types at different stages of growth, it is necessary to adjust the body weight of animals with different body sizes to a weight where they have a body fat composition equivalent to the reference medium frame steer from NRC (1984). This is illustrated in the following equation:
EQUATION 4 EQSBW = SBW ● (SRW/ (C ● FSBW))
Where:
EQSBW: the shrunk body weight (kg) equivalent to the medium-frame-size steer from NRC (1984);
SRW: the standard reference weight (kg) for the expected final body fat percentage (NRC, 1996);
C: a coefficient with a value of 1 for steers and replacement heifers, 0.8 for feedlot heifers, and 1.2 for bulls (NRC, 1996); and
FSBW: the observed final shrunk body weight (mature weight in kg) at average body condition (e.g., a body condition score of 5 on a scale of 1 to 10). FSBW is an observed value, and varies by breed, sex, and country. Because the FSBW varies by country, each country is responsible for estimating the average FSBW at average body condition for each breed by sex. Although data on FSBW are generally not published, estimates of FSBW for each breed by sex are generally available from livestock specialists and farmers.
The recommended SRW for the IPCC method is 478 kg at a body fat percentage of 27.8 percent (NRC, 1996), as presented below:
EQUATION 5 EQSBW = SBW (478/FSBW)
Combining the above equations results in the final equation for NEg:
EQUATION 6 NEg (MJ/day) = 4.18 ● {(0.0635 ● 478/(C ● FSBW)) 0.75 ● (0.96 ● SWG) 1.097}
Updated NE equation reflecting energy mobilized during weight loss Previously, the IPCC methods did not describe how to deal with energy allocation during animal weight loss. When an animal loses weight, a portion of the energy in the lost weight is mobilized as energy for maintenance, and the dietary NEm needed is reduced. Methods to calculate the amount of energy mobilized are now included in the IPCC methods and are presented in Annex 2.
Updated equations related to pregnancy
Participants at the IPCC meeting recommended that the origin of the equation for NEp with regard to its relationship to NEm should be summarized. A detailed description is provided in Annex 2. In addition, the equation used to calculate the NEp was updated in three ways. First, the NEm equivalent required for each kg of calf birth weight was updated from 28 MJ to 35 MJ. Second, the gestation period was increased from 281 days to 283 days to reflect the gestation period more accurately. Third, the energy required for pregnancy as a percentage of NEm was increased from 7 percent to 10 percent. The revised equation is presented in Annex 2.
Added factor for climate impacts on maintenance requirements
Participants at the IPCC meeting recommended that a climate factor be added to the method to reflect the impact of varying temperature and moisture conditions on net energy requirements. It was recommended that this factor be coordinated with the climate definitions used in the method used to calculate methane emissions from manure management. As of this writing, work is ongoing to add this element to this method.
Equations to estimate protein retention
The amount of protein consumed, retained and excreted by an animal is an important indicator for estimating nitrogen emissions from manure. Consequently, it was recommended that equations be incorporated into the IPCC methodology to estimate the amount of protein and nitrogen consumed, retained and lost in the form of milk, manure and urine. The equations are presented below in Table 5.

Background Paper
Agricultural Sector 310
TABLE 5
EQUATIONS TO CALCULATE PROTEIN AND NITROGEN CONTENT
Activity Equations to calculate protein (P) content Equations to calculate nitrogen (N) content
Diet Pdiet (kg/day) = (DMI (kg/day) ● CP (percent)) Ndiet (kg/day) = Pdiet /6.25
Gain1 Pgain (kg/day) = {SWG (268 – (29.4 ● (NEg/SWG))}/1000 Ngain (kg/day) = Pgain/6.25
Milk2 Pmilk (kg/day) = Milk (kg/day) ● (0.19 + (0.004 x %Fat)) Nmilk (kg/day) = Pmilk/6.38
Manure, urine
Pmanure,urine (kg/day) = (Pdiet – (Pgain + Pmilk)) Nmanure,urine (kg/day) = (Ndiet – (Ngain + Nmilk))
DMI = dry matter intake (kg/day); CP = crude protein (percent). Sources: 1NRC, 1984; 2NRC, 1989.
Other updates • {DE/NE} Linearization: Participants at the IPCC meeting recommended dropping the linearization of the
{DE/NE} functions for digestibility below 65%.
• New name for NEfeed: Participants decided to re-label the NEfeed value NEactivity because the NEactivity describes the energy function more accurately.
• Review of NEactivity equation: Participants also reviewed the NEactivity equation to ensure the percentages were derived correctly in the source material. After an initial review, it appears the percentages were derived correctly.
• New name for Dairy Cattle: The name “Dairy Cattle” was changed to “Dairy Cows”, and the definition was clarified as follows: Dairy cows are those mature cows that have calved at least once and are being kept for milk production.
6 C O N C L U S I O N S The IPCC Guidelines present two methods for estimating emissions. Tier 1 uses default emission factors, while the emission factors for Tier 2 are country- and possibly region- specific, and are based on the collection of extensive feed and diet characteristic data. Selection of methodology is based on a) availability of data, and b) quantity of emissions. Once the emissions estimation method has been established, proper reporting and documenting the methodology and all activity data must be undertaken. This documentation is particularly important for implementing the necessary quality assurance and quality control (QA/QC) checks. These QA/QC checks are an integral part of the inventory process. In particular, internal checks on animal population data, emission factors, and animal feed characteristic data are important. In addition, external audits of the activity data, the data collection methods, and the emission estimation methodology should be conducted. This external review helps eliminate errors and any possible bias that may develop.
R E F E R E N C E S Agricultural and Food Research Council (AFRC) Technical Committee on Responses to Nutrients. 1990.
Nutritive Requirements of Ruminant Animals: Energy. Rep. 5, CAB International, Wallingford, U.K.
AFRC Technical Committee on Responses to Nutrients. 1993. Energy and Protein Requirements of Ruminants. 24-159, CAB International, Wallingford, U.K.
Bamualim, A. and Kartiarso. 1985. “Nutrition of draught animals with special reference to Indonesia.” In: Draught Animal Power for Production. J.W. Copland (ed.). Australian Centre for International agricultural Research (ACIAR), Proceedings Series No. 10. ACIAR, Canberra, A.C.T., Australia.
Crutzen, P.J., I. Aselmann and W. Seiler. 1986. Methane Production by Domestic Animals, Wild Ruminants, Other Herbivorous Fauna, and Humans. Tellus. 38B, 271-284.
Estonia. 1998. Second National Report under the United Nation’s Framework Convention on Climate Change.
International Panel on Climate Change (IPCC). 1996. Revised 1996 IPCC Guidelines for National Greenhouse Gas Inventories: Reference Manual ). v.3.

Good Practice Guidance and Uncertainty Management in National Greenhouse Gas Inventories
CH4 Emissions from Enteric Fermentation 311
Food and Agriculture Organization (FAO). 1999. Statistical Database. << http://apps.fao.org/lim500/nph-wrap.pl?Production.Livestock.Stocks&Domain=SUA&servlet=1 >>
Ibrahim, M.N.M. 1985. “Nutritional status of draught animals in Sri Lanka.” In: Draught Animal Power for Production, J.W. Copland (ed.). ACIAR (Australian Centre for International Agricultural Research) Proceedings Series No. 10. ACIAR, Canberra, A.C.T., Australia.
Jenkins and Ferrell. 1997. Predicting empty body composition, and composition of empty body weight changes in mature cattle, Ag. Systems, 23, 1-25.
Jurgens, M. H. 1988. Animal Feeding and Nutrition, Sixth Edition, Kendall/Hunt Publishing Company, Dubuque, Iowa, U.S.A.
Lassey, K.R., M.J. Ulyatt, R.J. Martin, C.F. Walker, and I.D. Shelton. 1997. Methane emissions measured directly from grazing livestock in New Zealand, Atmos. Environ., 31, 2905-2914.
Lawrence, P.R. 1985. “A review of nutrient requirements of draught oxen.” In: Draught Animal Power for Production. J.W. Copland (ed.). ACIAR (Australian Centre for International Agricultural Research) Proceedings Series No. 10. ACIAR, Canberra, A.C.T., Australia.
Leuning, R., S.K. Baker, I.M. Jamie, C.H. Hsu, L. Klein, O.T. Denmead, and D.W.T. Griffith. 1999. Methane emission from free-ranging sheep: A comparison of two measurement methods, Atmos. Environ., 33, 1357-1365.
Murray, B.R., A.M. Bryant, and R.A. Leng. 1978. Methane production in the rumen and lower gut of sheep given lucerne chaff: effect of level of intake, Br. J. Nutr., 39, 337-345.
National Research Council (NRC). 1984. Nutrient Requirements of Beef Cattle, National Academy Press, Washington, D.C. U.S.A.
NRC. 1989. Nutrient Requirements of Dairy Cattle, National Academy Press, Washington, D.C. U.S.A.
NRC. 1996. Nutrient Requirements of Beef Cattle, National Academy Press, Washington, D.C. U.S.A.
Standing Committee on Agriculture (SCA). 1990. Feeding Standards for Australian Livestock: Ruminants, CSIRO Publications, East Melbourne, Australia.

Background Paper
Agricultural Sector 312
ANNEX 1 TIER 1 EMISSIONS FACTORS
TABLE 6
ENTERIC FERMENTATION EMISSION FACTORS FOR CATTLE
Regional Characteristics Cattle Type
Emissions Factor
kg/head/yr
Comments
Dairy 118 Average milk production of 6,700 kg/head/yr.
North America: Highly productive commercialized dairy sector feeding high quality forage and grain.. Separate beef cow herd, primarily grazing with feed supplements seasonally. Fast-growing beef steers/heifers finished in feedlots on grain. Dairy cows are a small part of the population.
Non-dairy 47 Includes beef cows, bulls, calves, growing steers/heifers, and feedlot cattle.
Dairy 100 Average milk production of 4,200 kg/head/yr.
Western Europe: Highly productive commercialized dairy sector feeding high quality forage and grain. Dairy cows also used for beef calf production. Very small beef cow herd. Minor amount of feedlot feeding with grains.
Non-dairy 48 Includes bulls, calves, and growing steers/heifers.
Dairy 81 Average milk production of 2,550 kg/head/yr.
Eastern Europe: Commercialized dairy sector feeding mostly forages. Separate beef cow herd, primarily grazing. Minor amount of feedlot feeding with grains.
Non-dairy 56 Includes beef cows, bulls, and young.
Dairy 68 Average milk production of 1,700 kg/head/yr.
Oceania: Commercialized dairy sector based on grazing. Separate beef cow herd, primarily grazing rangelands of widely varying quality. growing amount of feedlot feeding with grains. Dairy cows are a small part of the population.
Non-dairy 53 Includes beef cows, bulls, and young.
Dairy 57 Average milk production of 800 kg/head/yr.
Latin America: Commercialized dairy sector based on grazing. Separate beef cow herd grazing pastures and rangelands. Minor amount of feedlot feeding with grains. Growing non-dairy cattle comprise a large portion of the population..
Non-dairy 49 Includes beef cows, bulls, and young.
Dairy 56 Average milk production of 1,650 kg/head/yr.
Asia: Small commercialized dairy sector. Most cattle are multi-purpose providing draft power and some milk within farming regions. Small grazing population. Cattle of all types are smaller than those found in most other regions. Non-dairy 44 Includes multi-purpose
cows, bulls, and young.
Dairy 36 Average milk production of 475 kg/head/yr.
Africa and Middle East: Commercialized dairy sector based on grazing with low production per cow. Most cattle are multi-purpose, providing draft and some milk within farming regions. Some cattle graze over very large areas. Cattle of all types are smaller than those found in most other regions
Non-dairy 32 Includes multi-purpose cows, bulls, and young.
Dairy 46 Average milk production of 900 kg/head/yr.
Indian Subcontinent: Commercialized dairy sector based on crop by-product feeding with low production per cow. Most bullocks provide draft power and cows provide some milk in farming regions. Small grazing population. Cattle in this region are the smallest compared to cattle found in all other regions.
Non-dairy 25 Includes cows, bulls, and young. Young comprise a large portion of the population.
Source: IPCC (1996).
Good Practice Guidance and Uncertainty Management in National Greenhouse Gas Inventories
CH4 Emissions from Enteric Fermentation 313
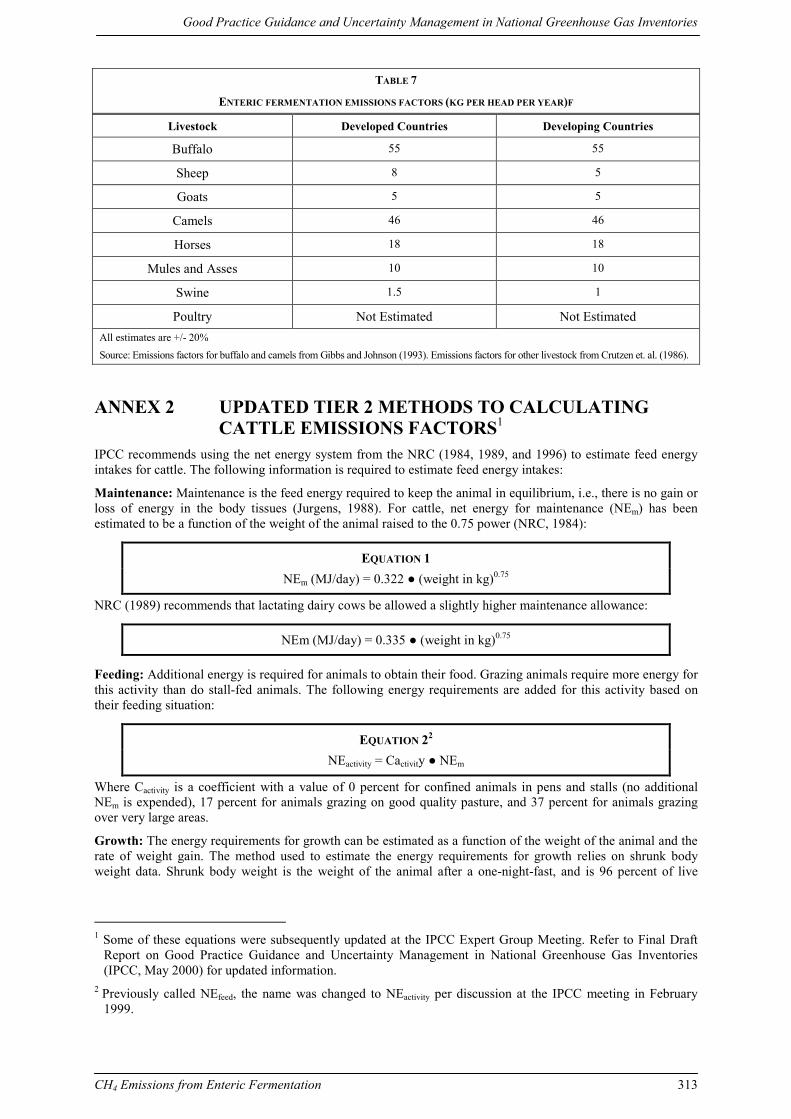
TABLE 7
ENTERIC FERMENTATION EMISSIONS FACTORS (KG PER HEAD PER YEAR)F
Livestock Developed Countries Developing Countries
Buffalo 55 55
Sheep 8 5
Goats 5 5
Camels 46 46
Horses 18 18
Mules and Asses 10 10
Swine 1.5 1
Poultry Not Estimated Not Estimated All estimates are +/- 20% Source: Emissions factors for buffalo and camels from Gibbs and Johnson (1993). Emissions factors for other livestock from Crutzen et. al. (1986).
ANNEX 2 UPDATED TIER 2 METHODS TO CALCULATING CATTLE EMISSIONS FACTORS1
IPCC recommends using the net energy system from the NRC (1984, 1989, and 1996) to estimate feed energy intakes for cattle. The following information is required to estimate feed energy intakes:
Maintenance: Maintenance is the feed energy required to keep the animal in equilibrium, i.e., there is no gain or loss of energy in the body tissues (Jurgens, 1988). For cattle, net energy for maintenance (NEm) has been estimated to be a function of the weight of the animal raised to the 0.75 power (NRC, 1984):
EQUATION 1 NEm (MJ/day) = 0.322 ● (weight in kg)0.75
NRC (1989) recommends that lactating dairy cows be allowed a slightly higher maintenance allowance:
NEm (MJ/day) = 0.335 ● (weight in kg)0.75
Feeding: Additional energy is required for animals to obtain their food. Grazing animals require more energy for this activity than do stall-fed animals. The following energy requirements are added for this activity based on their feeding situation:
EQUATION 22 NEactivity = Cactivity ● NEm
Where Cactivity is a coefficient with a value of 0 percent for confined animals in pens and stalls (no additional NEm is expended), 17 percent for animals grazing on good quality pasture, and 37 percent for animals grazing over very large areas.
Growth: The energy requirements for growth can be estimated as a function of the weight of the animal and the rate of weight gain. The method used to estimate the energy requirements for growth relies on shrunk body weight data. Shrunk body weight is the weight of the animal after a one-night-fast, and is 96 percent of live
1 Some of these equations were subsequently updated at the IPCC Expert Group Meeting. Refer to Final Draft
Report on Good Practice Guidance and Uncertainty Management in National Greenhouse Gas Inventories (IPCC, May 2000) for updated information.
2 Previously called NEfeed, the name was changed to NEactivity per discussion at the IPCC meeting in February 1999.

Background Paper
Agricultural Sector 314
weight (NRC, 1996). If data on shrunk body weight are not available, use live weight data and multiply it by 0.96 to convert it to shrunk body weight.
Based on the NRC (1996) formula for steer growth, the following equation is recommended:
EQATION 33
NEg (MJ/day) = 4.18 ● {(0.0635 ● 478/(C ● FSBW))0.75 ● (0.96 ● SWG)1.097}
Where:
C: a coefficient with a value of 1 for steers and replacement heifers, 0.8 for feedlot heifers, and 1.2 for bulls (NRC, 1996).
FSBW: the observed final shrunk body weight (mature weight in kg) at average body condition (e.g., a body condition score of 5 on a scale of 1 to 10). FSBW is an observed value, and varies by breed, sex, and country. Because the FSBW varies by country, each country is responsible for estimating the average FSBW at average body condition for each breed by sex. Although data on FSBW are generally not published, estimates of FSBW for each breed by sex are generally available from livestock specialists and farmers. Table 8 provides examples of mature weights for females illustrated by those used as standard reference weights in Australia (Subcommittee on Agriculture (SCA), 1990). Additional examples of mature weights are available in Jenkins and Ferrell (1997).
SWG: the observed shrunk weight gain (kg/day).
TABLE 8
EXAMPLES OF MATURE WEIGHTS AT 25 PERCENT BODY FAT FOR AUSTRALIAN FEMALE CATTLE
Cattle Breeds Females
Chianina 700
Charolais, Maine Anjou, Simmental 650
Angus, Blonde d’Aquitane, Brahman, Brahman x Hereford, Hereford, Murray Grey, Limousin, Lincoln Red, Friesian, South Devon
550
Beef Shorthorn, Dairy Shorthorn, Devon (Red), Galloway, Red Poll 500
Ayrshire, Guernsey, AMZ, Sahiwal 450
Jersey 400 Source: SCA (1990).
Weight Loss: When an animal loses weight, a portion of the energy in the lost weight is mobilized and used by the animal for maintenance.
For lactating dairy cows, approximately 19.7 MJ of NE is mobilized per kilogram of weight loss. Therefore, the energy mobilized is calculated as follows (NRC, 1989):
EQUATION 4
NEmobilized Lactating Dairy Cows (MJ/day) = 19.7 MJ/kg ● (weight lost in kg/day)
For other cattle, the amount of energy mobilized through weight loss is calculated by inserting the amount of weight lost (kg/day) as a positive number into Equation 3 as SWG, and calculating NEg. The mobilized energy is then 80 percent of this value with a negative sign (NRC, 1996):
EQUATION 5 NEmobilized = NEg ● -0.8
3 The equation for NEg is an updated equation that includes a mature weight scaling factor.
Good Practice Guidance and Uncertainty Management in National Greenhouse Gas Inventories
CH4 Emissions from Enteric Fermentation 315
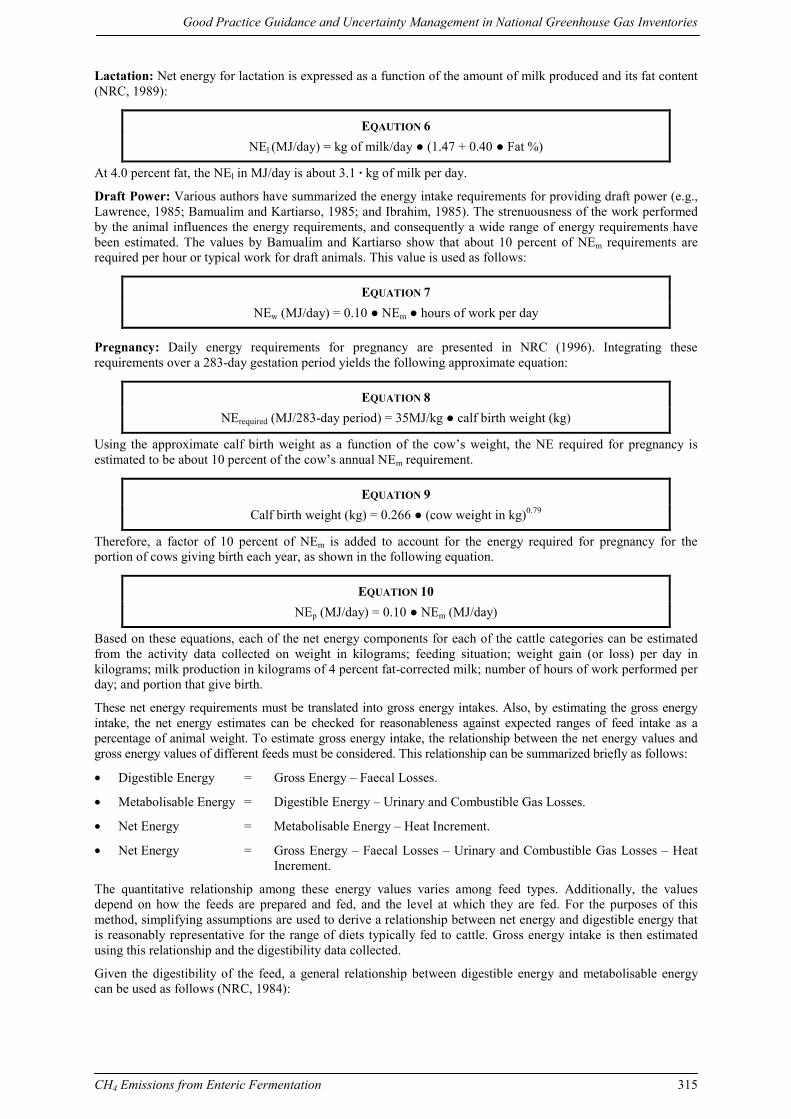
Lactation: Net energy for lactation is expressed as a function of the amount of milk produced and its fat content (NRC, 1989):
EQAUTION 6 NEl (MJ/day) = kg of milk/day ● (1.47 + 0.40 ● Fat %)
At 4.0 percent fat, the NEl in MJ/day is about 3.1 · kg of milk per day.
Draft Power: Various authors have summarized the energy intake requirements for providing draft power (e.g., Lawrence, 1985; Bamualim and Kartiarso, 1985; and Ibrahim, 1985). The strenuousness of the work performed by the animal influences the energy requirements, and consequently a wide range of energy requirements have been estimated. The values by Bamualim and Kartiarso show that about 10 percent of NEm requirements are required per hour or typical work for draft animals. This value is used as follows:
EQUATION 7 NEw (MJ/day) = 0.10 ● NEm ● hours of work per day
Pregnancy: Daily energy requirements for pregnancy are presented in NRC (1996). Integrating these requirements over a 283-day gestation period yields the following approximate equation:
EQUATION 8 NErequired (MJ/283-day period) = 35MJ/kg ● calf birth weight (kg)
Using the approximate calf birth weight as a function of the cow’s weight, the NE required for pregnancy is estimated to be about 10 percent of the cow’s annual NEm requirement.
EQUATION 9 Calf birth weight (kg) = 0.266 ● (cow weight in kg)0.79
Therefore, a factor of 10 percent of NEm is added to account for the energy required for pregnancy for the portion of cows giving birth each year, as shown in the following equation.
EQUATION 10 NEp (MJ/day) = 0.10 ● NEm (MJ/day)
Based on these equations, each of the net energy components for each of the cattle categories can be estimated from the activity data collected on weight in kilograms; feeding situation; weight gain (or loss) per day in kilograms; milk production in kilograms of 4 percent fat-corrected milk; number of hours of work performed per day; and portion that give birth.
These net energy requirements must be translated into gross energy intakes. Also, by estimating the gross energy intake, the net energy estimates can be checked for reasonableness against expected ranges of feed intake as a percentage of animal weight. To estimate gross energy intake, the relationship between the net energy values and gross energy values of different feeds must be considered. This relationship can be summarized briefly as follows:
• Digestible Energy = Gross Energy – Faecal Losses.
• Metabolisable Energy = Digestible Energy – Urinary and Combustible Gas Losses.
• Net Energy = Metabolisable Energy – Heat Increment.
• Net Energy = Gross Energy – Faecal Losses – Urinary and Combustible Gas Losses – Heat Increment.
The quantitative relationship among these energy values varies among feed types. Additionally, the values depend on how the feeds are prepared and fed, and the level at which they are fed. For the purposes of this method, simplifying assumptions are used to derive a relationship between net energy and digestible energy that is reasonably representative for the range of diets typically fed to cattle. Gross energy intake is then estimated using this relationship and the digestibility data collected.
Given the digestibility of the feed, a general relationship between digestible energy and metabolisable energy can be used as follows (NRC, 1984):

Background Paper
Agricultural Sector 316
EQUATION 11 Metabolisable Energy (ME) = 0.82 ● Digestible Energy (DE)
Equation 11 is a simplified relationship; larger (smaller) methane conversion rates would tend to reduce (increase) the coefficient to values below (above) 0.82.
NRC (1984) presents separate quantitative relationships between metabolisable energy and net energy used for growth versus net energy used for other functions. Using Equation 11, the NRC relationships can be re-arranged to quantify the ratio of NE to DE, as follows:
EQUATION 12 NE/DE = 1.123 – (4.092 ● 10-3 ● DE%) + (1.126 ● 10-5 ● (DE%)2) – 25.4/DE%
EQUATION 13 NEg/DE = 1.164 – (5.160 ●10-3 ● DE%) + (1.308 ● 10-5 ● (DE%)2) – 37.4/DE%
Where:
NE/DE: the ratio of net energy consumed for maintenance, lactation, work, and pregnancy to digestible energy consumed;
NEg/DE: the ratio of net energy consumed for growth to digestible energy consumed; and
DE%: digestible energy as percentage of gross energy, expressed in percent (e.g., 65%).
Given the estimates for feed digestibility and equations 12 and 13, the gross energy intake (GE in MJ/day) can be estimated as follows:
EQUATION 14 GE = {[(NEm + NEmobilized + NEactivity + NEl + NEw + NEp)/ (NE/DE)] + NEg/(NEg/DE)}
/ (DE%/100)
The proper interpretation of this equation used to estimate Gross Energy Intake (GE) in megajoules per day (MJ/day) is as follows:
• (NEm + NEmobilized + NEactivity + NEl + NEw + NEp) is the total net energy intake required for maintenance, feeding, lactation, work, and pregnancy.
• (NE/DE) is a function that relates NE intake for maintenance, feeding, lactation, work, and pregnancy to digestible energy intake. The total NE intake for these metabolic processes divided by this {NE/DE} function produces an estimate of digestible energy intake.
• NEg is the net energy intake required for growth.
• {NEg/DE} is a function that relates NE intake for growth to digestible energy intake. The NE intake for growth divided by this {NEg/DE} function produces an estimate of digestible energy intake.
The sum of the two numerator terms produces an estimate of total digestible energy intake. DE% is the digestibility of the feed in percent (e.g., 65%). Dividing the total digestible energy intake by DE%/100 produces an estimate of the total gross energy intake.
To check the estimate of daily gross energy intake from Equation 14, the estimate can be converted in daily intake in kilograms by dividing by 18.45 MJ/kg. This estimate of intake in kilograms should generally be between 1.5 percent and 3.0 percent of the animal’s weight.
To estimate the emission factor for each cattle type, the feed intake is multiplied by the methane conversion rate.
EQUATION 15 Emissions (kg/yr) = [Intake (MJ/day) ● Ym ● (365 days/yr)] / [55.65 MJ/kg of methane]

Good Practice Guidance and Uncertainty Management in National Greenhouse Gas Inventories
CH4 Emissions from Enteric Fermentation 317
ANNEX 3 UPDATED TIER 2 METHODS TO CALCULATING SHEEP EMISSIONS FACTORS1
The Tier 2 method to estimate methane emissions from sheep is based on the energy system from the AFRC (1993). The method is similar to the Tier 2 method for cattle emissions.
The AFRC approach associates different metabolic efficiencies with different NE components. However, these efficiencies differ significantly from that for maintenance only for growth (including fleece growth) and pregnancy, which requires some adjustment to the analogue of equation 14.
For simplicity, the methodology is described as if lambs were born following the commencement of the inventory-year (e.g., spring births during a mid-winter to mid-summer inventory year). In practice, as long as the demography of the national flock is reasonably stable, the timing within the inventory-year will be immaterial.
Note that methane is not produced from a milk diet, so that energy intake by very young lambs is not methane productive. However, as the lambs grow, pasture or other feed, which does produce methane upon fermentation, increasingly supplements their milk diet. To take this into account, an ‘effective weaning period’ could be defined as the time at which the lambs are dependent on milk for about half of their diet; this might typically be at 6–8 weeks of age. In converting the daily energy demand by lambs to annualized demand, only the portion of the year after this effective weaning period should be accounted for. In the algorithm below, we have referred to the ‘effective weaning’ time to take this into account.
Cited equation numbers are from cattle equations presented earlier in Annex 2.
Maintenance: The net energy demand of maintenance, including the energy costs of feeding and other activity is illustrated in the following equation:
EQUATION 1 NEm (MJ/day) = CF ● (weight in kg) 0.75
Where CF is a coefficient. AFRC recommends the value 0.236 for lambs to 1-year old, and 0.217 for older sheep, except that for entire males these values should be increased by 15%.
Feeding: The allowance for activity depends on the whether the sheep are housed, on the nature and quality of the pasture they graze, and on the terrain and distance they have to walk for feed, drink, and shelter. The activity allowance is taken as proportional to body weight:
EQUATION 2 NEactivity (MJ/day) = Cactivity ● (weight in kg)
Reasonable values for the coefficient Cacitivty (MJ/day/kg) can be developed from AFRC recommendations: 0.0090 for housed ewes; 0.0107 for sheep grazing flat pasture; 0.024 for sheep grazing hill country; 0.0067 for housed fattening lambs. The factor for housed ewes is deduced to take account of activity restricted by pregnancy during the final trimester (50 days). The activity allowance for grazing sheep is based on 1000 meters walking per day for flat pasture, or 5000 meters for hill pasture, selected as appropriate for good quality pasture; where feed, drink and shelter availability necessitates more walking, the Cactivity factor should be increased accordingly. No gender or age distinctions have been made in the activity allowance, other than through proportionality with bodyweight.
From the estimated daily NEm the annualized counterpart can be estimated, either through multiplication by 365 if the pastures or animal management do not change markedly throughout the year, or by reassessing the daily NEm separately by season and accumulating to an annualized NEm in MJ/yr.
Lamb growth: This section applies to immature sheep only. It is sufficient to restrict consideration of growth to the first year when lambs would have reached at least 80% of adult weight, or until they are slaughtered if this occurs within that year. Thus the weight gained is that between ‘effective weaning’ and the 1-year old (or slaughtered) weight. For all practical purposes, the 1-year old weight can be equated to the adult weight, as the over-estimated NE compensates for neglecting to allow for the NE required to grow from 1-year old to adult. The daily net energy requirement of growth can be written:
1 Some of these equations were subsequently updated at the IPCC Expert Group Meeting. Refer to Final Draft
Report on Good Practice Guidance and Uncertainty Management in National Greenhouse Gas Inventories (IPCC, May 2000) for updated information.

Background Paper
Agricultural Sector 318
EQUATION 3 NEg (MJ/day) = WG ● EVg
Where:
WG: the rate of live-weight gain (kg/day); and
EVg : the energy value of the weight gain (MJ/kg), which itself increases with bodyweight.
AFRC recommend that EVg be taken to increase linearly with bodyweight:
EQUATION 4 EVg = a + bW
with recommended parameters, a and b, given in the following table: Category a (MJ/kg) b (MJ/kg2)
Entire Males 2.5 0.35
Castrates 4.4 0.32
Females 2.1 0.45
Applying the above relationships to estimate annual demand is not straightforward because the daily energy demand due to growth increases steadily with weight. However, this difficulty can be circumvented through direct integration over the year, which leads to the following equation for the annualized net energy demand:
EQUATION 5 NEg (MJ/yr) = WG ● (a + 1/2b(BWi + BWf))
Where:
BWi: the bodyweight at ‘effective weaning’;
BWf: the bodyweight at 1-year old or at prior slaughter;
WG: Wf - Wi is the corresponding weight gain; and
a, b are as in the above table.
Lactation: There are two methods to estimating the net energy required for lactation (NEl). The first method is used when the amount of milk production is known, while the second method is used when the amount of milk production is not known. Generally, milk production is known for ewes kept for commercial milk production. For ewes that suckle their young to weaning, the milk production is not normally known.
Use the following equation when the amount of milk produced is known:
EQUATION 6 NEl (MJ/day) = kg of milk/day ● EVmilk
where EVmilk is close to 4.6 MJ/kg, according to AFRC, and this value can be adopted by default.
Use the following equation when the amount of milk produced is not known:
EQUATION 7 NEl (MJ/day) = 5 ● EVmilk ● WGlamb
where WG lamb is the weight gain of the lamb between birth and ‘effective weaning.
Note that the energy demands of lactation for even 2 months of suckling is around 4 times greater than the energy demand of pregnancy (taking account of metabolic efficiencies), and around 20% of the ewe’s maintenance demand.
AFRC (1990) indicate that for a single birth, the milk yield is about 5 times the growth rate of the lamb. With this assumption, the net energy demand of lactation, per lamb, can be expressed.
Good Practice Guidance and Uncertainty Management in National Greenhouse Gas Inventories
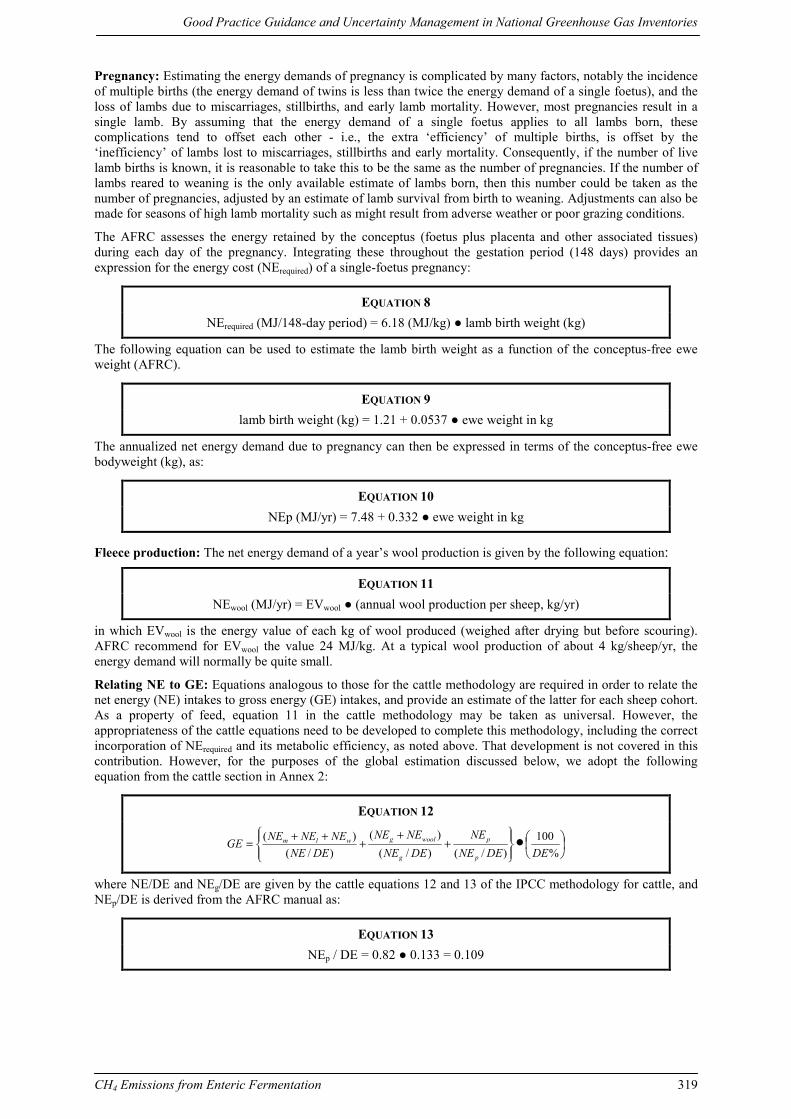
CH4 Emissions from Enteric Fermentation 319
Pregnancy: Estimating the energy demands of pregnancy is complicated by many factors, notably the incidence of multiple births (the energy demand of twins is less than twice the energy demand of a single foetus), and the loss of lambs due to miscarriages, stillbirths, and early lamb mortality. However, most pregnancies result in a single lamb. By assuming that the energy demand of a single foetus applies to all lambs born, these complications tend to offset each other - i.e., the extra ‘efficiency’ of multiple births, is offset by the ‘inefficiency’ of lambs lost to miscarriages, stillbirths and early mortality. Consequently, if the number of live lamb births is known, it is reasonable to take this to be the same as the number of pregnancies. If the number of lambs reared to weaning is the only available estimate of lambs born, then this number could be taken as the number of pregnancies, adjusted by an estimate of lamb survival from birth to weaning. Adjustments can also be made for seasons of high lamb mortality such as might result from adverse weather or poor grazing conditions.
The AFRC assesses the energy retained by the conceptus (foetus plus placenta and other associated tissues) during each day of the pregnancy. Integrating these throughout the gestation period (148 days) provides an expression for the energy cost (NErequired) of a single-foetus pregnancy:
EQUATION 8 NErequired (MJ/148-day period) = 6.18 (MJ/kg) ● lamb birth weight (kg)
The following equation can be used to estimate the lamb birth weight as a function of the conceptus-free ewe weight (AFRC).
EQUATION 9 lamb birth weight (kg) = 1.21 + 0.0537 ● ewe weight in kg
The annualized net energy demand due to pregnancy can then be expressed in terms of the conceptus-free ewe bodyweight (kg), as:
EQUATION 10 NEp (MJ/yr) = 7.48 + 0.332 ● ewe weight in kg
Fleece production: The net energy demand of a year’s wool production is given by the following equation:
EQUATION 11 NEwool (MJ/yr) = EVwool ● (annual wool production per sheep, kg/yr)
in which EVwool is the energy value of each kg of wool produced (weighed after drying but before scouring). AFRC recommend for EVwool the value 24 MJ/kg. At a typical wool production of about 4 kg/sheep/yr, the energy demand will normally be quite small.
Relating NE to GE: Equations analogous to those for the cattle methodology are required in order to relate the net energy (NE) intakes to gross energy (GE) intakes, and provide an estimate of the latter for each sheep cohort. As a property of feed, equation 11 in the cattle methodology may be taken as universal. However, the appropriateness of the cattle equations need to be developed to complete this methodology, including the correct incorporation of NErequired and its metabolic efficiency, as noted above. That development is not covered in this contribution. However, for the purposes of the global estimation discussed below, we adopt the following equation from the cattle section in Annex 2:
EQUATION 12
++
+++= •%
100)/()/(
)()/(
)(DEDENE
NEDENE
NENEDENE
NENENEGEp
p
g
woolgwlm
where NE/DE and NEg/DE are given by the cattle equations 12 and 13 of the IPCC methodology for cattle, and NEp/DE is derived from the AFRC manual as:
EQUATION 13 NEp / DE = 0.82 ● 0.133 = 0.109

Background Paper
Agricultural Sector 320
Methane Emissions: To estimate the methane EF for each sheep cohort, the gross energy intake is multiplied by the “methane conversion rate” (which Crutzen et al. (1986) term the “methane yield”) similarly to the final equation in the IPCC methodology for cattle:
EQUATION 14 EF (CH4 kg/hd/yr) = GEI (MJ/yr) ● Ym / 55.65 (MJ/kg CH4)
Where:
GEI is the annualized gross energy intake, and
Ym is the methane conversion rate expressed as a fraction (i.e., the fractional loss of GEI as combustible CH4).