
ch01 structure of metals.ppt
16
Kalpakjian • Schmid Manufacturing Engineering and Technology © 2001 Prentice-Hall Page 1-1 CHAPTER 1 The Structure of Metals
Transcript of ch01 structure of metals.ppt

Kalpakjian • SchmidManufacturing Engineering and Technology © 2001 Prentice-Hall Page 1-1
CHAPTER 1
The Structure of Metals

Kalpakjian • SchmidManufacturing Engineering and Technology © 2001 Prentice-Hall Page 1-2
Chapter 1 Outline
Figure 1.1 An outline of the topics described in Chapter 1

Kalpakjian • SchmidManufacturing Engineering and Technology © 2001 Prentice-Hall Page 1-3
Body-Centered Cubic Crystal Structure
Figure 1.2 The body-centered cubic (bcc) crystal structure: (a) hard-ball model; (b) unit cell; and (c) single crystal with many unit cells. Source: W. G. Moffatt, et al., The Structure and Properties of Materials, Vol. 1, John Wiley & Sons, 1976.

Kalpakjian • SchmidManufacturing Engineering and Technology © 2001 Prentice-Hall Page 1-4
Face-Centered Cubic Crystal Structure
Figure 1.3 The face-centered cubic (fcc) crystal structure: (a) hard-ball model; (b) unit cell; and (c) single crystal with many unit cells. Source: W. G. Moffatt, et al., The Structure and Properties of Materials, Vol. 1, John Wiley & Sons, 1976.

Kalpakjian • SchmidManufacturing Engineering and Technology © 2001 Prentice-Hall Page 1-5
Hexagonal Close-Packed Crystal Structure
Figure 1.4 The hexagonal close-packed (hcp) crystal structure: (a) unit cell; and (b) single crystal with many unit cells. Source: W. G. Moffatt, et al., The Structure and Properties of Materials, Vol. 1, John Wiley & Sons, 1976.

Kalpakjian • SchmidManufacturing Engineering and Technology © 2001 Prentice-Hall Page 1-6
Slip and Twinning
Figure 1.5 Permanent deformation (also called plastic deformation) of a single crystal subjected to a shear stress: (a) structure before deformation; and (b) permanent deformation by slip. The size of the b/a ratio influences the magnitude of the shear stress required to cause slip.
Figure 1.6 (a) Permanent deformation of a single crystal under a tensile load. Note that the slip planes tend to align themselves in the direction of the pulling force. This behavior can be simulated using a deck of cards with a rubber band around them. (b) Twinning in a single crystal in tension.

Kalpakjian • SchmidManufacturing Engineering and Technology © 2001 Prentice-Hall Page 1-7
Slip Lines and Slip Bands
Figure 1.7 Schematic illustration of slip lines and slip bands in a single crystal (grain) subjected to a shear stress. A slip band consists of a number of slip planes. The crystal at the center of the upper illustration is an individual grain surrounded by other grains.

Kalpakjian • SchmidManufacturing Engineering and Technology © 2001 Prentice-Hall Page 1-8
Edge and Screw Dislocations
Figure 1.8 Types of dislocations in a single crystal: (a) edge dislocation; and (b) screw dislocation. Source: (a) After Guy and Hren, Elements of Physical Metallurgy, 1974. (b) L. Van Vlack, Materials for Engineering, 4th ed., 1980.

Kalpakjian • SchmidManufacturing Engineering and Technology © 2001 Prentice-Hall Page 1-9
Defects in a Single-Crystal Lattice
Figure 1.9 Schematic illustration of types of defects in a single-crystal lattice: self-interstitial, vacancy, interstitial, and substitutional.
Kalpakjian • SchmidManufacturing Engineering and Technology © 2001 Prentice-Hall Page 1-10
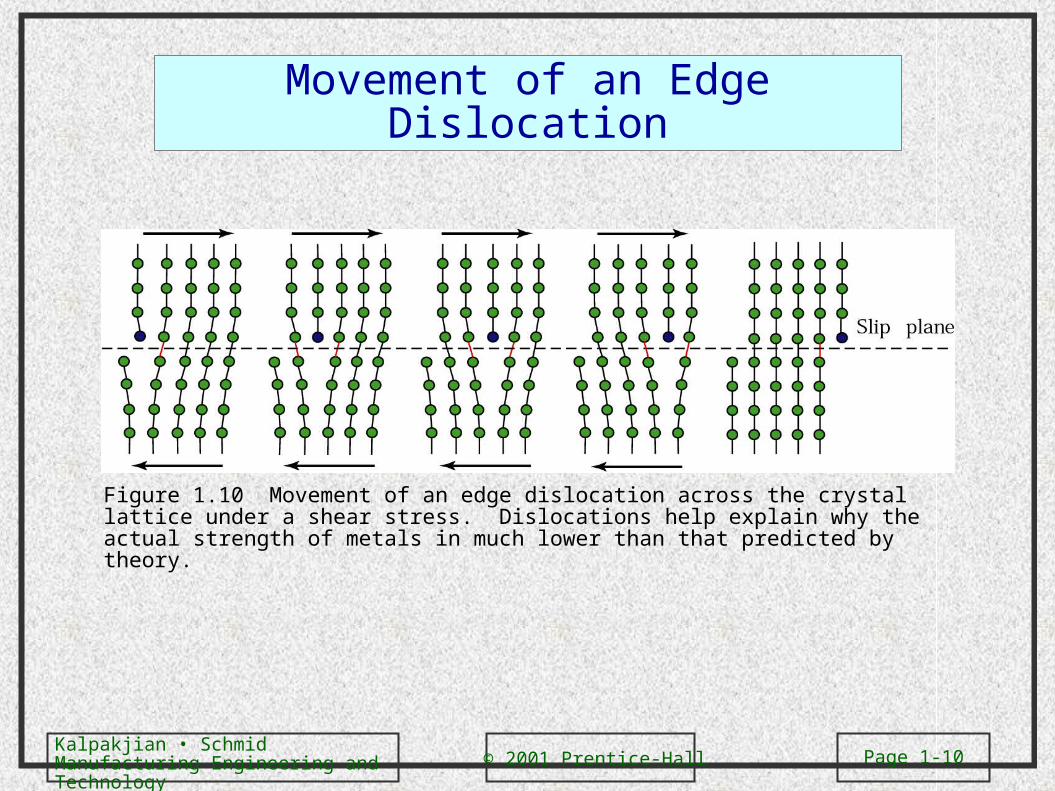
Movement of an Edge Dislocation
Figure 1.10 Movement of an edge dislocation across the crystal lattice under a shear stress. Dislocations help explain why the actual strength of metals in much lower than that predicted by theory.

Kalpakjian • SchmidManufacturing Engineering and Technology © 2001 Prentice-Hall Page 1-11
SolidificationFigure 1.11 Schematic illustration of the stages during solidification of molten metal; each small square represents a unit cell. (a) Nucleation of crystals at random sites in the molten metal; note that the crystallographic orientation of each site is different. (b) and (c) Growth of crystals as solidification continues. (d) Solidified metal, showing individual grains and grain boundaries; note the different angles at which neighboring grains meet each other. Source: W. Rosenhain.

Kalpakjian • SchmidManufacturing Engineering and Technology © 2001 Prentice-Hall Page 1-12
Grain Sizes
TABLE 1.1ASTM No. Grains/mm2 Grains/mm3
–3–2–10123456789101112
1248163264128256512
1,0242,0484,0968,20016,40032,800
0.72
5.61645128360
1,0202,9008,20023,00065,000185,000520,000
1,500,0004,200,000

Kalpakjian • SchmidManufacturing Engineering and Technology © 2001 Prentice-Hall Page 1-13
Preferred Orientation
Figure 1.12 Plastic deformation of idealized (equiaxed) grains in a specimen subjected to compression (such as occurs in the rolling or forging of metals): (a) before deformation; and (b) after deformation. Note the alignment of grain boundaries along a horizontal direction; this effect is known as preferred orientation.

Kalpakjian • SchmidManufacturing Engineering and Technology © 2001 Prentice-Hall Page 1-14
Anisotropy
Figure 1.13 (a) Schematic illustration of a crack in sheet metal that has been subjected to bulging (caused by, for example, pushing a steel ball against the sheet). Note the orientation of the crack with respect to the rolling direction of the sheet; this sheet is anisotropic. (b) Aluminum sheet with a crack (vertical dark line at the center) developed in a bulge test; the rolling direction of the sheet was vertical. Source: J.S. Kallend, Illinois Institute of Technology.
(b)

Kalpakjian • SchmidManufacturing Engineering and Technology © 2001 Prentice-Hall Page 1-15
Annealing
Figure 1.14 Schematic illustration of the effects of recovery, recrystallization, and grain growth on mechanical properties and on the shape and size of grains. Note the formation of small new grains during recrystallization. Source: G. Sachs.

Kalpakjian • SchmidManufacturing Engineering and Technology © 2001 Prentice-Hall Page 1-16
Temperature Ranges for Various Processes
TABLE 1.2Process T/TmCold workingWarm workingHot working
< 0.30.3 to 0.5> 0.6