Ch 8: Traffic Data Collection and Reduction Methodologies 1 Explain how traffic data are used List...
14
Ch 8: Traffic Data Collection and Reduction Methodologies 1 Explain how traffic data are used List typical traffic studies Use typical data collection equipment Collect data in the field Reduce data Chapter objectives: By the end of this lecture the student will be able to:
-
date post
20-Dec-2015 -
Category
Documents
-
view
230 -
download
2
Transcript of Ch 8: Traffic Data Collection and Reduction Methodologies 1 Explain how traffic data are used List...

1
Ch 8: Traffic Data Collection and Reduction Methodologies
Explain how traffic data are used List typical traffic studies Use typical data collection equipment Collect data in the field Reduce data
Chapter objectives: By the end of this lecture the student will be able to:

2
8.1 Applications of Traffic Data Managing the physical system Establishing time trends Understanding travel behavior Calibrating basic relationships or parameters Assessing the effectiveness of improvements Assessing potential impacts Evaluating facility or system performance

3
8.2 Types of Studies Volume studies Speed studies Travel time studies Delay studies Density studies Accident studies Parking studies Goods movement and transit studies Pedestrian studies Calibration studies Observation studies (like a compliance study for
stop signs)

4
8.3 Data Collection Methodologies Manual studies Semi-automated studies Fully automated studies

5
8.3.1 Manual data collection techniquesTraffic Counting Applications: Requires short breaks• A portion of each counting period is set aside for a
short break.• Every other counting period is used as a short
break.
Eq. 8-124x5/4=Eq. 8-2(30+35)/2=32.5≈3350+(50-
42.5)/2=53.7≈54
4547
648Similar
increase assumed.
45-(48.8 -45)/2=43.1≈43Similar decrease assumed.
Red circle/square = typos

6
8.3.1 continuedSpeed Study Applications:• Measurement of elapsed time over a short measured
highway segment using a simple stopwatch (or two sensor lines).
• Direct measurement of speeds using either handheld or fixed-mounted radar meters
• Parallax• Manual operation of the stopwatch

7
Parallax (viewing angle effect on speed)(using a stop watch: systematic error and random error)
deff = d1Tan(δ)
Si = deff/ti
d1 = perpendicular distance
S1 = speed of vehicle “i” (ft/s)ti = travel time in seconds
By using deff, the systematic error by δ can be corrected.

Radar Guns and Cosine Error(systematic error, difficulty of random sampling)
8
Chapter 3, Manual of Transportation Engineering Studies, ITE, 2000.
Va = Vr/cosα
Actual speed is faster than the speed obtained by radar.

9
8.3.2 Portable traffic data equipment/semi-automated studies
Truck factor = 1,205/515 =2.34

10
Tubes or line sensors for multilane roads?How do you derive counts for each lane of a multi-lane highway?

11
8.3.3 Permanent Detectors

12
Other data collection methods8.5 Cell phones (like Bluetooth technology, signal characteristics identification)8.6 Aerial photography & digitizing technology8.7 Interview studies: Comprehensive Home interview studies, Roadside interview studies, Destination-based interview studies
13
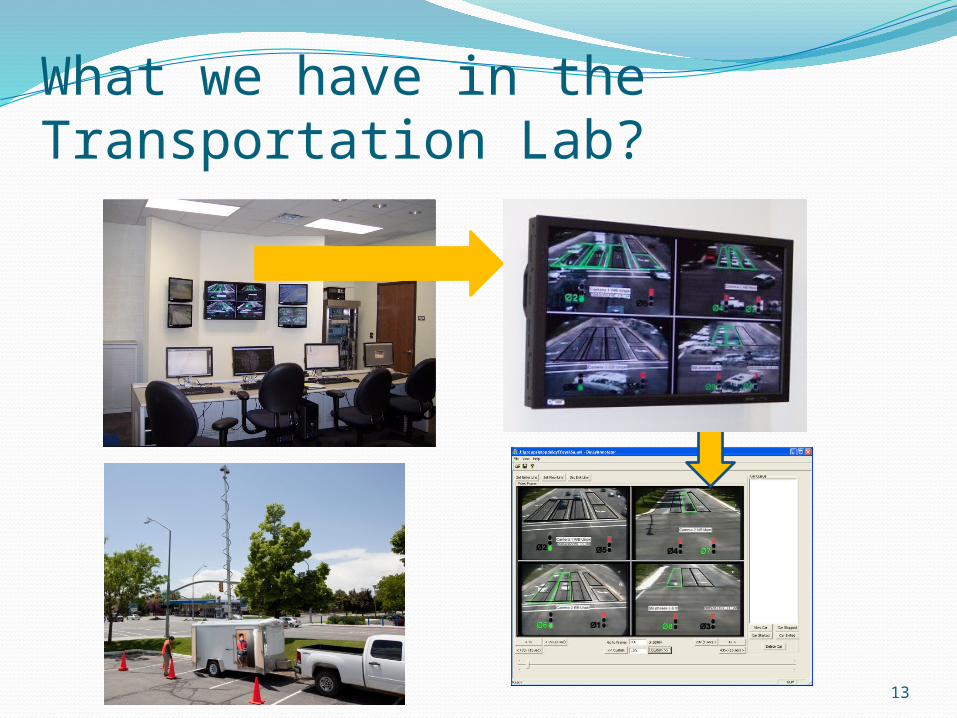
What we have in the Transportation Lab?
14
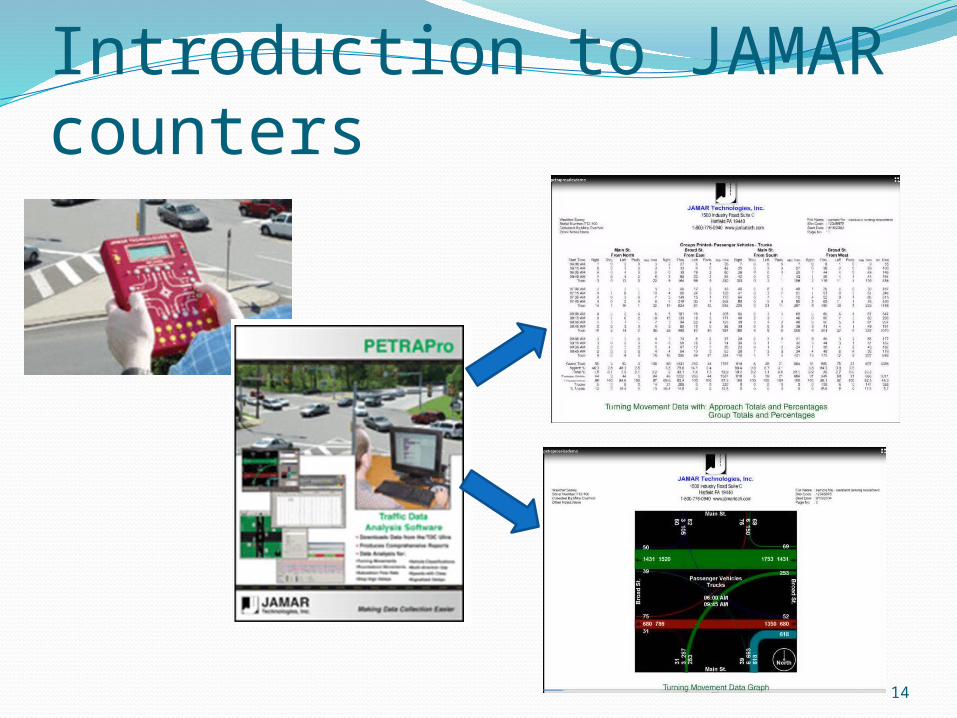
Introduction to JAMAR counters