Ch. 37: International Trade 1 Graphs and Tables Copyright © 2012 by The McGraw-Hill Companies, Inc....
15
Ch. 37: International Trade 1 Graphs and Tables Copyright © 2012 by The McGraw-Hill Companies, Inc. All rights reserved.
-
Upload
evan-hutchinson -
Category
Documents
-
view
214 -
download
1
Transcript of Ch. 37: International Trade 1 Graphs and Tables Copyright © 2012 by The McGraw-Hill Companies, Inc....

1
Ch. 37: International Trade
Graphs and Tables Copyright © 2012 by The McGraw-Hill Companies, Inc. All rights reserved.

2
• U.S. trade deficit in goods –$517 billion in 2009
• U.S. trade surplus in services –$138 billion in 2009
• Canada largest U.S. trade partner• Trade deficit with China–$220 billion in 2009
• Exports are 13% U.S. outputLO1 37-2
Key Trade Facts

3
• Principal U.S. exports include:–Chemicals–Agricultural products–Consumer durables–Semiconductors–Aircraft
• U.S. provides about 8.5% of world’s exports
LO1 37-3
Key Trade Facts

4
• Principal U.S. imports include:–Petroleum (trade deficit to OPEC
members)–Automobiles–Metals–Household appliances–Computers
LO1 37-4
Key Trade Facts

5LO1 37-5
Key Trade Facts
6
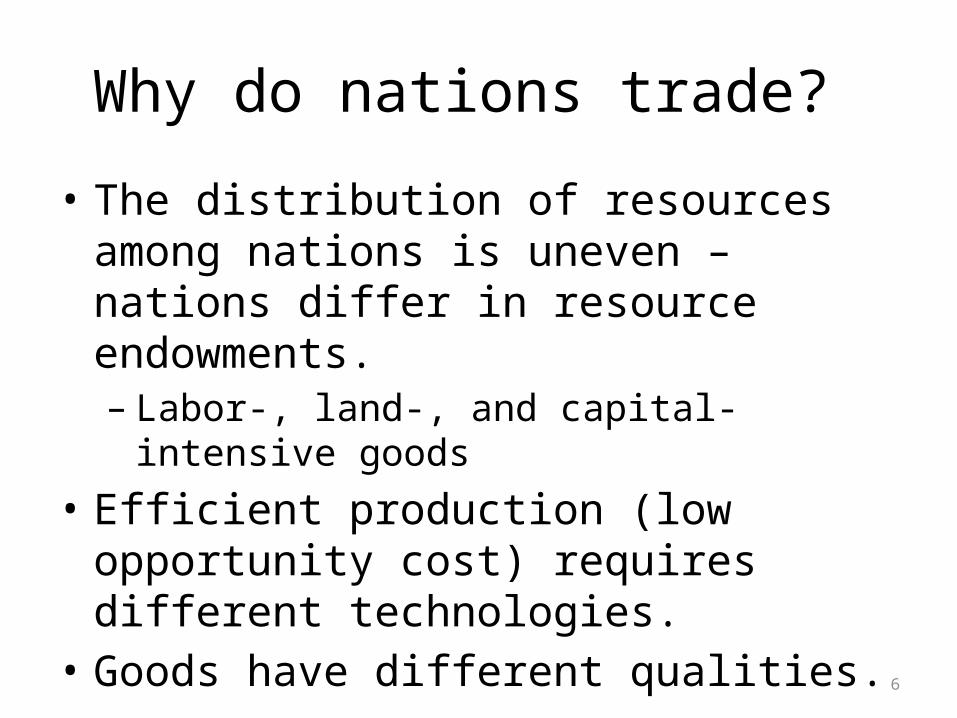
Why do nations trade?
• The distribution of resources among nations is uneven – nations differ in resource endowments.– Labor-, land-, and capital-intensive goods
• Efficient production (low opportunity cost) requires different technologies.
• Goods have different qualities.

7
Main Trade Result
• Specialization and international trade increase the productivity of U.S. resources and allow the U.S. to obtain greater total output than would otherwise be possible.
8
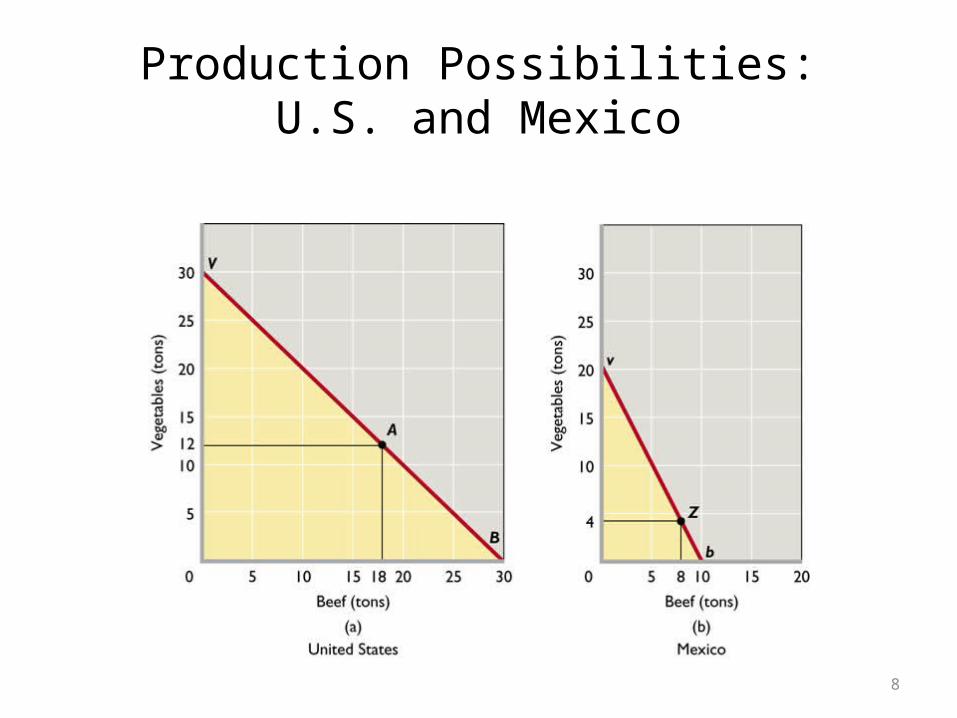
Production Possibilities:U.S. and Mexico
9
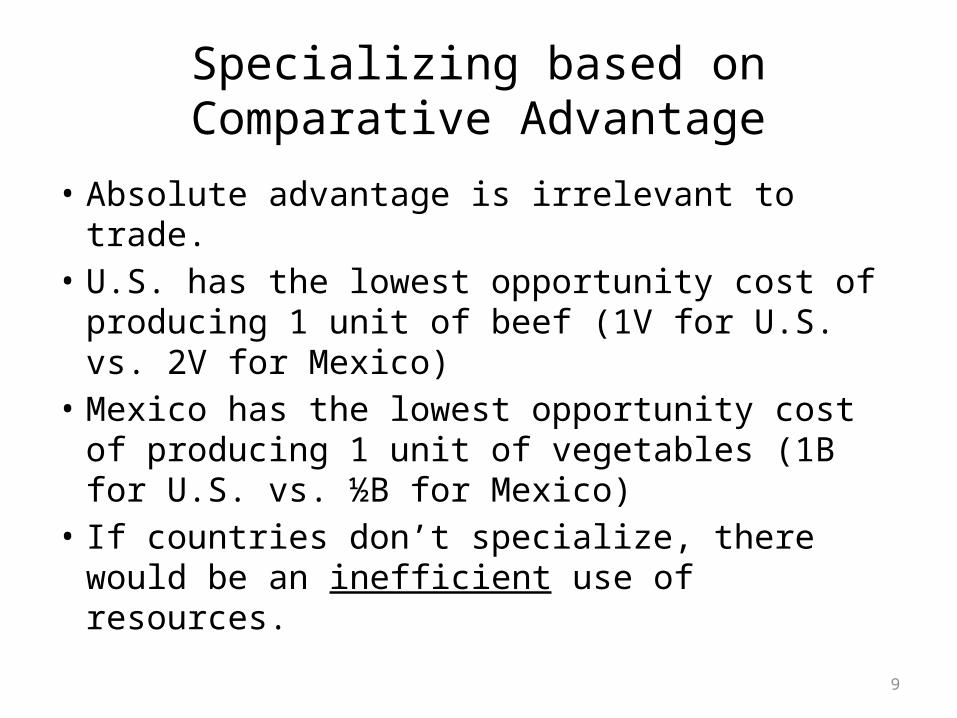
Specializing based on Comparative Advantage
• Absolute advantage is irrelevant to trade.• U.S. has the lowest opportunity cost of
producing 1 unit of beef (1V for U.S. vs. 2V for Mexico)
• Mexico has the lowest opportunity cost of producing 1 unit of vegetables (1B for U.S. vs. ½B for Mexico)
• If countries don’t specialize, there would be an inefficient use of resources.

10
Comparative Advantage Example: Summary

11
Trading Possibilities & Gains from Trade
12
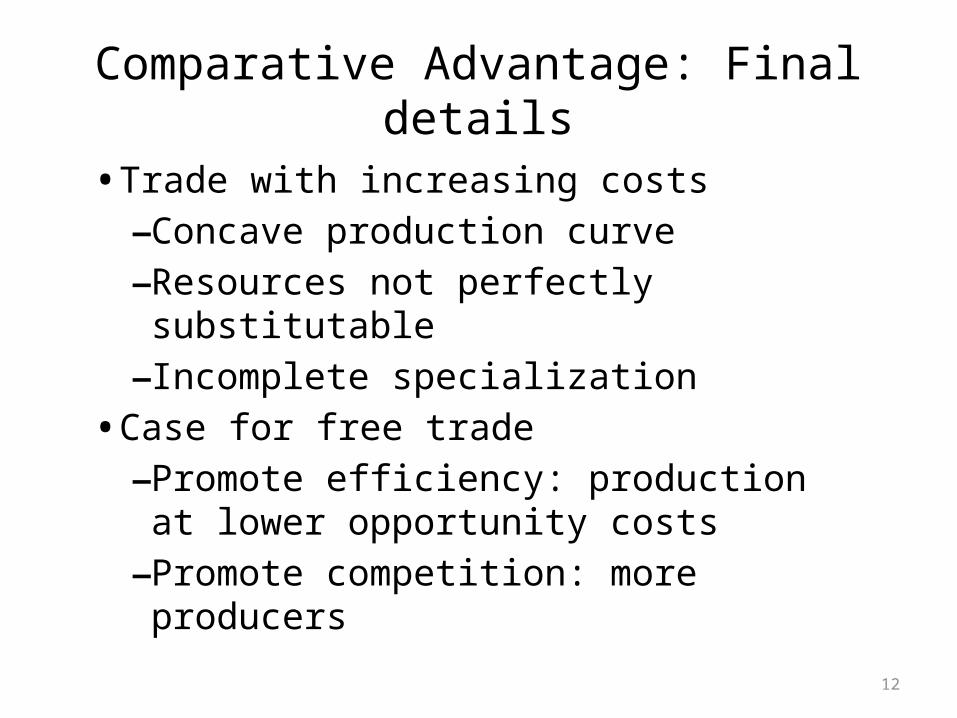
• Trade with increasing costs–Concave production curve–Resources not perfectly substitutable –Incomplete specialization
• Case for free trade–Promote efficiency: production at
lower opportunity costs–Promote competition: more
producersLO2 37-12
Comparative Advantage: Final details
13
14
15