Ch 18. Hydrologic Cycle and streamsruby.colorado.edu/~smyth/G1010/18Streams-Eric.pdf · 1. the...
59
Ch 18. Hydrologic Cycle and streams Tom Bean
Transcript of Ch 18. Hydrologic Cycle and streamsruby.colorado.edu/~smyth/G1010/18Streams-Eric.pdf · 1. the...

Ch 18. Hydrologic Cycle and streams
Tom Bean

Wednesday’s outline1. the hydrologic cycle
“reservoirs”cycling between them Evaporation and the atmosphere
2. Surface hydrology infiltration and soil moisturestreamflowETSnow/ice
3. water balanceWater balance equationcontrol volume a drainge basinwater balance exampleunits

Why do we care about the hydrologic Cycle and streams
Water resourcesFloods = hazards
Rivers shapeEarth’s surface

1. Hydrologic Cycle: continuous circulation of earth’s water,
between oceans, atmosphere and continents

Major “reservoirs” of water, in 1015 kg
Land16,000
Oceans1,400,000
Atmosphere13.5
Cryosphere(ice and snow)43,000
Lithosphere (LOTS)
97% of all water(salty)
29% of fresh water as GROUNDWATER
70% of all fresh water
hydrosphere

Moving water between reservoirs
Land16,000
Oceans1,400,000
Atmosphere13.5
Cryosphere43,000
Lithosphere
precipitation: rain and snowEvaporation
rivers

Evaporation and hydro cycle
Evaporationliquid to gas
Water in atmosphere1. Gas
(you cannot see water vapor)
CondensationGas to liquid
or ice
Ocean LAND
Water in atmosphere2. Clouds: liquid and ice

Surface hydrology: land or terrestrial branch of the hydrologic cycle

s
Soil
Sediment/Rock
Infiltration: movement of water from the soil surface into the soil
Overland flow to streams

s
Soil
Sediment/Rock
Evapotranspiration (ET) is the combination of:1. Evaporation of water from soil (liquid to gas)2. Transpiration: water evaporates inside leaves; moves
into atmosphere as gas
Evaporation
Transpiration

Streamflow (or runoff)movement of water downhill in a channel
Sources:1. From groundwater2. Overland flow3. Precipitation on channel
Evaporation

Snow and ice:water is temporarily stored as a solid

Water Balance Change in vol. of water equals inputs minus outputs
Similar to 1.Balancing a bank account2.Inventory at a store

1. Need a “control volume”
• A user defined compartment • Need not be “spatially connected”
– for example, the earth’s glaciers

• An area of the earth’s surface that contributes the water passing a point on a stream
• the boundary is called a “divide”
Drainage basin or watershed
6th largest river
~4000 km long
41% of U.S.
Mississippi River basin

Fig. 13.22
Drainage Basin of the Colorado River

Change in volume of water = input minus outputCatchment water budget
retp in volume change
Mississippi River basin
Inputs?Precipitation (P)
Outputs?Evapotranspiration (ET)Runoff (R)

Catchment water budgetretp in volume change
retp 0pret
Precipitation that falls on a basin, leaves the basin via the sum of ET and runoff

Catchment water balance example:In a year, how much ET from Boulder creek watershed
What percent of precipitation leaves basin via ET?A) 20%B) 40%C) 60%D) 80%
rpet 1. P measured as a “depth/time” mm/year
2. R measured as a “volume/time” m3/second

Raingaugedepth per time (length per time)

Streamgauge; measure dischargevolume per time

What is stream discharge?
2 m
2 m
Area = height * width
DISCHARGE = area x AVERAGE velocityDischarge = 4 m2 x 3 m/s = 12 m3/ s
3 m/s

Volume = area * depthkm3 [=] km2 * km
Map of Boulder Creek drainage basin
Area

Does it rain more in Rhode Island or New Mexico?
By volume: more rain falls in New Mexico.
By depth: more rain falls in Rhode island
volume = area * depth
depth = volume / area

1. Boulder Creek example
P = 1 m/yearBasin area = 500 km2 =500,000,000 m2
What is volume of precipitation in Boulder creek basin?
Either: 500,000,000 m3/year or 0.5 km3
2. Boulder creek example
yrxxm
yrm
1sec1015.3
sec
733
Runoff = 3.2 m3/s
What is volume of runoff (per year)
yrkm
yrm
yrmx
yrsxxR
3338
71.0000,000,1001001.1
11015.3 2.3

Catchment water balance example:In a year, how much ET from Boulder creek watershed
P = 0.5 km3
R = 0.1 km3
Answer: ET = 0.4 km3 or 80% of p
rpet
What percent of precipitation leaves basin via ET?A) 20%B) 40%C) 60%D) 80%

Catchment water balance example:In a year, how much ET from Boulder creek watershed
P = 1.0 m / yr or 1000 mm/yr
R = 0.2 m / yr or 200 mm/yr
ET = 0.8 m/yr or 800 mm/yr
20% of precipitation ends up as runoff80% of returns to atmosphere via ET
rpet

Water balance by continent(units = mm yr-1)
Continent P (mm) R (mm) ET (mm) % runoff
Africa 690 140 550 20
Asia 720 290 430 40
Australia 740 230 510 31
Europe 730 320 410 44
N. America 670 290 380 43
S. America 1650 590 1060 36
Antarctica 170 30 140 18
All land 800 310 490 39
All oceans 1066 -10 1176 -1
Globally, only 40% of precipitation is runoff
Majority (60%) goes to ET!

In southwestern US:Nearly all P ET
172,000
108,000(62.7%)
CA
48,000
46,000(95.8%)
NV
68,000
67,000(98.5%)
AZ
75,000
73,000(97.3%)
NM
Precipitation
Evapotranspiration
Water Balance Component
Data in Million Gallon/Day. Source: USGS Water Use Report 1990

Water flowing in streams
Tom Bean

What is a “stream”: flow of water within any natural channel
bed: floor of the channel.floodplain: the flat region
adjoining the channel occupied in times of flood

How does water get into a stream?
Sources:1. From groundwater2. Overland flow3. Precipitation on channel

Streams flow downhill gravity
Continual conversion of:Potential energy kinetic
energy
1. Where does energy come from?
2. How come water doesn’t keep going faster?
The sun is the energy source for the hydrologic cycle

Streams are turbulent flows
Turbulence
Even a quiet, gentle stream is a turbulent flow, not laminar
Energy loss to friction in turbulent flowsso, water doesn’t keep moving faster

Drainage basins and “SUB-BASINS”
Political boundaries rarely follow basin boundaries
A basin can be divided into a series of “sub-basins”

Boulder Creek
Every basin has a “stream network” Pattern of stream channels in a basin

Some drainage basins are VERY VERY BIG
Some drainage basins are VERY VERY small

Water flowing in stream channelsWhat controls how water flows down a channel?

Channel controls on flow1. cross sectional AREA
2 m
2 m
Area = height * width
DISCHARGE = area x AVERAGE velocityDischarge = 4 m2 x 3 m/s = 12 m3/ s
3 m/s

Velocity varies throughout a channel cross-section

Channel controls on flow: 2. Gradient or slope
2 m
2 m
Low gradient High gradient
“rise”“run”
Gradient or slope = rise/run

Channel controls on flow: 3. material on bed
Boulders
Concrete channelsSand
All else equal: Smooth bed = high velocity

Fig. 13.11
Meandering River
Point Bar
Peter Kresan
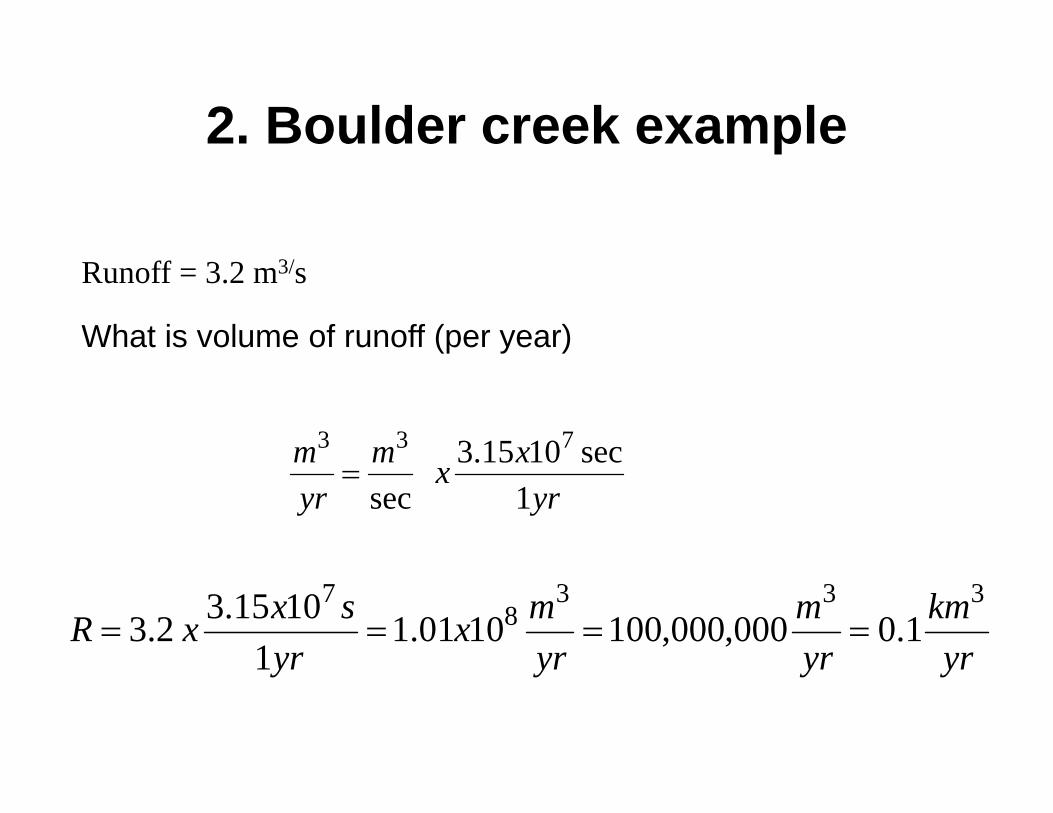
Fig. 13.12
Braided River
Tom Bean

Rivers and Geology
• Erosion• Transportation• Deposition

EROSION: Waterfall Retreating Upriver stream is eroding bedrock
Fig. 13.7Donald Nausbaum

EROSION Pebbles Caught in Eddies Form Potholes
Carr Clifton/Minden Pictures

Transport: Streams move material in three forms
• Dissolved load• Suspended load• Bed load

Fig. 13.3
Bedload -> Saltation

Fig. 13.26
Deposition 1: Mississippi Delta
Landsat 2 image annotated by Moore, 1979
Delta: sediments deposited where river meets the ocean or a lake

Fig. 13.28
Shifting Mississippi River Delta Over the Past 6000 Years

Deposition 2. Formation of Natural Levees
Levees built up further for flood control

FLOODING
Xie Jiahua/China Features/Sygma

Discharge varies through time
Boulder Creek, near Orodell
1986 1987 1988 1989 1990 1991 1992 1993 1994 1995Date
Mea
n da
ily s
tream
flow
, ft3 /
sec

Flooding
• Discharge exceeds capacity of channel • Interval between floods depends on climate, channel type,
basin size and stream network• Flooding is natural, but human activities affect flood frequency
and magnitude

Recurrence interval- Average time between occurrences of a given
event
The “100-year” flood: a flood of this size is expected every 100 years
The “500-year” flood: a flood of this size is expected every 500 years
ZONING and INSURANCE

The floodplain in Boulder

Fig. 13.1
Annual Flood Frequency Curve