Ch. 12: U.S. Inflation, Unemployment and Business Cycles Demand-pull and cost-push inflation. SR...
27
Ch. 12: U.S. Inflation, Unemployment and Business Cycles Demand-pull and cost-push inflation. SR and LR tradeoff between inflation and unemployment (Phillips Curve) Business cycle theories.
-
Upload
daniella-townsend -
Category
Documents
-
view
230 -
download
6
Transcript of Ch. 12: U.S. Inflation, Unemployment and Business Cycles Demand-pull and cost-push inflation. SR...
Ch. 12: U.S. Inflation, Unemployment and Business Cycles
Demand-pull and cost-push inflation.
SR and LR tradeoff between inflation and unemployment (Phillips Curve)
Business cycle theories.
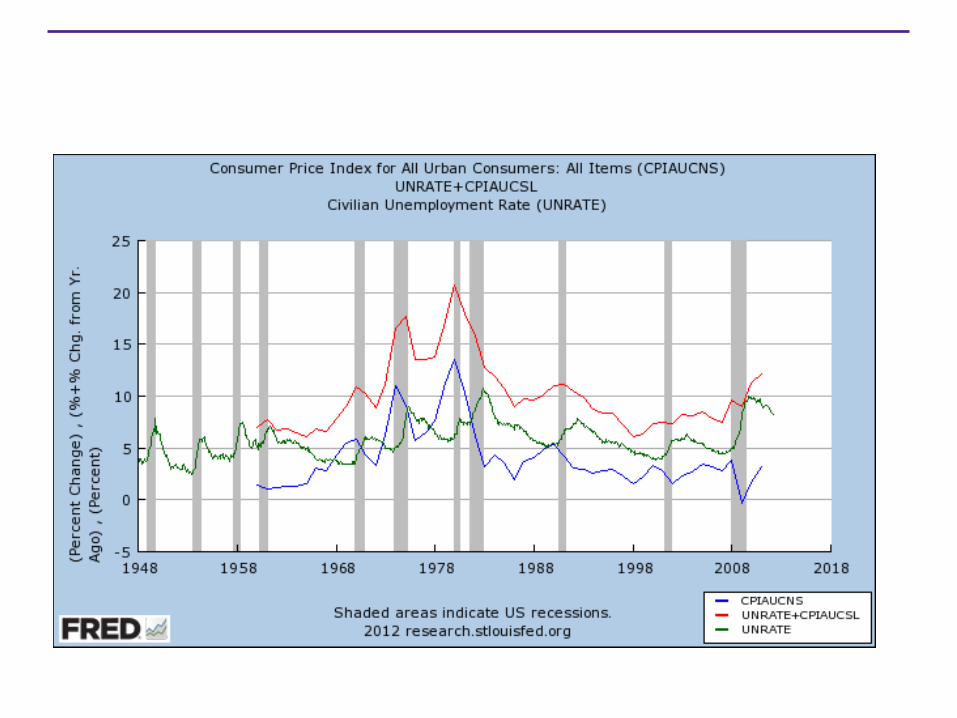
The Misery Index
MI proposed by Arthur Okun in 1970s
MI = inflation rate plus the unemployment rate.
We want both low inflation & low unemployment – are there trade-offs between the two?
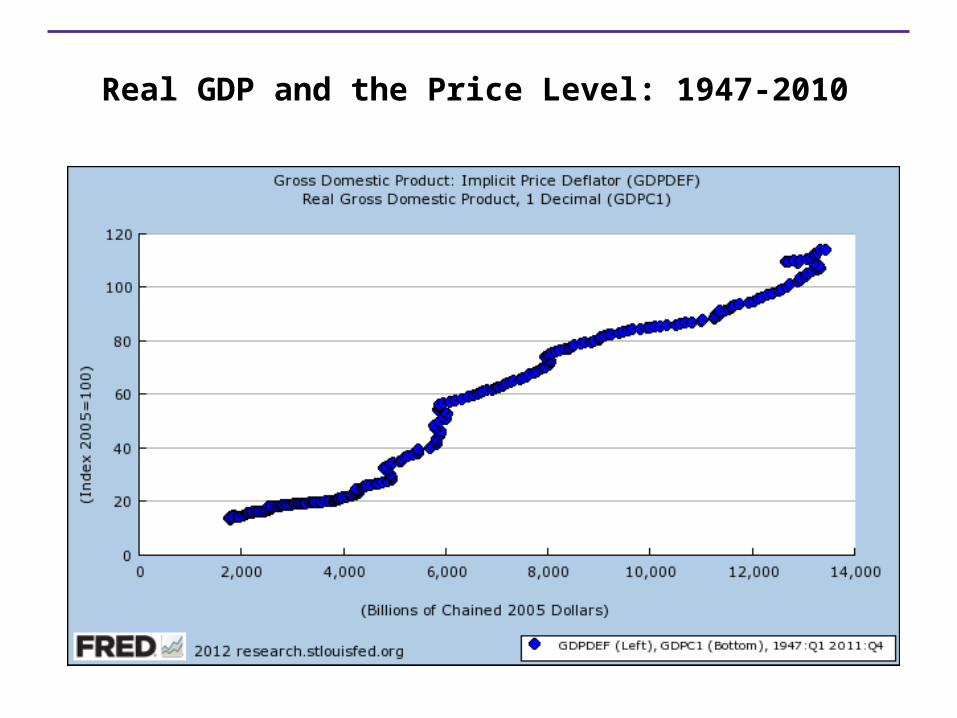
Real GDP and the Price Level: 1947-2010
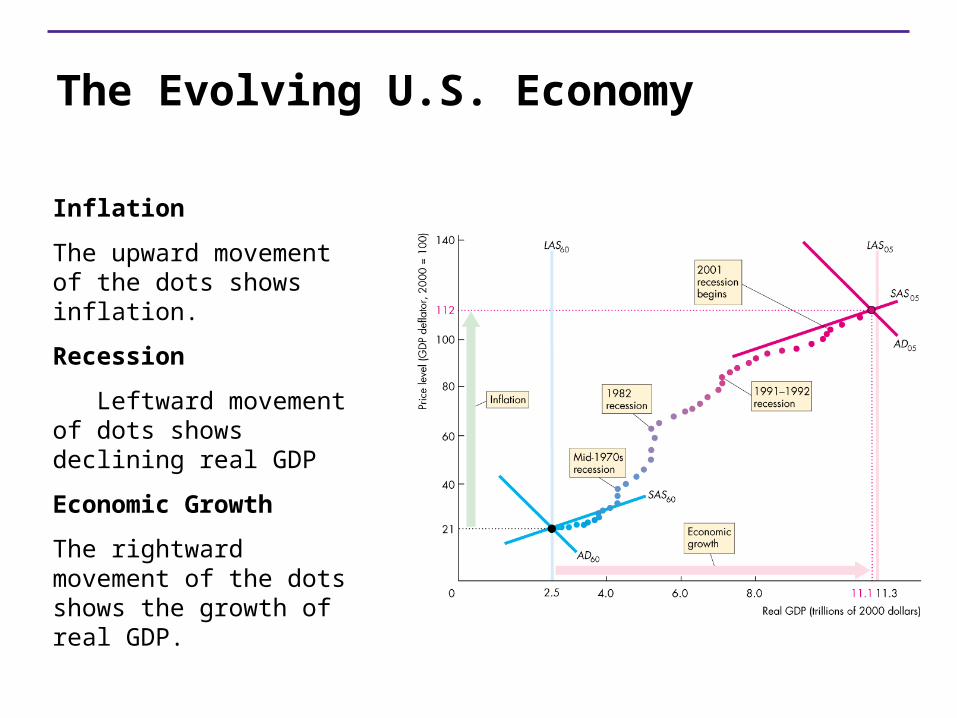
The Evolving U.S. Economy
Inflation
The upward movement of the dots shows inflation.
Recession
Leftward movement of dots shows declining real GDP
Economic Growth
The rightward movement of the dots shows the growth of real GDP.
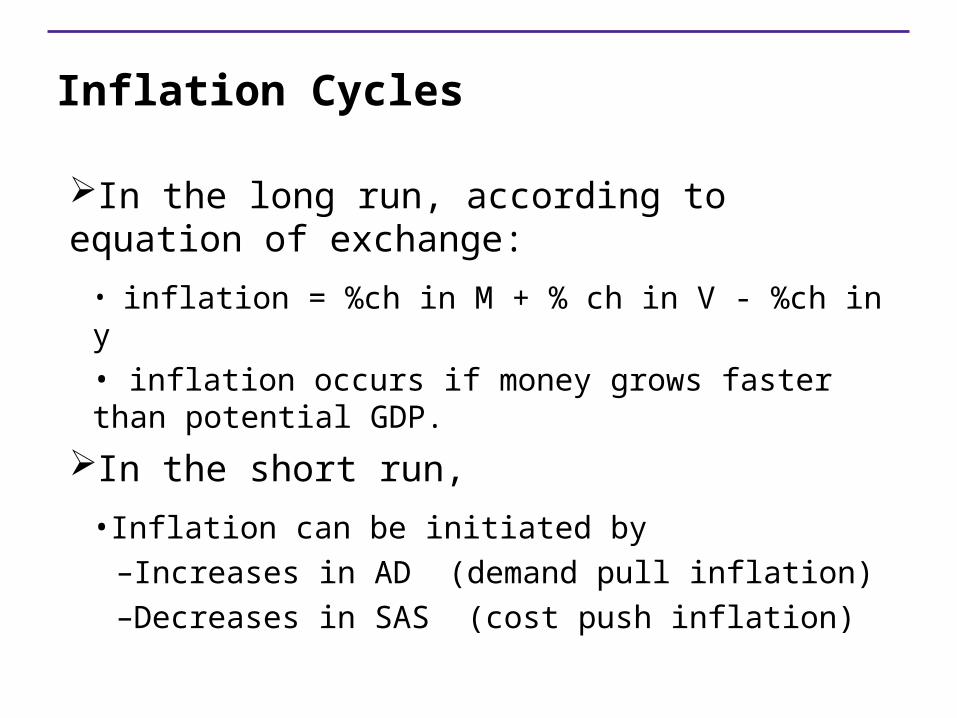
Inflation Cycles
In the long run, according to equation of exchange:
• inflation = %ch in M + % ch in V - %ch in y• inflation occurs if money grows faster than potential GDP.
In the short run,
•Inflation can be initiated by–Increases in AD (demand pull inflation)–Decreases in SAS (cost push inflation)
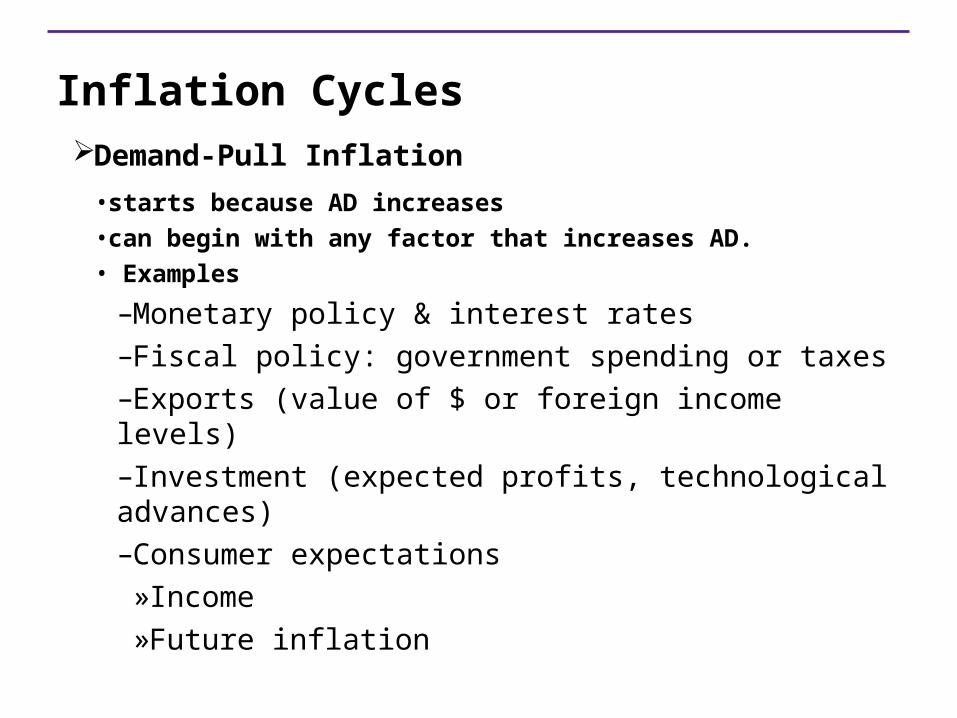
Inflation CyclesDemand-Pull Inflation
•starts because AD increases•can begin with any factor that increases AD. • Examples
–Monetary policy & interest rates–Fiscal policy: government spending or taxes–Exports (value of $ or foreign income levels)–Investment (expected profits, technological advances)–Consumer expectations »Income »Future inflation
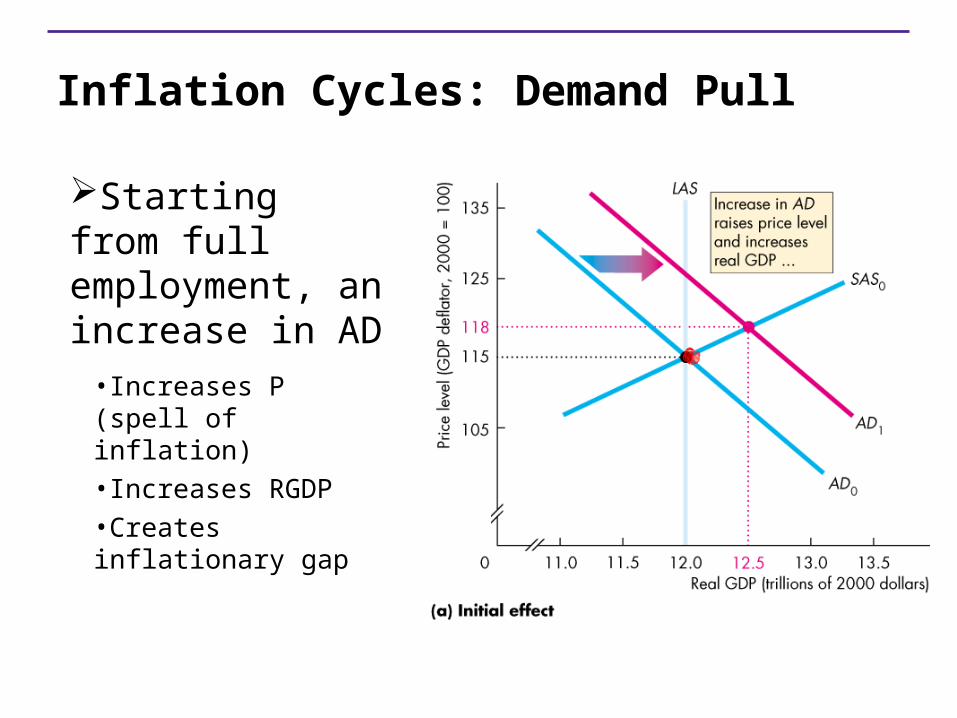
Inflation Cycles: Demand Pull
Starting from full employment, an increase in AD
•Increases P (spell of inflation)•Increases RGDP•Creates inflationary gap
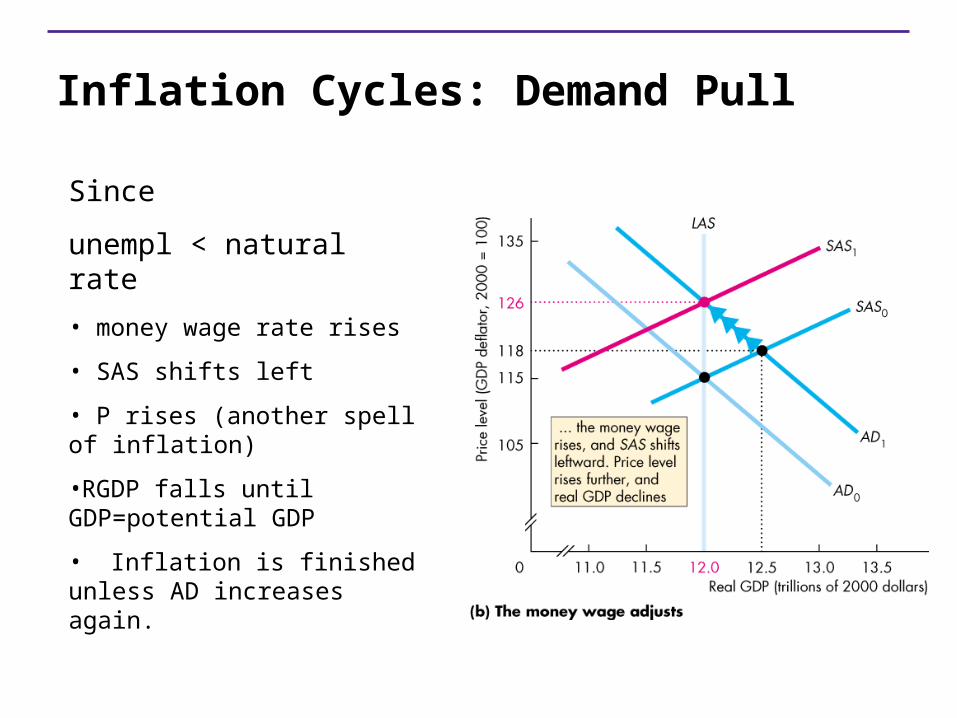
Inflation Cycles: Demand Pull
Since
unempl < natural rate
• money wage rate rises
• SAS shifts left
• P rises (another spell of inflation)
•RGDP falls until GDP=potential GDP
• Inflation is finished unless AD increases again.
Inflation Cycles: Demand Pull
Demand-Pull Inflation Process
•AD must continually increase so that the process described above repeats itself
•Although any of several factors can increase AD to start a demand-pull inflation, only an ongoing increase in the quantity of money can sustain it.
Inflation Cycles: Cost Push
Cost-Push Inflation
•starts with an increase in costs•Possible sources of increased costs:
– An increase in the money wage rate–An increase in the money price of raw materials (e.g. oil)–Natural disasters–Regulation (e.g. carbon taxes)
•Results in decrease in SAS
Inflation Cycles: Cost Push
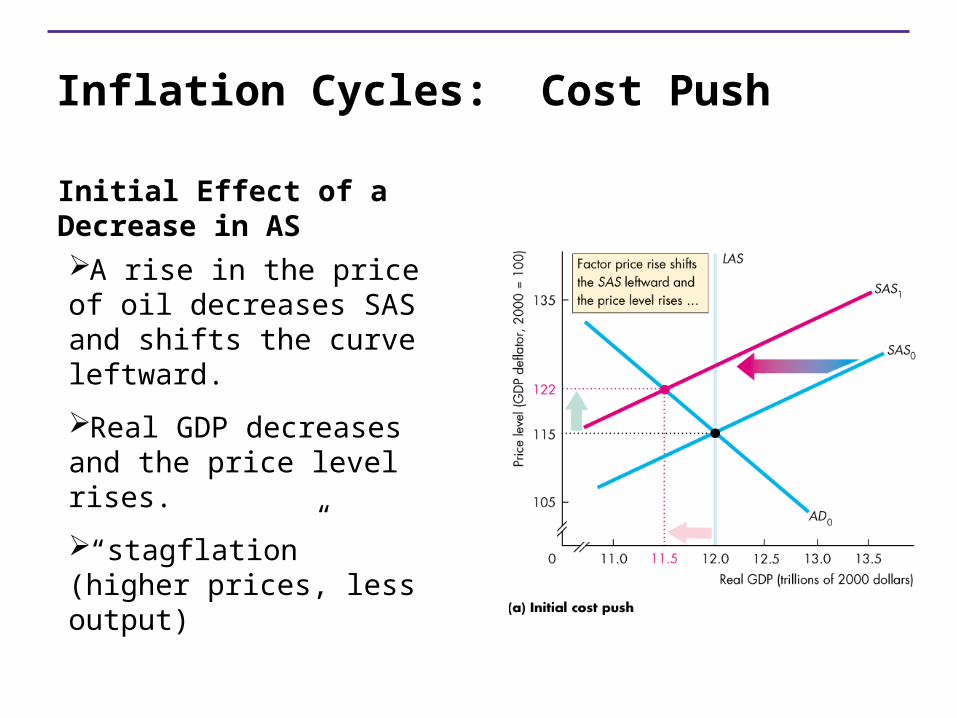
Initial Effect of a Decrease in ASA rise in the price of oil decreases SAS and shifts the curve leftward.
Real GDP decreases and the price level rises.
“stagflation” (higher prices, less output)
Inflation Cycles: Cost Push
Aggregate Demand ResponseThe initial increase in costs creates a one-time rise in the price level, not continued inflation.
To create inflation, AD must increase after AS decreases.
Although any of several factors can increase AD to start a demand-pull inflation, only an ongoing increase in the quantity of money can sustain it.
Inflation Cycles & Inflation Expectations
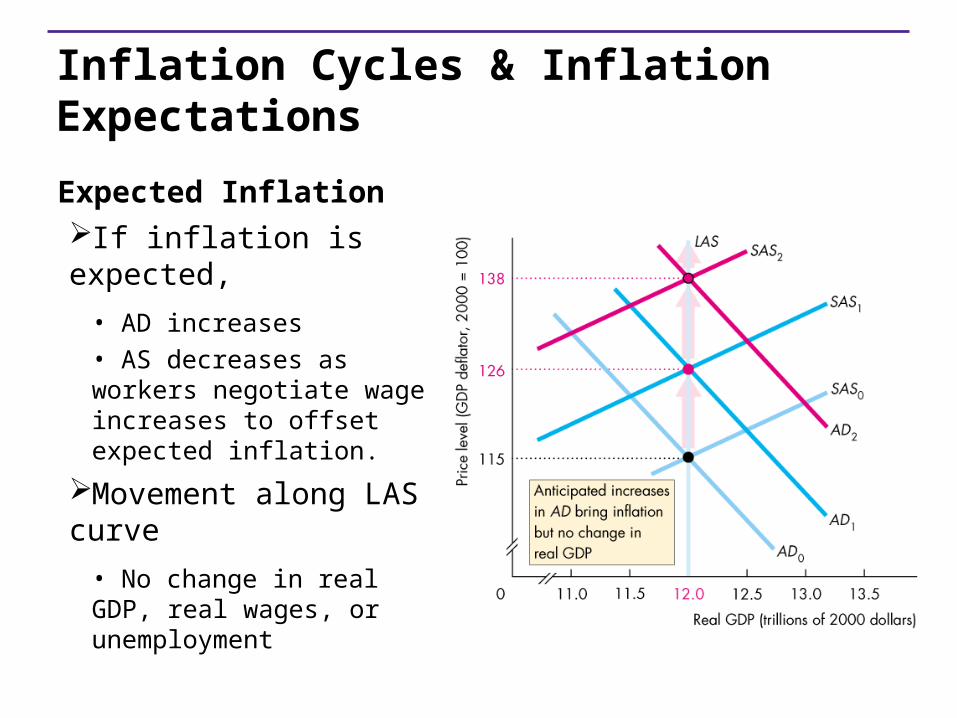
Expected InflationIf inflation is expected,
• AD increases • AS decreases as workers negotiate wage increases to offset expected inflation.
Movement along LAS curve
• No change in real GDP, real wages, or unemployment
Inflation Cycles & Inflation Expectations
When the inflation forecast is correct, the economy operates at full employment.
If AD grows faster than expected,
•Inflation > expected•Real wages decrease
–Real GDP increases above potential–Unemployment rate falls below natural rate
If AD grows slower than expected
•Inflation < expected–Real wages rise–Unemployment rate rises above natural rate
AD/AS representation of impact of inflation > expected inflation

AD/AS representation of impact of inflation < expected inflation
The Phillips CurvePhillips curve
•shows the relationship between the inflation rate and the unemployment rate.
SR Phillips curve
–Shows tradeoff between inflation and unemployment holding constant
»The expected inflation rate» The natural unemployment rate
LR Phillips curve
•shows the relationship between inflation and unemployment when the actual inflation rate equals expected inflation • vertical at natural rate of unemployment
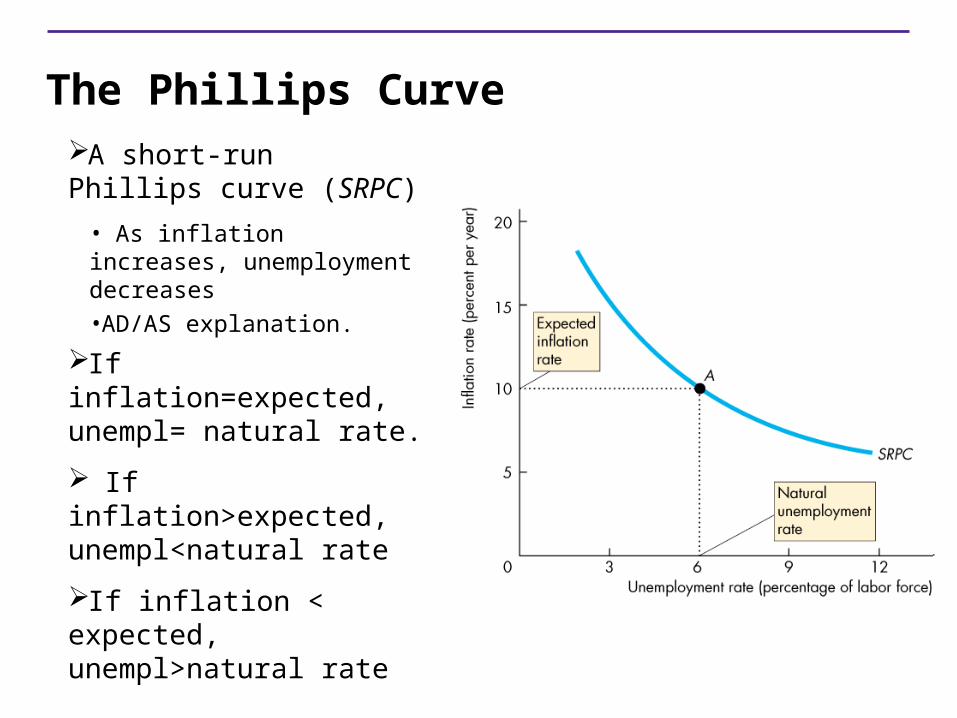
The Phillips CurveA short-run Phillips curve (SRPC)
• As inflation increases, unemployment decreases•AD/AS explanation.
If inflation=expected, unempl= natural rate.
If inflation>expected, unempl<natural rate
If inflation < expected, unempl>natural rate
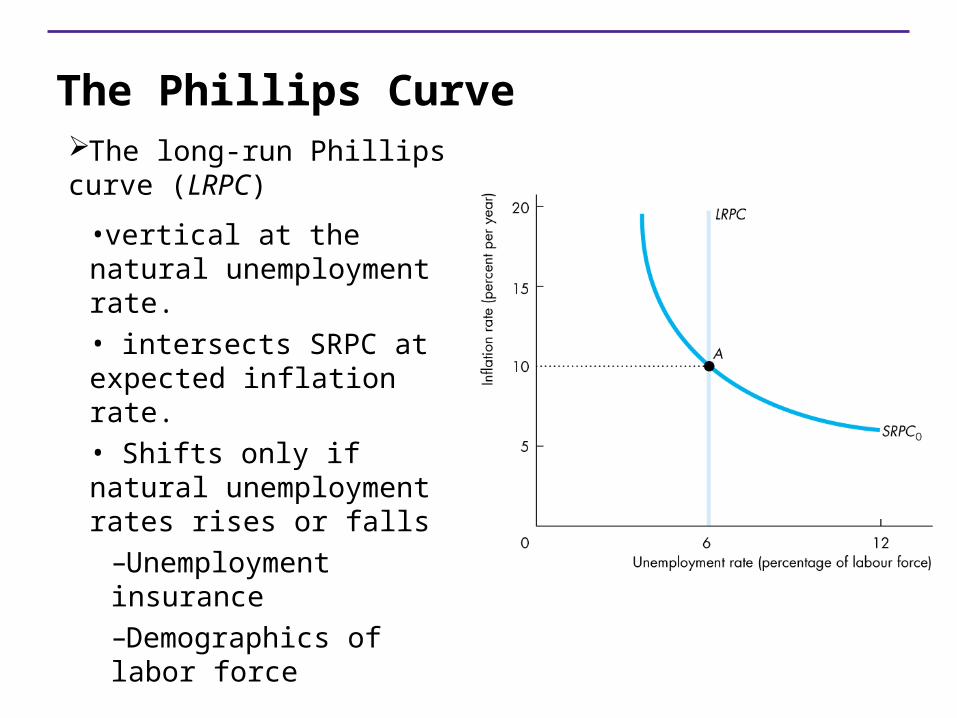
The Phillips CurveThe long-run Phillips curve (LRPC)
•vertical at the natural unemployment rate.• intersects SRPC at expected inflation rate.• Shifts only if natural unemployment rates rises or falls
–Unemployment insurance–Demographics of labor force
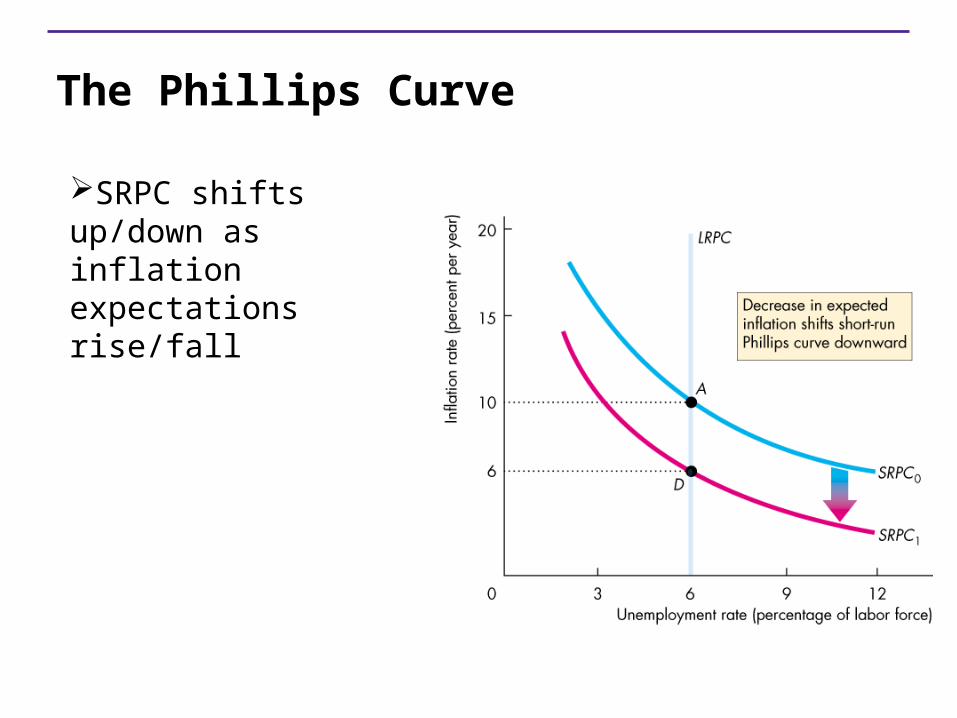
The Phillips Curve
SRPC shifts up/down as inflation expectations rise/fall
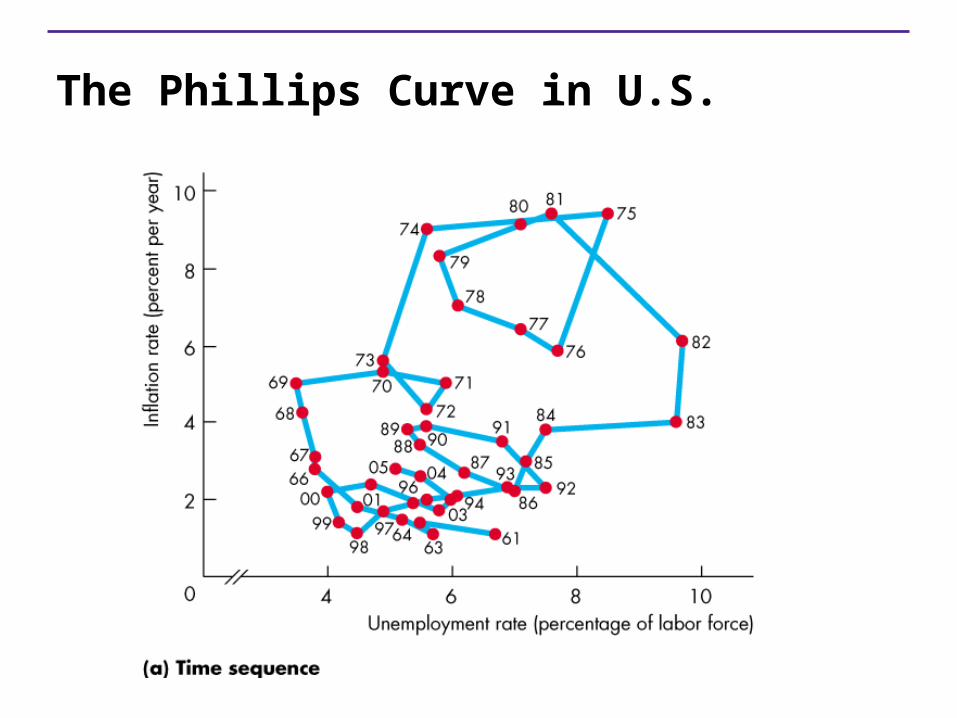
The Phillips Curve in U.S.
Business Cycles
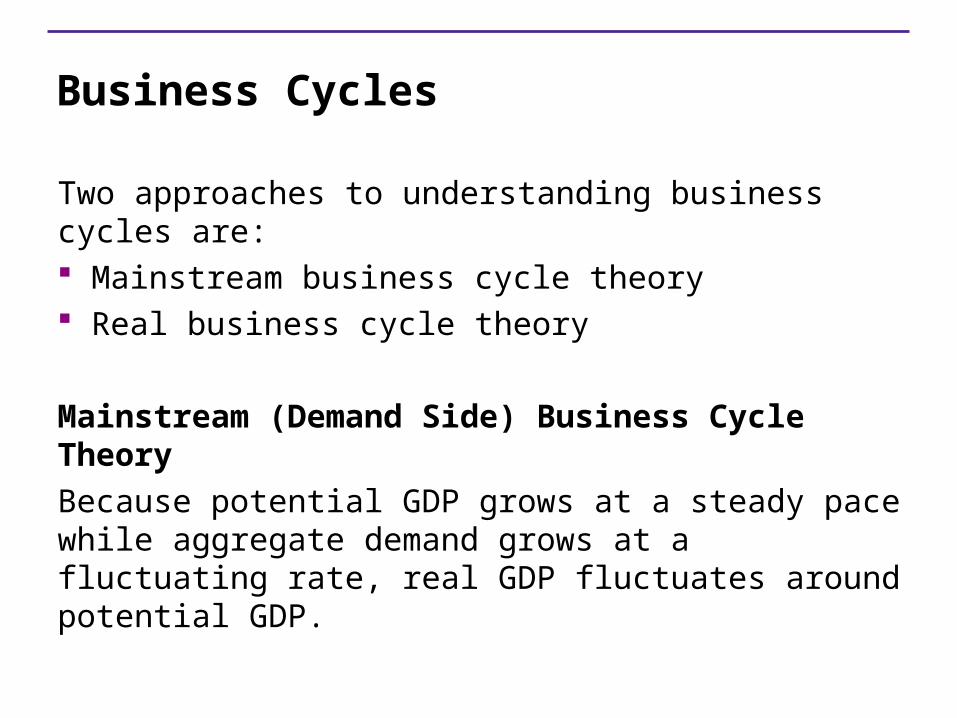
Two approaches to understanding business cycles are: Mainstream business cycle theory Real business cycle theory
Mainstream (Demand Side) Business Cycle Theory
Because potential GDP grows at a steady pace while aggregate demand grows at a fluctuating rate, real GDP fluctuates around potential GDP.
Business Cycles
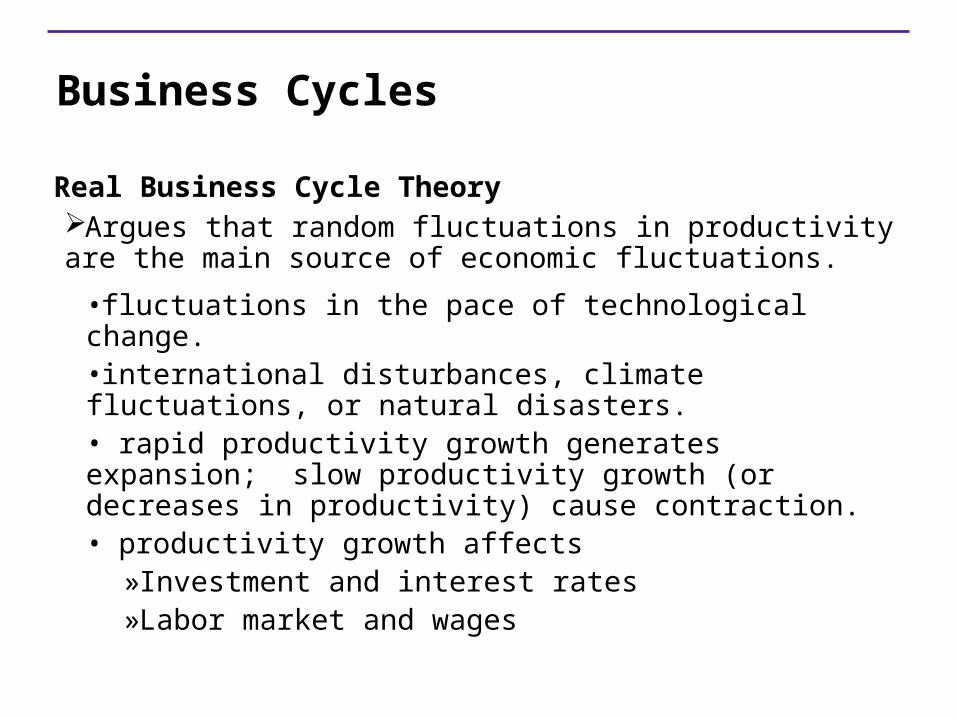
Real Business Cycle TheoryArgues that random fluctuations in productivity are the main source of economic fluctuations.
•fluctuations in the pace of technological change. •international disturbances, climate fluctuations, or natural disasters.• rapid productivity growth generates expansion; slow productivity growth (or decreases in productivity) cause contraction.• productivity growth affects
»Investment and interest rates»Labor market and wages
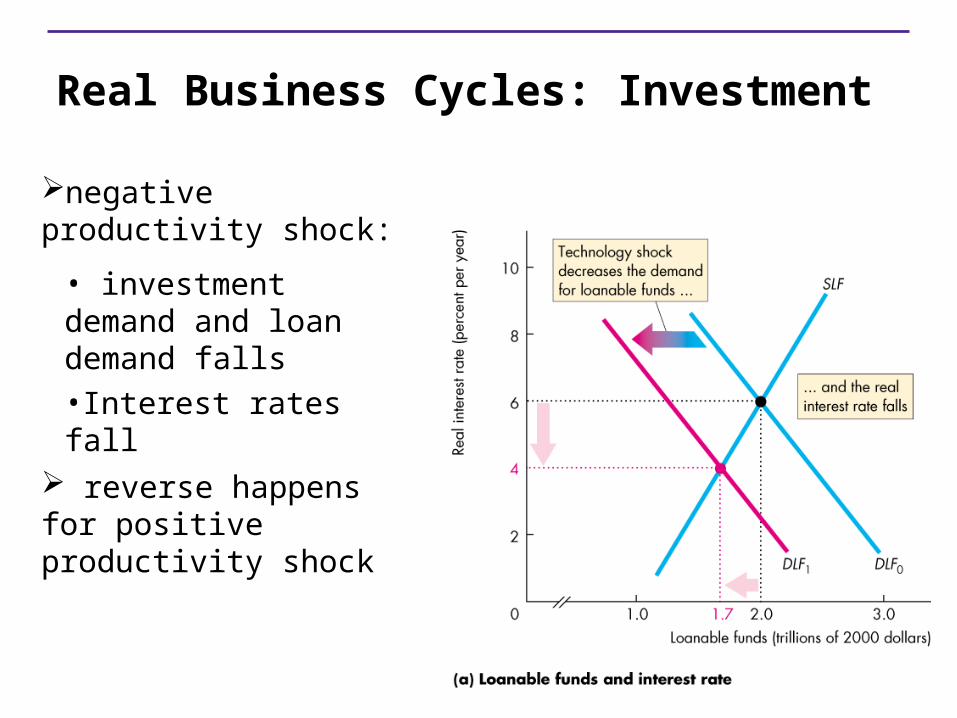
Real Business Cycles: Investment
negative productivity shock:
• investment demand and loan demand falls•Interest rates fall
reverse happens for positive productivity shock

Real Business Cycles: Labor
Negative productivity shock
•Labor demand decreases•Labor supply decreases because of lower interest rates (prior slide) and intertemporal subst•Employment and the real wage rate decrease (assuming LD shift larger than LS).• Reverse happens when there is an expansion caused by rapid productivity increase.
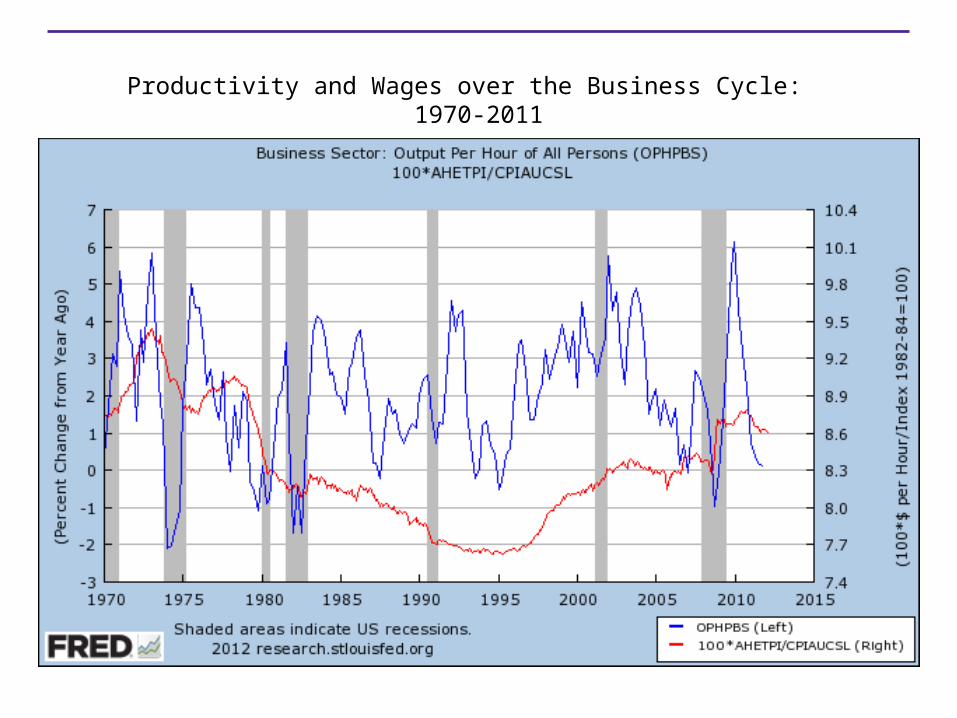
Productivity and Wages over the Business Cycle: 1970-2011