CGHS Pune · CGHS Pune –Data Wellness center wise beneficiary data Sno Dispensary Name...
32
CGHS Pune Meeting with Pensioner Associations July 25, 2019
Transcript of CGHS Pune · CGHS Pune –Data Wellness center wise beneficiary data Sno Dispensary Name...
CGHS PuneMeeting with
Pensioner Associations
July 25, 2019

AGENDA
3:30 PM Welcome & Introduction
3:40 PM to 4:30 PM
Points raised by
• All India Central Government Pensioner’s Association, AICGPA• Defence Civilian Pensioners Association (DCPA)• Defence Accounts Pensioners Association (DAPA)
& other associations
4:35 PM to 5:15 PM Address by Additional Director, CGHS
5:15 PM to 5:30 PM Discussion

CGHS Pune – DataWellness center wise beneficiary data
Sno Dispensary Name Cardholders Beneficiaries
1 Wellness Center 1 6062 14323
2 Wellness Center 2 8147 19099
3 Wellness Center 3 4579 10479
4 Wellness Center 4 3574 7331
5 Wellness Center 5 7448 18021
6 Wellness Center 6 8128 17627
7 Wellness Center 7 8577 17182
8 Wellness Center 8 3398 7710
9 Wellness Center 9 2264 5339
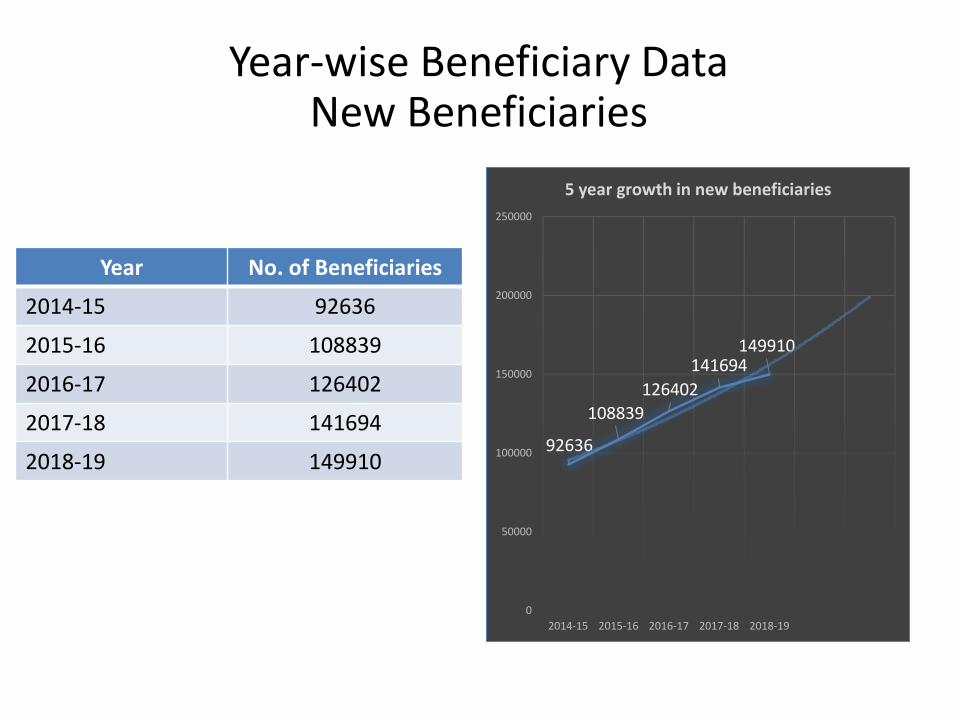
Year-wise Beneficiary DataNew Beneficiaries
Year No. of Beneficiaries
2014-15 92636
2015-16 108839
2016-17 126402
2017-18 141694
2018-19 14991092636
108839
126402
141694149910
0
50000
100000
150000
200000
250000
2014-15 2015-16 2016-17 2017-18 2018-19
5 year growth in new beneficiaries

Year-wise Beneficiary DataNew Beneficiaries
3325038280
4372648998
51029
59386
70559
82676
9269698881
92636
108839
126402
141694
149910
0
20000
40000
60000
80000
100000
120000
140000
160000
2014-15 2015-16 2016-17 2017-18 2018-19
Serving Pensioner Total Beneficiaries
53.5% 66.5% 61.8%

CGHS Pune – DataPatients attendance data
January to June 2019
Sr. No. Dispensary Code Attendance
1 Wellness Center 1 31,683
2 Wellness Center 2 37,504
3 Wellness Center 3 26,357
4 Wellness Center 4 16,431
5 Wellness Center 5 33,952
6 Wellness Center 6 32,392
7 Wellness Center 7 34,624
8 Wellness Center 8 25,099
9 Wellness Center 9 12,805
Total 2,50,847

CGHS Pune – DataDoctors & pharmacists data
Sno Dispensary Name Doctors (Incl CMO I/c) Pharmacists
1 Wellness Center 1 3 3
2 Wellness Center 2 4 3
3 Wellness Center 3 3 3
4 Wellness Center 4 2 2
5 Wellness Center 5 4 3
6 Wellness Center 6 3 3
7 Wellness Center 7 5 4
8 Wellness Center 8 2 3
9 Wellness Center 9 1 2

Doctor/Pharmacist to Patient Ratio
Wellness Center No. Wellness Center No.Average patients per Doctor
Average patients per Pharmacist
Wellness Center No.1 73 110
Wellness Center No.2 65 130
Wellness Center No.3 61 92
Wellness Center No.4 57 114
Wellness Center No.5 59 118
Wellness Center No.6 75 112
Wellness Center No.7 48 80
Wellness Center No.8 87 87
Wellness Center No.9 89 89

5-year Attendance PatternW.C.# 2010 2011 2012 2013 2014 2015 2016 2017 2018
1 12,354 18,204 27,799 35,063 40,011 51,165 60,331 60,742 67,093
2 40,944 38,760 46,639 52,489 53,177 63,847 63,414 58,508 71,629
3 29,873 34,650 38,415 42,461 41,394 45,768 46,188 42,141 49,741
4 27,305 24,540 24,800 27,595 29,955 31,015 31,685 32,027 36,172
5 40,442 42,205 46,729 54,210 58,940 67,932 76,010 74,759 82,399
6 56,678 55,668 60,801 65,864 64,977 63,644 65,721 66,344 72,313
7 62,416 77,591 70,975 71,731 79,396 89,596 87,136 80,731 85,429
8 117 1,956 23,960 32,914 36,637 45,932
9 87 679 8,925 14,384 15,569 19,619
TOTAL 2,72,022 2,93,629 3,18,170 3,51,630 3,72,499 4,47,867 4,79,799 4,69,475 5,32,345
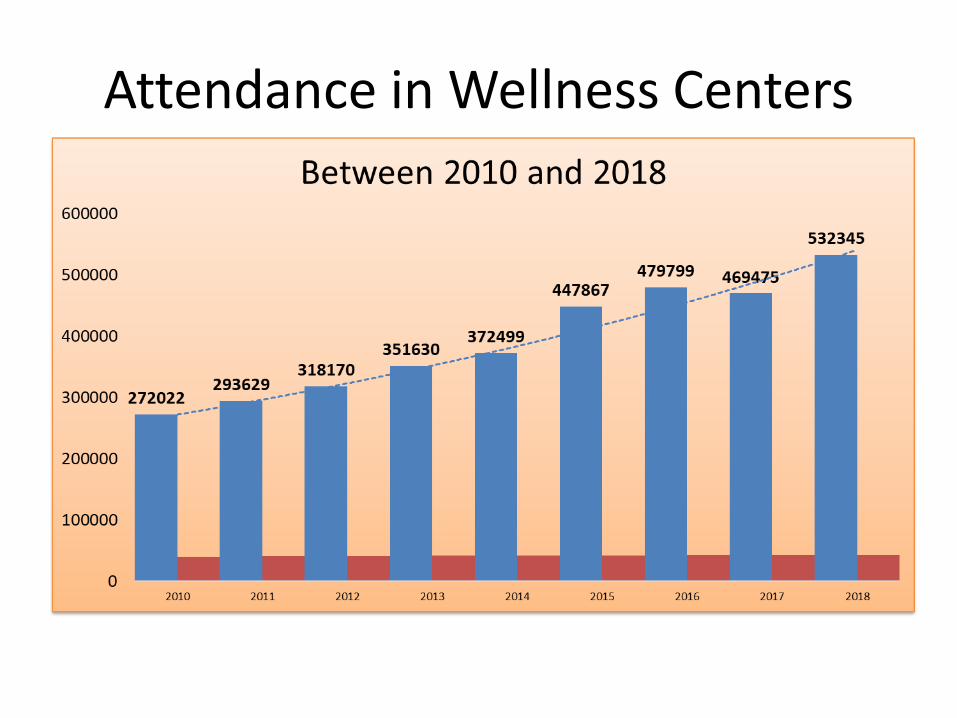
Attendance in Wellness Centers

Growth in OPD Attendance Across Wellness Centers
Y-o-Y % GROWTH IN ATTENDANCE
W.C.# 2011 2012 2013 2014 2015 2016 2017 2018 2010-18
1 47.35 52.71 26.13 14.11 27.88 17.91 0.68 10.46 443.09
2 -5.33 20.33 12.54 1.31 20.07 -0.68 -7.74 22.43 74.94
3 15.99 10.87 10.53 -2.51 10.57 0.92 -8.76 18.03 66.51
4 -10.13 1.06 11.27 8.55 3.54 2.16 1.08 12.94 32.47
5 4.36 10.72 16.01 8.73 15.26 11.89 -1.65 10.22 103.75
6 -1.78 9.22 8.33 -1.35 -2.05 3.26 0.95 9.00 27.59
7 24.31 -8.53 1.07 10.69 12.85 -2.75 -7.35 5.82 36.87
8 1571.79 1124.95 37.37 11.31 25.37 91.70
9 680.46 1214.43 61.17 8.24 26.01 119.82
TOTAL 7.94 8.36 10.52 5.93 20.23 7.13 -2.15 13.39 95.70

Wellness Center wise increase in Attendance

Patient Waiting Time in Wellness Centers
13
• Continuous Increase in Attendance over 5 Years
• Average Waiting Time of 12 Minutes
• Increase in Average Waiting Time from 12 Minutes to 17 Minutes
• 10% of Patients with Waiting Time as 40 Minutes
2014 2015 2016 2017 2018 2019
Time
20K
25K
30K
35K
40K
Mo
nth
lyV
isits
TotalMonthlyVisitsover5Years
2014 2015 2016 2017 2018
0 20 40 60 0 20 40 60 0 20 40 60 0 20 40 60 0 20 40 60
0%
2.5%
5%
7.5%
10%
%o
fT
ota
lC
oun
t
0%
25%
50%
75%
100%
Ru
nn
ingS
um
ofC
oun
ts(
%)
EachPatientWaitingTimeDistributionOver5Years
0 20 40 60 80 100 120 140 160 180
IndividualWaitingTime(minutes)
0%
2%
4%
6%
8%
10%
%o
fT
ota
lC
oun
t
0%
20%
40%
60%
80%
100%
Ru
nnin
gS
um
of
Cou
nt(%
)
EachPatientWaitingTimeDistribution:95%Patientshave<65minWaitTime
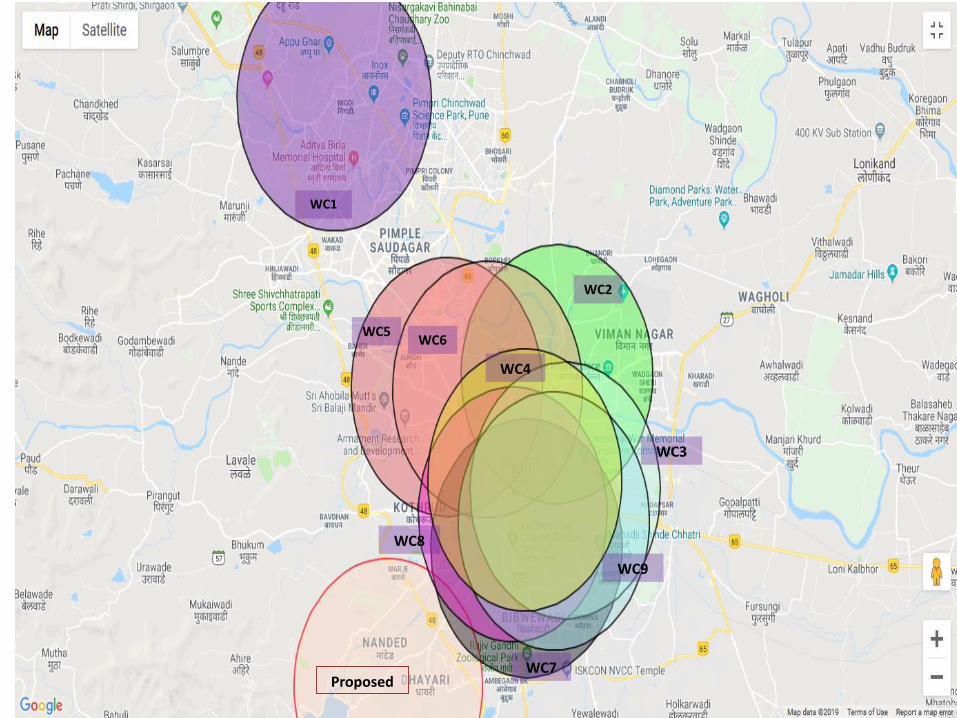
WC1
WC2
WC3
WC4
WC5WC6
WC7
WC8
WC9
Proposed
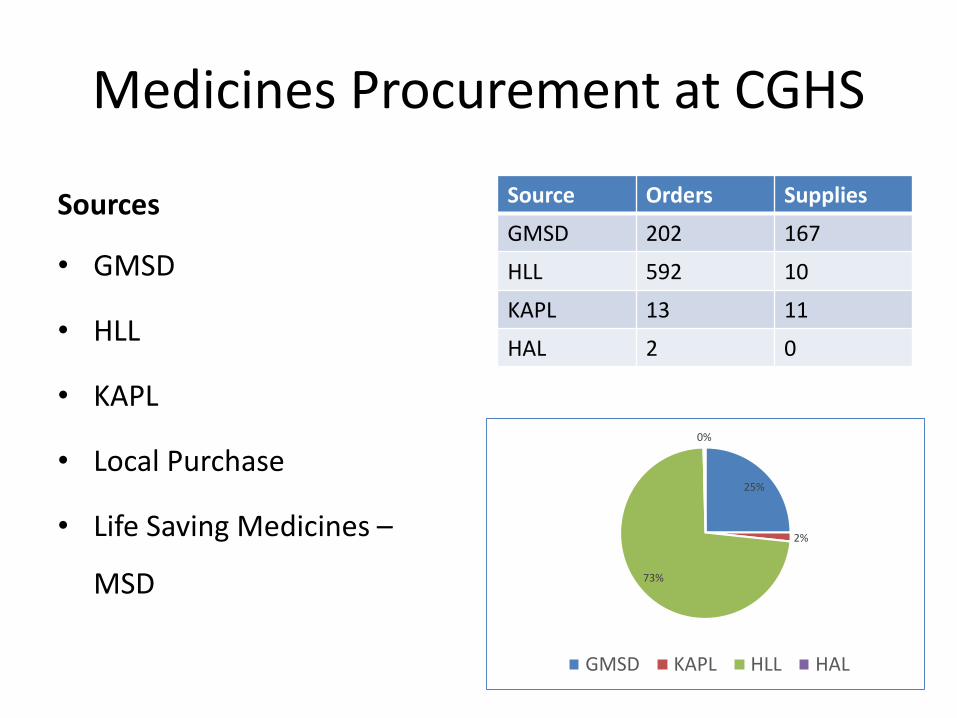
Medicines Procurement at CGHS
Sources
• GMSD
• HLL
• KAPL
• Local Purchase
• Life Saving Medicines –
MSD
Source Orders Supplies
GMSD 202 167
HLL 592 10
KAPL 13 11
HAL 2 0
25%
2%
73%
0%
GMSD KAPL HLL HAL

Local Purchase fromAuthorized Local Chemists
L P Medicine supplies in May –June 2019 (average)
WCTotal
IndentedNext Working
Day% Supplies in 1 days
Within 2 days
% Supplies in 2 days
More than 2 days
% Supplies > 2 days
WC-1 3184 2954 92.78% 206 6.47% 24 0.75%
WC-4 1974 1838 93.11% 11 0.56% 0 0.00%
WC-5 4178 4168 99.76% 10 0.24% 0 0.00%
WC-6 3837 3562 92.83% 12 0.31% 13 0.34%
WC-7 4035 3926 97.30% 103 2.55% 5 0.12%
WC-8 4801 4648 96.81% 101 2.10% 52 1.08%
WC-9 2226 2176 97.75% 48 2.16%% 2 0.09%
Grand Total
24235 23272 96.03% 491 2.03% 96 0.40%

Empanelled Hospitals / HCOs
Total Empanelled HCOs 51
General Hospitals 30
Eye Clinics 11
Dental Clinics 2
Orthopaedic Hospitals 4
Diagnostic Laboratories 4

MRC-related statistics for CGHS Pune January to July 2019
No. of MRC Received 695
MRC Cleared 573
Claims returned/rejected 75
Sent for approval of Ministry (High value claims)
4
Pending for clearance (less than 30 days)
43
Average claim settlement (days) 20

MRC - Historical Perspective

Hospital Admissions/Expenses2014 – 22 Cr2018 – 55 Cr
2014 – 22,4792018 – 51,212

Grievances January to June 2019
Number of complaints received 31
Number of complaints resolved 14
Number of complaints pending with CGHS
17

Special achievements by CGHS Pune
• Amarnath Yatra
• Kerala Floods
• Specialized Clinics

Improvement in services / facilities 2019
• Contacting 80+ beneficiaries
• Card self printing facility
• Online appointment system
• Facilities of Television screens at all WCs
• Specialists services increased
• Special clinics – Respiratory diseases
– Diabetes clinics – WC- 1 and WC- 6

Future plans
• Opening of laboratory services WC -1
• Expansion of WC- 2
• Completion of renovation work at WC- 5
• Better infrastructure at WC- 3 & WC- 5
• Wi-Fi enabled wellness centers and use of facilities
• Better display of list of HCOs.- ( Standies & Flex prints)

CGHS PUNEDETAILS OF 80+ BENEFICIARIES CONTACTED BY WELLNESS CENTERS
NAME OF WELLNESS CENTER Apr-19 May-19 Jun-19
WELLNESS CENTER1 249 234 247
WELLNESS CENTER2 153 101 129
WELLNESS CENTER3 115 227 173
WELLNESS CENTER4 442 419 50
WELLNESS CENTER5 41 120 116
WELLNESS CENTER6 9 12 10
WELLNESS CENTER7 503 721 628
WELLNESS CENTER8 76 67 68
WELLNESS CENTER9 34 33 28
Back

Back

Back

Special Respiratory Diseases Programs Back

Pulmonary Rehabilitation Program
Back

Wellness Center No.1, Akurdi
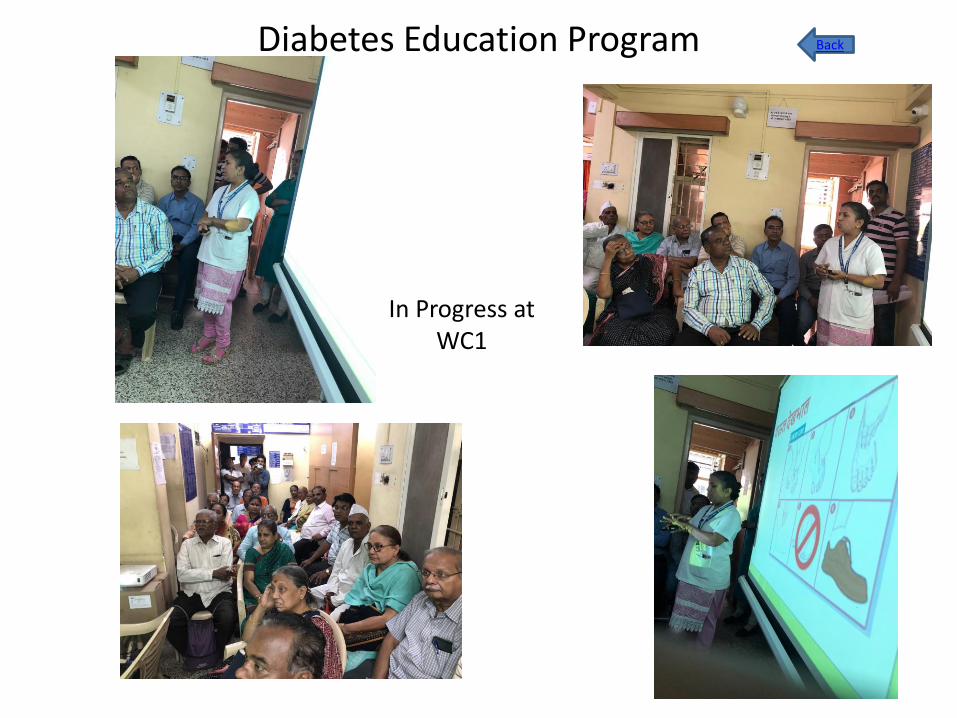
Diabetes Education Program
In Progress at WC1
Back