CFMB Scorecard 2020 Explained - Textile Exchange
14
Corporate Fiber & Material Benchmark: Scorecard Explained Textile Exchange © 2020 | Page 1 CFMB Scorecard 2020 Explained The digital scorecards provide participants of the Corporate Fiber and Materials Benchmark (CFMB) program a confidential analysis of their results, including comparisons to their sub-sector and the overall sector average. These results form the basis of the public-facing Material Change Index (MCI). Companies can access their digital scorecards in their CFMB portal on https://cfmb.textileexchange.org. In order to share scorecards with colleagues, invitations to access the portal can be shared as specified in the Technical Guide or email [email protected] for support. Scorecard Structure The confidential scorecard that a company receives is based on the benchmark option and scorecard option selected by the company. MCI, modular and tracker scorecards provide different levels of detail. Textile Exchange members that have completed either the full MCI or a modular entry are all eligible for the advanced scorecard as part of their membership dues. Non-members receive the standard scorecard, and Progress Tracker entries receive a modified standard scorecard. Standard, advanced and premium scorecards contain the following results. Premium scorecards are a build upon the standard and advanced option. Companies wishing to receive a Premium (tailored assessment) in addition to the digital scorecard provided online can contact [email protected] for details. Scorecard Options Standard Advanced, Premium Benchmark Options Tracker Modular MCI Tracker Modular MCI Overall Scorecard Results Company Profile ✓ ✓ ✓ n/a ✓ ✓ Overall Results Material Change Index ✓ n/a ✓ SDG Index ✓ n/a ✓ Section Results Section I: Strategy ✓ n/a ✓ Section II: Materials Portfolio ✓ n/a ✓ Section III: Circularity ✓ n/a ✓ Overall Materials Portfolio Materials Balance Sheet ✓ ✓ ✓ n/a ✓ ✓ Overall Portfolio Trend ✓ ✓ ✓ n/a ✓ ✓ Overall Preferred Portfolio Trend ✓ ✓ ✓ n/a ✓ ✓ Overall Progress Analysis n/a ✓ ✓ Overall Outcomes and Impacts Impact Footprints n/a ✓ ✓ Outcomes n/a ✓ ✓ Overall SDG Key Contributions ✓ n/a ✓ ✓ Section Results Section Results ✓ ✓ n/a ✓ ✓ Section Results ✓ ✓ n/a ✓ ✓ Materials Module Results Material Module Results Materials Module Score ✓ ✓ n/a ✓ ✓ Management and Performance Score ✓ ✓ n/a ✓ ✓ Material Portfolio ✓ ✓ ✓ n/a ✓ ✓ Preferred Portfolio Trend ✓ ✓ ✓ n/a ✓ ✓ Portfolio Milestones Portfolio Milestones ✓ ✓ ✓ n/a ✓ ✓ Ranking by Volume ✓ ✓ ✓ n/a ✓ ✓ Outcomes and impactsError! Reference source not found. Impact Footprints n/a ✓ ✓ Outcomes n/a ✓ ✓ Sustainable Development Goals Key Contributions ✓ n/a ✓ ✓ Detailed Results ✓ ✓ n/a ✓ ✓
Transcript of CFMB Scorecard 2020 Explained - Textile Exchange

Corporate Fiber & Material Benchmark: Scorecard Explained
Textile Exchange © 2020 | Page 1
CFMB Scorecard 2020 Explained
The digital scorecards provide participants of the Corporate Fiber and Materials Benchmark (CFMB) program a confidential analysis of their results, including comparisons to their sub-sector and the overall sector average. These results form the basis of the public-facing Material Change Index (MCI). Companies can access their digital scorecards in their CFMB portal on https://cfmb.textileexchange.org. In order to share scorecards with colleagues, invitations to access the portal can be shared as specified in the Technical Guide or email [email protected] for support.
Scorecard Structure
The confidential scorecard that a company receives is based on the benchmark option and scorecard option selected by the company. MCI, modular and tracker scorecards provide different levels of detail. Textile Exchange members that have completed either the full MCI or a modular entry are all eligible for the advanced scorecard as part of their membership dues. Non-members receive the standard scorecard, and Progress Tracker entries receive a modified standard scorecard. Standard, advanced and premium scorecards contain the following results. Premium scorecards are a build upon the standard and advanced option. Companies wishing to receive a Premium (tailored assessment) in addition to the digital scorecard provided online can contact [email protected] for details.
Scorecard Options Standard Advanced, Premium
Benchmark Options Tracker Modular MCI Tracker Modular MCI
Overall ScorecardResults
Company Profile ✓ ✓ ✓ n/a ✓ ✓
Overall Results Material Change Index ✓ n/a ✓
SDG Index ✓ n/a ✓
Section Results Section I: Strategy ✓ n/a ✓
Section II: Materials Portfolio ✓ n/a ✓
Section III: Circularity ✓ n/a ✓
Overall Materials Portfolio Materials Balance Sheet ✓ ✓ ✓ n/a ✓ ✓
Overall Portfolio Trend ✓ ✓ ✓ n/a ✓ ✓
Overall Preferred Portfolio Trend ✓ ✓ ✓ n/a ✓ ✓
Overall Progress Analysis n/a ✓ ✓
Overall Outcomes and Impacts
Impact Footprints n/a ✓ ✓
Outcomes n/a ✓ ✓
Overall SDG Key Contributions
✓ n/a ✓ ✓
Section Results
Section Results ✓ ✓ n/a ✓ ✓
Section Results ✓ ✓ n/a ✓ ✓
Materials Module Results
Material Module Results Materials Module Score ✓ ✓ n/a ✓ ✓
Management and Performance Score ✓ ✓ n/a ✓ ✓
Material Portfolio ✓ ✓ ✓ n/a ✓ ✓
Preferred Portfolio Trend ✓ ✓ ✓ n/a ✓ ✓
Portfolio Milestones Portfolio Milestones ✓ ✓ ✓ n/a ✓ ✓
Ranking by Volume ✓ ✓ ✓ n/a ✓ ✓
Outcomes and impactsError! Reference source not found.
Impact Footprints n/a ✓ ✓
Outcomes n/a ✓ ✓
Sustainable Development
Goals Key Contributions
✓ n/a ✓ ✓
Detailed Results ✓ ✓ n/a ✓ ✓

Corporate Fiber & Material Benchmark: Scorecard Explained
Textile Exchange © 2020 | Page 2
Navigation
Provides easy access to sections and
modules that companies have completed.
Allows the company to download and/or print a PDF of the scorecard (new this year).
Provides basic guidance on the navigation and use of the scorecard.
Info buttons are available throughout the scorecard and provide easy reference on scope and coverage of the score.
Provides a link to the public listing of the Material Change Index 2020.
Detailed Results provide quick links to sections and material modules.
Provides a link to the methodology used to compute all the scores in the benchmark.
Overview Page
Company Profile
• Headquarters: Company’s headquarter.
• Company Size: Large (>251 full-time employees), Medium (51-250 full-time employees), Small (11-50 full-time employees) and Micro (<11 full-time employees).
• Textile Exchange Member: Yes or No.
• Entry Status: New (in 2020) or Returnee (from 2019).
• Survey Scope: Full, Modular or Progress Tracker.
• Sub-sector: Apparel/Footwear, Outdoor/Sports, Home/Hospitality or Multi-Sector.
• Reporting Scope: An independent, subsidiary or affiliate company, or holding company.
• Subsidiaries: List of all subsidiaries covered by the company’s submission.
Overall Results
Overall results display a company’s current year results benchmarked against the company’s previous year results , current year sub-sector results and sector results
.
Four performance bands apply across the results: Band 1 - Developing 0 ≥ 25), Band 2 - Establishing (25 ≥ 50), Band 3 - Maturing (50 ≥ 75) and Band 4 - Leading (75 ≤ 100).
Material Change Index
The Material Change Index (MCI) is the result of the overall performance of a company that completed the full MCI survey, based on an assessment of Strategy (25%), Material Portfolio (65%) and Circularity (10%). The MCI requires a company to report on all priority materials from the options provided.
Corporate Fiber & Material Benchmark: Scorecard Explained
Textile Exchange © 2020 | Page 3
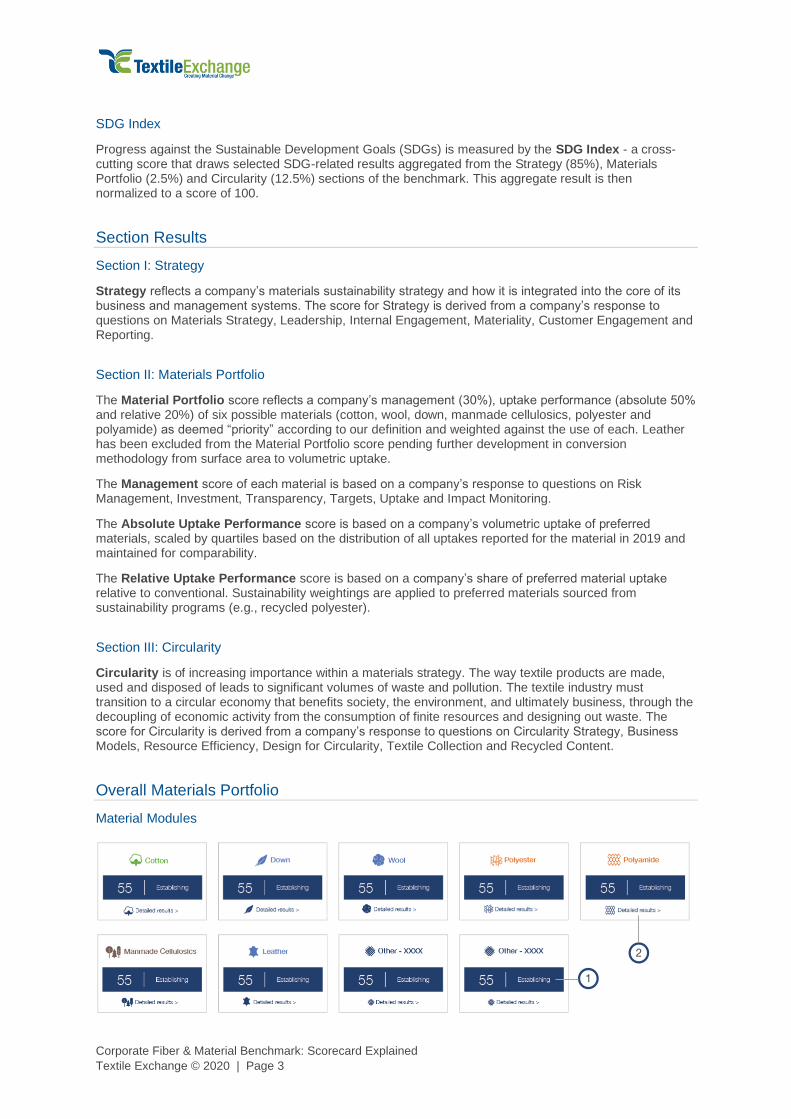
SDG Index
Progress against the Sustainable Development Goals (SDGs) is measured by the SDG Index - a cross-cutting score that draws selected SDG-related results aggregated from the Strategy (85%), Materials Portfolio (2.5%) and Circularity (12.5%) sections of the benchmark. This aggregate result is then normalized to a score of 100.
Section Results
Section I: Strategy
Strategy reflects a company’s materials sustainability strategy and how it is integrated into the core of its business and management systems. The score for Strategy is derived from a company’s response to questions on Materials Strategy, Leadership, Internal Engagement, Materiality, Customer Engagement and Reporting.
Section II: Materials Portfolio
The Material Portfolio score reflects a company’s management (30%), uptake performance (absolute 50% and relative 20%) of six possible materials (cotton, wool, down, manmade cellulosics, polyester and polyamide) as deemed “priority” according to our definition and weighted against the use of each. Leather has been excluded from the Material Portfolio score pending further development in conversion methodology from surface area to volumetric uptake.
The Management score of each material is based on a company’s response to questions on Risk Management, Investment, Transparency, Targets, Uptake and Impact Monitoring.
The Absolute Uptake Performance score is based on a company’s volumetric uptake of preferred materials, scaled by quartiles based on the distribution of all uptakes reported for the material in 2019 and maintained for comparability.
The Relative Uptake Performance score is based on a company’s share of preferred material uptake relative to conventional. Sustainability weightings are applied to preferred materials sourced from sustainability programs (e.g., recycled polyester).
Section III: Circularity
Circularity is of increasing importance within a materials strategy. The way textile products are made, used and disposed of leads to significant volumes of waste and pollution. The textile industry must transition to a circular economy that benefits society, the environment, and ultimately business, through the decoupling of economic activity from the consumption of finite resources and designing out waste. The score for Circularity is derived from a company’s response to questions on Circularity Strategy, Business Models, Resource Efficiency, Design for Circularity, Textile Collection and Recycled Content.
Overall Materials Portfolio
Material Modules

Corporate Fiber & Material Benchmark: Scorecard Explained
Textile Exchange © 2020 | Page 4
The Material Module tiles provide a summary of Material Module Scores and easy access to Material Module Result pages .
Materials Balance Sheet
The Materials Balance Sheet (MBS) provides a summary of the materials (fiber and non-fibers) that a company uses, priority status for the company, absolute uptake and share of preferred renewable, recycled and conventional.
Note: The MBS will only display data if absolute uptake is reported or estimated by a company for a material, otherwise “incalculable” is shown.
Overall Portfolio Trend
The Overall Portfolio Trend visualizes a company’s year-on-year use of cotton, wool, down, manmade cellulosics, polyester and polyamide, taking into account any adjustments made to historical uptake.
Leather is excluded from this analysis as it is typically reported in square meters. There is allocated space to report volumes of other materials in the MBS but they are not yet included in the portfolio trend analysis.
Corporate Fiber & Material Benchmark: Scorecard Explained
Textile Exchange © 2020 | Page 5
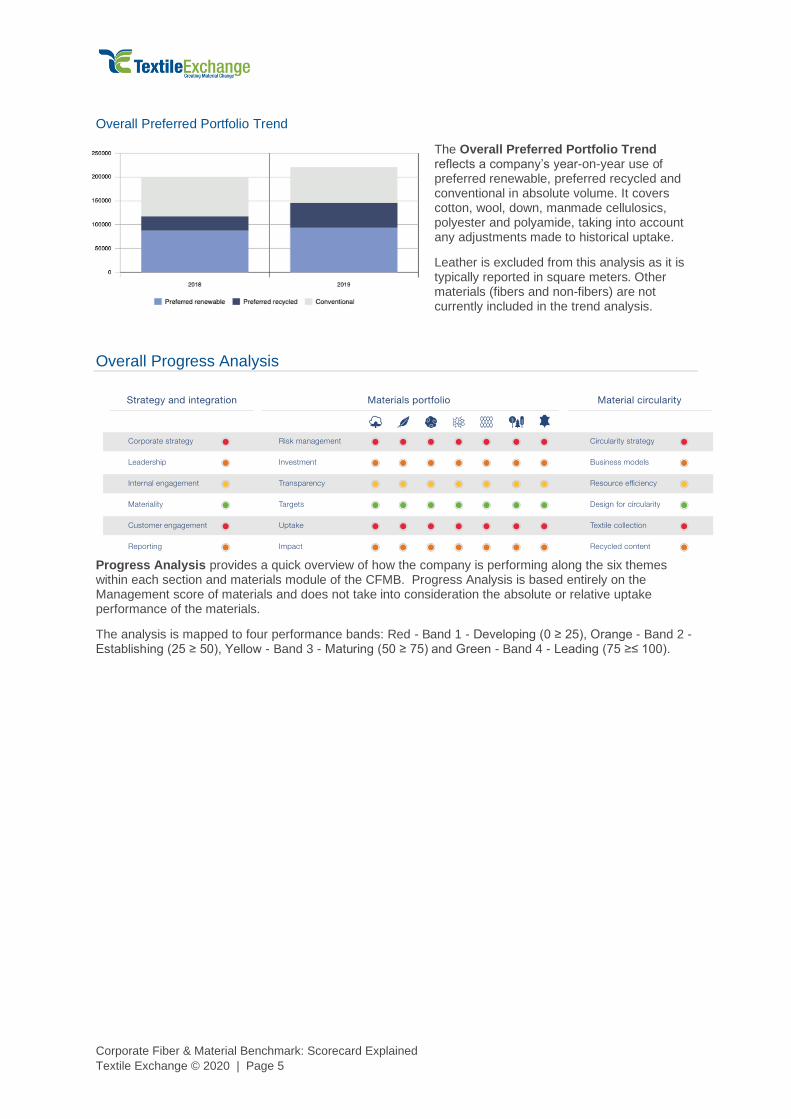
Overall Preferred Portfolio Trend
The Overall Preferred Portfolio Trend reflects a company’s year-on-year use of preferred renewable, preferred recycled and conventional in absolute volume. It covers cotton, wool, down, manmade cellulosics, polyester and polyamide, taking into account any adjustments made to historical uptake.
Leather is excluded from this analysis as it is typically reported in square meters. Other materials (fibers and non-fibers) are not currently included in the trend analysis.
Overall Progress Analysis
Progress Analysis provides a quick overview of how the company is performing along the six themes within each section and materials module of the CFMB. Progress Analysis is based entirely on the Management score of materials and does not take into consideration the absolute or relative uptake performance of the materials.
The analysis is mapped to four performance bands: Red - Band 1 - Developing (0 ≥ 25), Orange - Band 2 - Establishing (25 ≥ 50), Yellow - Band 3 - Maturing (50 ≥ 75) and Green - Band 4 - Leading (75 ≥≤ 100).
Corporate Fiber & Material Benchmark: Scorecard Explained
Textile Exchange © 2020 | Page 6
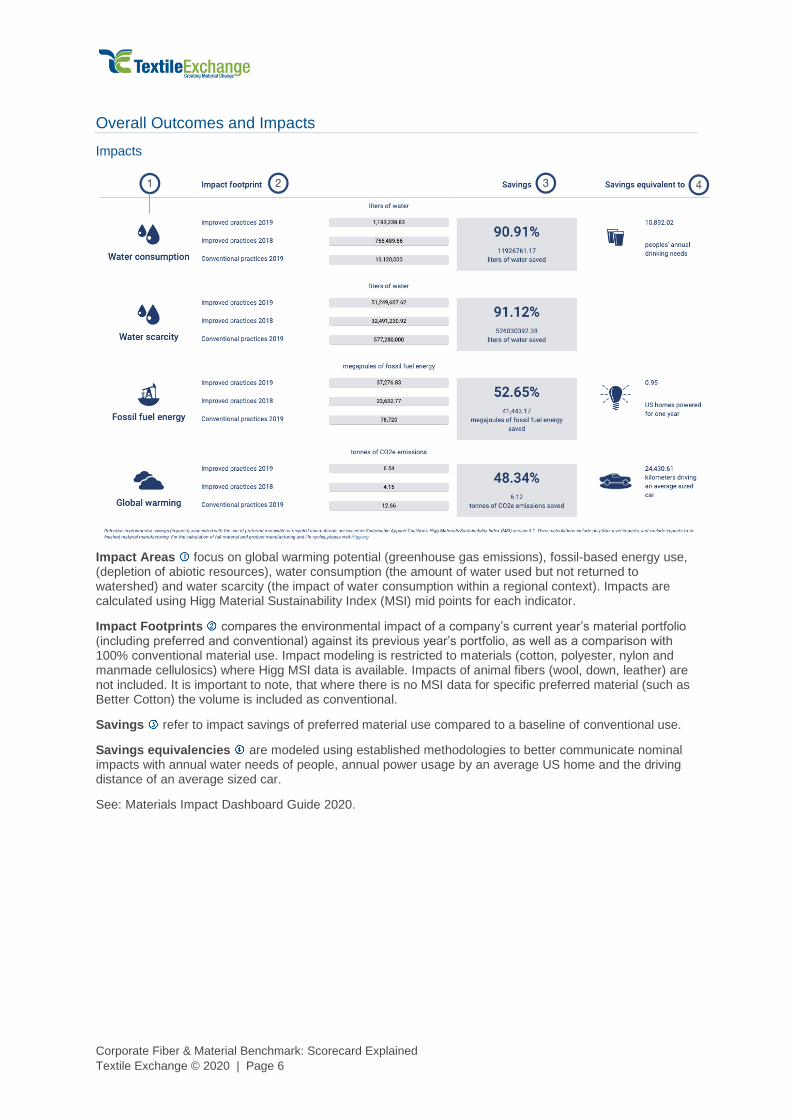
Overall Outcomes and Impacts
Impacts
Impact Areas focus on global warming potential (greenhouse gas emissions), fossil-based energy use, (depletion of abiotic resources), water consumption (the amount of water used but not returned to watershed) and water scarcity (the impact of water consumption within a regional context). Impacts are calculated using Higg Material Sustainability Index (MSI) mid points for each indicator.
Impact Footprints compares the environmental impact of a company’s current year’s material portfolio (including preferred and conventional) against its previous year’s portfolio, as well as a comparison with 100% conventional material use. Impact modeling is restricted to materials (cotton, polyester, nylon and manmade cellulosics) where Higg MSI data is available. Impacts of animal fibers (wool, down, leather) are not included. It is important to note, that where there is no MSI data for specific preferred material (such as Better Cotton) the volume is included as conventional.
Savings refer to impact savings of preferred material use compared to a baseline of conventional use.
Savings equivalencies are modeled using established methodologies to better communicate nominal impacts with annual water needs of people, annual power usage by an average US home and the driving distance of an average sized car.
See: Materials Impact Dashboard Guide 2020.

Corporate Fiber & Material Benchmark: Scorecard Explained
Textile Exchange © 2020 | Page 7
Outcomes
Outcome Areas calculate intentional benefit from improved practices, but outcomes are not necessarily associated with a proven impact. At a portfolio level, outcomes are aggregated for Land Use and Resource Use (waste diverted). Number of farmers and households benefiting from improved practices are approximated for cotton, and animals (sheep, ducks/geese) for down and wool production.
Outcomes compare the effects of a company’s current year preferred material use against previous year as well as the effects of conventional material use. Based on available data, outcome modeling for Land Use is currently restricted to cotton, wool and manmade cellulosics. Resource Use covers all listed materials.
Benefits refer to effective savings or other improvements related to preferred material use as a share of total material use.
Savings equivalencies are calculated using established methodologies to better communicate nominal effects with number of football fields (for Land Use) and number of 12-tonne garbage trucks (of waste) for Resource Use.
See: Materials Impact Dashboard Guide 2020.
Overall SDG Key Contributions
All SDGs are interconnected and the prioritization of one must not come at the expense of another. Companies may have identified their own priority SDGs which may differ from the SDGs in the Dashboard. Tracking progress should be set at the SDG Target and Indicator level, rather than the Goal level.
SDG “input, outcome, and impact” modeling presented here is based entirely on Textile Exchange’s modeling, and interpretation of how the SDGs align with materials input, outcome, impact modeling assumptions.
• Inputs : SDG 12 Responsible Production & Consumption is the gateway to many of the other SDGs, such as no poverty, sustainable agriculture/zero hunger, land use, life under water and industry innovation. To achieve the 2030 Goals, many stakeholders must work together, and SDG 17 Partnerships for the Goals will be key to success.
• Outcomes : Investment in sustainability programs, innovation and responsible sourcing contributes to beneficial outcomes for people and planet: SDG 1 no poverty, SDG 2 zero hunger (and sustainable agriculture), SDG 9 industry, innovation and infrastructure, SDG 14 life under water, and SDG 15 life on land.
Corporate Fiber & Material Benchmark: Scorecard Explained
Textile Exchange © 2020 | Page 8
• Impacts : Through improved practices and innovations on the land and in the mills, and through the implementation of a materials circularity strategy, there is considerable potential to positively impact SDG 6 clean water, SDG 7 clean energy (including the transition to renewables), and SDG 13 climate action.
See: Sustainable Development Goals (SDG) Companion Guide
Section Results
Section Results
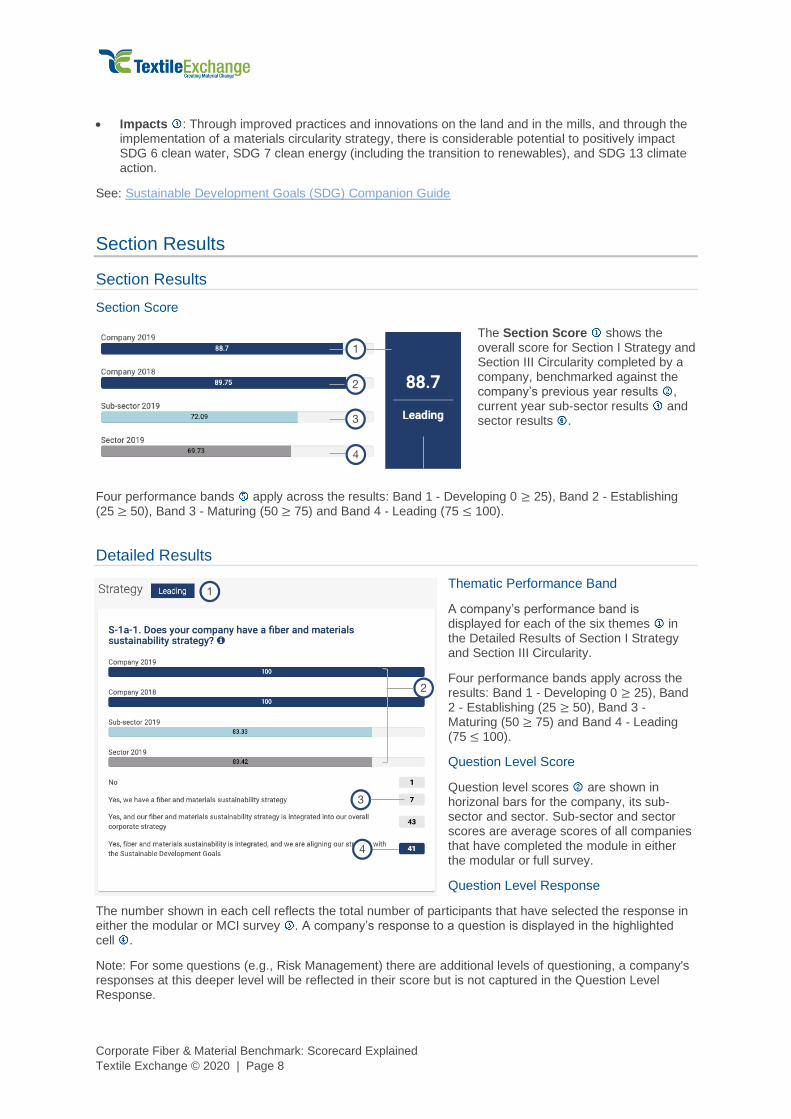
Section Score
The Section Score shows the overall score for Section I Strategy and Section III Circularity completed by a company, benchmarked against the company’s previous year results , current year sub-sector results and sector results .
Four performance bands apply across the results: Band 1 - Developing 0 ≥ 25), Band 2 - Establishing (25 ≥ 50), Band 3 - Maturing (50 ≥ 75) and Band 4 - Leading (75 ≤ 100).
Detailed Results
Thematic Performance Band
A company’s performance band is displayed for each of the six themes in the Detailed Results of Section I Strategy and Section III Circularity.
Four performance bands apply across the results: Band 1 - Developing 0 ≥ 25), Band 2 - Establishing (25 ≥ 50), Band 3 - Maturing (50 ≥ 75) and Band 4 - Leading (75 ≤ 100).
Question Level Score
Question level scores are shown in horizonal bars for the company, its sub-sector and sector. Sub-sector and sector scores are average scores of all companies that have completed the module in either the modular or full survey.
Question Level Response
The number shown in each cell reflects the total number of participants that have selected the response in either the modular or MCI survey . A company’s response to a question is displayed in the highlighted cell .
Note: For some questions (e.g., Risk Management) there are additional levels of questioning, a company's responses at this deeper level will be reflected in their score but is not captured in the Question Level Response.

Corporate Fiber & Material Benchmark: Scorecard Explained
Textile Exchange © 2020 | Page 9
Material Module Results
Material Module Results
Material Module Score
The Material Module Score shows the overall score for the module completed by a company, benchmarked against the company’s previous year results , current year sub-sector results and sector results . It comprises of Management (30%), Absolute Uptake Performance (50%) and Relative Uptake Performance (20%) of the specific material.
Four performance bands apply across the results: Band 1 - Developing 0 ≥ 25), Band 2 - Establishing (25 ≥ 50), Band 3 - Maturing (50 ≥ 75) and Band 4 - Leading (75 ≤ 100).
The number of companies participating in the module comprise only modular and MCI participants.
Management and Performance Score
The Management Score reflects how well a company is managing its materials sourcing and is based on a company’s response to questions on Section II on Risk Management, Investment, Transparency, Targets, Uptake and Impact Monitoring of the specific material.
The Relative Uptake Performance Score is based on a company’s share of preferred material uptake relative to conventional. Sustainability
weightings are applied to preferred materials sourced from sustainability programs (e.g., recycled polyester).
The Absolute Uptake Performance Score is assigned 50% of the fiber portfolio score. The Absolute Uptake Performance score is based on a company’s volumetric uptake of preferred materials, scaled by quartiles based on the distribution of all uptakes reported for the material in 2019 and maintained for comparability.
Note: Specific scores may be displayed on hover .

Corporate Fiber & Material Benchmark: Scorecard Explained
Textile Exchange © 2020 | Page 10
Material Portfolio
The Material Portfolio visualizes the breakdown of conventional and programs used for the specific material.
Note: Specific material uptake (%) may be displayed on hover .
Preferred Portfolio Trend
The Preferred Portfolio Trend reflects a company’s year-on-year use of preferred renewable
, preferred recycled and conventional in absolute volume for the specific material, taking into account any adjustments made to historical uptake.
Note: Specific scores may be displayed on hover .
Programs In Use
Programs used for the specific material.
Portfolio Milestones
Portfolio Milestones
Portfolio Milestones reflects the number of companies that have achieved a milestone material portfolio uptake .
The numbers in the boxes indicate the number of companies that have achieved specific milestones. Boxes in green indicate the milestones achieved by the reporting company. Portfolio milestones are reported in accumulative (i.e. a company that achieved 100% preferred (organic, organic fairtrade, recycled) will also be marked as having achieved 100% preferred and 50% preferred).
Portfolio milestones include:
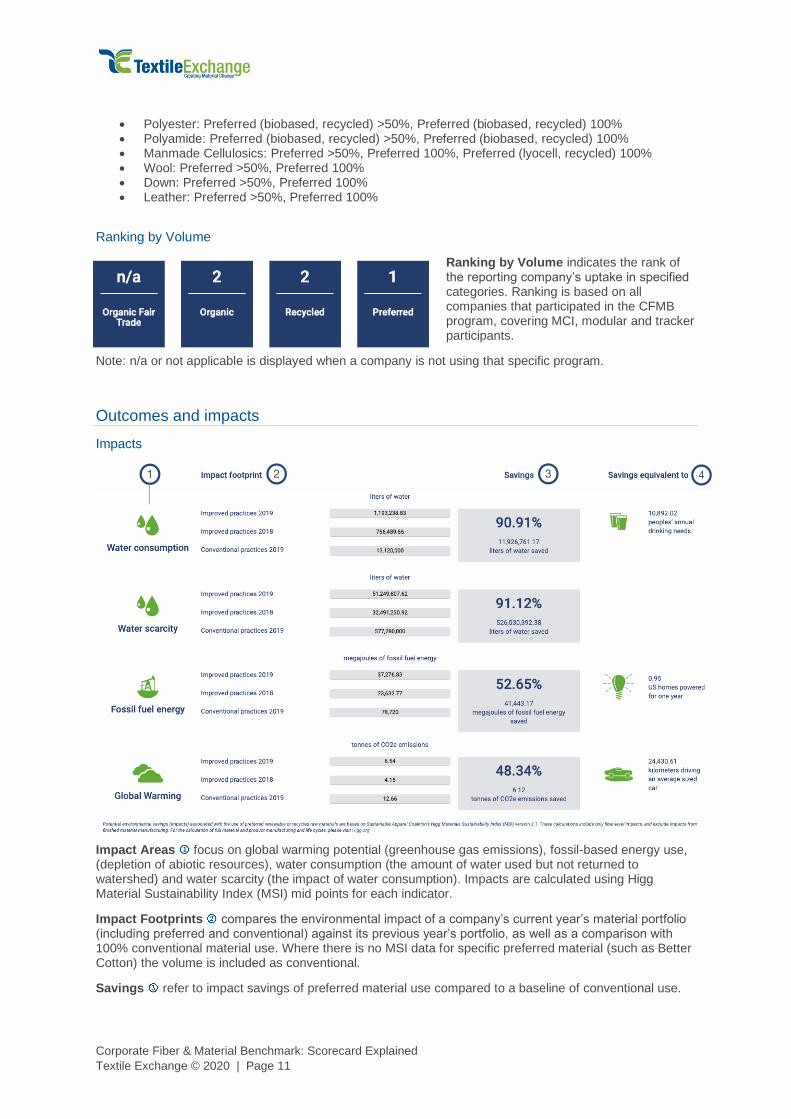
• Cotton: Preferred >50%, Preferred 100%, Preferred (organic, organic fairtrade, recycled) 100%
Corporate Fiber & Material Benchmark: Scorecard Explained
Textile Exchange © 2020 | Page 11
• Polyester: Preferred (biobased, recycled) >50%, Preferred (biobased, recycled) 100% • Polyamide: Preferred (biobased, recycled) >50%, Preferred (biobased, recycled) 100% • Manmade Cellulosics: Preferred >50%, Preferred 100%, Preferred (lyocell, recycled) 100% • Wool: Preferred >50%, Preferred 100% • Down: Preferred >50%, Preferred 100% • Leather: Preferred >50%, Preferred 100%
Ranking by Volume
Ranking by Volume indicates the rank of the reporting company’s uptake in specified categories. Ranking is based on all companies that participated in the CFMB program, covering MCI, modular and tracker participants.
Note: n/a or not applicable is displayed when a company is not using that specific program.
Outcomes and impacts
Impacts
Impact Areas focus on global warming potential (greenhouse gas emissions), fossil-based energy use, (depletion of abiotic resources), water consumption (the amount of water used but not returned to watershed) and water scarcity (the impact of water consumption). Impacts are calculated using Higg Material Sustainability Index (MSI) mid points for each indicator.
Impact Footprints compares the environmental impact of a company’s current year’s material portfolio (including preferred and conventional) against its previous year’s portfolio, as well as a comparison with 100% conventional material use. Where there is no MSI data for specific preferred material (such as Better Cotton) the volume is included as conventional.
Savings refer to impact savings of preferred material use compared to a baseline of conventional use.

Corporate Fiber & Material Benchmark: Scorecard Explained
Textile Exchange © 2020 | Page 12
Savings equivalencies are calculated using established methodologies to better communicate nominal impacts with annual water needs of people, annual power usage of average US homes and driving distance of an averaged sized car.
See: Materials Impact Dashboard Guide 2020.
Outcomes
Outcome Areas are intentionally a measure of benefit but are not necessarily associated with a proven impact. Outcome areas are aggregated in the following manner:
• Cotton: Land Use, Resource Use and Farmers Covered. • Polyester: Resource Use and Bottles Covered. • Polyamide: Resource Use. • Wool: Resource Use and Sheep Covered. • Down: Resource Use and Birds Covered. • Leather: Resource Use and Hides Covered.
Outcomes compare the effects of a company’s current year preferred material use against previous year as well as the effects of conventional material use.
Savings refer to effect savings of preferred material use as a share of total material use.
Savings equivalencies are calculated using established methodologies to better communicate nominal effects of outcomes:
• Cotton: Number of football fields, Number (capacity) of 12 tonne garbage trucks and Number of households.
• Polyester: Number of 12 tonne garbage trucks. • Polyamide: Number of 12 tonne garbage trucks. • Wool: Number of 12 tonne garbage trucks. • Down: Number of 12 tonne garbage trucks. • Leather: Number of 12 tonne garbage trucks and Number of cows.
See: Materials Impact Dashboard Guide 2020.

Corporate Fiber & Material Benchmark: Scorecard Explained
Textile Exchange © 2020 | Page 13
Sustainable Development Goals Key Contributions
All SDGs are interconnected and the prioritization of one must not come at the expense of another. Companies may have identified their own priority SDGs which may differ from the SDGs in the Dashboard. Tracking progress should be set at the SDG Target and Indicator level, rather than the Goal level.
SDG “input, outcome, and impact” modeling presented here is based entirely on Textile Exchange’s modeling, and interpretation of how the SDGs align with materials input, outcome, impact modeling assumptions.
Materials Focus Inputs Outcomes Impacts
Natural fibers: Cotton
Emphasis on people, land, natural resources and processing innovation e.g., recycling technologies.
12, 17 1, 2, 9, 15 6, 7, 13
Regenerated fibers: Manmade Cellulosics
Emphasis on natural resources and processing innovation e.g., recycling technologies.
12, 17 9, 15 6, 7, 13
Synthetic fibers: Polyester and Polyamide
Emphasis on natural resources and processing innovation e.g., recycling technologies.
12, 17 9, 14 6, 7, 13
Animal fibers and materials: Wool, Down and Leather:
Emphasis on animal welfare, land use, biodiversity, natural resources and processing innovation e.g. recycling technologies.
12, 17 2, 9, 15 -
Detailed Results
Thematic Performance Band
A company’s performance band is displayed for each of the six themes (Risk Management, Investment, Transparency, Targets, Uptake and Impact Monitoring) in the Detailed Results of the Material Module.
Four performance bands apply across the results: Band 1 - Developing 0 ≥ 25), Band 2 - Establishing (25 ≥ 50), Band 3 - Maturing (50 ≥ 75) and Band 4 - Leading (75 ≤ 100).
Question Level Score
Question level scores are shown in horizonal bars for the company, its sub-sector and sector. Sub-sector and sector scores are average scores of all companies that have completed the module in either the modular or full survey.
Question Level Response
The number shown in each cell reflects the total number of participants that have selected the response in either the modular or MCI survey . A company’s response to a question is displayed in the highlighted cell .

Corporate Fiber & Material Benchmark: Scorecard Explained
Textile Exchange © 2020 | Page 14
Note: For some questions (e.g., Risk Management) there are additional levels of questioning, a company's responses at this deeper level will be reflected in their score but is not captured in the Question Level Response.
Definitions
Sub-sector refers to “Apparel/Footwear”, “Outdoor/Sports”, “Home/Hospitality” or “Multi-Sector”.
Sector refers to the entirety of participants of the benchmark program.
Preferred, Renewable includes:
• Preferred cotton: BASF e3, Better Cotton Initiative, bioRe® Sustainable Cotton, US Trust Cotton, Cotton made in Africa, Fairtrade cotton, Field to Market, ISCC certified, myBMP, Organic cotton, Organic Fairtrade cotton, REEL Cotton, Regenerative Organic Cotton, Responsible Brazilian cotton, Transitional Organic Cotton
• Preferred renewable polyester: Bio-based polyester • Preferred renewable nylon: Bio-based nylon • Preferred manmade cellulosics: Viscose-FSC, Viscose-PEFC, Viscose-FSC/PEFC, Lyocell-FSC,
Lyocell-PEFC, Lyocell-FSC/PEFC, Modal-FSC, Modal-PEFC, Modal-FSC/PEFC, Acetate-FSC, Acetate-PEFC, Acetate-FSC/PEFC
• Preferred wool: Organic wool, Responsible Wool Standard, ZQ Certified, Ovis21 wool • Preferred down: Organic down, Responsible Down Standard, Traceable Down Standard,
Downpass
Preferred, Recycled includes:
• Preferred, recycled cotton: Recycled cotton • Preferred, recycled polyester: Recycled polyester • Preferred, recycled nylon: Recycled nylon • Preferred, recycled manmade cellulosics: Recycled cellulose - Cupro, Recycled cellulose – other,
Recycled cotton - MMC • Preferred, recycled wool: Recycled wool • Preferred, recycled down: Recycled down