CFIT Prevention Using Synthetic Vision
12
CFIT Prevention Using Synthetic Vision Jarvis J Arthur, III*, Lawrence J Prinzel, III, Lynda J Kramer, Randall E Bailey & Russell V Parrish NASA Langley Research Center, Hampton, VA ABSTRACT In commercial aviation, over 30-percent of all fatal accidents worldwide are categorized as Controlled Flight Into Terrain (CFIT) accidents where a fully functioning airplane is inadvertently flown into the ground, water, or an obstacle. An experiment was conducted at NASA Langley Research Center investigating the presentation of a synthetic terrain database scene to the pilot on a Primary Flight Display (PFD). The major hypothesis for the experiment is that a synthetic vision system (SVS) will improve the pilot’s ability to detect and avoid a potential CFIT compared to conventional flight instrumentation. All display conditions, including the baseline, contained a Terrain Awareness and Warning System (TAWS) and Vertical Situation Display (VSD) enhanced Navigation Display (ND). Sixteen pilots each flew 22 approach – departure maneuvers in Instrument Meteorological Conditions (IMC) to the terrain challenged Eagle County Regional Airport (EGE) in Colorado. For the final run, the flight guidance cues were altered such that the departure path went into the terrain. All pilots with a SVS enhanced PFD (12 of 16 pilots) noticed and avoided the potential CFIT situation. All of the pilots who flew the anomaly with the baseline display configuration (which included a TAWS and VSD enhanced ND) had a CFIT event. 1. INTRODUCTION In commercial aviation, over 30% of all fatal accidents worldwide are categorized as Controlled Flight Into Terrain (CFIT), where a mechanically sound and normally functioning airplane is inadvertently flown into the ground, water, or an obstacle, principally due to the lack of outside visual reference and situational awareness (Reference 1). The Synthetic Vision Systems (SVS) project, under NASA’s Aviation Safety Program (AvSP), is developing technologies with practical applications that will eliminate low visibility conditions as a causal factor to civil aircraft accidents (Reference 2). 1.1 Synthetic Vision Display Concepts A major thrust of the SVS project involves the development and demonstration of affordable, certifiable display configurations which provide intuitive out-the-window terrain and obstacle information, including guidance information for precision navigation and obstacle/obstruction avoidance, for Commercial and Business aircraft. In addition to forward-fit applications, a path to retrofit this technology into today’s transport aircraft fleet is also necessary to achieve the desired safety benefits since 66% of today’s transport aircraft fleet is equipped with only electro-mechanical cockpit instrumentation. NASA’s SVS concept (Figure 1) provides a real-time, unobscured synthetic view of the world for the pilot. The display is generated by visually rendering an on-board terrain database (with additional airport and obstacle database information as necessary) using precise position and navigation data obtained through GPS (Global Positioning System) data, with augmentation possibly from differential correction sources such as Local Area Augmentation Systems (LAAS) and Wide Area Augmentation Systems (WAAS), as well as blending from on-board Inertial Navigation System (INS) information. Active imaging sensors, real-time hazard information (e.g., weather and wake vortices), and traffic information as provided by Automatic Dependent Surveillance – Broadcast (ADS-B) and Traffic Information Services - Broadcast (TIS-B) can additionally enhance this synthetic vision display concept (SVDC). Although the display representation to the pilot is synthetically derived, object detection and integrity monitoring functions are envisioned to ensure sufficient accuracy and reliability for certification. *[email protected], phone 1 757 864 6609
Transcript of CFIT Prevention Using Synthetic Vision
CFIT Prevention Using Synthetic Vision
Jarvis J Arthur, III*, Lawrence J Prinzel, III, Lynda J Kramer, Randall E Bailey & Russell V Parrish
NASA Langley Research Center, Hampton, VA
ABSTRACT
In commercial aviation, over 30-percent of all fatal accidents worldwide are categorized as Controlled Flight Into
Terrain (CFIT) accidents where a fully functioning airplane is inadvertently flown into the ground, water, or an obstacle.
An experiment was conducted at NASA Langley Research Center investigating the presentation of a synthetic terrain
database scene to the pilot on a Primary Flight Display (PFD). The major hypothesis for the experiment is that a
synthetic vision system (SVS) will improve the pilot’s ability to detect and avoid a potential CFIT compared to
conventional flight instrumentation. All display conditions, including the baseline, contained a Terrain Awareness and
Warning System (TAWS) and Vertical Situation Display (VSD) enhanced Navigation Display (ND). Sixteen pilots each
flew 22 approach – departure maneuvers in Instrument Meteorological Conditions (IMC) to the terrain challenged Eagle
County Regional Airport (EGE) in Colorado. For the final run, the flight guidance cues were altered such that the
departure path went into the terrain. All pilots with a SVS enhanced PFD (12 of 16 pilots) noticed and avoided the
potential CFIT situation. All of the pilots who flew the anomaly with the baseline display configuration (which included
a TAWS and VSD enhanced ND) had a CFIT event.
1. INTRODUCTION In commercial aviation, over 30% of all fatal accidents worldwide are categorized as Controlled Flight Into Terrain
(CFIT), where a mechanically sound and normally functioning airplane is inadvertently flown into the ground, water, or
an obstacle, principally due to the lack of outside visual reference and situational awareness (Reference 1). The
Synthetic Vision Systems (SVS) project, under NASA’s Aviation Safety Program (AvSP), is developing technologies
with practical applications that will eliminate low visibility conditions as a causal factor to civil aircraft accidents
(Reference 2).
1.1 Synthetic Vision Display Concepts
A major thrust of the SVS project involves the development and demonstration of affordable, certifiable display
configurations which provide intuitive out-the-window terrain and obstacle information, including guidance information
for precision navigation and obstacle/obstruction avoidance, for Commercial and Business aircraft. In addition to
forward-fit applications, a path to retrofit this technology into today’s transport aircraft fleet is also necessary to achieve
the desired safety benefits since 66% of today’s transport aircraft fleet is equipped with only electro-mechanical cockpit
instrumentation.
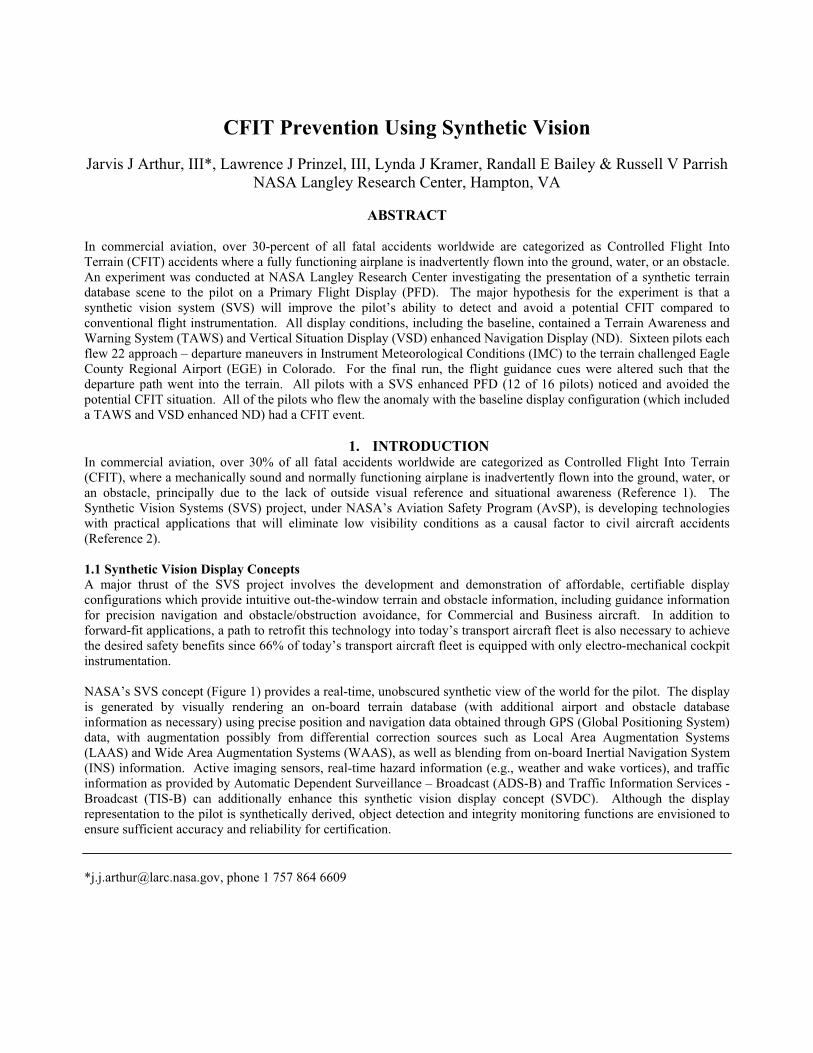
NASA’s SVS concept (Figure 1) provides a real-time, unobscured synthetic view of the world for the pilot. The display
is generated by visually rendering an on-board terrain database (with additional airport and obstacle database
information as necessary) using precise position and navigation data obtained through GPS (Global Positioning System)
data, with augmentation possibly from differential correction sources such as Local Area Augmentation Systems
(LAAS) and Wide Area Augmentation Systems (WAAS), as well as blending from on-board Inertial Navigation System
(INS) information. Active imaging sensors, real-time hazard information (e.g., weather and wake vortices), and traffic
information as provided by Automatic Dependent Surveillance – Broadcast (ADS-B) and Traffic Information Services -
Broadcast (TIS-B) can additionally enhance this synthetic vision display concept (SVDC). Although the display
representation to the pilot is synthetically derived, object detection and integrity monitoring functions are envisioned to
ensure sufficient accuracy and reliability for certification.
*[email protected], phone 1 757 864 6609

INS / GPS
(LAAS/ WAAS)
Real-time tactical
hazards (Weather,
NOTAMS)
Relevant Traffic
Information
(ADS-B, TIS-B)
INS / GPS
(LAAS/ WAAS)
INS / GPS
(LAAS/ WAAS)
Real-time tactical
hazards (Weather,
NOTAMS)
Real-time tactical
hazards (Weather,
NOTAMS)
Relevant Traffic
Information
(ADS-B, TIS-B)
Relevant Traffic
Information
(ADS-B, TIS-B)
Worldwide Terrain,Obstacle & Airport
Databases
Real-time Synthetic Vision
Display w/ Advanced Guidance
Advanced Sensors
for Database Integrity& Object Detection
Worldwide Terrain,Obstacle & Airport
Databases
Worldwide Terrain,Obstacle & Airport
Databases
Real-time Synthetic Vision
Display w/ Advanced Guidance
Real-time Synthetic Vision
Display w/ Advanced Guidance
Advanced Sensors
for Database Integrity& Object Detection
Advanced Sensors
for Database Integrity& Object Detection
Figure 1: Synthetic Vision System concept
1.2 Retrofit Approach
To date, much of the SVS research has focused on introducing SVS display technology into as many existing aircraft as
possible by providing a retrofit approach. This approach employs existing head down display (HDD) capabilities for
glass cockpits (cockpits already equipped with raster-capable HDD’s) and head-up display (HUD) capabilities for the
other aircraft. Two major NASA flight tests have occurred for assessment and evaluation of the SVS developments.
Both flight tests have used the NASA/Langley Research Center (LaRC) modified Boeing 757-200 jetliner (known as
ARIES). The first flight test was flown Sept-Oct 2000 in nighttime operations at Dallas-Ft. Worth (FAA Identifier:
DFW). The second flight test was flown Aug-Sept 2001 in simulated daylight Instrument Meteorological Conditions
(IMC) at Eagle County Regional Airport, CO (FAA Identifier: EGE). The HDD objective of these tests and past
simulator studies was to examine whether a SVS display could be retrofitted into an Electronic Flight Instrumentation
System (EFIS) Size “A” (e.g., B-757-200) Electronic Attitude Direction Indicator (EADI) and Size “D” (e.g., B-777)
Primary Flight Display (PFD). A Size “X” head-down display was also tested that may represent the display real estate
available on future aircraft. Each of the display size variations of the SVS HDD concepts evaluated included a pilot-
selectable field of view (FOV) feature to address the fixed display size limitations. Two terrain-texturing techniques
were also evaluated during the research. One method of terrain texturing, generic texturing, involved the selection of
terrain color based on absolute altitude. The other method of terrain texturing, photo-realistic texturing, employed ortho-
rectified aerial photographs draped over the elevation model. The results of those studies confirmed that a SVS display,
with pilot-selectable FOV’s, could be incorporated as part of an EFIS suite and effectively replace an EADI or PFD.
Regardless of display size, pilots reported greater situation awareness and had lower flight technical error (FTE) while
operating with the SVS displays compared to the conventional displays.
A cost-effective retrofit path for SVS in electro-mechanical cockpits may be possible by generation of a synthetic vision
image as the raster input source to a stroke-on-raster HUD. This display concept is analogous in many respects to the
Enhanced Vision System (EVS) certified on the Gulfstream V, except that the raster image is synthetically-derived
rather than being a direct imaging sensor output. Unlike EVS displays, the SVS HUD concept uses a clear sky rather
than a sensor image of the sky, so there is no obstruction in that area of the display. Below the horizon, the raster image
may obstruct the view of the outside real world (as with an EVS image), particularly if the pilot does not control the
raster brightness appropriately. Obstruction of the outside real world scene by such a display is a recognized certification
issue. In both flight trials, the SVS-HUD concept was, for all intents, just a monochromatic green representation of the
full-color, head-down display SVS concept, using an RS-343 video format. No effort was expended to examine

graphical light source or other terrain shading issues. SVS HUD concept evaluations also included the two variations in
the method of terrain texturing. Although promising results were obtained, two significant deficiencies were found in
daylight HUD usage: illegible display renditions under some direct sunlight conditions and some reported terrain
depiction illusions. The feasibility of the concept of retrofitting SVS display technology with HUD’s was verified for
nighttime operations. For both HDD and HUD applications, no significant performance effects were found between
texturing techniques, although most of the pilots preferred the photo-realistic terrain texturing technique to the generic
texturing technique.
1.3 Current Study
To prevent test subjects in an experiment from expecting a problem, ‘rare event’ simulation techniques require many
simulation trials to produce only a few trials containing the data of interest, the rare event that allows for the potential
creation of an accident scenario. The current study used the above retrofit display factors in a full factorial simulation
experiment as the backdrop for conducting a ‘rare-event’ display concept comparison experiment to directly address
CFIT avoidance benefits, which has been advanced as a primary motivation for SVS displays (another primary
motivation is to replicate the operational benefits of flight operations in bright, clear, sunny day conditions, regardless of
the outside weather). The ‘rare-event’ (a course anomaly) was imposed once on each pilot (with only one display
condition) at the conclusion of repeated exposures to IMC approach and departure operations at a terrain challenged
airport (EGE) using both conventional (1) and synthetic vision (6) display concepts (2 SVS HDD concepts and 1 HUD
concept, with the two texturing techniques) without the anomaly. All 7 display concepts also included a Terrain
Awareness and Warning System (TAWS) and a Vertical Situation Display (VSD, which presented a vertical profile of
terrain along track). Both the TAWS (Reference 6) and VSD (Reference 5) concepts have been researched
independently. The displays by themselves have limitations; however an integrated SVS solution involving perspective
terrain on PFD, and TAWS and VSD on an enhanced Navigation Display (ND), has the potential to provide the
complete terrain depiction. For this study, both TAWS and VSD were incorporated into an enhanced ND.
1.4 Experiment Objectives
The main purpose of the experiment was to directly address SVS CFIT avoidance benefits, but the data gathered during
the backdrop retrofit display factors experiment was used to confirm/deny the results on the same issues examined in the
prior research efforts.
1. Demonstrate that SVS can improve the pilot’s ability to detect a potential CFIT scenario compared to a baseline
757 EFIS display system with TAWS and a VSD.
2. Determine pilot usability / acceptability and Situational (Terrain) Awareness provided by a NASA SVDC
Head-Up Display (SVDC-HUD) and confirm the potential of the SVDC-HUD as a retrofit display solution for
SVS concepts in Non-Glass cockpits (this experimental objective was constrained by the lack of high visual
fidelity in simulated HUD presentations).
3. Determine pilot usability / acceptability and Situational (Terrain) Awareness provided by various-sized SVDC
Head-Down Displays (SVDC-HDD).
4. Evaluate pilot usability / acceptability and Situational (Terrain) Awareness provided by photo-textured and
generically-textured terrain database SVS concepts within NASA SVS concepts (HUD; Head-down Sizes A/B,
X) in support of the retrofit display concept evaluation and SVDC development.
5. Assess closed-loop performance during manually flown landing approach and departure (go-around) maneuvers
in a terrain-challenged operational environment to determine the effect of SVS on performance, and quantify
performance with respect to required navigation performance (RNP) procedures.

2. METHODOLOGY 2.1 VISTAS III Simulation Facility
The experiment was conducted in the Visual Imaging Simulator for Transport Aircraft Systems (VISTAS) III part task
simulator at NASA Langley Research Center (Figure 2). The single pilot fixed based simulator consists of a 144 degree
by 30 degree out the window visual, a simulated HUD, a large field HDD and pilot input controls. For this experiment,
the out the window scene was used only during training.
The pilot controls in the VISTAS III workstation are a left side arm controller, left/right throttle controls, rudder pedals,
left/right toe brakes and a Personal Computer (PC) track ball for display related pilot inputs. The track ball is used to
select ND range scale and the SVS FOV.
Figure 2: VISTAS III fixed based pilot in the loop workstation.
2.2 Test Subjects
A total of 15 airline pilots and 1 NASA researcher participated in the experiment. The subjects from commercial airlines
consisted of 4 captains and 11 first officers. The NASA researcher was an experienced Air Force transport pilot with no
previous knowledge of SVS concepts. All subjects had HUD experience and all airline pilots had current commercial
licenses. The subjects had an average 19.6 years of flying experience with an average 8200 hours logged. The subjects
were given a 30-minute briefing to explain the retrofit concept and the expected subject task. After the briefing, a 2-hour
training session was conducted to familiarize the subjects with the aircraft model and controls. The ‘rare-event’ scenario
was not discussed, although the pilot’s responsibility for maintaining terrain clearance at all times was stressed.
2.3 Terrain Texture
The SVS terrain was displayed in two formats: photo-realistic and elevation based color-coded terrain (Figure 3).
Taking actual aerial photographs of the EGE area and draping those photos on top of the digital elevation model of the
terrain created the photo-realistic terrain. The photo-realistic texture was nested such that the resolution of the
photographs used varied depending on proximity to the EGE airfield. The ranges of the resolution of the photographs
were 16, 4, and 2 meters per pixel.
The elevation color-coded generic textured terrain was created by using a green color for the field elevation of EGE
airport and shades of brown for higher elevations. For this database, dark brown represented altitudes close to field
elevation while light browns represented higher elevations. The brown shading consisted of 12 elevation color bands
that were 250 meters thick (high). Major cultural features, such as rivers, railroads and major highways, were added to
the generic database.

Figure 3: Photo realistic terrain (left) and Generic elevation based color (right) terrain database.
3. EXPERIMENTAL TEST3.1 Evaluation Tasks
The test subjects were asked to fly a circling visual approach to EGE runway 7 in IMC (Figure 4) with no out the
window visibility. The simulated aircraft used for this experiment was a Boeing 757. Both the approach and departure
speed was 140 knots. All scenarios were flown with light to moderate turbulence and no wind. For the approach part of
the task, auto throttles were enabled, flaps were set to 30 degrees and the landing gear was down. At 200 ft above
ground level (AGL), a go around was executed and the loss of one engine was simulated (for this study, both throttles
were set to 40% power to simulate single engine power, a condition that entailed remaining low in the terrain during
departure). Then, the pilot raised the landing gear and the flaps were set to 5 degrees. The task for the departure path
was to follow a heading of 050 degrees until the aircraft was at 6.8 nautical miles distance measuring equipment (DME)
from the Snow Very high frequency Omni-directional Range (VOR). At the 6.8 DME point, the pilot was then to follow
the 059 radial from the Snow (SXW) VOR. The run ended at the 12.0 DME point from SXW. For the final data run of
the experiment, the flight guidance was altered on the departure path (dotted path in Figure 4). Both the flight path and
guidance cues directed the airplane into a mountain peak.
TAWS aural alerts were demonstrated during the training session but were disabled for data runs. Because of the nature
of the scenarios, the TAWS aural alerts were frequent and distracting even when following a known correct path (in the
actual flight tests operations at EGE, it was necessary to disable the aural warning for the more rudimentary ground
proximity warning system, GPWS, of the LaRC Boeing 757).
8100’ MSL
220º
Snow VOR
SXWStart of Run
5.3 DME SXWEGE
200’ AGL
Go Around
R-059º SXW
6.8 DME
SXW
Hdg 050º
End of Run
12.0 DME SXW
CFIT path
Figure 4: Map view of the circling and go around task flown by the subject pilot.

3.2 Display Conditions
The subjects flew the same task with 3 replications of each of the 7 varying display presentations. The display variations
were: a baseline EFIS 757 display, a size A (5” x 5.25”) display with SVS, a display size of 8”x10” (known as Size X)
with SVS and a HUD enhanced with SVS. The 2 texturing techniques were applied to each SVS display. For all display
presentations, the ND with TAWS and VSD was a size B (4” x 6”). For the HUD, the HDD was the baseline (EADI,
TAWS and VSD enhanced ND) concept.
Figure 5: Display Variations: Baseline (left), Size A, Size X and HUD with EFIS HDD
3.3 SVS Guidance
For baseline data runs, the flight guidance was a traditional dual cue (pitch and roll bars) flight director providing
guidance to the approach and departure path. However, the vertical guidance for the departure path was speed on pitch.
For the SVS data runs, pilots flew the approach procedure with tunnel (or highway in the sky) and ghost airplane
guidance (Reference 3). The departure guidance for the SVS runs was an integrated single cue symbol (or “the ball”)
providing lateral path guidance and speed on pitch.
3.4 Experiment Matrix
Repetitions
per pilotPhoto textured
terrain
Generic textured
terrain
Size A 3 3
Size X 3 3
HUD 3 3
Figure 6: Experiment data run matrix; 3 replications for each condition
In addition to the 18 SVS data runs mentioned above, each pilot flew 3 EFIS baseline runs and a final CFIT run. Other
than the last run being the ‘rare event’ CFIT, the data runs were randomized for each pilot.
For the final data run of the experiment session, a ‘rare event’ CFIT scenario was presented to the subject pilot. The
flight management system (FMS) was set such that the flight path and associated flight directors provided guidance into
the terrain (dotted line path in Figure 4). The pilots were not briefed that the final run was any different than previous
runs. In addition, the subjects were verbally instructed to fly the simulator as if it was an actual airplane with passengers
on board and that they should take any necessary action to avoid the terrain. Information sources available to the pilot for
potential detection of the anomaly included the TAWS and VSD terrain depictions, and a Radio Magnetic Indicator
(RMI) showing off path position from the same path they had already flown 21 times before (3 times with the baseline).
12 of the 16 subject pilots also had terrain information on the SVS HDD (size A or X) or HUD. The photo-realistic
textured database was used for all of the SVS ‘rare event’ data runs.

4. RESULTS Results from this experiment are presented for quantitative and qualitative data. Analyses of pilot performance data are
presented first for each separate flight phase of the experiment. Qualitative results are summarized across all phases of
the experiment.
4.1 Quantitative Results
The quantitative results presented are from statistical analyses of path and speed error performances. The analyses all
were conducted as full factorial within subject designs, and as expected for a precision task, the main effect of pilot
variability was always highly significant for all measures. The second order interactions of the pilot factor with other
main effects were not significant. Only the statistically significant results of the other factors are discussed.
4.1.1 Approach Path
Baseline/SVS Displays - Analyses of variance were conducted on the main factors of Pilot and Display Type (baseline,
Size A, Size X, HUD) for the path error performance measures with the following results:
Root mean square (RMS) lateral path error results (Figure 7) - Display Type F(3,331)=98.754, p<.000) was highly
significant for the measure of RMS lateral path error during the approach. Post hoc tests (using Student-Newman-Keuls,
SNK, with α=.05), showed that the baseline (mean=267 ft) concept had significantly poorer tracking of the lateral path
as compared to the three SVS Concepts. The comparison between the SVS concepts is presented in the SVS
displays/texture analysis below (the latter analysis has more statistical power to discriminate).
RMS vertical path error results (Figure 7) - Display Type (F(3,331)=5.789, p < .001) was highly significant for the
measure of RMS vertical path error during the approach. Post hoc test (using SNK with α=.05), showed that the
baseline (mean=106 ft) concept had significantly poorer tracking of the vertical path as compared to the 3 SVS
Concepts. The comparison between the SVS concepts is presented in the SVS displays/texture analysis below (the latter
analysis has more statistical power to discriminate).
SVS displays/texture - Analyses of variance were conducted on the main factors of Pilot, SVS Display Type (Size A,
Size X, HUD) and Texture Type for the path error performance measures with the following results:
RMS lateral path error results (Figure 7) - SVS Display Type (F(2,279)=14.208, p<.000) was statistically significant for
the measure of RMS lateral path error during the approach. Post hoc tests (using SNK with α = .05) showed that the
HUD (mean=61 ft) was significantly different from Size A (mean = 82 ft) and Size X (mean=80 ft), which could not be
discriminated. The improved performance was attributed to the HUD’s unity magnification factor, but the performance
differences were not considered operationally significant. Neither terrain Texture Type nor the interaction between
Display Type and Texture Type were significant for this measure.
RMS vertical path error results (Figure 7) - SVS Display Type (F(2, 279)=4.660, p<.010) was highly significant for the
measure of RMS vertical path error during the approach. Post hoc tests (using SNK with α=.05), showed that the Size A
(mean=69 ft) concept had significantly poorer tracking of the vertical path as compared to the other two SVS Concepts:
HUD (mean=60 ft) and Size X (mean=63 ft), which could not be discriminated. Although SVS Display Type was
statistically significant for RMS vertical path error during the approach, it was not considered to be operationally
significant. Neither terrain Texture Type nor the interaction between Display Type and Texture Type were significant
for this measure.
4.1.2 Departure Path
Baseline/SVS Displays - Analyses of variance were conducted on the main factors of Pilot and Display Type (baseline,
Size A, Size X, HUD) for the lateral path error and speed on pitch performance measures with the following results:
RMS lateral path error results (Figure 8) - Display Type (F(3,331)=34.008, p<.000) was highly significant for the
measure of RMS lateral path error during the departure. Post hoc tests (using SNK with α=.05) showed that the baseline
(mean=577 ft) concept had significantly poorer tracking of the lateral path as compared to the 3 SVS Concepts. The
comparison between the SVS concepts is presented in the SVS displays/texture analysis below.

RMS speed on pitch error results - Display Type (F(3,331)=.164, p>.05) was not significant.
Approach RMS Path Error
267
82 8061
106
69 63 60
0
50
100
150
200
250
300
Baseline Size A Size X HUD
RM
S p
ath
err
or
(feet)
RMS lateral error
RMS vertical error
Departure RMS Lateral Path Error
577
212
166138
0
100
200
300
400
500
600
700
Baseline Size A Size X HUD
RM
S p
ath
err
or
(feet)
RMS lateral error
Figure 7: Approach and departure path performance error for display concepts without texturing effects
SVS displays/texture - Analyses of variance were conducted on the main factors of Pilot, SVS Display Type (Size A,
Size X, HUD) and Texture Type for the error performance measures with the following results:
RMS lateral path error results (Figure 8) - SVS Display Type (F(2,279)=3.629, p<.028) was significant for the measure
of RMS lateral path error during the departure. Post hoc tests (using SNK with α=.05), showed that the HUD
(mean=138 ft) concept had significantly better tracking of the lateral path as compared to the Size A (mean=212 ft)
concept but no appreciable differences with the Size X (mean=166 ft) concept. In addition, there were no significant
differences between Size A and Size X. Although SVS Display Type was statistically significant for RMS lateral path
error during the departure, it was not considered to be operationally significant for a departure task. Performance
differences varied directly with the display minification factor (at FOV= 60 degrees, minification factors were: A, 5.0; X
2.6; HUD, 1.0), with the best performance occurring with the conformal HUD. Neither terrain Texture Type nor the
interaction between Display Type and Texture Type were significant for this measure.
Other RMS error results - For the departure task with SVS displays, Texture Type (photo-realistic, generic) was not a
significant factor (p>.05) in terms of lateral error or speed on pitch error.
4.1.3 Rare Event CFIT
For the CFIT scenario, 12 of the 16 test subjects flew the CFIT scenario with a SVS enhanced PFD (4 pilots with Size A,
4 pilots with Size X) or HUD (4 pilots). All 12 pilots noticed and avoided the CFIT. On average, pilots with a SVS
display noticed the potential CFIT 53.6 seconds before impact with the terrain. Four of the 16 pilots flew the CFIT
scenario with the baseline display and all 4 pilots had a CFIT event. Three of the 4 pilots impacted the terrain while one
passed within 58 feet of a mountain peak without awareness of any terrain separation problem. Even though the baseline
concept had a TAWS and VSD enhanced ND, and a RMI, none of the subjects were aware of a CFIT event based on
pilots’ maneuvers and self-reports.
Figure 8 shows 4 snapshots taken at the same point in time for 4 Size A displays. The snapshots were taken on departure
at 10.1 DME from SXW. The left 2 displays show the nominal departure and the right 2 displays show the CFIT
departure. The SVS displays clearly show the surrounding terrain while the baseline display provides no terrain
awareness. Figure 9 shows the TAWS, VSD and RMI displays at the same 10.1 DME point from SXW for the nominal
(left) and CFIT (right) runs. The range shown for both the ND and the VSD is 20 nautical miles (nmi). For nominal
runs, the departure task was aimed at a notch between 2 mountain peaks that could be seen on the SVS PFD. Because of
the low resolution of the TAWS terrain database, the nominal TAWS showed a terrain warning (solid red, terrain impact
within 30 seconds) over the notch region. The TAWS display correctly showed solid red for the CFIT scenario,

however, the CFIT TAWS display is very similar in appearance to the nominal TAWS. The RMI was tuned to the 059
radial for SXW, yet there is little difference between the nominal and CFIT RMI reading. The peak shown on the VSD
for the nominal run (left display of Figure 9) is 10 nmi (over 4 minutes) away, however, the run ends at 12 DME from
SXW. The VSD for the CFIT scenario (right display of Figure 9) clearly shows an imminent CFIT event (1 nmi, 26
seconds to impact).
Figure 8: Baseline and SVS displays for nominal run (2 left) and baseline and SVS displays for CFIT run (2 right)
Figure 9: TAWS, VSD and RMI for nominal run (left) and CFIT run (right)
It should be noted that 2 CFIT’s (i.e., ground impact during circling maneuvers) occurred during nominal SVS data runs.
Both unplanned CFIT’s occurred with the baseline display during the turn to final.
4.2 Subjective Results
Pilots were asked structured questions after each run. At the end of the day, a semi-structured interview was conducted
along with a Situation Awareness – Subjective Workload Dominance (SA-SWORD) questionnaire (Reference 8).
Qualitative results in the form of pilot comments are summarized below:
4.2.1 Post Run Questionnaire Results
After each data run, subjects were asked 6 questions. Two of these questions were found to be statistically and
operationally significant and those results are reported below. They were also asked to rate their mental workload for

the task using the Modified Cooper-Harper (MCH) workload scale (Reference 7). In short, a low MCH rating represents
a low mental workload task.
4.2.2 Modified Cooper-Harper Workload Scale Results for Nominal Runs
Baseline/SVS Displays - Display Type (F(3,314)=110.77, p<.000) was highly significant for a pilot’s mental workload
(MCH) rating. Post hoc tests (using SNK with α=.05) showed that the baseline (rating=4.13) concept with TAWS and
VSD enhanced ND increased the pilots’ mental workload as compared to the 3 SVS concepts: Size A (rating=2.20), Size
X (rating=1.73), HUD (rating=2.31). The Size X concept taxed the pilots’ mental workload less than the other 2 SVS
concepts but this difference was not considered practically significant. In general, the baseline concept required a
moderately high operator mental effort to attain adequate system performance, while the SVS concepts required a low
operator mental effort to obtain the same system performance.
SVS displays/texture - Terrain Texture Type (F(1, 264)=6.602, p<.011) was statistically significant (but not
operationally significant) for the pilot’s mental workload rating. The mean rating was 1.98 for the photo-realistic
texturing and 2.18 for the generic texturing, both equating to a low operator mental workload requirement. The
interaction between SVS Display Type and Texture Type was not significant for this measure.
4.2.3 Post Run Questionnaire for Nominal Runs
Analyses showed that responses to 2 of the 6 post questions were statistically and operationally significant. Subjects
were asked to rate each question with a value between 1 and 6, where a 1 indicates a strong disagreement with the
question and a 6 represents strong agreement. Ratings of 2 and 5 were moderate disagreement or agreement,
respectively, and ratings of 3 and 4 were slightly disagree or agree, respectively.
Run Question 1 - It was easy to determine aircraft position with respect to the terrain: Display Type (F(3,314)=111.140,
p<.000) was highly significant for the measure of ease of determining aircraft position with respect to terrain. Post hoc
tests (using SNK with α=.05) showed that it was harder to determine aircraft position with respect to terrain with the
baseline (rating=3.48) concept with TAWS and VSD enhanced ND than it was with the 3 SVS concepts: Size A
(rating=5.35), Size X (rating=5.57), HUD (rating=5.33). There were no appreciable differences between the SVS
concepts.
Run Question 2 - I was confident in my knowledge of separation from the terrain: Display Type (F(3,314)=79.454,
p<.000) was highly significant for the measure of a pilot’s confidence in his knowledge of the aircraft’s separation from
the terrain. Post hoc tests (using SNK with α=.05) showed that the pilot is less confident in the knowledge of terrain
clearance with the baseline (rating=3.69) with TAWS and VSD enhanced ND concept than with the 3 SVS concepts:
Size A (rating=5.21), Size X (rating=5.38), HUD (rating=5.26). There were no appreciable differences between the SVS
concepts.
4.2.4 Modified Cooper-Harper Workload Scale Results for CFIT ‘Rare Event’ Run
Baseline/SVS Displays - Display Type (F(3, 15)=10.286, p<.001) was highly significant for the Modified Cooper-
Harper ratings. Post Hoc tests (using SNK with α=.05) indicated two unique subsets: 1) Size X and HUD and 2) Size A
and baseline. The HUD concept (mean rating=1.25) and Size X concept (mean rating=1.25) require less pilot workload
(minimal to low operator mental effort) than the Size A concept (mean rating=2.75) and baseline concept (mean
rating=3.75). Although the Size A concept (low to acceptable operator mental effort) has a lower workload rating than
the baseline concept, it was not statistically differentiable. The baseline concept with TAWS and VSD enhanced ND
(moderately high operator mental workload) indicated that the mental work level was not acceptable and should be
reduced.
4.2.5 SA-SWORD Questionnaire
The SA-SWORD (Reference 8) for this experiment was designed to allow a statistical analysis of the pilot’s subjective
assessment of the workload for each of the display configurations (baseline, Size A, Size X and HUD) and texturing
techniques (photo-realistic and generic). The definition of SA was defined as: The pilot’s awareness and understanding of all factors that will contribute to the safe flying of their aircraft under normal and non-normal
conditions.

4.2.6 SA-SWORD Questionnaire Results
The photo-textured Size X display was judged to provide significantly better Situation Awareness (SA) than all other
display concepts tested. The photo-textured HUD was judged to provide significantly better SA than both Size A
(generic and photo) concepts and the baseline concept but had no appreciable statistical differences from the generic-
textured Size X or generic-textured HUD (Figure 10).
Most SA Least SA
Photo X Photo HUD Generic X Generic HUD Photo A Generic A Baseline
Figure 10: Comparative situational awareness among display concepts
Among the three types of SVS concepts (Size A, Size X, HUD), statistically the photo-realistic database was judged to
afford significantly more SA than generic texturing for the Size-X display concept only.
4.2.7 Pilot Workload Rating
The subjects were asked to rate the workload using each NASA display concept for the approach and departure
separately. Workload was defined as: “the degree of cognitive processing capacity required to perform the flight task
approach adequately”. Figure 11 shows the scale that the pilots used for the workload and SA ratings.
1 2 3 4 5 6 7 8 9
Very High Somewhat High Somewhat Low Very Low
Figure 11: Workload and SA rating scale
4.2.8 Pilot Workload Rating Results for Approach and Departure
Display Type [(F(3,93)=67.310, p<.000), (F(3,93)=93.651, p<.000)] was highly significant for the measure of pilot
workload rating during the approach and departure, respectively. In general, workload for the baseline display concept
with TAWS and VSD enhanced ND was high and the SVS concepts’ workload was low during both phases of flight.
Neither terrain Texture Type nor the interaction between SVS Display Type and Texture Type was significant (p>.05)
for this measure during approach or departure.
4.2.9 SA Rating
Subjects were asked to rate their level of SA experienced during the approach and departure (go around) task separately,
for each display concept (See Figure 11 for rating scale). SA was defined as: “…the pilot has an integrated
understanding of the factors that will contribute to the safe flying of the aircraft under normal or non-normal conditions.”
4.2.10 Pilot SA Rating Results for Approach and Departure
Display Type [(F(3,93)=154.272, p<.000), (F(3,93)=283.305, p<.000)] was highly significant for the pilot SA rating
during the approach and departure, respectively. In general, the pilots’ SA for the baseline display concept with TAWS
and VSD enhanced ND was low to somewhat low and the pilot’s SA with the SVS concepts was high during both phases
of flight. Although statistically significant, neither terrain Texture Type nor the interaction between SVS Display Type
and Texture Type was operationally significant for this measure during approach or departure.
4.2.11 VSD Enhancement Questionnaire
Subjects were asked to rate how much of their SA was increased with the vertical situation display provided during the
approach and departure (go around) using the: 1) baseline EADI with TAWS and VSD enhanced ND; 2) SVS Size X; 3)
SVS Size A. Subjects were asked to rate the VSD addition to the ND on a scale of 0 to 10 (0 being 0% enhancement and
10 being 100% enhancement).

4.2.12 VSD Enhancement to SA During Approach
During approach, Display Type (F(3, 63)=12.201, p<.000) was highly significant for the measure of the VSD percentage
enhancement to SA. Post Hoc tests (using SNK with α=.05) indicated that the VSD significantly enhanced SA for the
baseline (mean=61 percent enhancement) concept with TAWS and VSD enhanced ND as compared to the SVS concepts
(mean=22 percent for Size X, mean=34 percent for Size A and mean=38 percent for HUD). Also, the SNK test showed
that Size X was significantly different from the HUD but had no appreciable differences with Size A. In addition, there
were no significant differences between Size A and the HUD.
4.2.13 VSD Enhancement to SA During Departure
During the departure, display type (F(3, 63)=11.125, p<.000) was highly significant for the measure of the VSD
percentage enhancement to SA. Post Hoc tests (using SNK with α=.05) indicated that the VSD significantly enhanced
SA for the baseline (mean =59 percent enhancement) concept with TAWS and VSD enhanced ND as compared to the
SVS concepts (mean=23 percent for Size X, mean=36 percent for Size A and mean=37 percent for HUD). The SVS
concept differences were not detectable.
5. CONCLUSIONS The rare event portion of the simulation experiment demonstrated quite dramatically that a synthetic vision system
(SVS) will improve the pilot’s ability to detect and avoid a potential Controlled Flight Into Terrain (CFIT) event
compared to the baseline 757 EFIS display system. This CFIT benefit has been advanced as one primary motivation for
SVS displays (another primary motivation is to replicate the operational benefits of flight operations in bright, clear,
sunny day conditions, regardless of the outside weather). In addition, the backdrop retrofit display simulation experiment
confirmed once again the prior flight test and simulator results revealing the enhanced situation awareness, reduced
workload, and reduced flight technical error provided by all of the SVS (HDD and HUD) concepts, regardless of display
size. These additional results firmly establish the SVS HDD retrofit concept approach as viable for operations in a
realistic, terrain-challenged environment.
ACKNOWLEDGEMENTSThe authors would like to thank the following people whose help and dedication made this research possible:
• Mike Norman of Boeing Phantom Works for providing his expertise in developing the test scenarios.
• Jim Anderson of NASA Langley for making the VISTAS III research facility a reality.
REFERENCES1. Bailey, R.E., Parrish, R.V., Arthur III, J.J., and Norman, R.M., “Flight Test Evaluation of Tactical Synthetic Vision
Display Concepts in a Terrain-Challenged Operating Environment" In Proceedings of SPIE, Enhanced and
Synthetic Vision 2002, Editor: Jacuqes G. Verly, Volume 4713, pp. 178-189, Apr 2002.
2. Baize, D.G. and Allen, C.L., “Synthetic Vision Systems Project Plan, Version IIId,” NASA Langley Research
Center, 5 Nov 2001.
3. Merrick, V.K., Jeske, J.A., “Flight Path Synthesis and HUD Scaling for V/STOL Terminal Area Operations,”
NASA TM-110348, April 1995.
4. Kuchar, J.K. and Hansman, R.J., “Part-Task Simulation Study of Candidate Terrain Alerting Displays (1993)”,
1993.
5. Prevot, T., “A Display for Managing the Vertical Flight Path – an Appropriate Task with Inappropriate Feedback,”
Proceedings of HCI-Aero, Montreal, Canada, May 1998.
6. Muynch, R.J. and Khatwa, R., “Flight Simulator Evaluation of the Safety Benefits of Terrain Awareness and
Warning Systems,” NLR-TP-99379, September 1999.
7. Boff, Kenneth R.; and Lincoln, Janet, eds.: Engineering Data Compendium-Human Perception and Performance, Volume II. Harry G. Armstrong Aerosp. Med. Res. Lab., Wright-Patterson Air Force Base, 1988, pp. 1644-1645.
8. Vidulich, M.A., & Hughes, E.R., “Testing a subjective metric of situation awareness” In Proceedings of the Human
Factors & Ergonomics Society 35th Annual Meeting (pp. 1307-1311). Santa Monica, CA: Human Factors &
Ergonomics Society. 1991.
9. Prinzel, L.J., Kramer, L.J., Bailey, R., Hughes, M., & Comstock, R., “NASA Eagle-Vail Synthetic Vision Flight
Test,” Proceedings of the Human Factors and Ergonomics Society 46th Annual Meeting, 46.135-139, 2002