CFD optimisation of a stadium roof geometry: a qualitative ...
19
RESEARCH ARTICLE CFD optimisation of a stadium roof geometry: a qualitative study to improve the wind microenvironment Polytimi Sofotasiou 1 , Ben Hughes 1,* , and Saud Abdul Ghani 2 1 Department of Mechanical Engineering, University of Sheffield, Sheffield, UK 2 Department of Mechanical and Industrial Engineering, Qatar University, Doha, Qatar Received: 16 June 2017 / Accepted: 3 July 2017 Abstract. The complexity of the built environment requires the adoption of coupled techniques to predict the flow phenomena and provide optimum design solutions. In this study, coupled computational fluid dynamics (CFD) and response surface methodology (RSM) optimisation tools are employed to investigate the parameters that determine the wind comfort in a two-dimensional stadium model, by optimising the roof geometry. The roof height, width and length are evaluated against the flow homogeneity at the spectator terraces and the playing field area, the roof flow rate and the average interior pressure. Based on non-parametric regression analysis, both symmetric and asymmetric configurations are considered for optimisation. The optimum design solutions revealed that it is achievable to provide an improved wind environment in both playing field area and spectator terraces, giving a further insight on the interrelations of the parameters involved. Considering the limitations of conducting a two- dimensional study, the obtained results may beneficially be used as a basis for the optimisation of a complex three- dimensional stadium structure and thus become an important design guide for stadium structures. Keywords: computational fluid dynamics / response surface methodology / optimisation / wind comfort / stadiums 1 Introduction Stadium structures demand particular care during design process to comply with the manufacturing and environ- mental standards, due to the large number of attendees that they tend to attract. For this reason, progressive design strategies are ordinarily deployed in conceptual phase, in order to combine all the requisite components that will advocate for the optimality of the constructional result. The optimisation of every design should mainly focus on the improvement of users’ comfort within the building environment, while aiming at the harmonious coexistence of an environmentally susceptible and climate rational design [1]. This study is focused on the design optimisation of the roof geometry of a two-dimensional (2D) stadium model using coupled computational fluid dynamics and response surface methodology optimisation techniques. Based on rational design interventions on the roof configuration, the work pursues the provision of improved or optimum microclimate conditions in the arena bowl, including both spectator terraces and playing field area. The qualitative study includes the exploration of both symmetric and asymmetric roof alterations and the corresponding analy- tical results on velocity measurements and flow homoge- neity at the areas of interest. 2 Previous related work Early studies on stadium structures highlighted the multidimensional and multiscalar characteristics of ther- mal comfort and energy consumption in stadiums and accentuated the need to adopt coupled simulation software techniques to obtain a holistic design approach [2,3]. Since then, several studies have been performed to determine the structural characteristics that contribute the most to the alteration of the microenvironment at the stadium bowl. CFD studies validated with wind tunnel experiments have shown that the roof configuration and the porosity of the stadium envelop have great impact on the wind distribution at both pitch level and spectator terraces and consequently on the induced wind comfort conditions [4–7]. Additional studies revealed the importance of providing ventilation openings to promote natural airflow and ventilation at the occupied areas of the stadium bowl [6,8,9]. The interactions between the urban environment and the stadium structures as well as the wind comfort conditions on pedestrian level have also attracted great e-mail: ben.hughes@sheffield.ac.uk Sust. Build. 2, 8 (2017) © P. Sofotasiou et al., published by EDP Sciences, 2017 DOI: 10.1051/sbuild/2017006 Available online at: www.sustainable-buildings-journal.org This is an Open Access article distributed under the terms of the Creative Commons Attribution License (http://creativecommons.org/licenses/by/4.0), which permits unrestricted use, distribution, and reproduction in any medium, provided the original work is properly cited.
Transcript of CFD optimisation of a stadium roof geometry: a qualitative ...
Sust. Build. 2, 8 (2017)© P. Sofotasiou et al., published by EDP Sciences, 2017DOI: 10.1051/sbuild/2017006
Available online at:www.sustainable-buildings-journal.org
RESEARCH ARTICLE
CFD optimisation of a stadium roof geometry: a qualitativestudy to improve the wind microenvironmentPolytimi Sofotasiou1, Ben Hughes1,*, and Saud Abdul Ghani2
1 Department of Mechanical Engineering, University of Sheffield, Sheffield, UK2 Department of Mechanical and Industrial Engineering, Qatar University, Doha, Qatar
� e-mail: b
This is an O
Received: 16 June 2017 / Accepted: 3 July 2017
Abstract.The complexity of thebuilt environment requires the adoptionof coupled techniques topredict theflowphenomenaandprovideoptimumdesignsolutions. In this study, coupled computationalfluiddynamics (CFD)andresponse surfacemethodology (RSM)optimisation toolsare employedto investigate theparameters thatdeterminethewind comfort in a two-dimensional stadiummodel, by optimising the roof geometry.The roof height,width andlength are evaluated against the flowhomogeneity at the spectator terraces and the playingfield area, the roof flowrate and the average interior pressure. Based on non-parametric regression analysis, both symmetric andasymmetric configurations are considered for optimisation. The optimum design solutions revealed that it isachievable to provide an improved wind environment in both playing field area and spectator terraces, giving afurther insight on the interrelations of the parameters involved. Considering the limitations of conducting a two-dimensional study, the obtained results may beneficially be used as a basis for the optimisation of a complex three-dimensional stadium structure and thus become an important design guide for stadium structures.
Keywords: computational fluid dynamics / response surface methodology / optimisation / wind comfort /stadiums
1 Introduction
Stadium structures demand particular care during designprocess to comply with the manufacturing and environ-mental standards, due to the large number of attendeesthat they tend to attract. For this reason, progressivedesign strategies are ordinarily deployed in conceptualphase, in order to combine all the requisite componentsthat will advocate for the optimality of the constructionalresult. The optimisation of every design should mainlyfocus on the improvement of users’ comfort within thebuilding environment, while aiming at the harmoniouscoexistence of an environmentally susceptible and climaterational design [1].
This study is focused on the design optimisation of theroof geometry of a two-dimensional (2D) stadium modelusing coupled computational fluid dynamics and responsesurface methodology optimisation techniques. Based onrational design interventions on the roof configuration, thework pursues the provision of improved or optimummicroclimate conditions in the arena bowl, including bothspectator terraces and playing field area. The qualitativestudy includes the exploration of both symmetric and
pen Access article distributed under the terms of the Creative Comwhich permits unrestricted use, distribution, and reproduction
asymmetric roof alterations and the corresponding analy-tical results on velocity measurements and flow homoge-neity at the areas of interest.
2 Previous related work
Early studies on stadium structures highlighted themultidimensional and multiscalar characteristics of ther-mal comfort and energy consumption in stadiums andaccentuated the need to adopt coupled simulation softwaretechniques to obtain a holistic design approach [2,3]. Sincethen, several studies have been performed to determine thestructural characteristics that contribute the most to thealteration of the microenvironment at the stadium bowl.
CFD studies validated with wind tunnel experimentshave shown that the roof configuration and the porosity ofthe stadium envelop have great impact on the winddistribution at both pitch level and spectator terraces andconsequently on the induced wind comfort conditions [4–7].Additional studies revealed the importance of providingventilation openings to promote natural airflow andventilation at the occupied areas of the stadium bowl[6,8,9]. The interactions between the urban environmentand the stadium structures as well as the wind comfortconditions on pedestrian level have also attracted great
mons Attribution License (http://creativecommons.org/licenses/by/4.0),in any medium, provided the original work is properly cited.

Table 1. Four-step methodology of the RSM optimisation study [19].
Step 1. Design of Experiments
i. Define input parameters: continuous or discrete ii. Define output parameters
iii. Select DoE scheme: Central Composite Design, Box-Behnken Design, etc. iv. Select design type: Auto Defined, Face-Centered, etc. v. Generate design points
Step 2. Response Surface vi. Select a Meta-Model: Standard Response Surface, Kriging, Neural Network etc.
vii. Generate correlation of parameters, sensitivity results, etc. Step 3. Optimization viii. Select optimization method: Screening, MOGA or NLPQL.
ix. Define objectives and constrains x. Obtain candidate points
Step 4. Robustness Evaluation xi. Solution verification
2 P. Sofotasiou et al.: Sust. Build. 2, 8 (2017)
interest [10–12]. Finally, thermal comfort studies, employ-ing dynamic thermal modelling and CFD techniques, werealso conducted to assess thermal discomfort and tempera-ture distribution on stadia [2,13–15,41] and energyconsumption requirements [16,17,42].
To date, only few of the aforementioned research workshave been produced with intention to provide a designsolution with improved responses towards wind comfort.The completed parametric studies have been conductedunder limitations of design parameters and experimentalvariations. In this study, the design exploration of variousroof configurations, within a predefined two-dimensionaldesign space, is pursued to provide improved windenvironmental conditions and understand the interrela-tionships of the design parameters involved. To theauthors’ knowledge, no previous work has used combinedCFD andRSMmethods to assess and optimise a stadium orits components. This study will detail the method used,which will be useful for optimising stadium structures,since the method can be replicated for the optimisation ofany roof and also other structural components.
3 Methodology
For the purpose of this study, coupled CFD modelling andRSM optimisation techniques were employed. CFD is awidely recognised andwell-documented simulation tool that
employs numerical methods and algorithms to producehighly accurate predictions of flow movement and distribu-tion inside and outside building structures [18]. On the otherhand, RSM is a meta-modeling-based optimisation tech-nique that seeks local and/or global optimality, via theevaluation of the assigned design parameters. Withsubstantially limited investment in computational cost, itprovides the opportunity to evaluate numerous design casesand assess the influential role of the designated factors.
The simulation-based optimisation study was con-ducted in four main steps. A 2D stadium design wasinitially evaluated against velocity and pressure distribu-tions. A series of sequential simulation runs was thenperformed generating data, regarding predefined geomet-rical characteristics of the stadium roof (Step 1). Theresults were used to formulate a high precision mathemati-cal model that would describe the problem and predictrelationships among variables (Step 2). The optimisationprocess was performed according to the selected algorithmand the defined objective sets and thresholds, pursuingdesign optimality (Step 3). Finally, the proposed solutionswere verified with simulation runs and compared with thepredicted ones, in order to evaluate the solution andtherefore the accuracy of the RSM-based optimisation(Step 4). The flowchart in Table 1 is a graphicalrepresentation of the steps followed for the optimum-seeking stadium roof configuration to create improvedmicroenvironmental conditions. Themethodology followed

Fig. 1. Dimensional characteristics of the 2D stadium model.
Fig. 2. Dimensional characteristics of the 2D computational domain.
P. Sofotasiou et al.: Sust. Build. 2, 8 (2017) 3
is fully detailed and validated [19] and it is a computationalinexpensive solution to provide quantitative and qualita-tive results of improved design solutions.
4 Case study description
The 2D stadium design was based on FIFA’s technicalrequirements and recommendations for internationalgames, with a seating capacity of 60 000 [20]. Thedimensional characteristics indicate a structure of60� 269m2 (H�L). The oculus roof configuration isrepresented by a 95m opening, long enough to provideadequate sunlight for the natural grass growth. Thestadium consists of two spectator terraces, which are fullycovered by the roof configuration, to reduce the direct solarirradiance (Fig. 1). They are also placed within a distanceof 11m far from the playing field to lessen the impact of theexpected central vortex in the stadium bowl [5]. Further-more, a ventilation opening of 1m was created between theroof and the upper spectator tiers to allow for naturalventilation [6].
5 CFD settings and parameterisation
For the simulation of the wind distribution, the standardk–e turbulence model was used, which is accepted andvalidated for 2D case studies [21–24].
5.1 Geometry and mesh generation
Regardless of the two-dimensional geometry, the recom-mendations for CFD simulations for urban wind studieswere followed [25]. Given the height of the stadiumstructure (H=60m), the computational domain wasspanning 300m (5H) upstream, 900m (15H) downstreamand 360m (6H) on the vertical direction. Thus, themodelled domain would allow for fully developed andhomogeneous ABL flow prior approaching the stadiumstructure, as depicted in Figure 2.
The complexity of the geometry and the largedifference in length scales complicated the generation ofa fully structured mesh. The high-resolution mesh close tothe stadium walls, the ground walls and the ventilation

Fig. 3. Creation of bodies of influence and generation of controlled meshing size.
4 P. Sofotasiou et al.: Sust. Build. 2, 8 (2017)
openings was achieved by local size control on bodies ofinfluence. As shown in Figure 3, four bodies of influencewere created to facilitate the orderly evolution fromcoarser mesh in the outer domain to a finer mesh in thestadium area. Starting with a cell size of 8m in the outerdomain, the mesh was reduced to 2.5m cell size for Body 1,1m for Body 2 and 0.5m for Body 3 that included the areaon the exact proximity of the stadium. Body 4 includedthe ground area with a cell size of 0.4m. On the stadiumwalls a grid refinement control of 3 was applied. Thismethod ensured the smooth transition from the windurban scale to the building scale. The hybrid meshconsisted of 237 703 quadrilateral and triangular cells.
5.2 Grid verification
Three different mesh sizes were tested to ensure meshindependency of the solution. The initial mesh consisted of237 703 cells, the coarser mesh with 122 709 cells and thefiner one with 576 620 hybrid cells. The selection of the
favourable mesh size relied on the correlation of thedimensionless values of velocity (U/Ufree-stream) and thelongitudinal direction of the flow (x/LStadium), along a linepassing through the ventilation openings. The correlation ofthe resultant values is presented in Figure 4 and show goodprediction for all three meshes.
Additional comparative results were generated for theflow rate at the front ventilation opening. As presented inTable 2, the maximum error of 5.4% was calculated for thecoarse grid size, as opposed to 1.8% for the fine mesh. Thus,the medium mesh was selected for the current simulationstudy, allowing computational-time savings and a highdegree of solution accuracy.
5.3 Boundary conditions
The simulation of the wind distribution includes thegeneration of an atmospheric boundary layer (ABL). Themean ABL velocity profile follows a logarithmic production

Fig. 4. Grid sensitivity study among the three different mesh sizes; coarse mesh (122 709), medium mesh (237 703), fine mesh(576 620).
Table 2. Flow rate error for the three grid sizes.
Computationalgrid size
Q_flow rate(m3/s)
e=(f2� f1)/f1� 100%
Coarse: 122 709 �0.5394� 5.4%Middle: 237 703 �0.5115� –
Fine: 576 620 �0.5208� 1.8%� The negative sign indicates that the flow exits the stadiuminterior from the ventilation opening.
Table 3. Solver settings for the 2D ABL flow.
Turbulent model Standard k–e modelwith standard wall functions
Boundary conditionsInlet UDF for U, k, eOutlet Pressure-outlet with zero
pressureTop SymmetryGround ks=0.2, UDF for Cs
Ground-pitchand stadiumentrances
ks=0.58758, Cs=0.5
Cell zone conditionsFluid: top layer Source term,
x-momentum=0.089N/m3
Solution methods SIMPLE; second order forpressure, momentum andturbulence transport equations
Convergence criterion None (to controlend of calculation)
P. Sofotasiou et al.: Sust. Build. 2, 8 (2017) 5
thatwhen it is fullydeveloped it canbedescribedbyequation(1) suggested by [26], followed by themean turbulent kineticenergy (2) and dissipation rate profiles (3):
u ¼ u�ABL
kln
yþ y0y0
� �; ð1Þ
k ¼ u�2ABLffiffiffiffiffiffiffiCm
p ; ð2Þ
e ¼ u�3ABL
kðyþ y0Þ: ð3Þ
where u�ABL is the ABL friction velocity equal to 0.77m/s
calculated from the reference velocity Uref (7m/s) atreference height yref (22m), obtained from the meteorolo-gical station of the Al-Khor city in Qatar, y0 is theaerodynamic roughness length (0.5m), k is the vonKormanconstant equal to 0.42, and Cm is an empirical derivedconstant, equal to 0.09 in the standard k–e model.
For the development of the logarithmic inlet velocityprofile a user-defined function (UDF) was produced basedon equations (1)–(3). It was also decided to improve thecase model by applying constant shear stress on the top rowof cells equal to tw ¼ ru2
� [26], which is also suggested by[27]. The parameterisation of the computational model issummarised in Table 3. The roughness height, ks, was
calculated based on the equation: ks=9.793� y0/Cs. Thesoftware does not allow the ks value to be greater than ypthat is the distance from the ground to the centre of the firstcell. If this is the case, ks is automatically set equal to yp. Inthe current work, the first cell is set equal to 0.4m (seeBody 4, Fig. 3), resulting in yp=0.2m, and thus ks is setequal to 0.2m. Consequently, the roughness constant Cs isgreater than 1, and thus a UDF is required. The playingfield area and the stadium entrances have an aerodynamicroughness equal to 0.03m (for grass covered area,according to Wieringa [28]), ensuing roughness heightequal to 0.58m, with a set value of Cs equal to 0.5.

Fig. 5. Normalised velocity vectors and velocity contours of U/Uref, where Uref = 7m/s at 22m height.
Fig. 6. Pressure contours and velocity vectors for the area outside and inside of the stadium.
6 P. Sofotasiou et al.: Sust. Build. 2, 8 (2017)
5.4 CFD visualisation
Building on the initial results of the CFD simulation,velocity and pressure outputs allowed the investigation of:(1) the areas that aremostly influenced by the inducedwind,(2) the wind speed distribution, (3) the wind behaviour and(4) the potential interventional strategies that could beadopted to improve the stadium’s microenvironment. Asillustrated in Figure 5, the roof and side ventilation openingsseem to have a dominant role on the stadium’s microclimateairflow. The incoming air from the roof opening leads to thegeneration of a primary vortex, located at the centre of thestadium bowl, and clearly shifted towards the leewardterraces. The primary vortex feeds a secondary counter-rotating smaller vortex located at the windward spectatortiers, which forces the air to exit the stadium through thefront ventilation opening. Additionally, the recirculationzone formedat the rear side of the stadiumcontributes to theair entrance through the back ventilation opening. Thus, athird vortex is developed, which is spatially limited to theleeward terraces, due to the existence of the primary, andpredominant in size, vortex.
The analysis of the pressures acting on the stadiumsurfaces verifies the wind behaviour at the stadium interior.As shown in Figure 6, the frontal area of the stadium haspositive pressure values, as opposed to the rest of the fluiddomain. The pressure values at the interior of the stadiumvarybetween�86.8Paand�27.5Pa.Theaccelerationoftheexternalwind is promoteddue topressure difference, leadingto forced directional airflow into the stadium bowl throughthe roof opening, and thus producing the primary vortex.
In the front of the stadium, positive pressure patternsare observed below the roof level. However, the roofgeometry, the extended ventilation opening and thenegative angle of attack decelerate the flow leading to
adverse pressure gradient and flow separation (Fig. 6, pointA). In order to maintain pressure equilibrium, the air exitsthe stadium via the front ventilation opening. In contrary,on the rear side of the stadium, with pressure values around�20Pa, the air is forced to enter the stadium interior viathe back ventilation opening.
5.5 CFD validation
The validation of the CFD simulation for the 2D stadiumstructure was performed based on the study of Persoonet al. [5], who investigated the wind flow patterns andwind-driven rain, regarding different roof structures. Thedevelopment of a primary central vortex is observed forevery case study and its size, and/or penetration levelunder the leeward spectator terraces, is highly dependenton the roof configuration. Secondary vortices on thewindward and leeward spectator tiers were also observed inevery design case and it was concluded that the size andlength of each one of them is subjective to the geometricalcharacteristics of the stadium itself and the boundaryconditions applied (Fig. 7, top).
Similar results were obtained for the current designcase. Figure 7 (bottom) illustrates the interaction of thetwo vortices on the leeward side of the stadium. Theprimary vortex, created by the air stream enteringthrough the roof opening, extends vertically over theentire height of the stadium bowl. It is well observed thatthe primary vortex prevails over the secondary one,penetrating about 20m below the roof structure (Fig. 7,bottom left). Moving further downstream the roof, thesecondary vortex has a more dominant role, directlyaffecting the wind behaviour on the spectators’ level(Fig. 7, bottom right). The rear ventilation openingsignificantly contributes to the generation of the secondary

Fig. 7. Wind distribution on three different roof configurations, and corresponding graphs of the dimensionless horizontalcomponent of velocity along the vertical direction [5] (top); interaction between the primary and the secondary vortex, based onthe horizontal components of velocity magnitude in two vertical lines (bottom); roof edge level (left) and spectator tiers level(right).
P. Sofotasiou et al.: Sust. Build. 2, 8 (2017) 7
vortex, allowing thepressuredifference tonaturallymoveairto the interior. Longwise comparisons of the dimensionlesshorizontal component of velocity indicate substantiallylower velocitymagnitudes to be developed by the secondaryvortex, as opposed to the primary one.
6 Design of experiments
Design of experiments (DoE) is a statistical tool, used tocollect and organise data generated from a limited numberof experiments. This method enables to quantify howprocess inputs affect process outputs and study simulta-neously several variables in an effort to determine theireffects and their interactions. It is the intermediary for theRSM to construct the exploration region of responses, anempirical graph illustrating the response changes, as thecontinuous variables change under its control.
The three main principles for the implementation of aDoE were described in [29] as follows:
– identify the performance assessment of the dependentvariables (outputs) to be optimised, considering theinfluential role of the most significant independentvariables (inputs);–
designate the design space (constrains), within which theinput parameters will vary;–
generate the design points and their response values.6.1 Selection of input parameters
According to literature, stadium structures have beenextensively studied in order to determine optimumgeometrical configurations to provide comfort conditionsfor both players and spectators [4,5,30]. The roofdimensional characteristics seem to be the major contri-butors on the attainment of micro-environmental satisfac-tion. Thus, the input design parameters were set as: (1) theroof height, (2) the roof radius, and (3) the roof lengthextension towards the centre of the pitch area.
6.2 Selection of output parameters
Favourable micro-environmental conditions in semi-outdoor stadium structures, initially reported by [30],indicated that aerothermal comfort conditions may beachieved with wind threshold speed values between0.1m/s, to ensure minimum air movement, and 3.6m/s,to prevent wind disturbance and performance im-pairment. On the basis of these considerations, the outputparameters were set as the flow homogeneity values on thespectator tiers and the playing field area, the ventilationflow rate through the roof opening, and the overallpressure in the stadium bowl. The maximum andminimum velocity at the occupied areas and theventilation flow rates through the leeward and windward
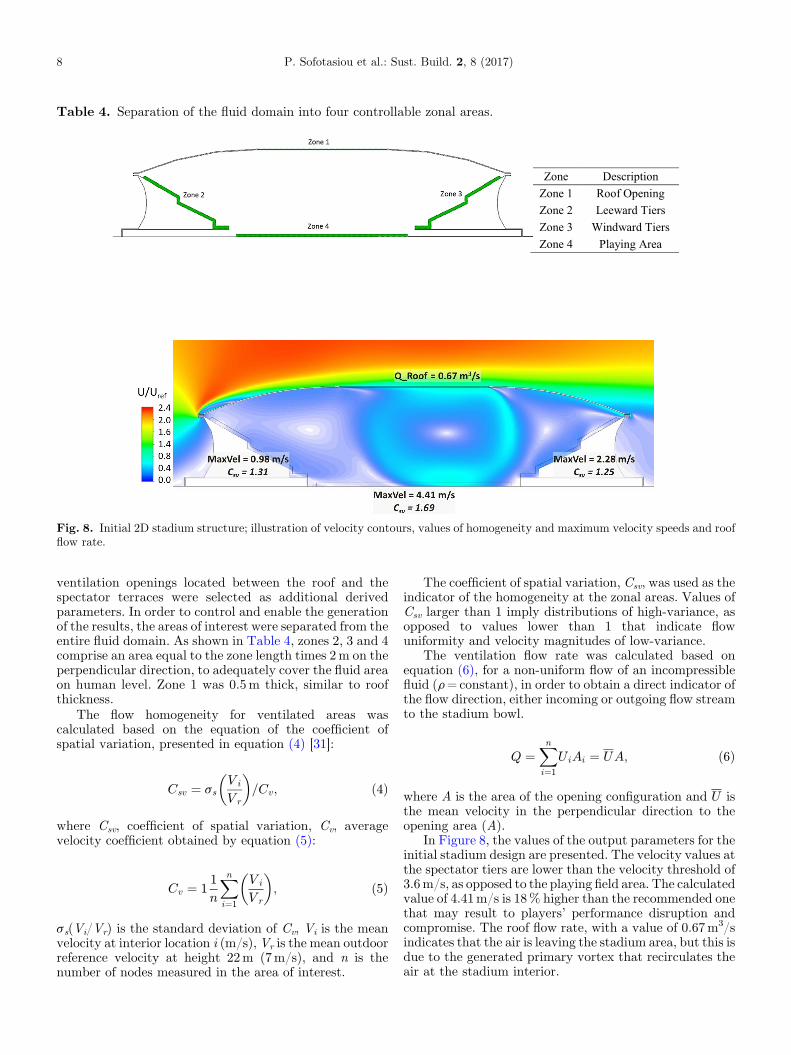
Table 4. Separation of the fluid domain into four controllable zonal areas.
Fig. 8. Initial 2D stadium structure; illustration of velocity contours, values of homogeneity and maximum velocity speeds and roofflow rate.
8 P. Sofotasiou et al.: Sust. Build. 2, 8 (2017)
ventilation openings located between the roof and thespectator terraces were selected as additional derivedparameters. In order to control and enable the generationof the results, the areas of interest were separated from theentire fluid domain. As shown in Table 4, zones 2, 3 and 4comprise an area equal to the zone length times 2m on theperpendicular direction, to adequately cover the fluid areaon human level. Zone 1 was 0.5m thick, similar to roofthickness.
The flow homogeneity for ventilated areas wascalculated based on the equation of the coefficient ofspatial variation, presented in equation (4) [31]:
Csv ¼ ssV i
V r
� �=Cv; ð4Þ
where Csv, coefficient of spatial variation, Cv, averagevelocity coefficient obtained by equation (5):
Cv ¼ 11
n
Xni¼1
V i
V r
� �; ð5Þ
ss(Vi/Vr) is the standard deviation of Cv, Vi is the meanvelocity at interior location i (m/s),Vr is the mean outdoorreference velocity at height 22m (7m/s), and n is thenumber of nodes measured in the area of interest.
The coefficient of spatial variation, Csv, was used as theindicator of the homogeneity at the zonal areas. Values ofCsv larger than 1 imply distributions of high-variance, asopposed to values lower than 1 that indicate flowuniformity and velocity magnitudes of low-variance.
The ventilation flow rate was calculated based onequation (6), for a non-uniform flow of an incompressiblefluid (r=constant), in order to obtain a direct indicator ofthe flow direction, either incoming or outgoing flow streamto the stadium bowl.
Q ¼Xni¼1
UiAi ¼ UA; ð6Þ
where A is the area of the opening configuration and U isthe mean velocity in the perpendicular direction to theopening area (A).
In Figure 8, the values of the output parameters for theinitial stadium design are presented. The velocity values atthe spectator tiers are lower than the velocity threshold of3.6m/s, as opposed to the playing field area. The calculatedvalue of 4.41m/s is 18% higher than the recommended onethat may result to players’ performance disruption andcompromise. The roof flow rate, with a value of 0.67m3/sindicates that the air is leaving the stadium area, but this isdue to the generated primary vortex that recirculates theair at the stadium interior.

Fig. 9. Methodology followed by SVM hyperplanes to separatedata in classes and minimise the distance of points falling out ofthe margins [35].
Table 5. Description of the input parameters and the defined constrains for spatial variance.
P. Sofotasiou et al.: Sust. Build. 2, 8 (2017) 9
6.3 Generation of design points
The design space, within which different design points areevaluated, is defined as the design space that indicates therange of inputs’ variability [32]. In the case of the stadiumdesign, six input design parameters were selected, in orderto control both symmetric and asymmetric transforma-tions of the roof configuration, as presented in Table 5. Themain difference between the two case studies was that insymmetric case, the input parameters were reduced bythree, since P2, P4 and P6 were derived parameters, equalto P1, P3 and P5, respectively. It is worth highlighting atthis stage that the design constraints set for the inputparameters were subjective, if not arbitrary, selected. Thedesign exploration excluded the option of convex roofconfiguration, or a roof length that exposes the spectatortiers or partly covers the pitch area.
The selection of the appropriate scheme for thegeneration of the design points was performed with theOptimal Space-Filling design (OSF) with non-parametricregression model, because it can describe more accuratelythe nonlinear model parameters.
6.3.1 OSF scheme
The OSF scheme is usually employed in complex meta-modelling techniques, such as the non-parametric regres-sion, because it offers an extensive overview of the designspace, by equidistributional selection of the input designparameters. The Max–Min Distance design type wasselected, which maximises the minimum distance betweenany two points and it saves computational time. Thenumber of the design points was based on full quadraticsamples, by providing the number of the design pointsneeded to generate a full quadratic model [33].
Based on the OSF scheme, 15 and 28 design points weregenerated in total, for the symmetric and asymmetriccases, respectively. The calculation of the design pointresponses (output parameters) was performed withsequential simulation runs, contributing to the mostcomputational time-consuming part of the study, sinceconvergence was achieved for every simulation run. Thevalues of the output parameters will form the basis for thenon-parametric regressionmodel, as part of the RSMmeta-model technique and the creation of the design space, wheredifferent roof configurations, regardless of the input value,may be examined against their responses.
7 Response surface methodology
The response surface methodology (RSM) techniqueemploys mathematical and statistical tools to createapproximation functions that can describe complexsimulation data. Metamodel algorithms and mathematicalrelations are used to study the input and output values,their behaviour and interrelations, assisting model simpli-fication, results’ interpretation and performance of opti-misation studies [34]. RSM determines the relationshipsamong variables by performing regression analysis.

Fig. 10. Goodness of fit based on the non-parametric regression for the symmetric case.
Fig. 11. Goodness of fit based on the non-parametric regression for the asymmetric case.
10 P. Sofotasiou et al.: Sust. Build. 2, 8 (2017)
Depending on the number of the variables related to theproblem, different algorithms may be applied, in order todetermine the most accurate regression function that willdescribe the model. In the current study, for bothsymmetric and asymmetric roof alterations, the non-parametric regression meta-model algorithm wasemployed. The regression model enabled the predictionof the highly non-linear behaviour of the stadium’s micro-climate, with regard to the defined inputs.
7.1 Non-parametric regression
The non-parametric regression meta-model is based on thecategorisation of noisy data using the Support VectorMachine (SVM) technique. SVM enables non-linearmapping of input–output data (or training data) on ahigher-dimensional feature space by the aid of kernel maps.The data are split in non-overlapping classes by the aid ofhyperplanes, aiming at the maximization of their in-between margin. The hyperplanes are used to separatenoisy data in groups, by using only those inputs, alsoknown as support vectors that seem to sufficientlyrepresent the outputs. At the same time, as illustratedin Figure 9, the hyperplanes are suitably positioned, so asto minimise the distance of the support vectors that falloutside the margin (slack variables j).
Nonparametric regression systems with non-linearresponses and noisy results can be described mathemati-cally by the following equations (7)–(9) [36]:
fðxÞ ¼ ⟨w;x⟩þ b; ð7Þwhere f(x) is the response of interest, ⟨⋅ ,⋅ ⟩ is the dotproduct in x and w is a weight factor given by equation (8):
w ¼Xni¼1
ða�i � aiÞ’ðxiÞ: ð8Þ
Threshold b can be described by equation (9):
b ¼ � 1
2⟨w; ðxr þ xsÞ ⟩ ; ð9Þ
where a�i , ai≥ 0 are Lagrange variables and xr and xs are
support vectors.The main advantage of non-parametric regression
against the parametric one is that the function lacks ofrigidity and can be adapted to the equivalent data withoutcompromising form (parabolic, periodic, etc.), generatingan inferred function [37].

Fig. 12. Response surfaces for selective input–output parameters of the symmetric case.
Table 6. Optimisation objectives and constraints set forthe output parameters.
Output parameter Objective Constraint(lower bound)
P7 � Q_Roof – Values≥ 0m3/sP8 � Homo_Spec_Tiers_F Minimise –
P9 � Homo_Play_Field Minimise –
P10 � Ave_P_Stadium_In Maximise –
P11 � Homo_Spec_Tiers_B Minimise –
P. Sofotasiou et al.: Sust. Build. 2, 8 (2017) 11
7.1.1 Goodness of fit
The goodness of fit gave a first insight into whether the dataare adequately represented by the function. As shown inFigures 10 and 11, the predicted values from the responsesurface and the observed values form the design pointsperfectly fit the diagonal line, indicating a very good fit ofthe model.
A commonly used indicator, to show in what percentagea design output can be described by the response surfaceregression equation, is the coefficient of determination(R2). For linear regression analysis, theR2 can be describedby equation (10), and lies in the interval [0,1].
R2 ¼ Regression sumof squares
Total sumof squares
¼Xk
i¼1ðyi � yÞ2Xk
i¼1ðyi � yÞ2
: ð10Þ
However, in case of non-parametric regression and non-linear data, the integrity of the function cannot rely on thecoefficients of determination (R2), because the more theparameters involved in the system, the higher the value ofthe regression sum of the squares will be, which might lead
to a value ofR2 greater than 1.0 in some cases (see Eq. (10))[38]. Indeed, in current case the values of R2 for everydesign output were equal to 1.0, as the softwareautomatically truncates exceeding values to 1.0.
Since non-linear regression aims at minimizing the sumof squares of the points’ distances from the fitting curve, theroot mean square error (RMSE) can be considered a goodestimator value, given by equation (11):
RMSE ¼ffiffiffiffiffiffiffiffiffiffiffiffiffiffiffiffiffiffiffiffiffiffiffiffiffiffiffiffiffiffi1
n
Xni¼1
ðyi � yiÞ2s
ð11Þ
The closer the value of RMSE is to zero, the better the fit.The values for the output values were varying from2.2� 10�9 to 1.7� 10�4, indicating a very good fit and aregression function adequate to represent the model.
7.2 Goal driven optimisation (GDO)
The investigation of the optimum design solution presup-poses the designation of the model objectives andconstrains. The optimisation goal is to improve thestadium aero-comfort conditions, by providing homogene-ity and low wind velocities at the zonal areas 2–4 (Tab. 4),and prevent the high flow rates via the roof opening. Forthe purpose of that, the optimisation targets set for bothsymmetric and asymmetric cases are presented in Table 6.
The homogeneity (P8, P9 and P11) in all three occupiedareas was set with a minimization goal. The low values ofCsv (see Eq. (4)) will indicate lower flow heterogeneity andvelocity variance. The average pressure at the stadiuminterior (P10) was deemed to be maximised, in order toprevent the large pressure differences between the externaland the internal environment. The negative pressure at thestadium interior introduces large air streams flowingthrough the roof opening and the rear ventilation opening,disturbing the stadium’s micro-climate. At the same time,a negative flow rate through the roof (P7), calculated based

Fig. 13. Response surfaces for two sets of input–output parameters of the asymmetric case.
12 P. Sofotasiou et al.: Sust. Build. 2, 8 (2017)
on equation (6) using the vertical component of velocity,indicates that more air is entering the stadium bowl thanexiting. Thus, a lower bound constraint of 0m3/s wasadded, in order to achieve air flow reduction.
The Multi-Objective Genetic Algorithm (MOGA) wasused to conduct themultiobjective optimisation study. TheMOGA belongs to the family of genetic algorithms (GA).By employing Pareto sets, a number of design solutions aredetermined, after assessing multiple populations of points.The algorithm performs an elitist non-dominated sortingaccording to the set objectives. The theoretical backgroundcan be found in [39,41].
8 Results and discussion
8.1 Response surfaces
The response surface methodology gives a plethora ofresults, regarding the correlation of the input and outputparameters, the sensitivity factors, indicating on whatextent the input parameters influence the outputs, and thedesign spaces (or response surfaces), where any parametercan be evaluated against the responses.
Three-dimensional graphs of the responses weregenerated, enabling the investigation of the effect thattwo inputs have on a single output. Due to themultidimensional character of the system, few responsesurfaces are selectively presented that show the complexityof the model. For the symmetric case study, the responsesurfaces of the flow homogeneity on the back spectator tiers(P11) and the play field area (P9) are presented inFigure 12, regarding the alterations in the roof length andradius (P1, P3) and the roof length and height (P3, P5),respectively. On linear correlations between the parame-ters, the response surface would fit perfectly the designpoints. However, this is not the case in the current designproblem. The system is highly non-linear and the algorithmadopted, used weighting factors to create a function of highaccuracy that enables the prediction of any response withinthe input design space.
Based on the local sensitivities, by increasing the roofheight, the roof flow rate and the homogeneity in the frontspectator tiers and playing field area are decreased, asopposed to the average pressure and the homogeneity onthe back spectator tiers that are increased. Moreover, theaverage pressure (P8) is increased by increasing the roofradius, and the homogeneity on the back spectator tiers isalso increased by increasing the roof length.
Similar results were obtained for the asymmetric designcase. The even larger number of independent parameters,led to a multivariable system, responses of which can befound in Figure 13. In this case, the front roof height (P6)seems to be determinant for the majority of outputs. Theincreasing value of P6 leads to reduced roof flow rate andpoor homogeneity on the front spectator tiers, as opposedto the average pressure and the homogeneity on the backspectator tiers, which are increased. Additional to these, asthe back roof height increases, the roof flow rate isincreased, and the average pressure and the playing fieldhomogeneity are decreased.
8.2 Optimisation results
The MOGA meta-model algorithm generated in total sixcandidate points that performed better based on thedefined set of objectives. Table 7 shows the optimisationresults generated for the symmetric roof modifications. Thegeometrical patterns look quite similar for all threecandidate points. More specifically, the roof height wasreduced by a maximum of 70% and a minimum of 57% forthe CP3 and CP1 respectively. The roof radius of CP3 wasincreased to more than 565%, resulting in an almost flatroof configuration. Finally, the length was reduced between68.8m and 71.1m, providing full protection to thespectator terraces and exposing adequately the pitch area.
The simulated velocity contours indicate how the roofmodification may alter dramatically the environment atthe stadium interior. The centre of the primary vortex wasrelocated vertically upwards, resulting in positive flowrate values. Contrariwise, the creation of a new recircula-

Table 7. Candidate points generated based on MOGA algorithm for symmetric case.
P. Sofotasiou et al.: Sust. Build. 2, 8 (2017) 13
tion zone above the rear roof geometry is now consideredresponsible for the air entering the stadium bowl withhigh-speed values that are weakened before reaching pitchlevel. The secondary vortex located at the back spectatortiers was moved towards the pitch level. The air enteringthrough the back ventilation opening resulted in thegeneration of another vortex limited to the top spectatortiers, for CP1 and CP3. For the CP1, the same vortex is oflower intensity and spatial extension. In any design
solution, these vortices promoted flow heterogeneity,resulting to higher values of Csv. The change in roof heightand radius resulted in reverse air direction on the frontventilation opening. The impinging air enters the stadiumand partly feeds the present secondary vortex and partlyenhances the primary vortex to exit the stadium area.
In Table 8, the candidate points for the asymmetric roofoptimisation are presented. In order to avoid the airentrance at the stadium interior through the roof opening,

Table 8. Candidate points generated based on MOGA algorithm for asymmetric case.
14 P. Sofotasiou et al.: Sust. Build. 2, 8 (2017)
the back roof height (P4) was decreased by a maximum of91.25% for CP2 and a minimum of 61.87% for CP3. Thedifference in height allows the air to pass above the roofconstruction, without entering the stadium interior. Therecirculation zone that is created behind the stadiumstructure drives the air through the rear ventilationopening and at the same time contributes to the generationof a recirculation zone above the back roof part. In thiscase, two factors are responsible for the generation of the
primary vortex. The first one is due to the aforementionedrecirculation area at the top of the roof surface and thesecond one is due to the incoming air through the rearventilation opening. Similarly, as in symmetric case, thesecondary vortex in the back spectator tiers is relocatedtowards the pitch area, providing lower velocity values atzone 3, but slightly higher heterogeneity. The flowhomogeneity in the pitch area has been increased by aminimum of 132%, whereas in the front spectator tiers

Fig. 14. Global sensitivity chart of input–output parameters for the symmetric (top) and asymmetric (bottom) case.
P. Sofotasiou et al.: Sust. Build. 2, 8 (2017) 15
remained relatively stable over the same values. Finally,the front secondary vortex is spatially limited, by theprevailing primary one and with considerable lowervelocity magnitude intensity.
8.3 GDO sensitivities
Using correlation analysis, the global sensitivities over theoutput parameters were generated, by evaluating theentire design space. Figure 14 (top) shows the globalsensitivities for the symmetric case study. According to theresults, the roof height and length have great impact (eitherpositive or negative) in all the design responses ascompared to roof radius. Positive sensitivity denotes thatas the value of the design parameter increases, the value ofthe design response will increase too. Negative sensitivityimplies that increasing the value of the design parameter,the response value will be decreased. The roof radiusappears to have positive sensitivity in both the averagepressure at the stadium interior and the values ofhomogeneity at the back spectator tiers. It also hasnegligible impact on the parameters P7, P8 and P9.
In case of the asymmetric roof configuration (Fig. 14,bottom), the front roof height (P6) seems to have thegreatest impact both positive and negative in almost all ofthe output parameters. Considering wind is unidirectional,it is expected that P6 will determine mostly the flow at thestadium interior. In case of the homogeneity in the playingfield area, P6 seems to have no impact. This can beexplained graphically by the figures in Table 8, where a
recirculation zone is created on top of the back roof partand drives the air at the stadium interior, and towards thepitch area.
8.4 GDO verification
The verification of the candidate points for optimum aero-comfort conditions at the stadium micro-environment wasperformed by CFD simulation runs. Figure 15 comparesthe results of the candidate points obtained from the GDOand the CFD simulations for the symmetric roofmodification. The values of homogeneity in the zonalareas 2, 3 and 4 (P8, P9 and P11) show good predictionperformance, with a maximum error of 16.35% associatedwith the homogeneity values at the back spectator tiers(P11) for the CP2, followed by an error of 11.04% for thesame output parameter for the CP1. The development ofvortices at the windward spectator tiers is susceptible todisturbances caused by the induced wind through theventilation openings, and thus the computation of velocitymagnitudes is highly sensitive. The flow rate values (P7)were predicted with a maximum absolute deviation of1.84m3/s for the CP2. Considering the roof length openingof 116.5m and the presence of the central primary vortex,the difference in flow rate can be consider substantially low.The largest errors were observed for the average pressure(P10) for all three candidate points. With the maximumabsolute error to be as high as 29.20Pa, the pressure outputcould not be considered an accurate parameter to be

Fig. 15. RSM vs. CFD results for verification for the three candidate points for the symmetric case.
Fig. 16. RSM vs. CFD results for verification of the three candidate points for the asymmetric case.
16 P. Sofotasiou et al.: Sust. Build. 2, 8 (2017)
considered for the selection of the optimum solution. Thegenerated recirculation zones and wind vortices make theaverage pressure imprecise and difficult to predict.
In Figure 16, the comparison of the results for theasymmetric roof indicated a GDO of higher performance.The homogeneity values were predicted with a maximumerror of 8.65% for the CP3. The maximum absolute
deviations of the average pressure (P10) and the flow rate(P7) were equal to 12.4Pa for the CP1 and 3.4m3/s for theCP3, respectively.
The verification study has highlighted the inaccuraciesin predicting some output parameters, such as the averagepressure (P10) and the flow rate (P7), causing some sort ofcompromise in the optimisation process. Regarding the

Fig. 17. Normalised velocity vectors and maximum zonal velocity magnitude for the optimum symmetric (top) and asymmetric(bottom) case.
P. Sofotasiou et al.: Sust. Build. 2, 8 (2017) 17
number of variables involved and the complexity of themodel, the verification enabled the assessment of the bestroof configuration among the candidates, revealing theglobal optimum design solutions. For the symmetric casestudy, the CP1 had the best performance according to theCFD simulation results. Likewise, the CP2 in theasymmetric roof configuration had the less deviation inall parameters against the CFD results.
9 Interpretation of results
The verified optimum solutions are further discussed interms of maximum velocity magnitudes and internal flowdistribution. Figure 17 presents the normalised velocityvectors for the CP1 of the symmetric and the CP2 of theasymmetric roof configuration.
The roof optimisation contributed to a total reductionof 26.5%, 15.4% and 25.9% for the maximum velocities inthe front, back spectator tiers and the pitch area for thesymmetric case and 76.5%, 62.7% and 55.6% for theasymmetric case, respectively. Thus, the maximumallowed mechanical threshold of 3.6m/s for stadia wassatisfied for both designs. Figure 18 shows a graphicalcomparison of the dimensionless horizontal component ofvelocity for the front and back spectator tiers before andafter optimisation. It can be concluded that the micro-environment at the spectator terraces is substantially lessdetermined by the primary vortex and consequently by theinduced air through the roof opening.
9.1 Limitations and suggestions for future studies
The two-dimensional study poses certain limitationsregarding the lack of representing adequately 3D flowcharacteristics, including turbulent dispersion, buoyancy
effects and capture of the separation zones. However, thequalitative study gives a further insight on the designoptimisation of the stadium roof geometry for improvedaero-comfort conditions in different areas in the stadium.The optimisation method and results presented in thiswork aim to form the basis for a future study of a 3Dstadium design. The definition of design constraints andobjectives limits the exploration of solutions of globaloptimality. The study was additionally formed undersubjective selection of input and output parameters.Thus, different design solutions may be obtained underdifferent sets of parameters and objectives.
10 Conclusion
In the present study, a qualitative optimisation study of a2D stadium roof configuration was performed, with theintention to improve the wind comfort conditions at thestadium bowl. Based on coupled CFD and RSM techni-ques, the selected design parameters were assessed withreduced computational time and cost, as opposed totraditional deterministic studies. The initial stadiumdesign was simulated using the FLUENT code andvalidated against the study of Persoon et al. [5] for airflowdistribution in football stadia. The investigation ofdifferent roof configurations, based on variable height,length and radius, was conducted using design experimen-tation. Both symmetrical and asymmetrical modificationswere assessed against the micro-climate conditions devel-oped at the stadium interior, and 6 candidate points weregenerated in total. CP1 for the symmetric and CP2asymmetric case were proven to have the best performanceagainst the CFD-based verification.

Fig. 18. Comparison of the dimensionless horizontal component of velocity for symmetric (top) and asymmetric (bottom) case, before(red line) and after (green line) optimisation.
18 P. Sofotasiou et al.: Sust. Build. 2, 8 (2017)
The results revealed that the optimal symmetric roofdesign may contribute to a maximum velocity reductionof up to 26.5% for the front spectator tiers, if the roofheight is reduced by 57% and the roof radius increasedby 835%, over the initial one. In the asymmetric roofconfiguration, the front roof part seems to be the mostcrucial for the airflow distribution. With an asymmetricroof difference of 11.4m the maximum reductionobserved for the maximum velocity was equal to 75%.For both designs, wind comfort was achieved thatcomplies with the wind thresholds set for stadiums.Considering the limitations of conducting a two-dimensional study, the optimisation method and quali-tative results presented in this work will form thepreliminary basis for future optimisation study of acomplex 3D stadium structure.
This paper was made possible by a NPRP grant (6-461-2-188)from the Qatar National Research Fund (A member of the QatarFoundation). The statements made herein are solely theresponsibility of the authors.
References
1. A. Parr, M. Zaretsky, New directions in sustainable design(Routledge, London, 2011)
2. K. Lomas, H. Eppel, M. Cook, J. Mardaljevic, Ventilationand thermal performance of design options for StadiumAustralia, in: The 5th International IBPSA Conference[online] (International Building Performance SimulationAssociation, Prague, 1997), Available at: https://dspace.lboro.ac.uk/2134/12393
3. D. Fiala, K.J. Lomas, 1999, Application of a computer modelpredicting human thermal responses to the design of sportsstadia, in: CIBSE’99, Conference Proc., Harrogate, UK, pp.492–499
4. J. Bouyer, J. Vinet, P. Delpech, S. Carre, Thermal comfortassessment in semi-outdoor environments: application tocomfort study in stadia, J. Wind Eng. Ind. Aerodyn. 95, 963(2007)
5. J. Persoon, T. van Hooff, B. Blocken, J. Carmeliet,M. de Wit, On the impact of roof geometry on rain shelterin football stadia, J. Wind Eng. Ind. Aerodyn. 96, 1274(2008)

P. Sofotasiou et al.: Sust. Build. 2, 8 (2017) 19
6. A. Szucs, S. Moreau, F. Allard, Aspects of stadium design forwarm climates, Build. Environ. 44, 1206 (2009)
7. T. van Hooff, B. Blocken, M. van Harten, 3D CFDsimulations of wind flow and wind-driven rain shelter insports stadia: influence of stadium geometry, Build. Environ.46, 22 (2011)
8. P. Biagini, C. Borri, L. Facchini, Wind response of large roofsof stadions and arena, J. Wind Eng. Ind. Aerodyn. 95, 871(2007)
9. T. van Hooff, B. Blocken, Full-scale measurements of indoorenvironmental conditions and natural ventilation in a largesemi-enclosed stadium: possibilities and limitations for CFDvalidation, J. Wind Eng. Ind. Aerodyn. 104, 330 (2012)
10. B. Blocken, J. Persoon, Pedestrian wind comfort around alarge football stadium in an urban environment: CFDsimulation, validation and application of the new Dutchwind nuisance standard, J. Wind Eng. Ind. Aerodyn. 97, 255(2009)
11. T. van Hooff, B. Blocken, Coupled urban wind flow andindoor natural ventilation modelling on a high-resolutiongrid: a case study for the Amsterdam ArenA stadium,Environ. Model. Softw. 25, 51 (2010)
12. T. van Hooff, B. Blocken, On the effect of wind direction andurban surroundings on natural ventilation of a large semi-enclosed stadium, Comput. Fluids 39, 1146 (2010)
13. A. Stamou, I. Katsiris, A. Schaelin, Evaluation of thermalcomfort in Galatsi Arena of the Olympics “Athens 2004”using a CFD model, Appl. Therm. Eng. 28, 1206 (2008)
14. M. Ucuncu, D. Woolf, M. Zikri, Thermal comfort ofspectators in stadia built in hot climates, paper presentedat Adapting to Change: New Thinking on Comfort, Windsor,UK, 9–11April (Network for Comfort and Energy Use inBuildings, London, 2010), p. 8
15. A. Matzarakis, D. Fröhlich, Sport events and climate forvisitors—the case of FIFA World Cup in Qatar 2022, Int. J.Biometeorol. 59, 481 (2014)
16. T. Nishioka, K. Ohtaka, N. Hashimoto, H. Onojima,Measurement and evaluation of the indoor thermal environ-ment in a large domed stadium, Energy Build. 32, 217 (2000)
17. P. Sofotasiou, B. Hughes, J. Calautit, Qatar 2022: Facing theFIFA World Cup climatic and legacy challenges, Sustain.Cities Soc. 14, 16 (2015)
18. B. Blocken, 50 years of Computational Wind Engineering:Past, present and future, J. Wind Eng. Ind. Aerodyn. 129, 69(2014)
19. P. Sofotasiou, J. Calautit, B. Hughes, D. O’Connor, Towardsan integrated computational method to determine internalspaces for optimum environmental conditions, Comput.Fluids 127, 146 (2016)
20. FIFA, Football Stadiums: Technical recommendations andrequirements, 5th edition [e-book] (FIFA, 2011), p. 108, 283
21. F. Lien, E. Yee, Y. Cheng, Simulation of mean flow andturbulence over a 2D building array using high-resolutionCFD and a distributed drag force approach, J. Wind Eng.Ind. Aerodyn. 92, 117 (2004)
22. X. Xiaomin, H. Zhen,W. Jiasong, The impact of urban streetlayout on local atmospheric environment, Build. Environ. 41,1352 (2006)
23. Y. Huang, X. Hu, N. Zeng, Impact of wedge-shaped roofs onairflow and pollutant dispersion inside urban street canyons,Build. Environ. 44, 2335 (2009)
24. L. Yik, S. Salim, A. Chan, C. Cheong, CFD study of flowover parallel ridges with varying height and spacing, in:World Congress on Engineering, London (2010),Available at: http://www.iaeng.org/publication/WCE2010/WCE2010_pp1206-1211.pdf
25. F. Joerg, Recommendations of the COST action C14 on theuse of CFD in predicting pedestrian wind environment,Fourth Int. Symp. Comput. Wind Eng. 2006, 529 (2006)
26. P. Richards, R. Hoxey, Appropriate boundary conditions forcomputational wind engineering models using the k-e turbu-lence model, J. Wind Eng. Ind. Aerodyn. 46–47, 145 (1993)
27. D. Hargreaves, N. Wright, On the use of the k-e model incommercial CFD software to model the neutral atmosphericboundary layer, J. Wind Eng. Ind. Aerodyn. 95, 355(2007)
28. J. Wieringa, Updating the Davenport roughness classifica-tion, J. Wind Eng. Ind. Aerodyn. 41, 357 (1992)
29. X. Shen, G. Zhang, B. Bjerg, Investigation of response surfacemethodology for modelling ventilation rate of a naturallyventilated building, Build. Environ. 54, 174 (2012)
30. A. Szucs, S. Moreau, F. Allard, Spectators’ aerothermalcomfort assessment method in stadia, Build. Environ. 42,2227 (2007)
31. J. Kindangen, G. Krauss, P. Depecker, Effects of roof shapeson wind-induced air motion inside buildings, Build. Environ.32, 1 (1997)
32. M. Cavazzuti,Optimization methods (Springer, Berlin, 2013)33. ANSYS, Design Exploration Release 12.1, no. November
(ANSYS, Inc, South-pointe 275 Technology Drive Canons-burg, PA 15317, USA, 2009)
34. L. Friedman, The simulation metamodel (Springer US,Boston, MA, 1996)
35. B. Scho lkopf, C. Burges, A. Smola, Advances in kernelmethods (MIT Press, Cambridge, MA, 1999), p. 11
36. V. Vapnik, The nature of statistical learning theory(Springer, New York, 2000)
37. M. Wand, M. Jones, Kernel smoothing (Chapman & Hall,London, 1995)
38. T. Kvålseth, Note on the R2 measure of goodness of fit fornonlinear models, Bull. Psychon. Soc. 21, 79 (1983)
39. K. Deb, A. Pratap, S. Agarwal, T. Meyarivan, A fast andelitist multiobjective genetic algorithm: NSGA-II, IEEETrans. Evol. Comput. 6, 182 (2002)
40. C. Foncesa, P. Fleming, Genetic algorithms for multi-objective optimization: formulation, discussion and generali-zation, in: Fifth International Conference on GeneticAlgorithms (Morgan Kauffman, San Mateo, CA), 416 (1993)
41. S.F. Fatima, H.N. Chaudhry, Steady-state CFD modellingand experimental analysis of the local microclimate in Dubai(UAE), Sust. Build. 2, 5 (2017)
42. F. Calcerano, C. Cecchini, L. Martinelli, Numerical analysisof passive strategies for energy retrofit of existing buildings inMediterranean climate: thermal mass and natural ventilationcombination, Sust. Build. 2, 4 (2017)
Cite this article as: P. Sofotasiou, B. Hughes and S.A. Ghani: CFD optimisation of a stadium roof geometry: a qualitative study toimprove the wind microenvironment. Sust. Build. 2, 8 (2017).