CFD Analysis of Radiator - Shodhgangashodhganga.inflibnet.ac.in/bitstream/10603/23840/12/12_chapter...
164
Chapter… 3 CFD Analysis of Radiator
Transcript of CFD Analysis of Radiator - Shodhgangashodhganga.inflibnet.ac.in/bitstream/10603/23840/12/12_chapter...

Chapter… 3
CFD Analysis of Radiator
3.1 COMPUTATIONAL FLUID DYNAMICS MODELING
Computational fluid dynamics modeling was developed to predict the characteristics and
performance of flow systems. Overall performance is predicted by breaking the flow system
down into an appropriate number of finite volumes or areas, referred to as cells, and solving
expressions representing the continuity, momentum, and energy equations for each cell. The
process of breaking down the system domain into finite volumes or areas is known as mesh
generation. The number of cells in a mesh varies depending on the level of accuracy required, the
complexity of the system, and the models used. Equations solve for flow (x, y, and z velocities),
energy (heat fluxes and temperatures), chemical reactions (reaction kinetics and species
concentrations), and pressure based on various simplifications and/or assumptions (Anderson J.
D. 1995). Some simplifications and assumptions are discussed below. If performed correctly,
CFD modeling can accurately predict the performance of an entire system.
3.2 MODELING OBJECTIVE
The primary goal of this CFD analysis is to predict a flow behavior of radiator with
supporting velocity profile. CFD simulation is carried in 2 phases, viz.
Phase 1: Geometry and Meshing
1) Geometry modeling will be done in Ansys Workbench
2) Meshing will be done in Ansys Mesher.
a. Unstructured mesh is used for the analysis
b. Fine mesh at specific location to capture the flow behavior.
Phase 2: Steady State Simulation
1) Steady state incompressible simulation is perform for different flow and atmospheric
condition
2) Flow and Heat transfer will be solved considering different working scenario
3) Appropriate turbulence model will be used depending on the Reynolds
Number
1) Flow rates and pressure drops will be observed and verified
3.3 NUMERICAL MODEL DETAILS
The commercial CFD Code Ansys Fluent was used as preprocessor for solving the flow
physics. The computational Domain had to be represented as a finite volume model. Volume
mesh is generated in Ansys Mesher and refinement is done at specific location to capture the
flow behavior. Unstructured volume grid with 1375000 tetra-hydrel cells is used for the
simulation. In Fluent putting appropriate scaling factors for scaling the mesh/geometry, and
setting up the appropriate turbulence model, fluid properties, solver controls, convergence
monitors.
All simulations were performed using the Standard k-e turbulence model. For stability of the
solution the linear upwind scheme was used in the beginning, once stabilized a second order
upwind differencing scheme was used.
3.3.1 Boundary Conditions
Inlet and Outlets: For the inlet and outlet the static pressure is specified, which is fixed to
zero. Side and top walls, pressure outlet is considered. Porous Medium, the radiator is modeled
as porous medium to account for the pressure drop in the radiator.
Multiple Reference Frame (MRF) Zone, in a steady-state approximation in which individual
cell zones can be assigned different rotational speeds. The flow in fan zone is solved using the
moving reference frame equations.
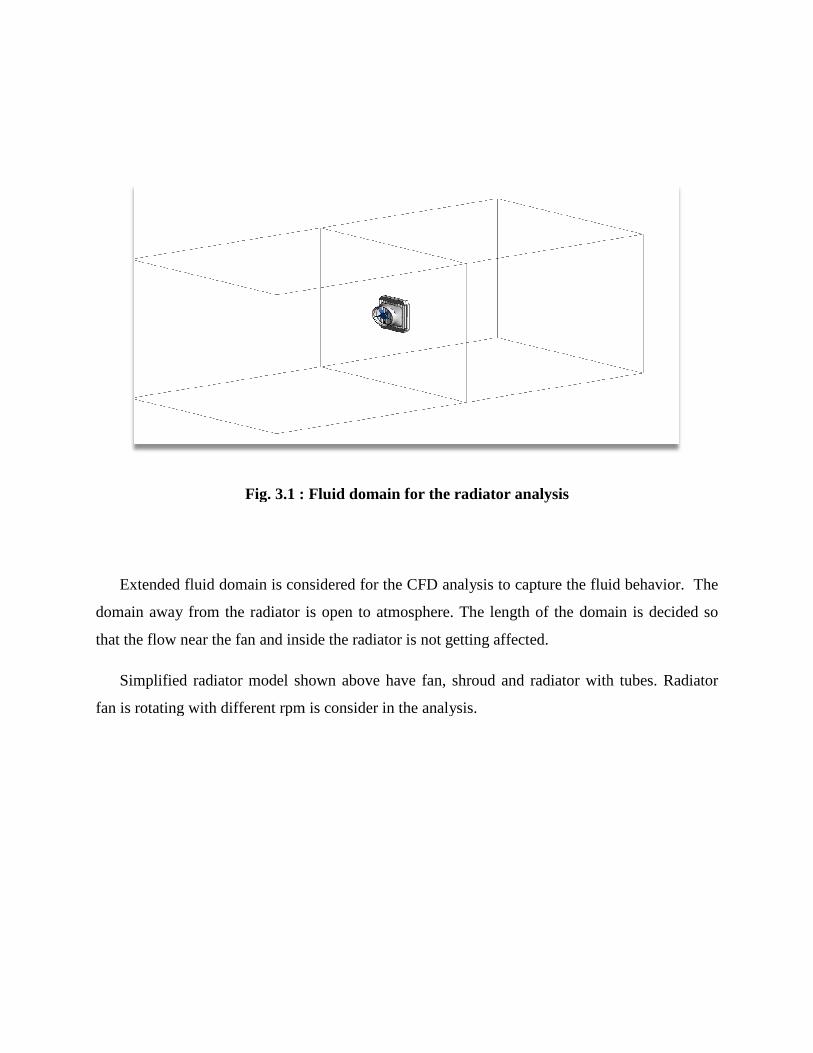
Fig. 3.1 : Fluid domain for the radia
Extended fluid domain is considered for the CFD analysis to capture the fluid behavior. The
domain away from the radiator is open to atmosphere. The length of the domain is decided so
that the flow near the fan and inside the radiator is no
Simplified radiator model shown above have fan, shroud and radiator with tubes. Radiator
fan is rotating with different rpm is consider in the analysis.
Fig. 3.1 : Fluid domain for the radiator analysis
Extended fluid domain is considered for the CFD analysis to capture the fluid behavior. The
domain away from the radiator is open to atmosphere. The length of the domain is decided so
that the flow near the fan and inside the radiator is not getting affected.
Simplified radiator model shown above have fan, shroud and radiator with tubes. Radiator
fan is rotating with different rpm is consider in the analysis.
Extended fluid domain is considered for the CFD analysis to capture the fluid behavior. The
domain away from the radiator is open to atmosphere. The length of the domain is decided so
Simplified radiator model shown above have fan, shroud and radiator with tubes. Radiator
3.4 RESULTS AT 1500 RPM
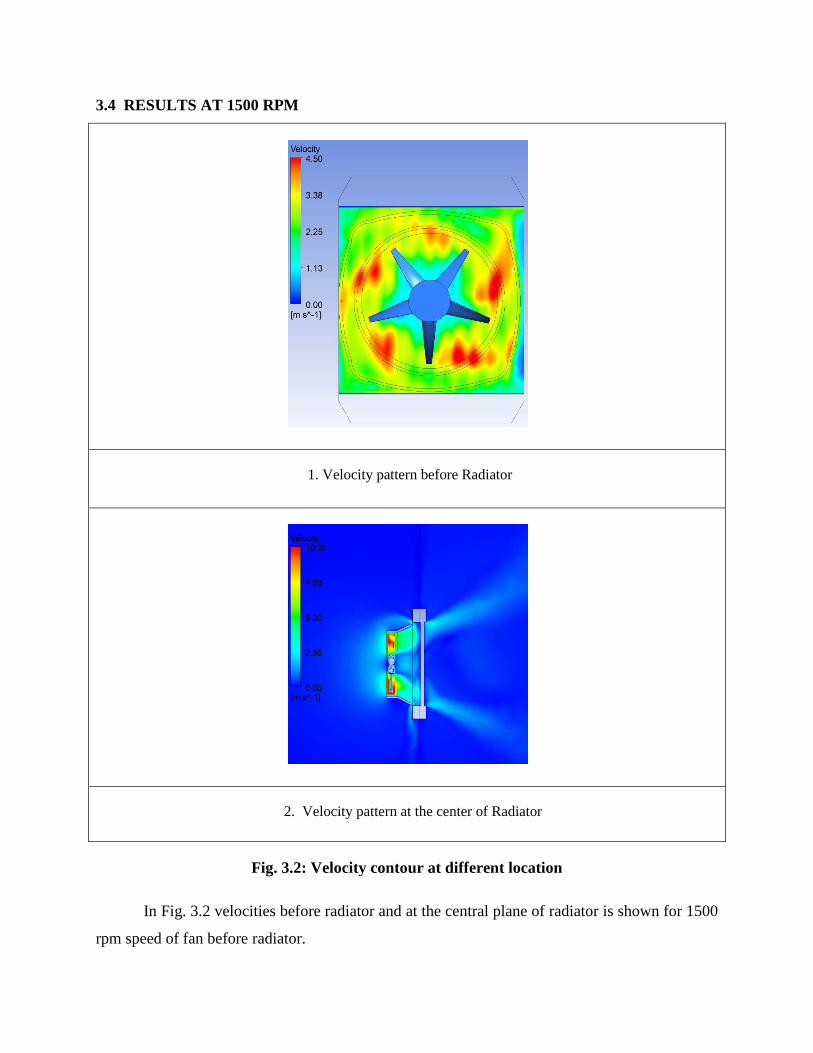
1. Velocity pattern before Radiator
2. Velocity pattern at the center of Radiator
Fig. 3.2: Velocity contour at different location
In Fig. 3.2 velocities before radiator and at the central plane of radiator is shown for 1500
rpm speed of fan before radiator.
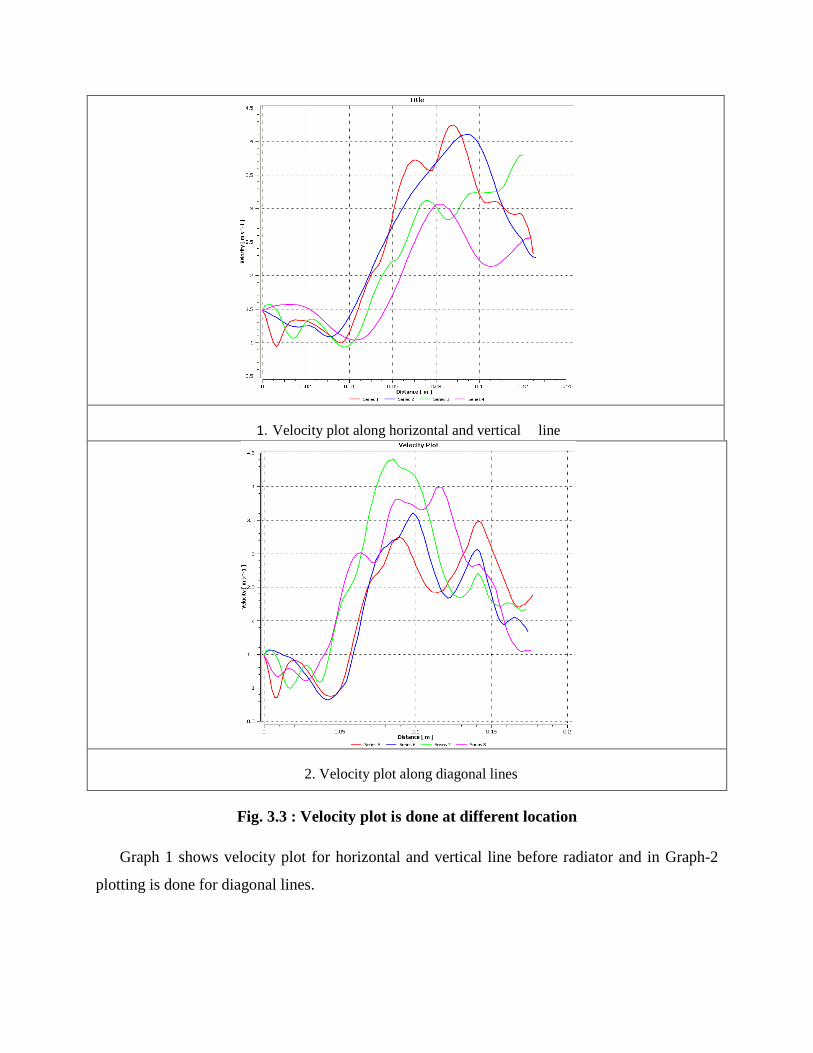
1. Velocity plot along horizontal and vertical line
2. Velocity plot along diagonal lines
Fig. 3.3 : Velocity plot is done at different location
Graph 1 shows velocity plot for horizontal and vertical line before radiator and in Graph-2
plotting is done for diagonal lines.
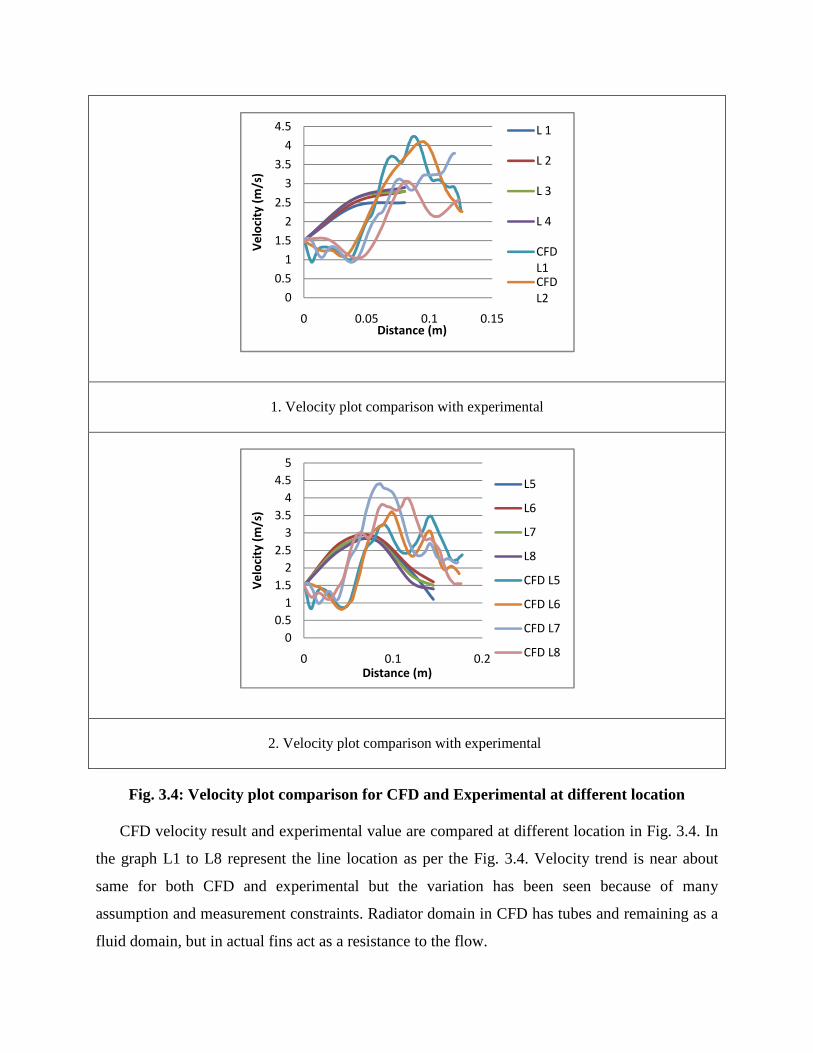
1. Velocity plot comparison with experimental
2. Velocity plot comparison with experimental
Fig. 3.4: Velocity plot comparison for CFD and Experimental at different location
CFD velocity result and experimental value are compared at different location in Fig. 3.4. In
the graph L1 to L8 represent the line location as per the Fig. 3.4. Velocity trend is near about
same for both CFD and experimental but the variation has been seen because of many
assumption and measurement constraints. Radiator domain in CFD has tubes and remaining as a
fluid domain, but in actual fins act as a resistance to the flow.
0
0.5
1
1.5
2
2.5
3
3.5
4
4.5
0 0.05 0.1 0.15
Ve
loci
ty (
m/s
)
Distance (m)
L 1
L 2
L 3
L 4
CFD
L1CFD
L2
0
0.5
1
1.5
2
2.5
3
3.5
4
4.5
5
0 0.1 0.2
Ve
loci
ty (
m/s
)
Distance (m)
L5
L6
L7
L8
CFD L5
CFD L6
CFD L7
CFD L8
3.5 RESULTS AT 1800 RPM
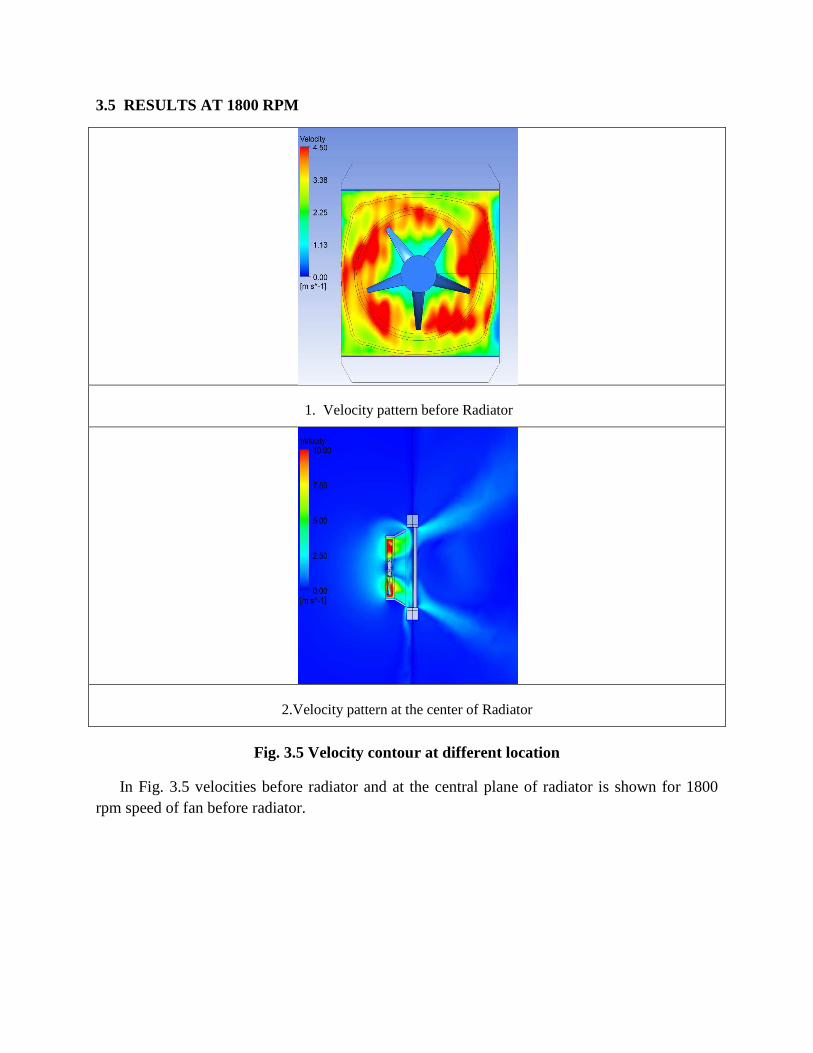
1. Velocity pattern before Radiator
2.Velocity pattern at the center of Radiator
Fig. 3.5 Velocity contour at different location
In Fig. 3.5 velocities before radiator and at the central plane of radiator is shown for 1800 rpm speed of fan before radiator.
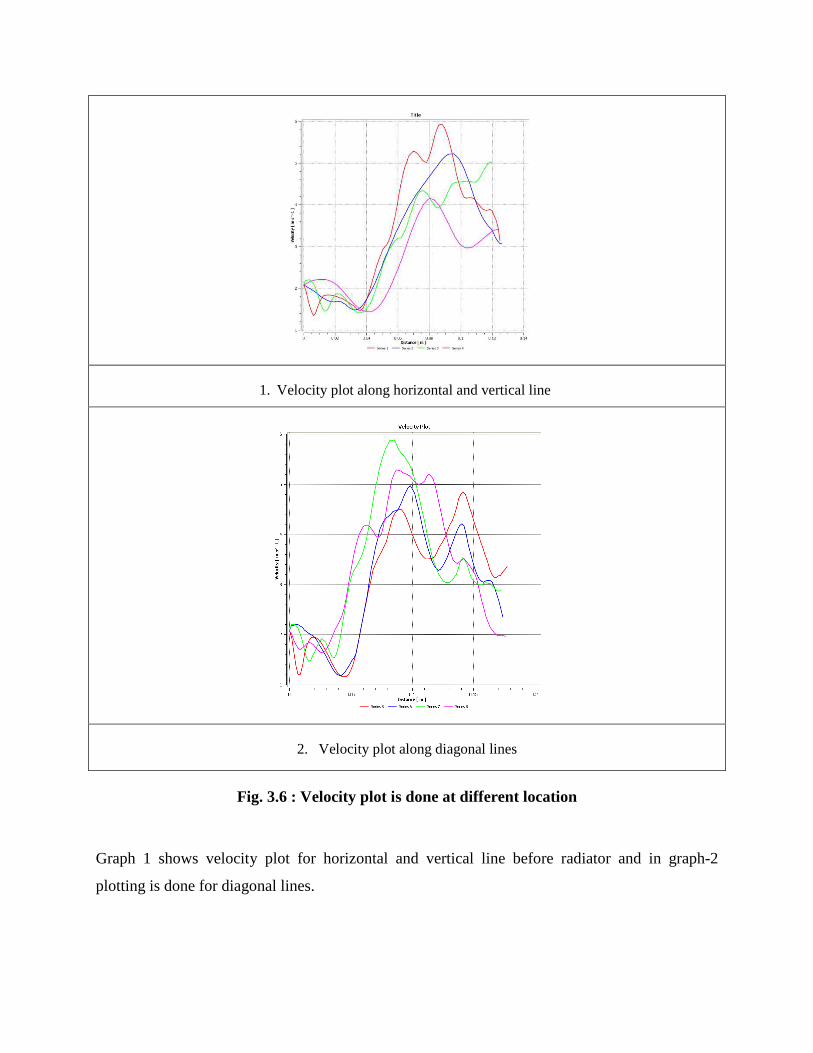
1. Velocity plot along horizontal and vertical line
2. Velocity plot along diagonal lines
Fig. 3.6 : Velocity plot is done at different location
Graph 1 shows velocity plot for horizontal and vertical line before radiator and in graph-2
plotting is done for diagonal lines.
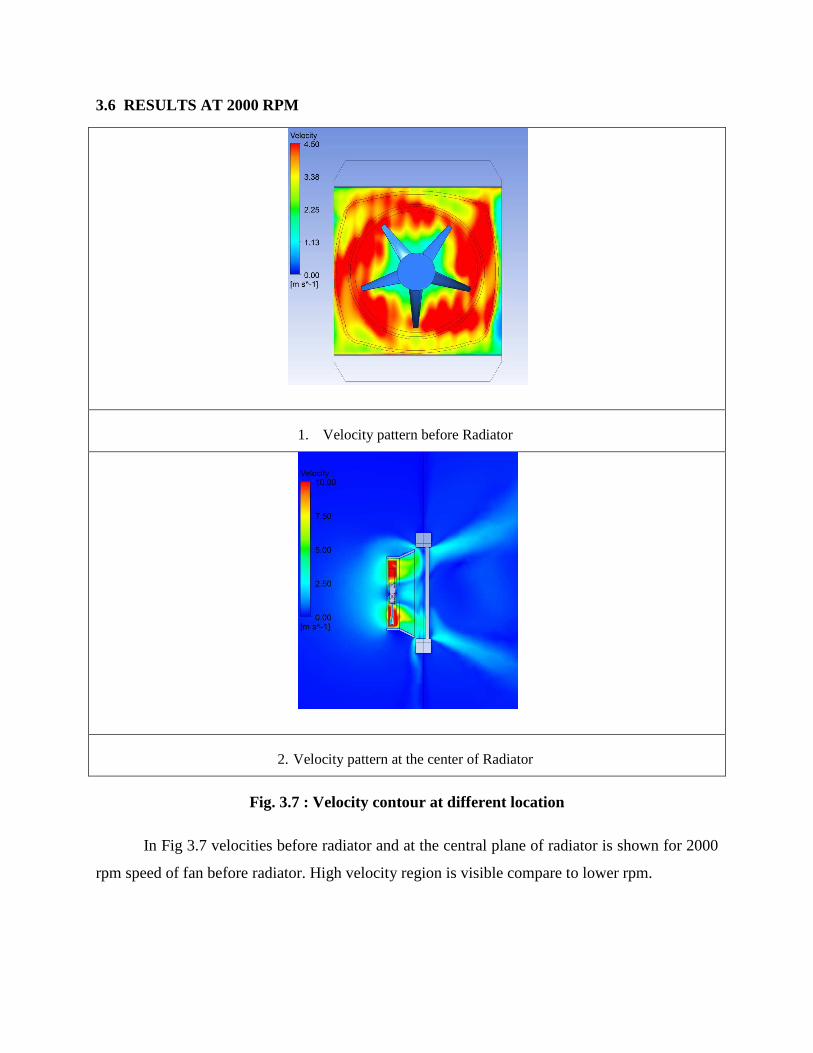
3.6 RESULTS AT 2000 RPM
1. Velocity pattern before Radiator
2. Velocity pattern at the center of Radiator
Fig. 3.7 : Velocity contour at different location
In Fig 3.7 velocities before radiator and at the central plane of radiator is shown for 2000
rpm speed of fan before radiator. High velocity region is visible compare to lower rpm.
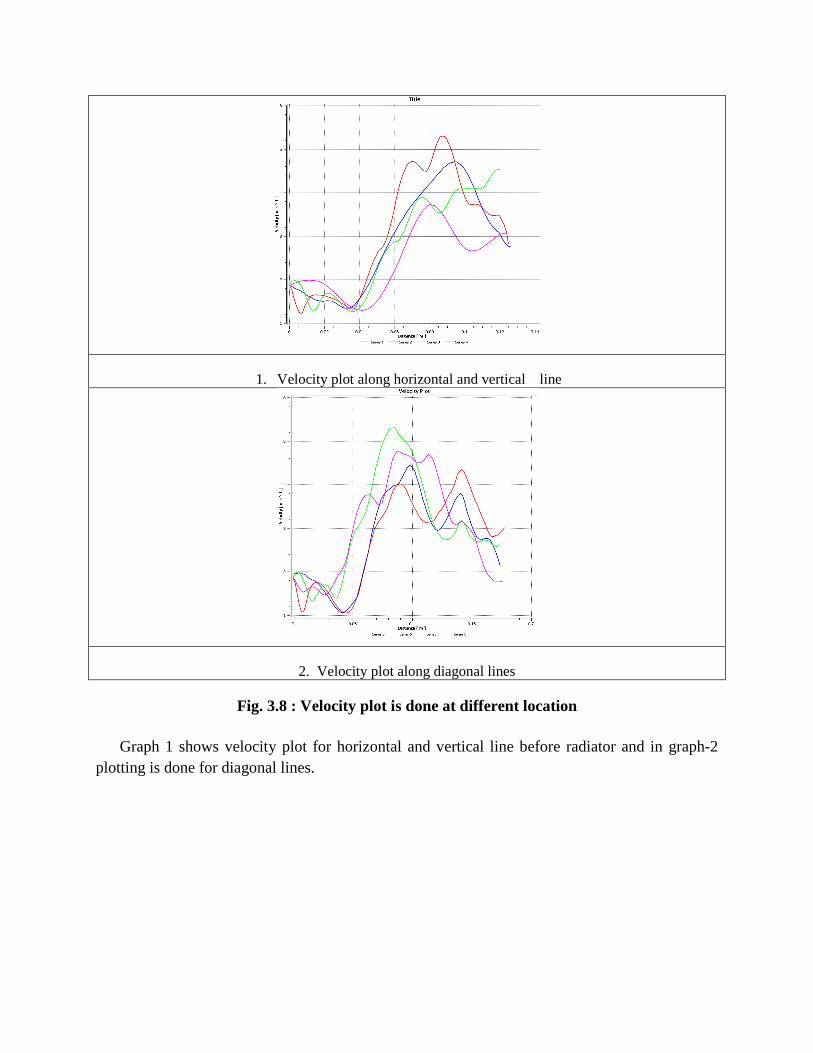
1. Velocity plot along horizontal and vertical line
2. Velocity plot along diagonal lines
Fig. 3.8 : Velocity plot is done at different location
Graph 1 shows velocity plot for horizontal and vertical line before radiator and in graph-2 plotting is done for diagonal lines.
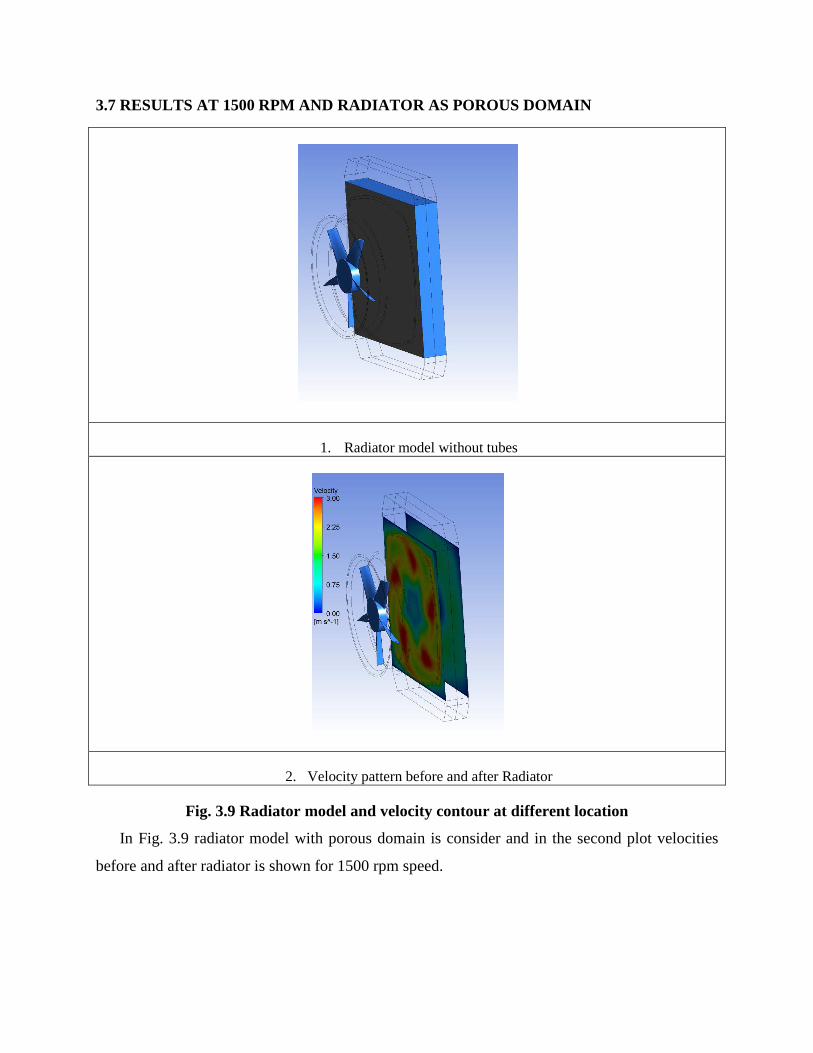
3.7 RESULTS AT 1500 RPM AND RADIATOR AS POROUS DOMAIN
1. Radiator model without tubes
2. Velocity pattern before and after Radiator
Fig. 3.9 Radiator model and velocity contour at different location
In Fig. 3.9 radiator model with porous domain is consider and in the second plot velocities
before and after radiator is shown for 1500 rpm speed.
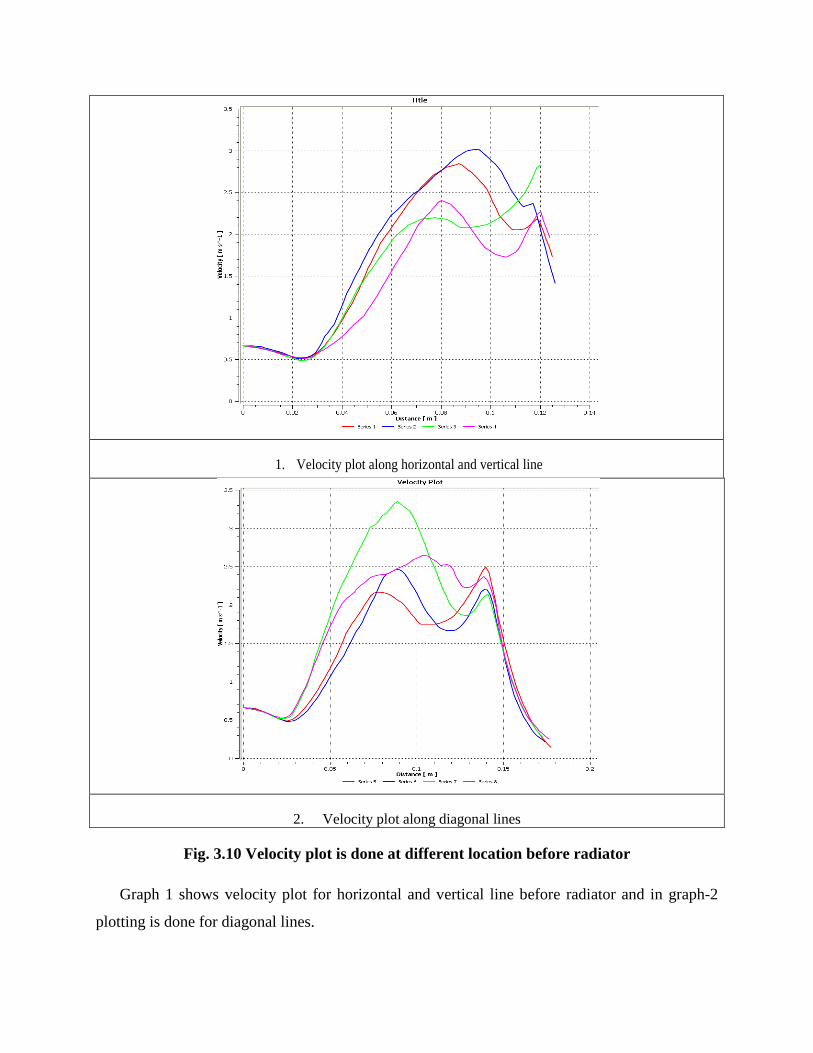
1. Velocity plot along horizontal and vertical line
2. Velocity plot along diagonal lines
Fig. 3.10 Velocity plot is done at different location before radiator
Graph 1 shows velocity plot for horizontal and vertical line before radiator and in graph-2
plotting is done for diagonal lines.
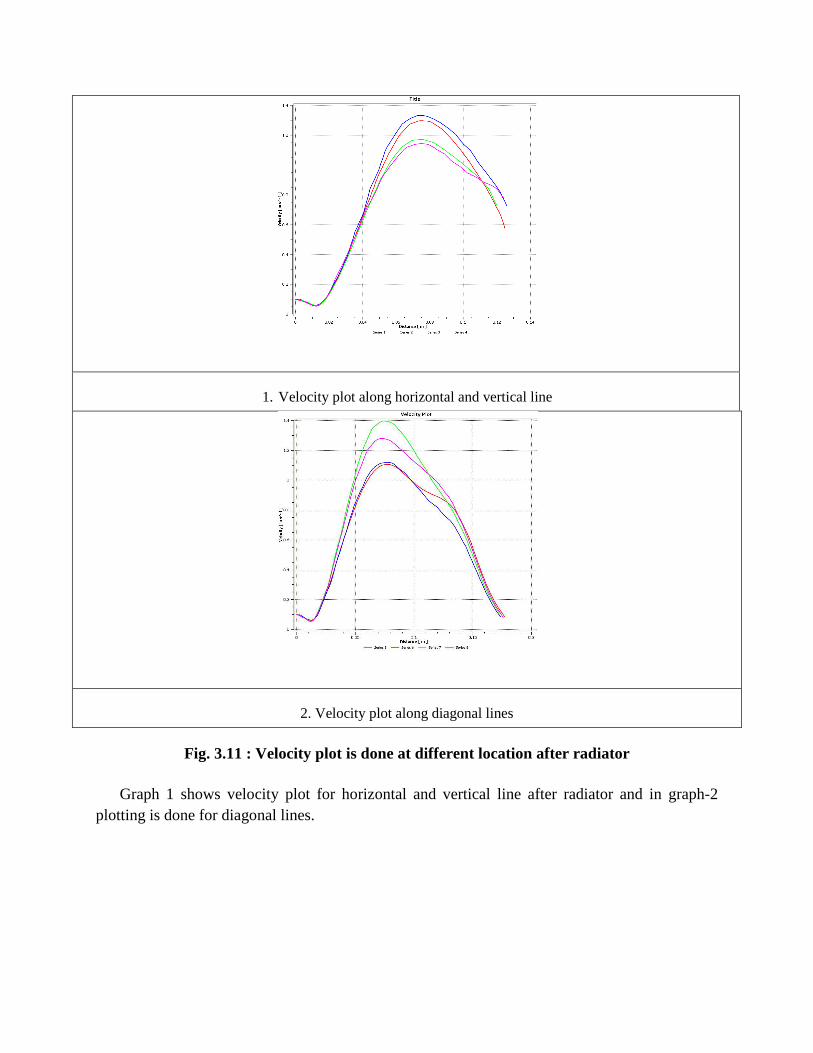
1. Velocity plot along horizontal and vertical line
2. Velocity plot along diagonal lines
Fig. 3.11 : Velocity plot is done at different location after radiator
Graph 1 shows velocity plot for horizontal and vertical line after radiator and in graph-2 plotting is done for diagonal lines.
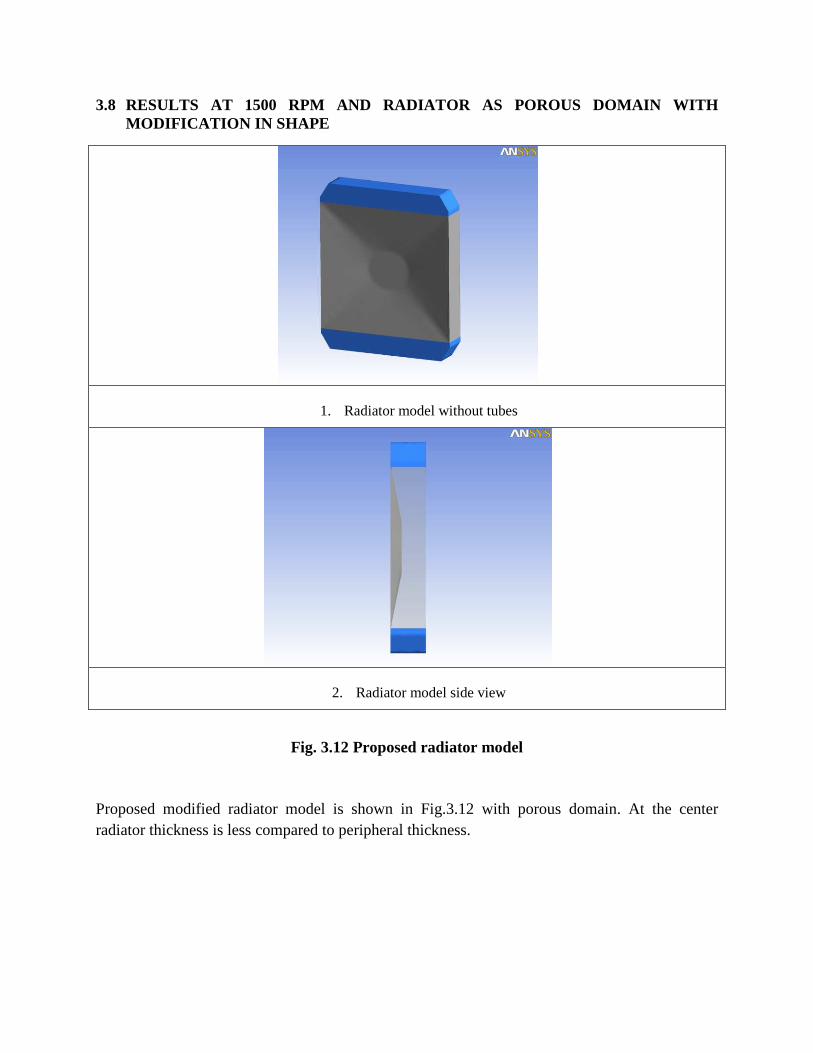
3.8 RESULTS AT 1500 RPM AND RADIATOR AS POROUS DOMAIN WITH MODIFICATION IN SHAPE
1. Radiator model without tubes
2. Radiator model side view
Fig. 3.12 Proposed radiator model
Proposed modified radiator model is shown in Fig.3.12 with porous domain. At the center radiator thickness is less compared to peripheral thickness.
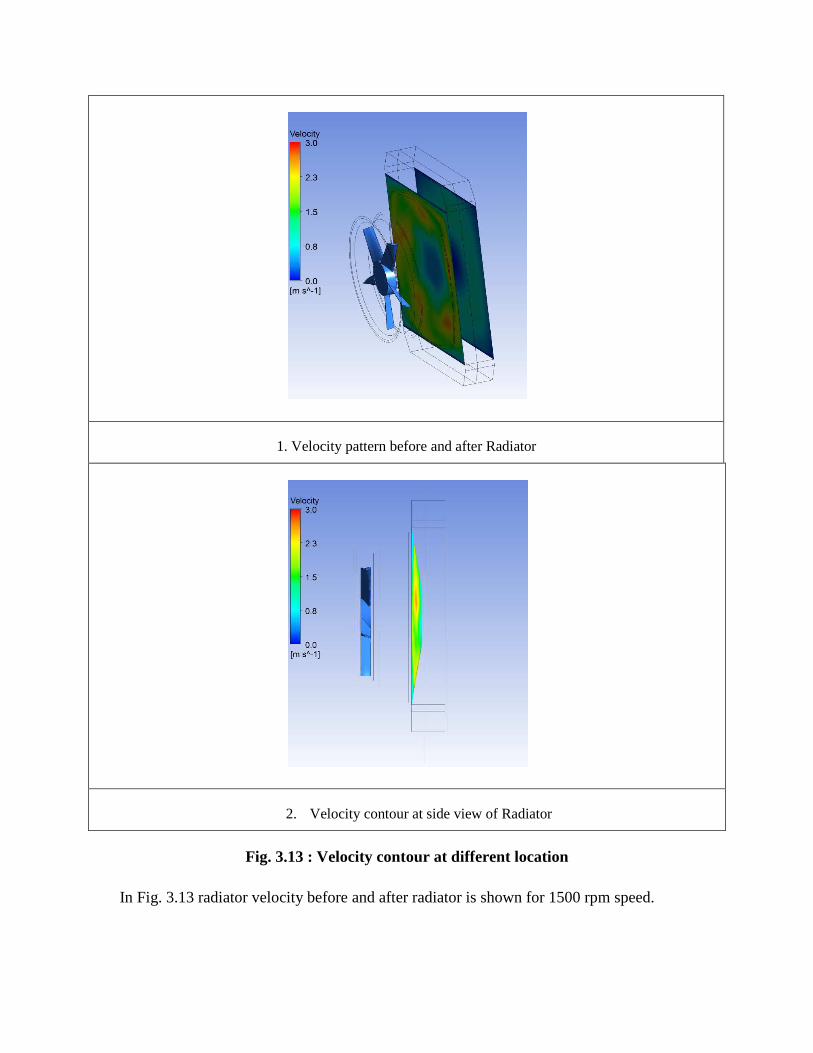
1. Velocity pattern before and after Radiator
2. Velocity contour at side view of Radiator
Fig. 3.13 : Velocity contour at different location
In Fig. 3.13 radiator velocity before and after radiator is shown for 1500 rpm speed.
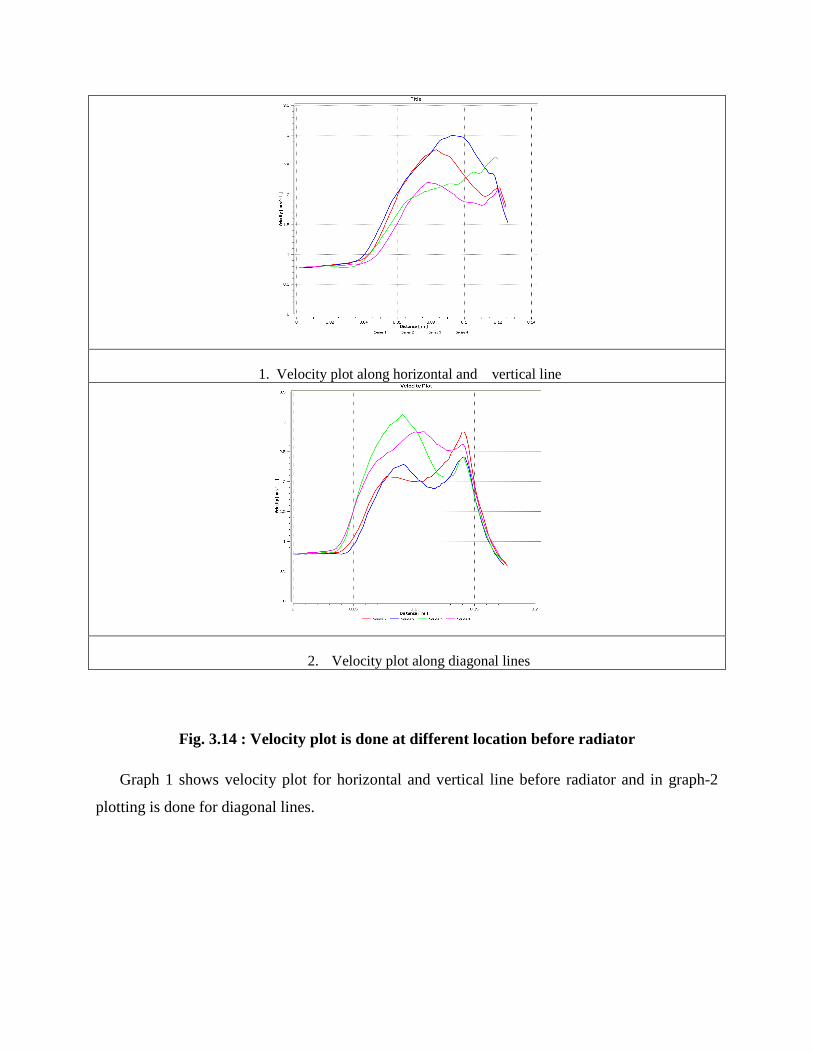
1. Velocity plot along horizontal and vertical line
2. Velocity plot along diagonal lines
Fig. 3.14 : Velocity plot is done at different location before radiator
Graph 1 shows velocity plot for horizontal and vertical line before radiator and in graph-2
plotting is done for diagonal lines.
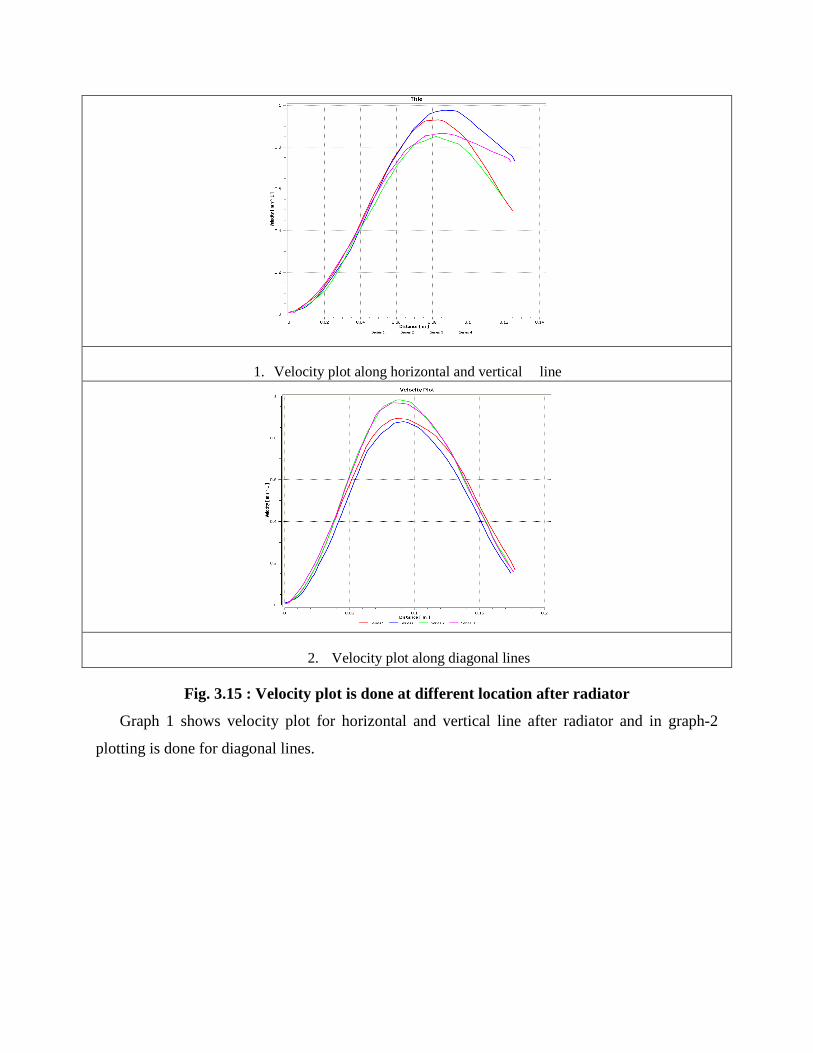
1. Velocity plot along horizontal and vertical line
2. Velocity plot along diagonal lines
Fig. 3.15 : Velocity plot is done at different location after radiator
Graph 1 shows velocity plot for horizontal and vertical line after radiator and in graph-2
plotting is done for diagonal lines.
3.9 RESULTS & DISCUSSION
CFD simulation for different revolutions of fan is shown in Figs.3.2, 3.5, 3.7, 3.9, 3.13, it can be observed that,
1. Velocity of air increases with the increase in rpm of radiator fan.
2. CFD and experimental velocity values are compared at different locations in Fig. 3.4 for 1500 rpm.
3. Fins are not considered in the simulation. It will also create some resistance to the flow. Radiator domain in CFD has tubes and remaining as a fluid domain.
4. Variations in the results obtained by CFD and experimentation are observed near about 15 to 20% at different locations.
5. It can be observed that average velocity of air entering before the radiator inlet at the center core is almost zero, and it increases towards the periphery, because of change in shape. (For proposed radiator with porous zone as shown in fig. 3.12)
6. Shape optimization can be done to improve the radiator efficiency i.e.,
i) Smaller fins are provided at the centre and length of the fins increases towards periphery.
ii) Low velocity zones are created in the corners, hence eliminate corners and have circular radiator for optimum efficiency.
7. The new proposed radiator shape with porous zone is shown fig 3.12.
8. It is also observed from CFD analysis that, velocity of air increases from centre to extreme and further it remains constant.
9. Further it can be concluded that the air entering in the radiator, with new proposed
design possesses almost constant velocity at the exit.
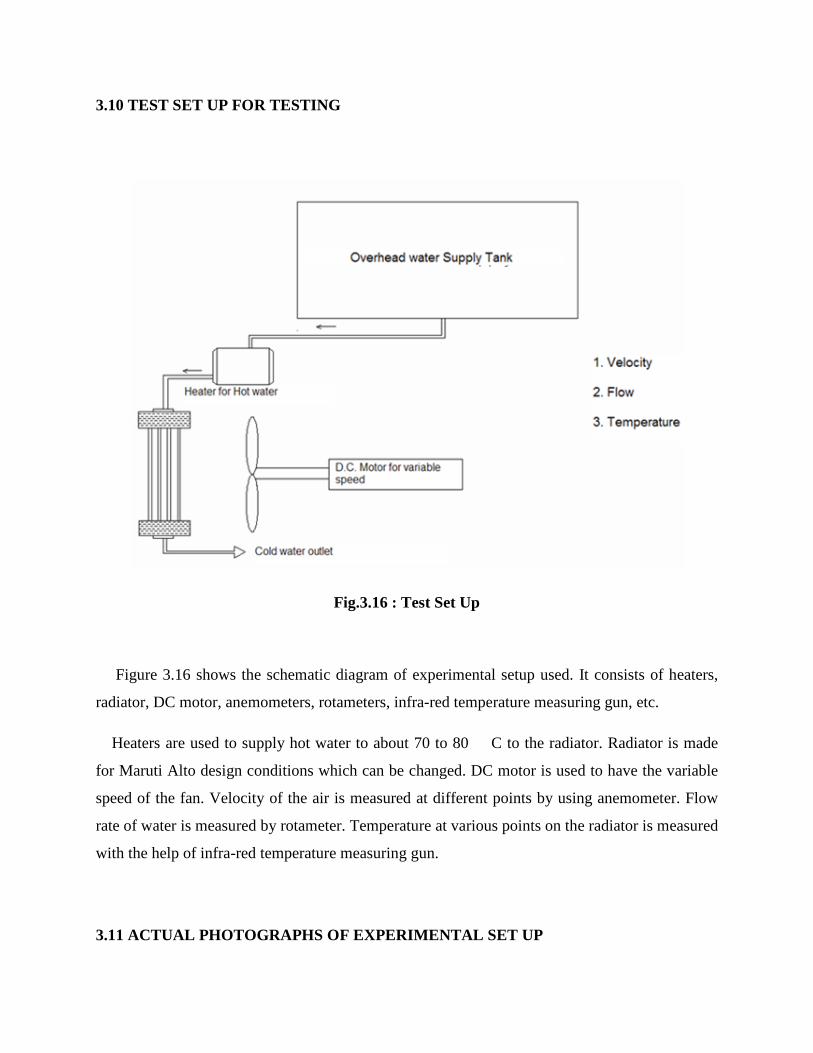
3.10 TEST SET UP FOR TESTING
Fig.3.16 : Test Set Up
Figure 3.16 shows the schematic diagram of experimental setup used. It consists of heaters,
radiator, DC motor, anemometers, rotameters, infra-red temperature measuring gun, etc.
Heaters are used to supply hot water to about 70 to 80 � C to the radiator. Radiator is made
for Maruti Alto design conditions which can be changed. DC motor is used to have the variable
speed of the fan. Velocity of the air is measured at different points by using anemometer. Flow
rate of water is measured by rotameter. Temperature at various points on the radiator is measured
with the help of infra-red temperature measuring gun.
3.11 ACTUAL PHOTOGRAPHS OF EXPERIMENTAL SET UP
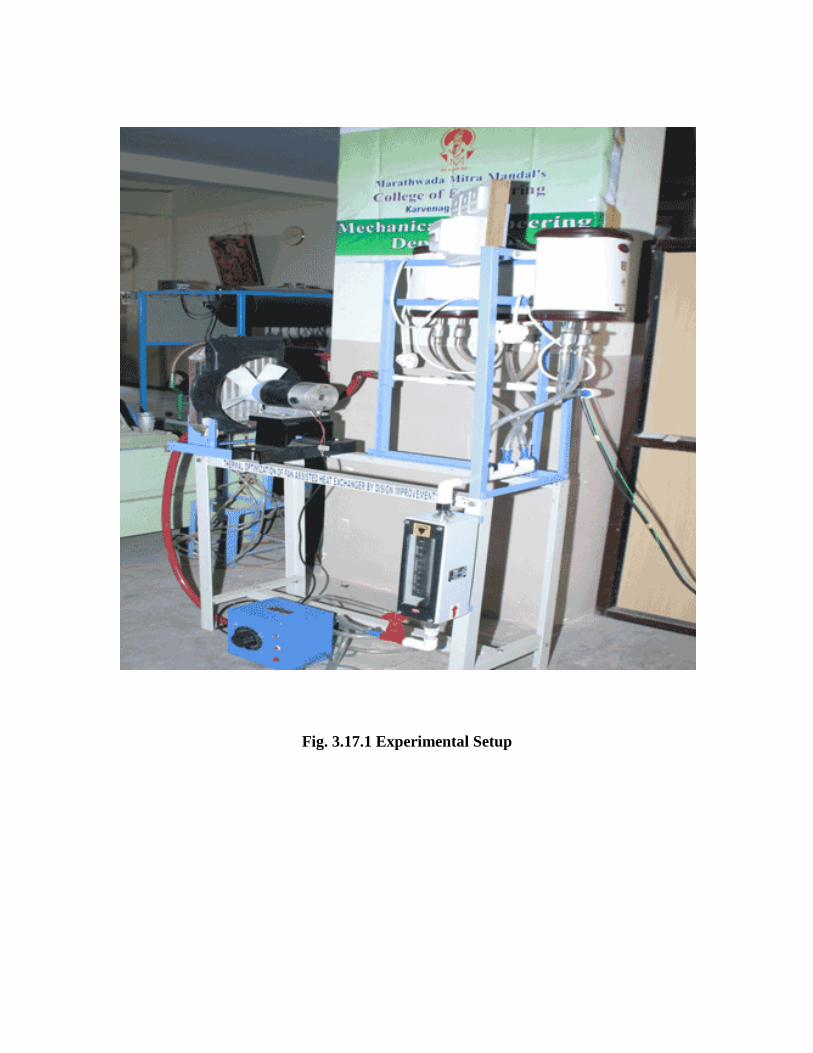
Fig. 3.17.1 Experimental Setup
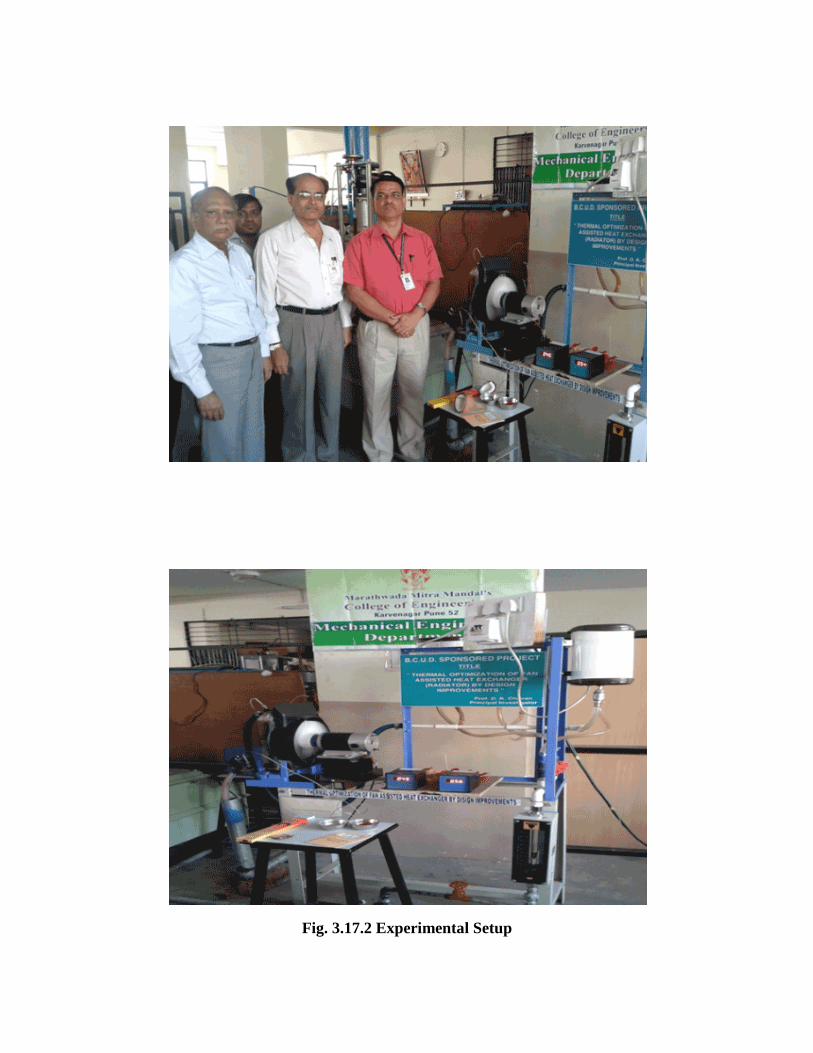
Fig. 3.17.2 Experimental Setup
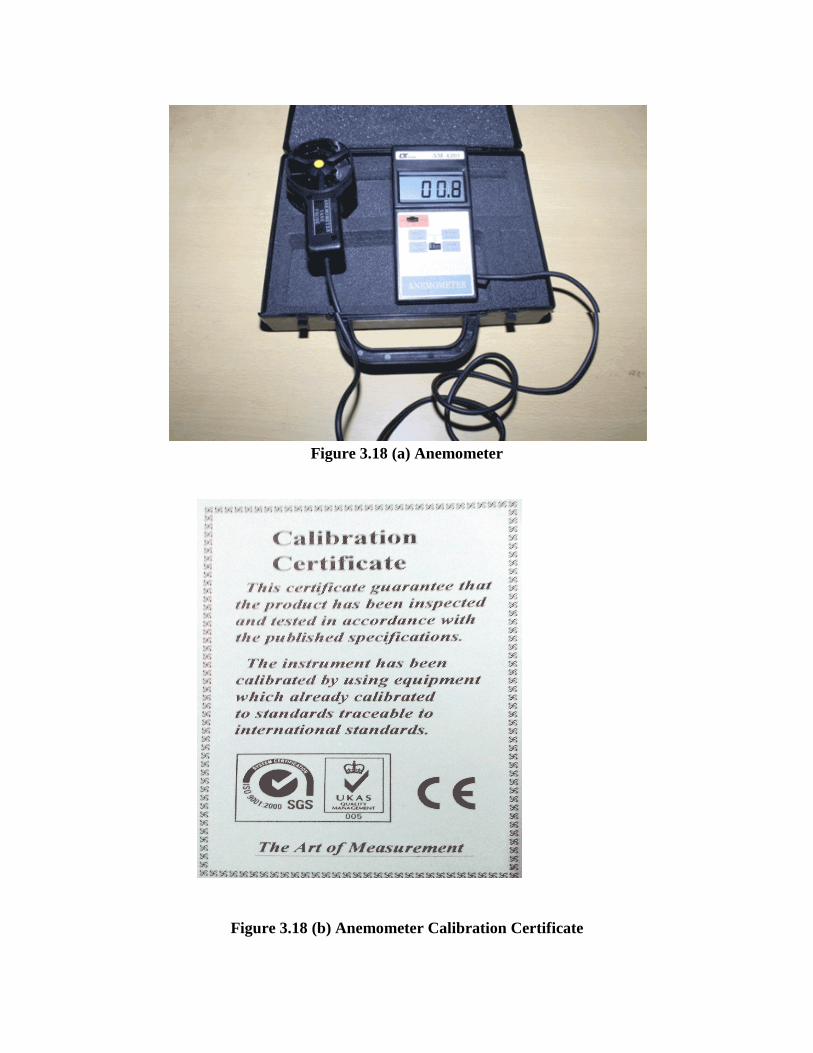
Figure 3.18 (a) Anemometer
Figure 3.18 (b) Anemometer Calibration Certificate
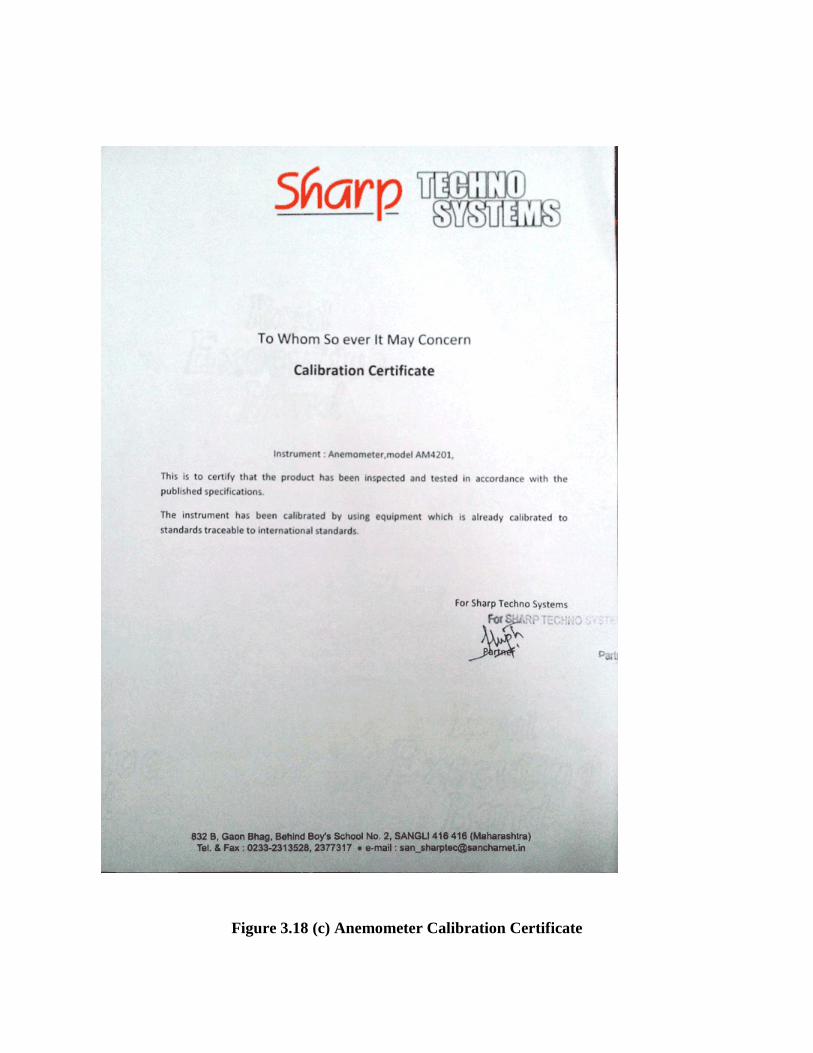
Figure 3.18 (c) Anemometer Calibration Certificate

Figure 3.19 (a) Infrared Temperature Measuring Gun
Figure 3.19 (b) Infrared Temperature Measuring Gun Calibration Certificate
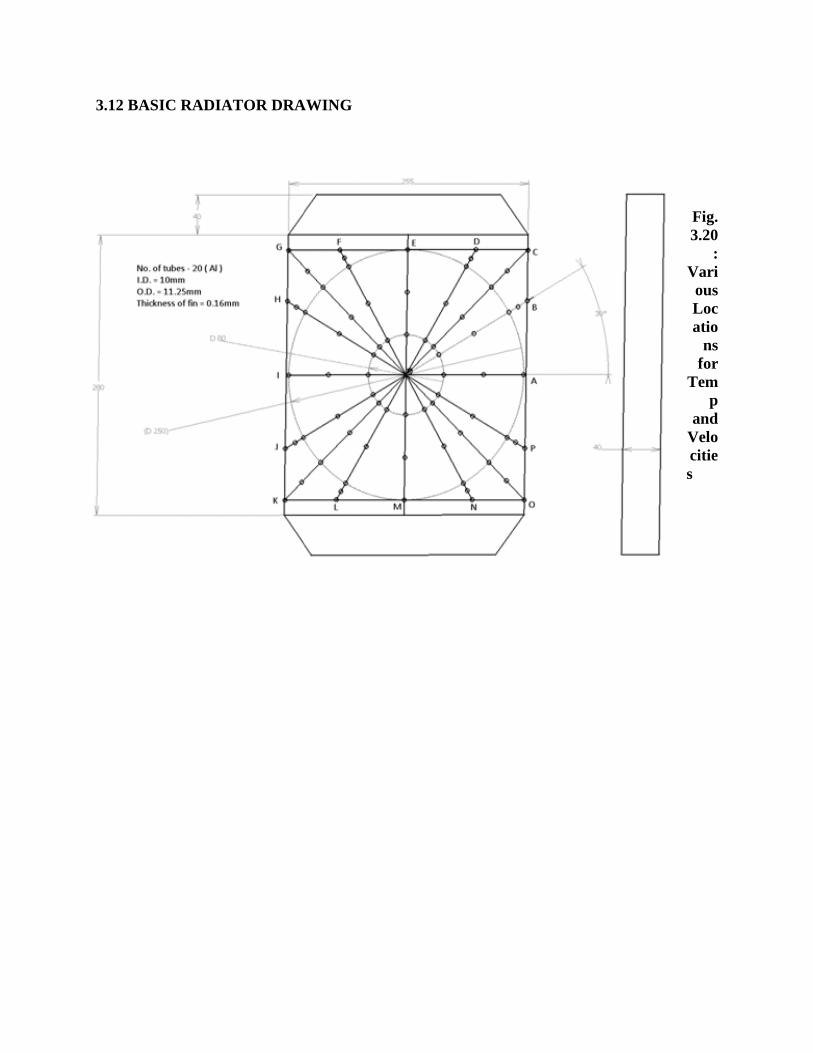
3.12 BASIC RADIATOR DRAWING
3.12 BASIC RADIATOR DRAWING
Fig. 3.20
: Various Locatio
ns for
Temp
and Velocities
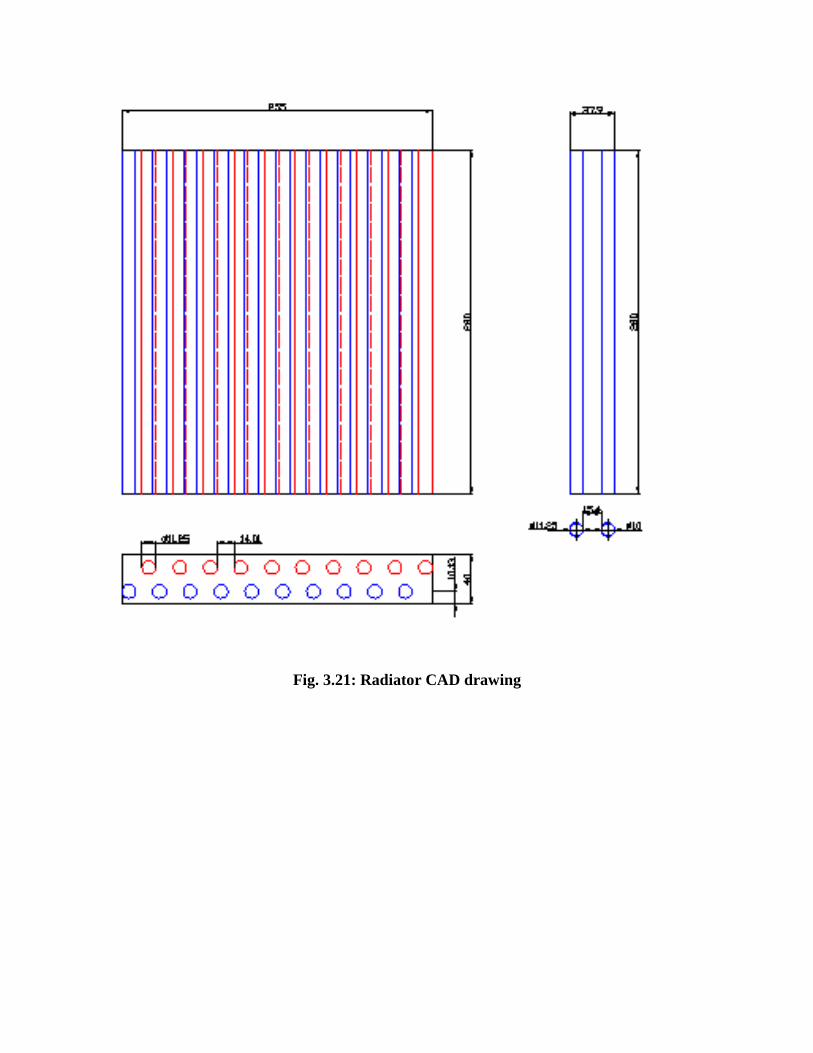
Fig. 3.21: Radiator CAD drawing
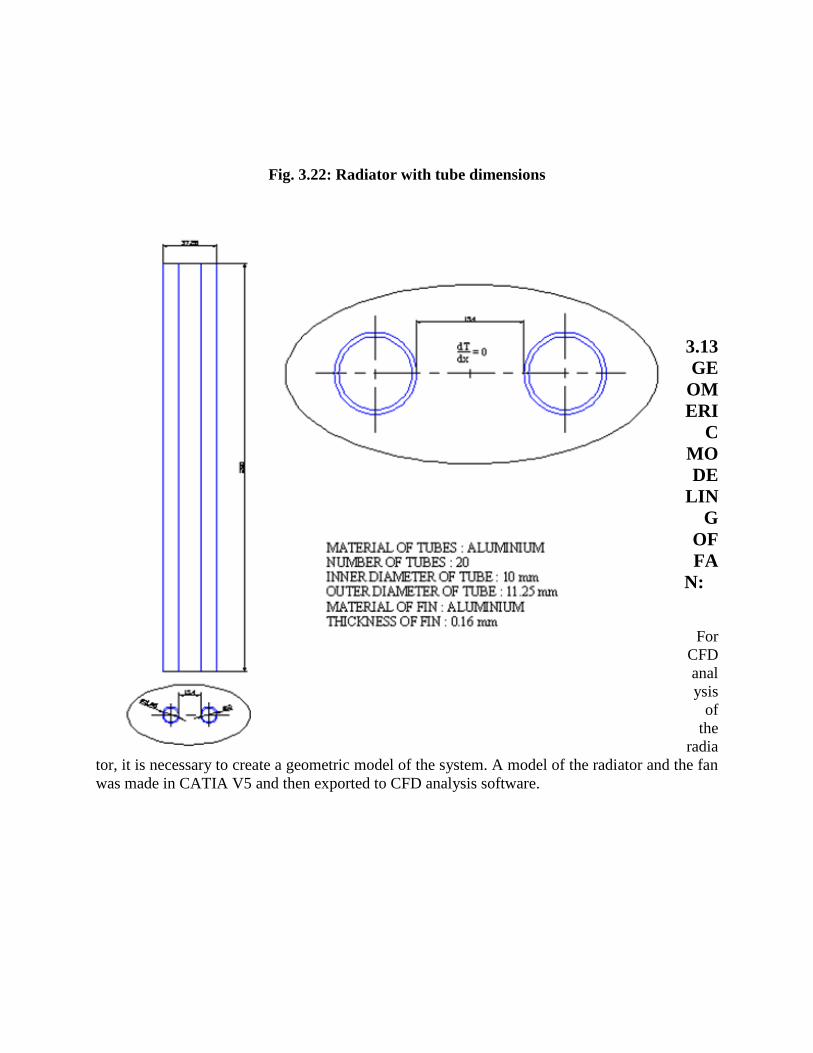
Fig. 3.22: Radiator with tube dimensions
3.13 GEOMERI
C MODE
LING
OF FA
N:
For
CFD analysis
of the
radiator, it is necessary to create a geometric model of the system. A model of the radiator and the fan was made in CATIA V5 and then exported to CFD analysis software.
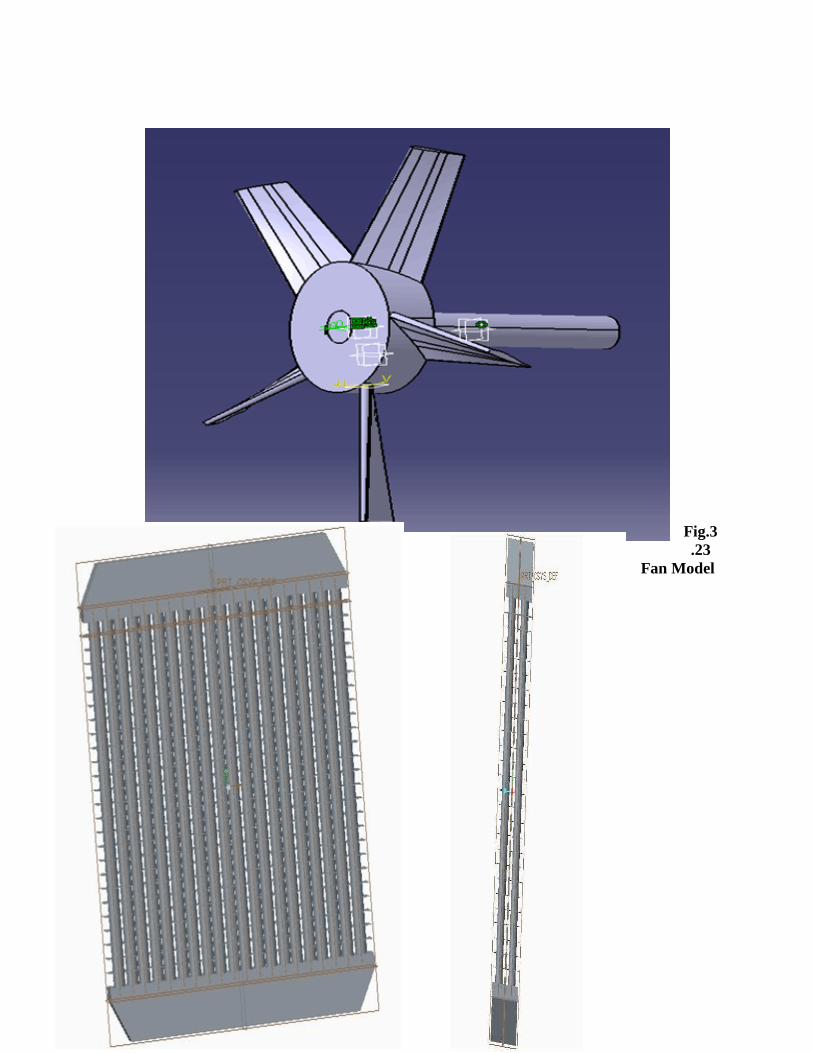
Fig.3.23
Fan Model

Fig.3.24 Radiator Models
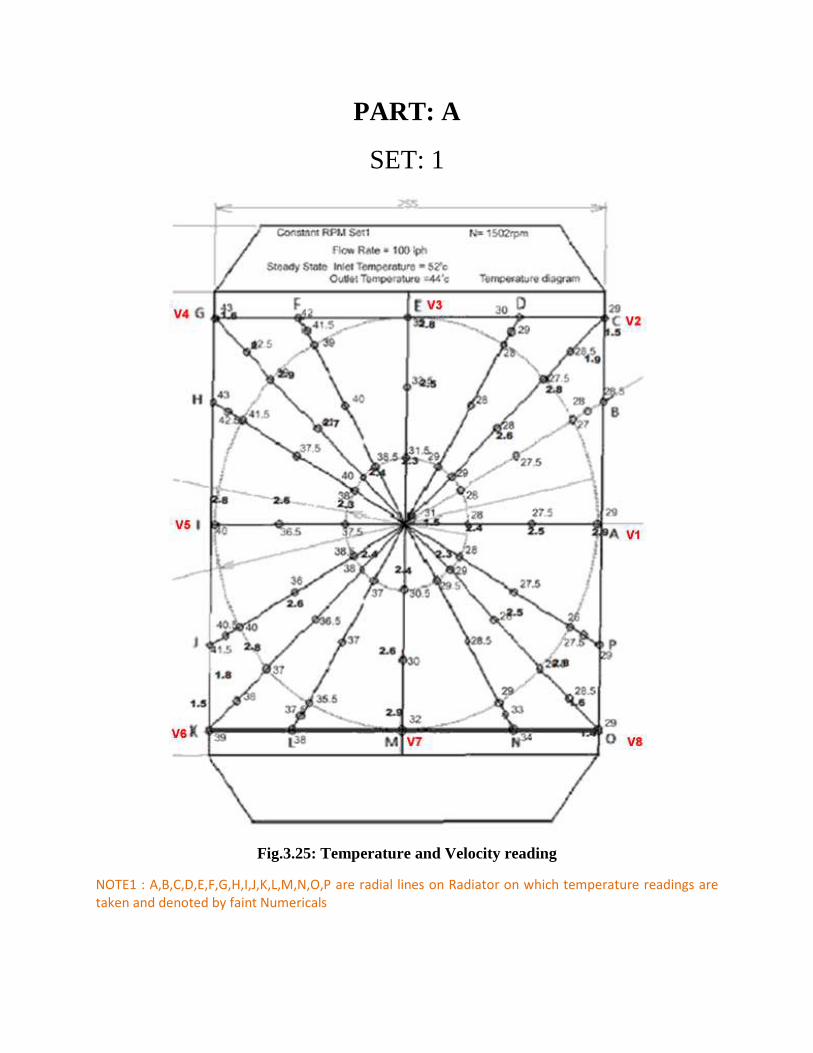
PART: A
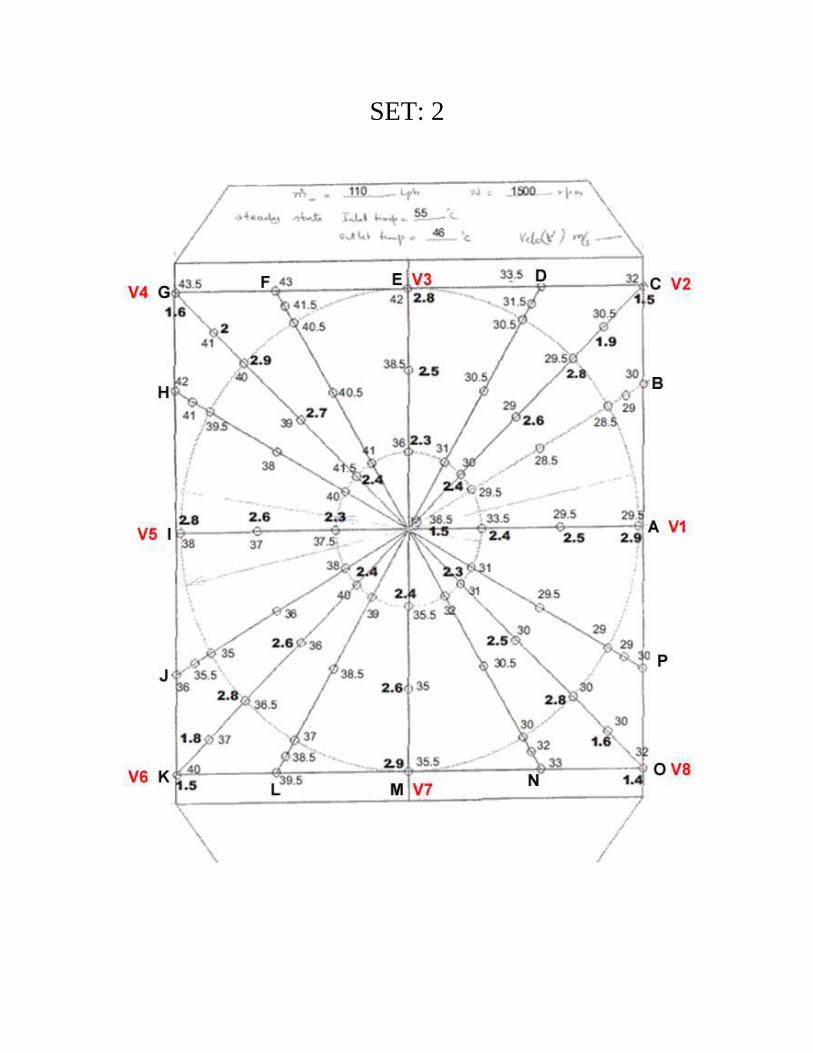
SET: 1
Fig.3.25: Temperature and Velocity reading
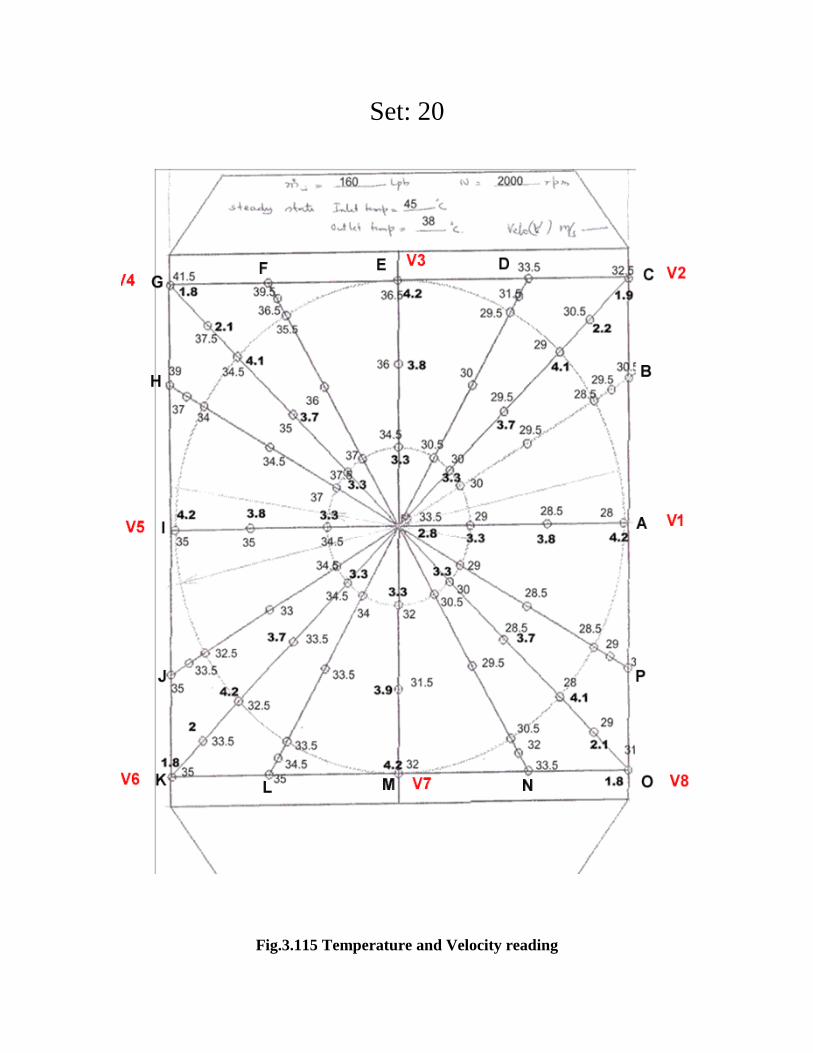
NOTE1 : A,B,C,D,E,F,G,H,I,J,K,L,M,N,O,P are radial lines on Radiator on which temperature readings are
taken and denoted by faint Numericals
NOTE2 : V1,V2,V3,V4,V5,V6,V7,V8 are radial lines on Radiator on which Velocity reading are taken and
denoted by Dark Numerical
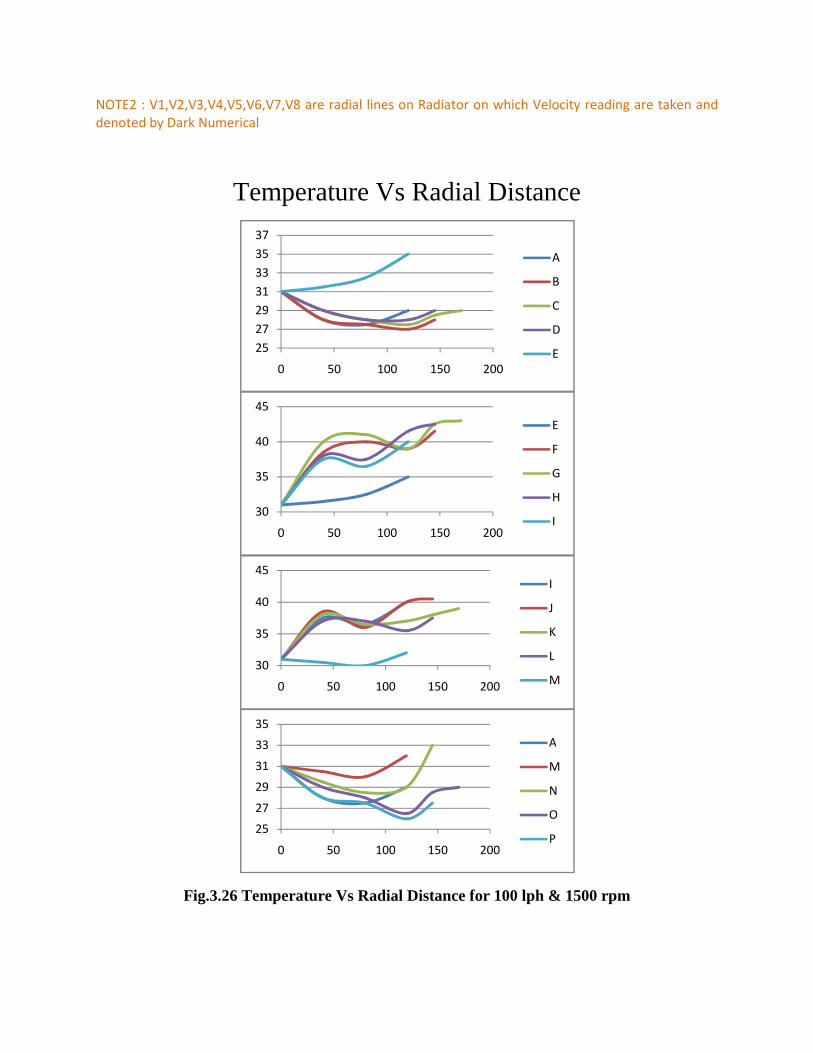
Temperature Vs Radial Distance
Fig.3.26 Temperature Vs Radial Distance for 100 lph & 1500 rpm
25
27
29
31
33
35
37
0 50 100 150 200
A
B
C
D
E
30
35
40
45
0 50 100 150 200
E
F
G
H
I
30
35
40
45
0 50 100 150 200
I
J
K
L
M
25
27
29
31
33
35
0 50 100 150 200
A
M
N
O
P
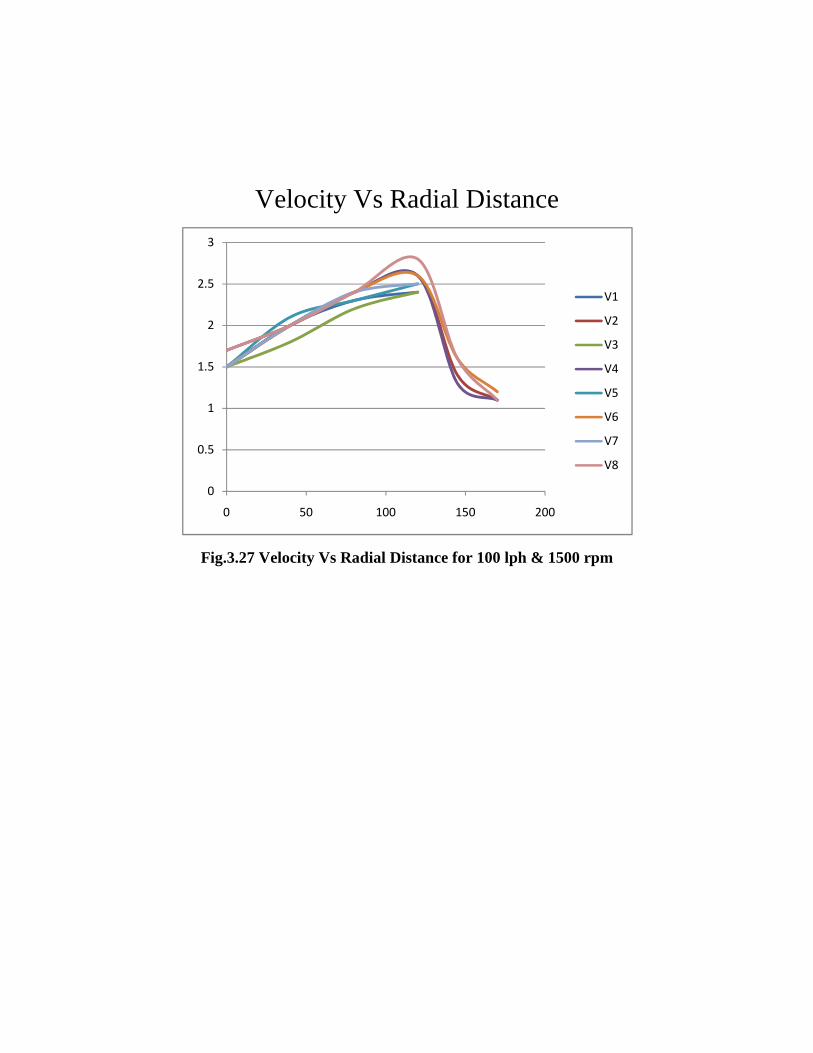
Velocity Vs Radial Distance
Fig.3.27 Velocity Vs Radial Distance for 100 lph & 1500 rpm
0
0.5
1
1.5
2
2.5
3
0 50 100 150 200
V1
V2
V3
V4
V5
V6
V7
V8
SET: 2
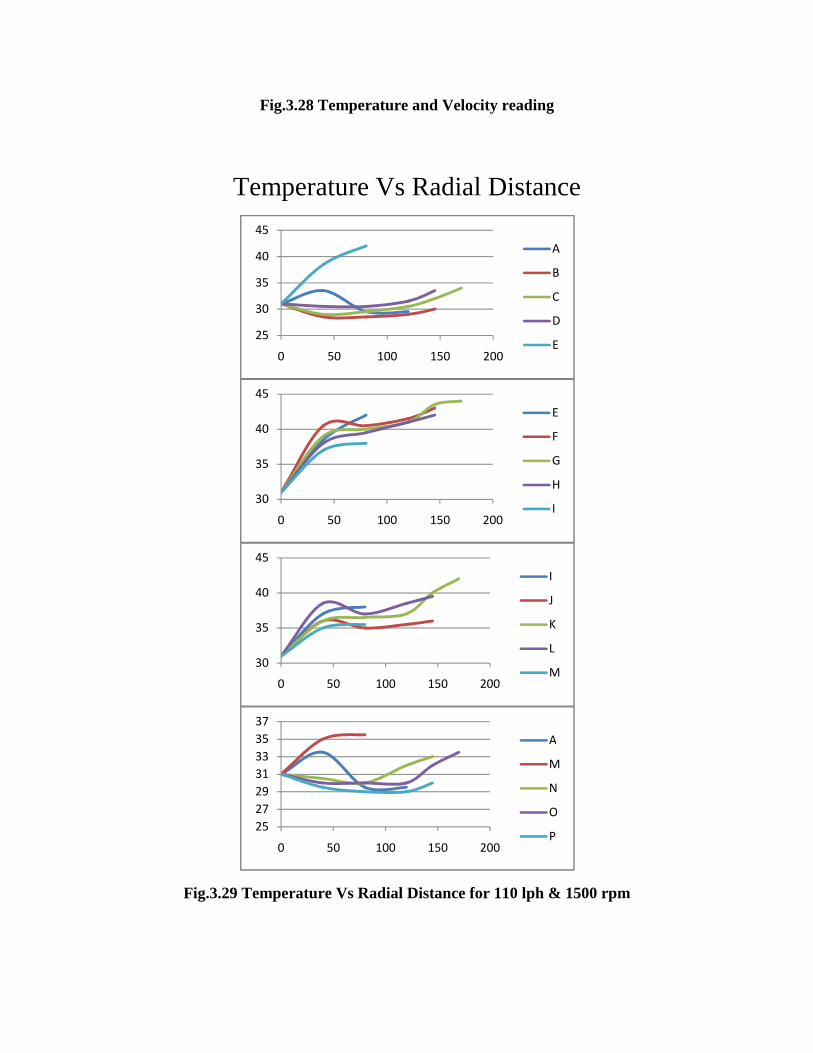
Fig.3.28 Temperature and Velocity reading
Temperature Vs Radial Distance
Fig.3.29 Temperature Vs Radial Distance for 110 lph & 1500 rpm
25
30
35
40
45
0 50 100 150 200
A
B
C
D
E
30
35
40
45
0 50 100 150 200
E
F
G
H
I
30
35
40
45
0 50 100 150 200
I
J
K
L
M
25
27
29
31
33
35
37
0 50 100 150 200
A
M
N
O
P

Velocity Vs Radial Distance
Fig.3.30 Velocity Vs. Radial Distance for 110 lph & 1500 rpm
0
0.5
1
1.5
2
2.5
3
3.5
0 50 100 150 200
V1
V2
V3
V4
V5
V6
V7
V8
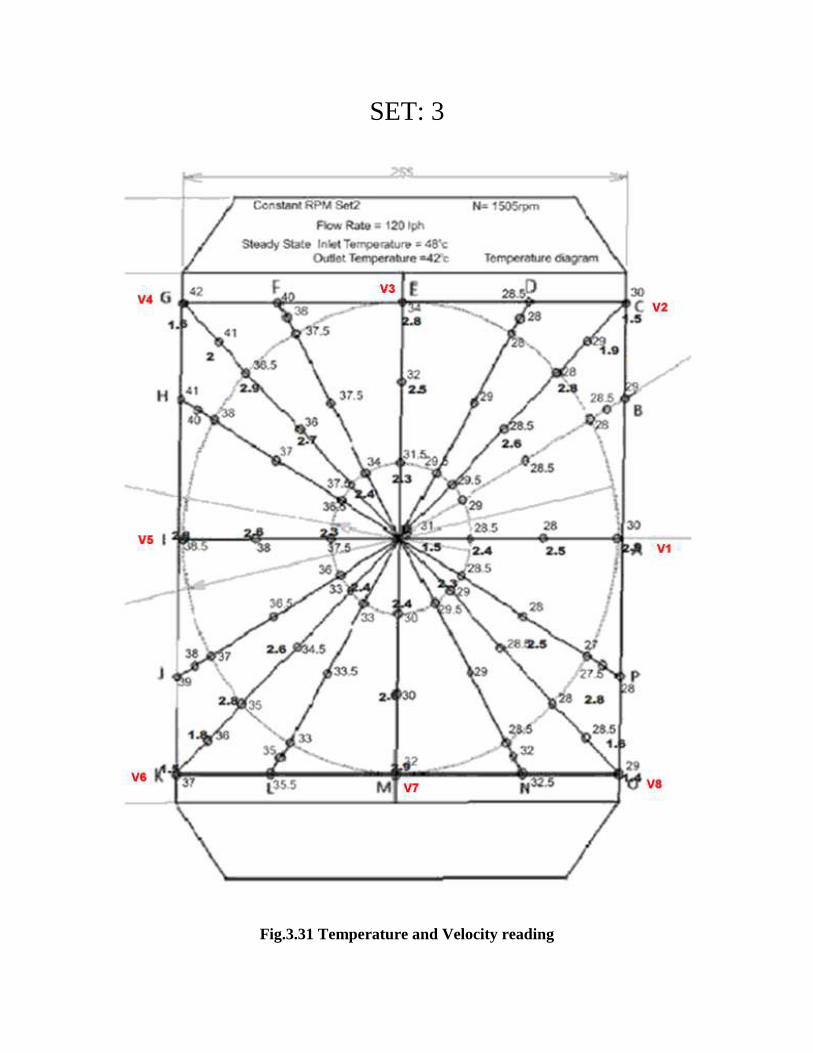
SET: 3
Fig.3.31 Temperature and Velocity reading
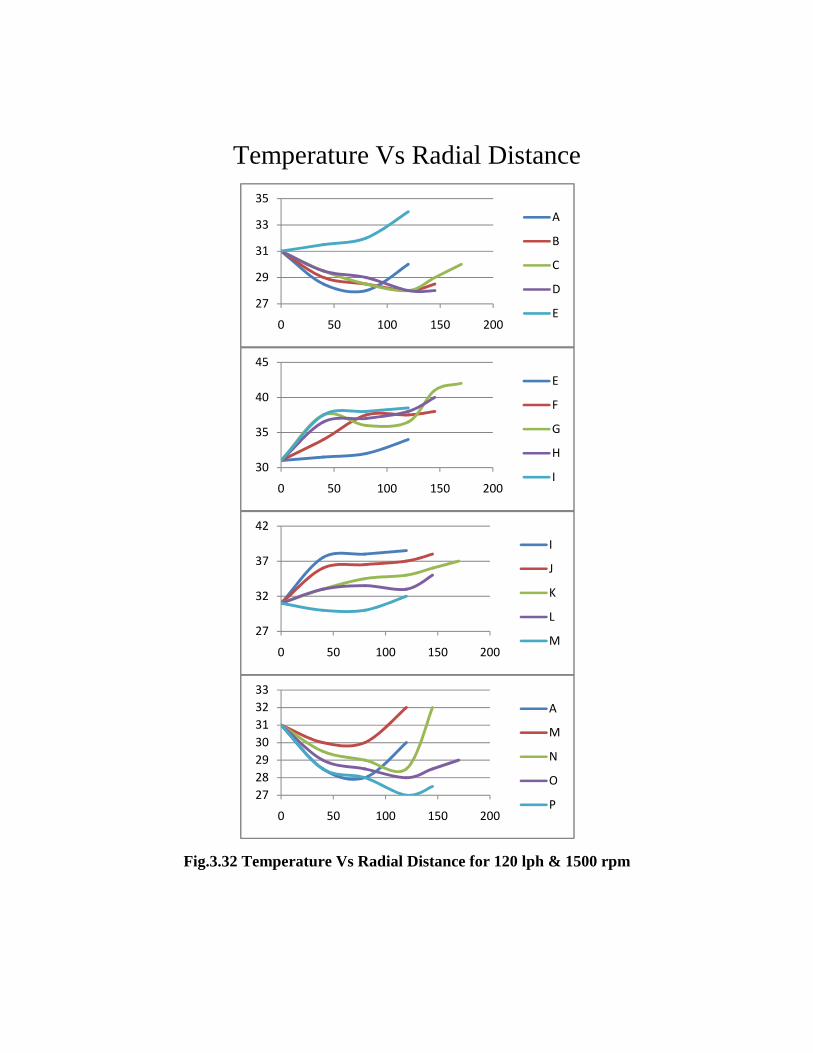
Temperature Vs Radial Distance
Fig.3.32 Temperature Vs Radial Distance for 120 lph & 1500 rpm
27
29
31
33
35
0 50 100 150 200
A
B
C
D
E
30
35
40
45
0 50 100 150 200
E
F
G
H
I
27
32
37
42
0 50 100 150 200
I
J
K
L
M
27
28
29
30
31
32
33
0 50 100 150 200
A
M
N
O
P
Velocity Vs Radial Distance
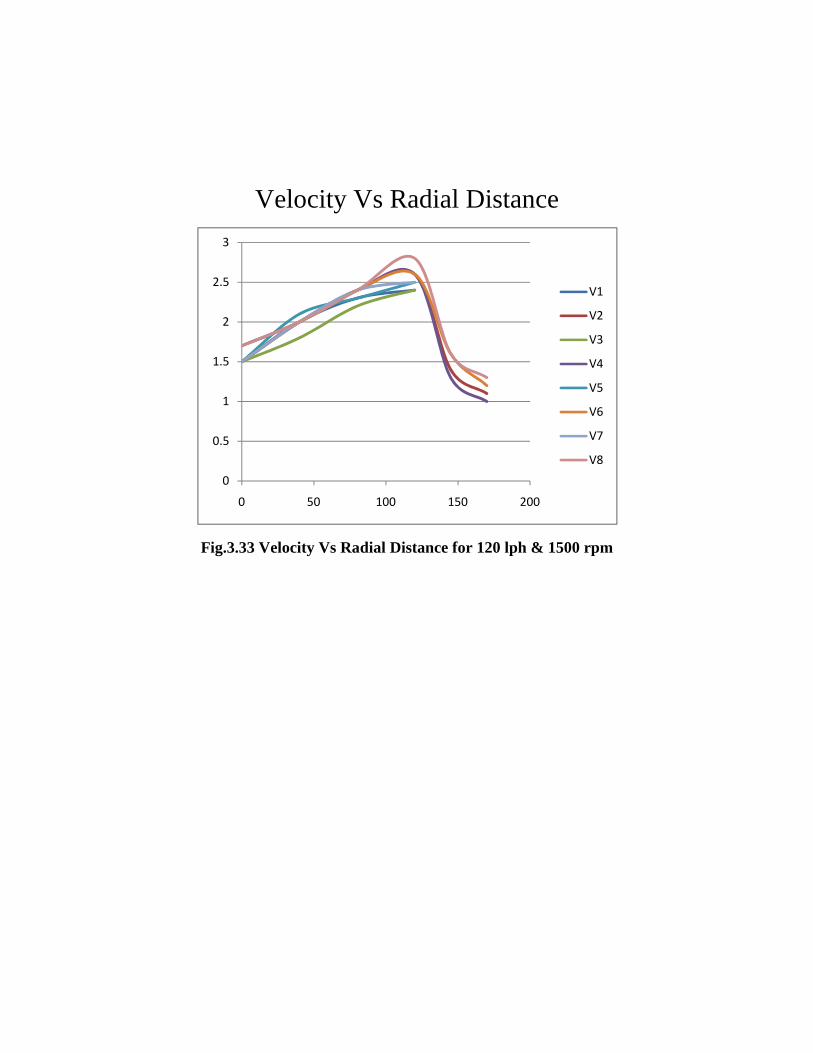
Fig.3.33 Velocity Vs Radial Distance for 120 lph & 1500 rpm
0
0.5
1
1.5
2
2.5
3
0 50 100 150 200
V1
V2
V3
V4
V5
V6
V7
V8
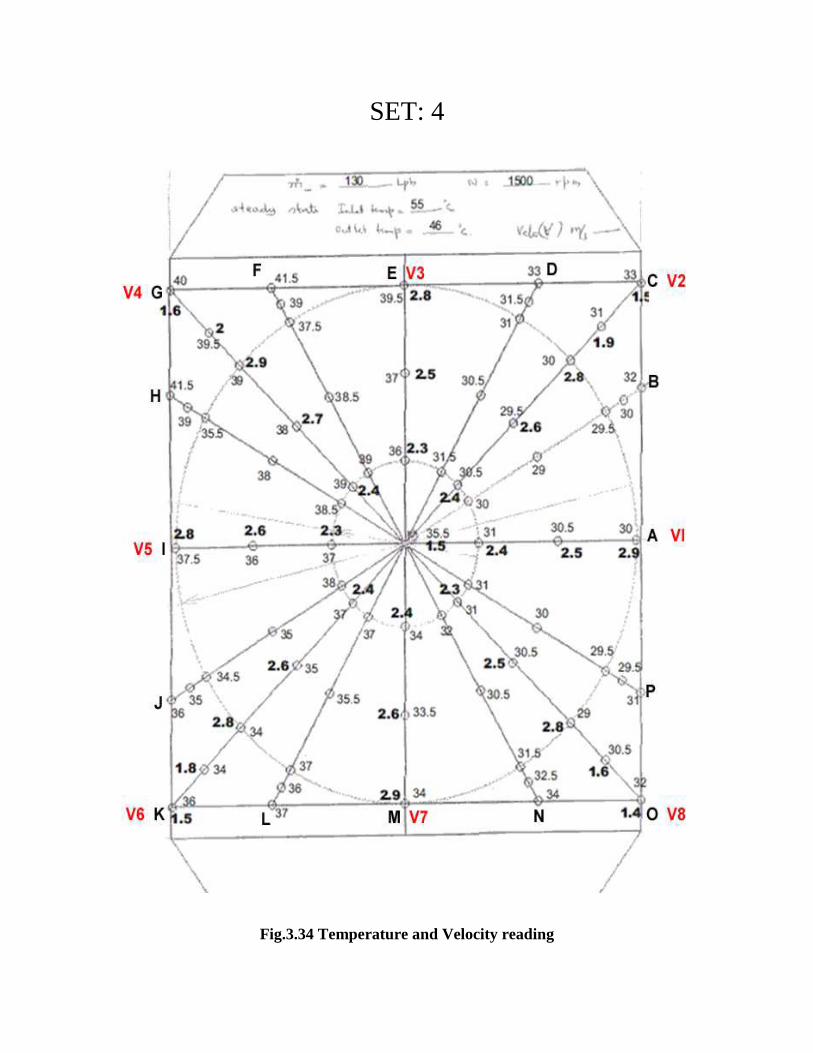
SET: 4
Fig.3.34 Temperature and Velocity reading
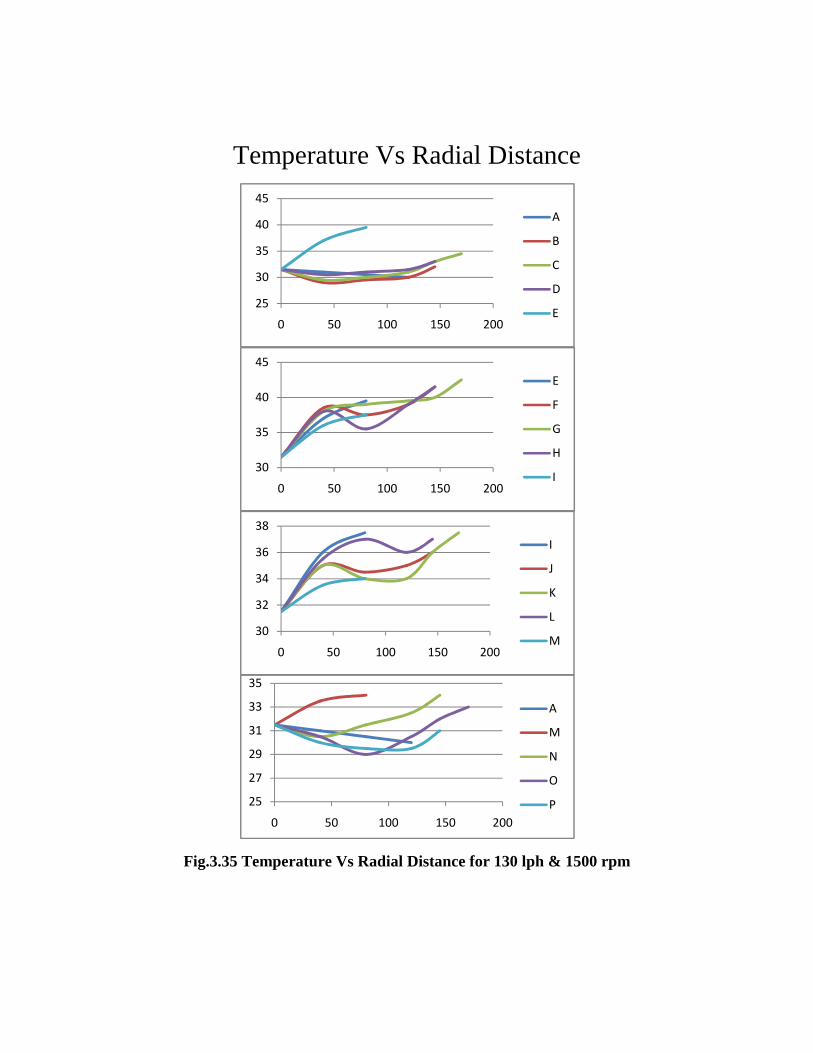
Temperature Vs Radial Distance
Fig.3.35 Temperature Vs Radial Distance for 130 lph & 1500 rpm
25
30
35
40
45
0 50 100 150 200
A
B
C
D
E
30
35
40
45
0 50 100 150 200
E
F
G
H
I
30
32
34
36
38
0 50 100 150 200
I
J
K
L
M
25
27
29
31
33
35
0 50 100 150 200
A
M
N
O
P
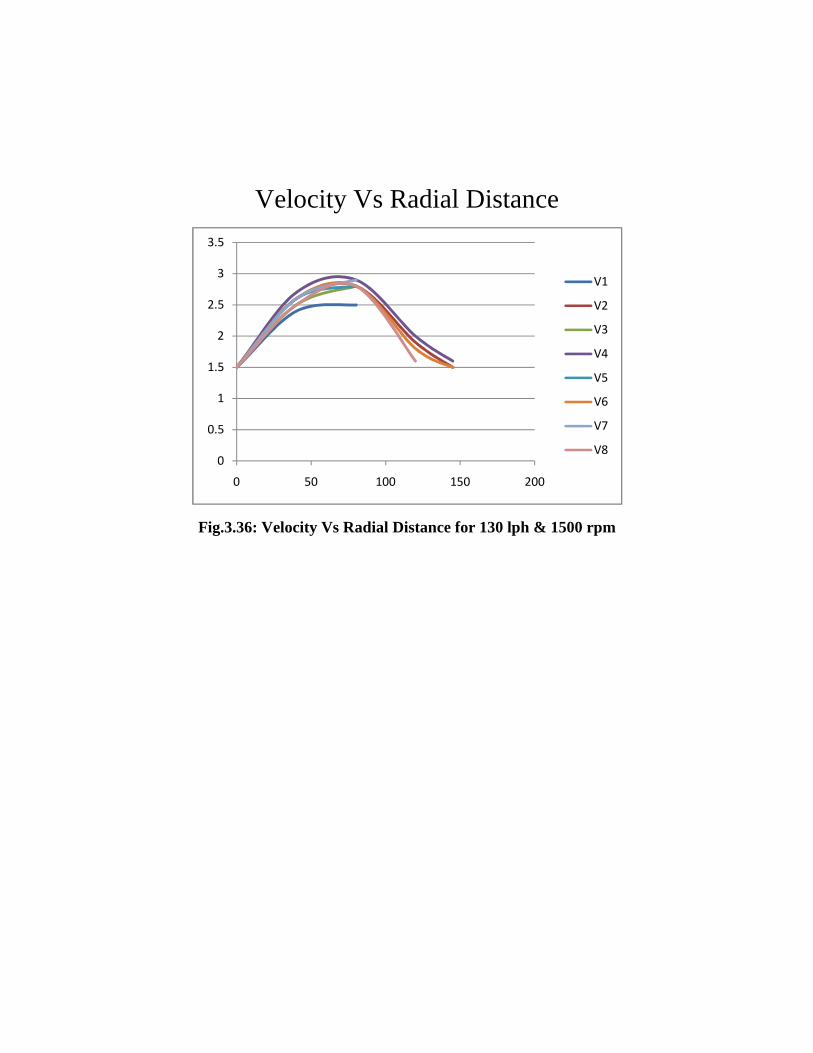
Velocity Vs Radial Distance
Fig.3.36: Velocity Vs Radial Distance for 130 lph & 1500 rpm
0
0.5
1
1.5
2
2.5
3
3.5
0 50 100 150 200
V1
V2
V3
V4
V5
V6
V7
V8
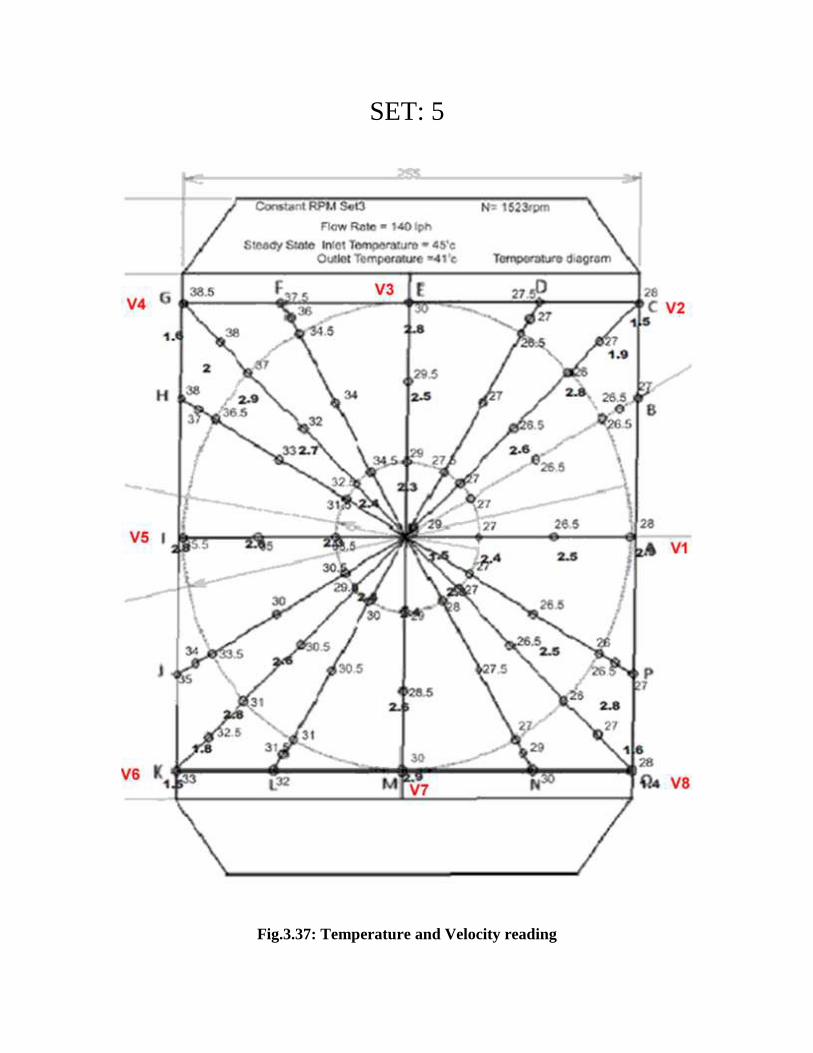
SET: 5
Fig.3.37: Temperature and Velocity reading
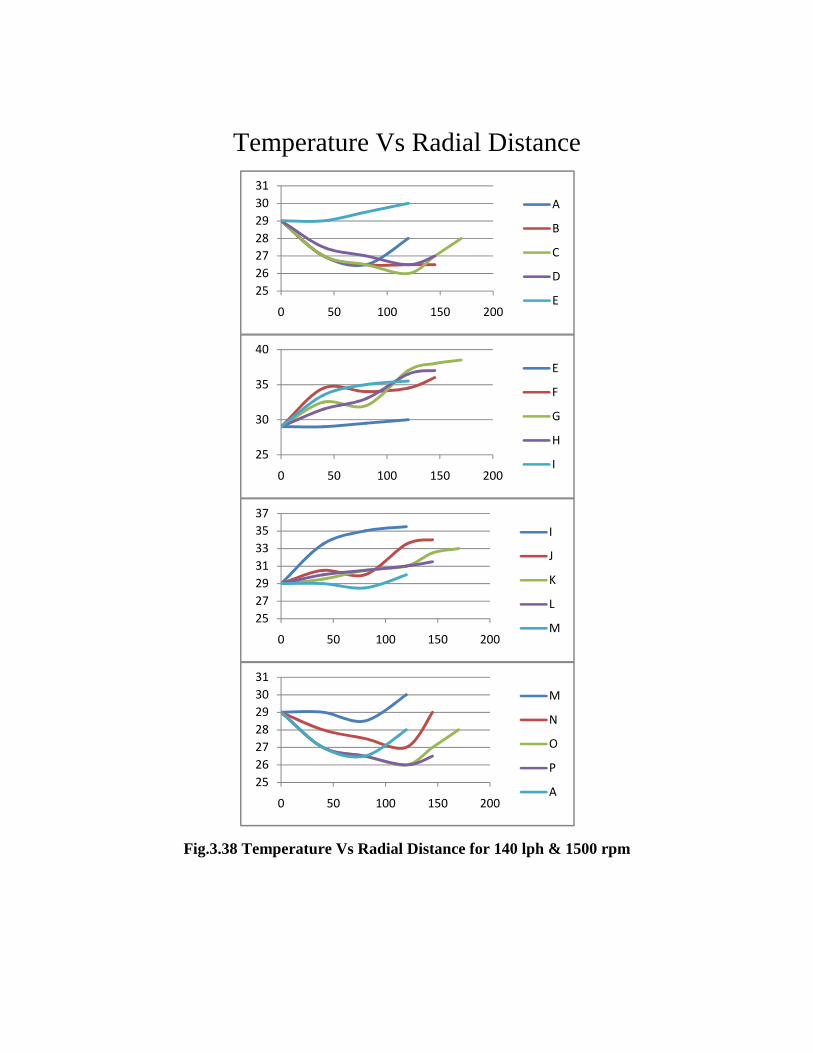
Temperature Vs Radial Distance
Fig.3.38 Temperature Vs Radial Distance for 140 lph & 1500 rpm
25
26
27
28
29
30
31
0 50 100 150 200
A
B
C
D
E
25
30
35
40
0 50 100 150 200
E
F
G
H
I
25
27
29
31
33
35
37
0 50 100 150 200
I
J
K
L
M
25
26
27
28
29
30
31
0 50 100 150 200
M
N
O
P
A
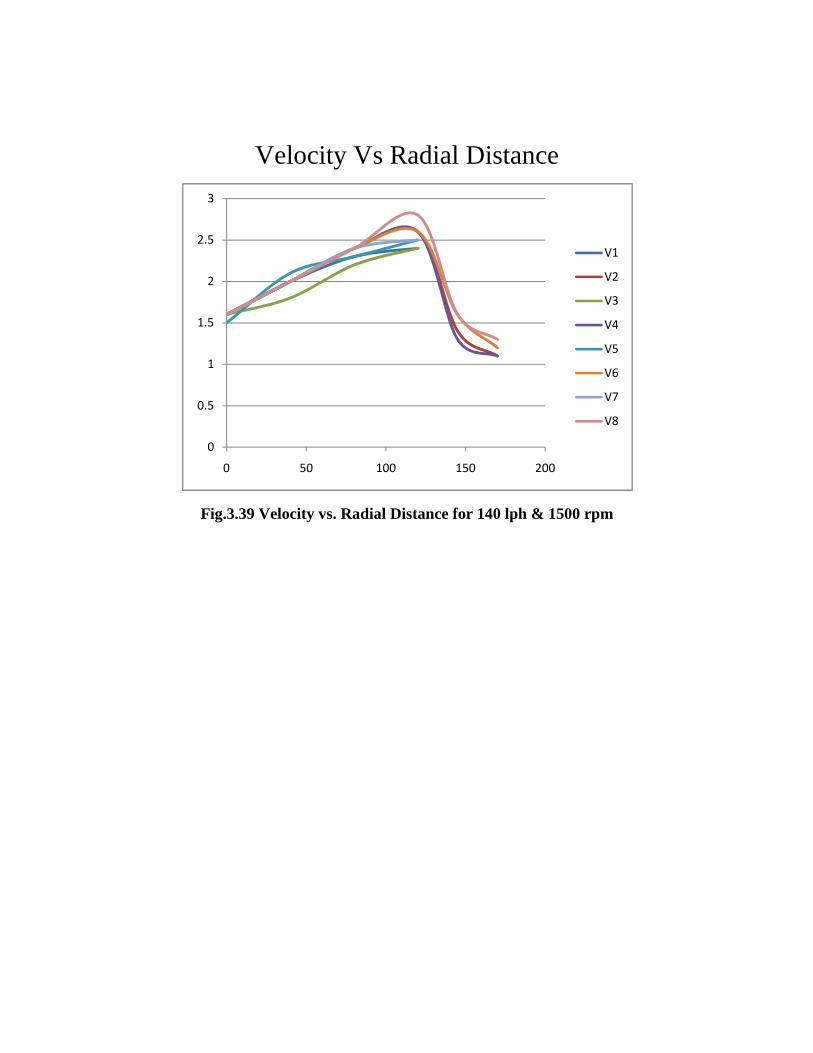
Velocity Vs Radial Distance
Fig.3.39 Velocity vs. Radial Distance for 140 lph & 1500 rpm
0
0.5
1
1.5
2
2.5
3
0 50 100 150 200
V1
V2
V3
V4
V5
V6
V7
V8
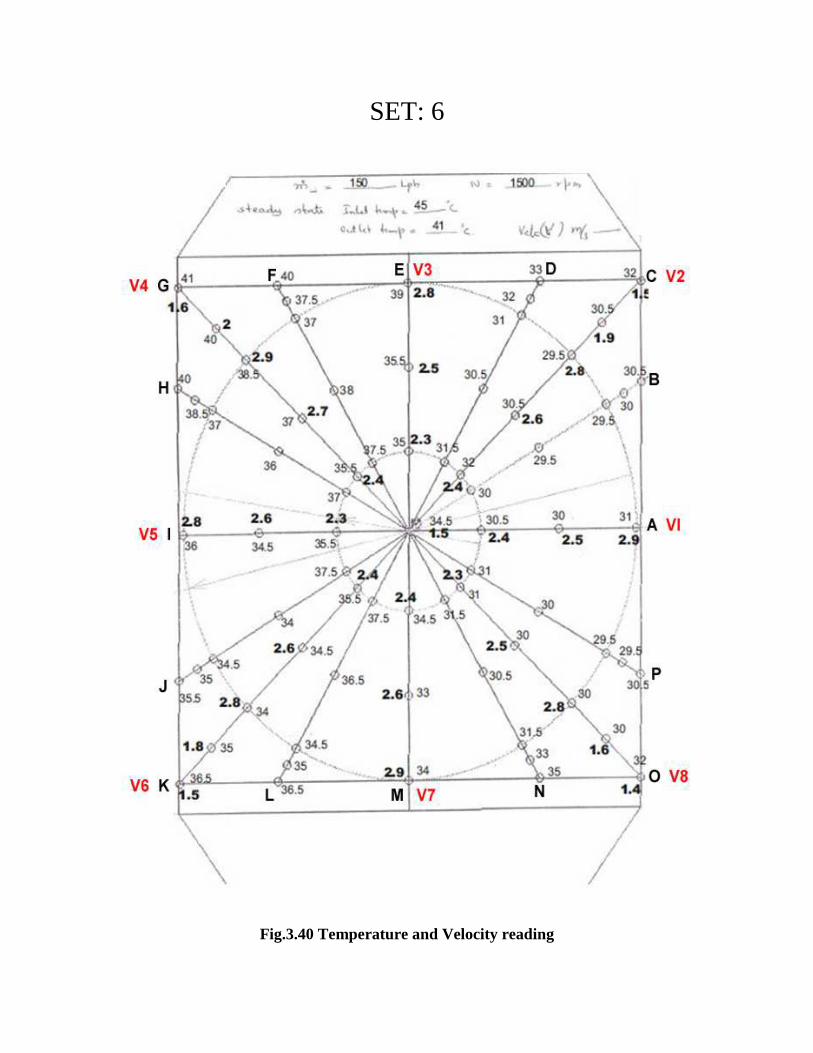
SET: 6
Fig.3.40 Temperature and Velocity reading
Temperature Vs Radial Distance
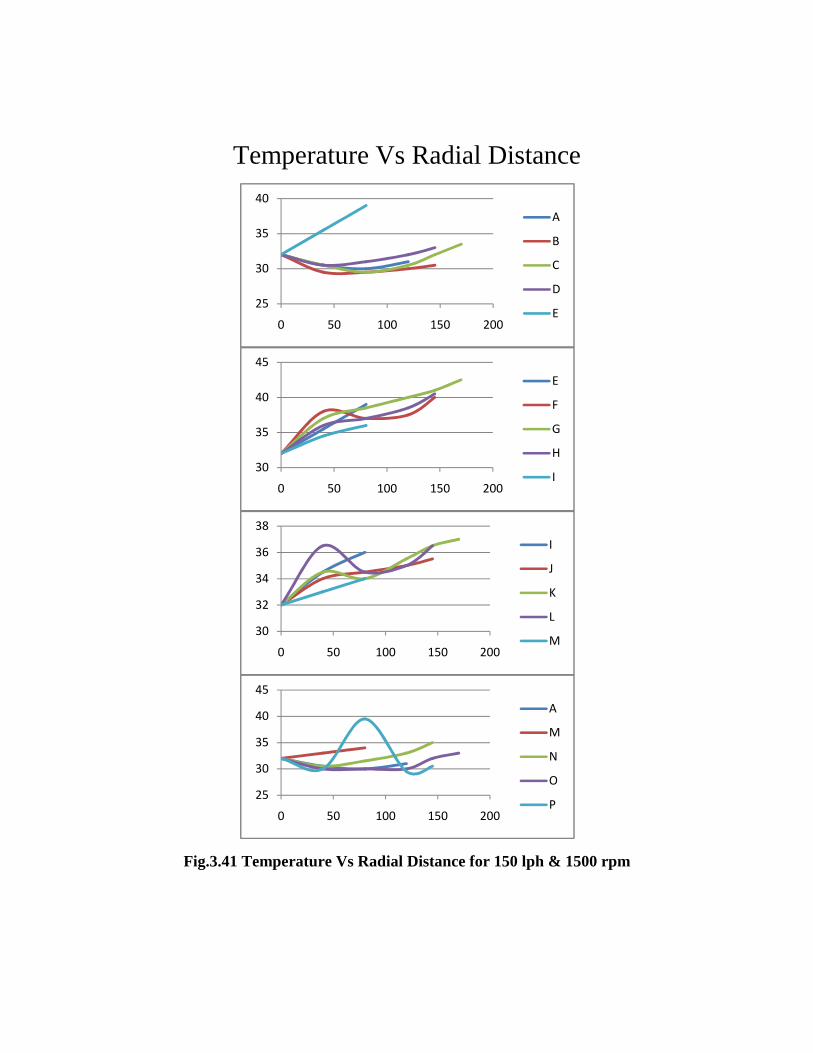
Fig.3.41 Temperature Vs Radial Distance for 150 lph & 1500 rpm
25
30
35
40
0 50 100 150 200
A
B
C
D
E
30
35
40
45
0 50 100 150 200
E
F
G
H
I
30
32
34
36
38
0 50 100 150 200
I
J
K
L
M
25
30
35
40
45
0 50 100 150 200
A
M
N
O
P
Velocity Vs Radial Distance
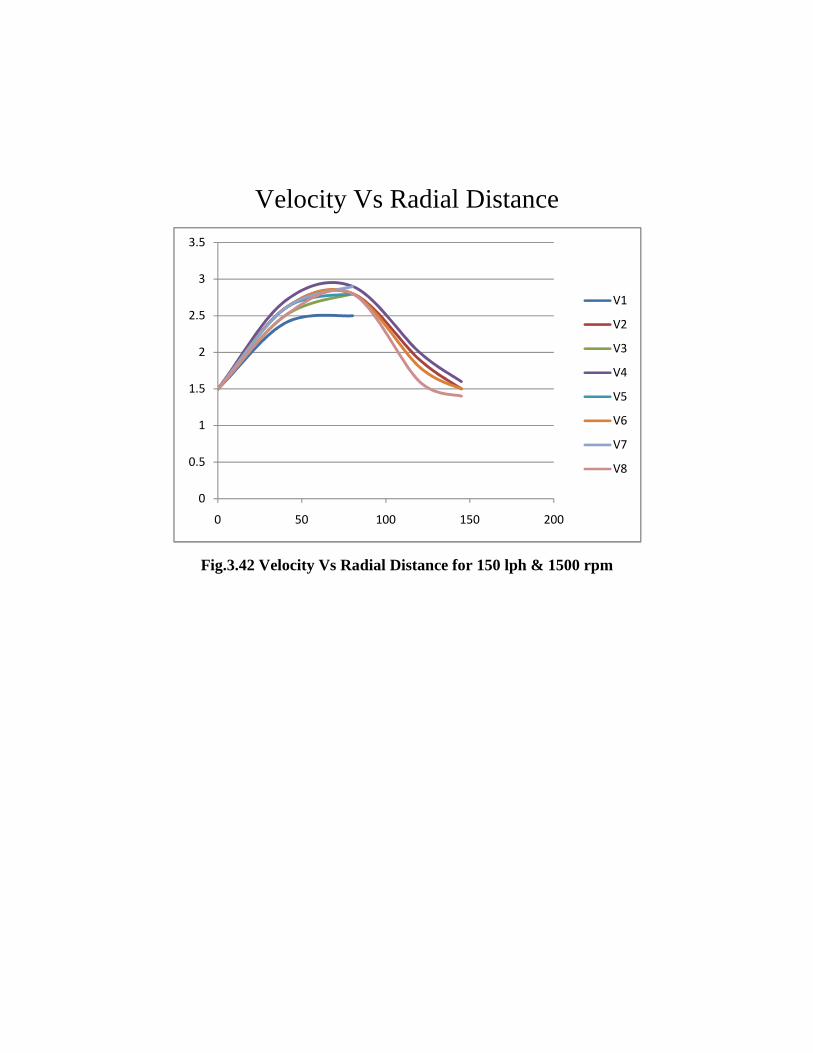
Fig.3.42 Velocity Vs Radial Distance for 150 lph & 1500 rpm
0
0.5
1
1.5
2
2.5
3
3.5
0 50 100 150 200
V1
V2
V3
V4
V5
V6
V7
V8
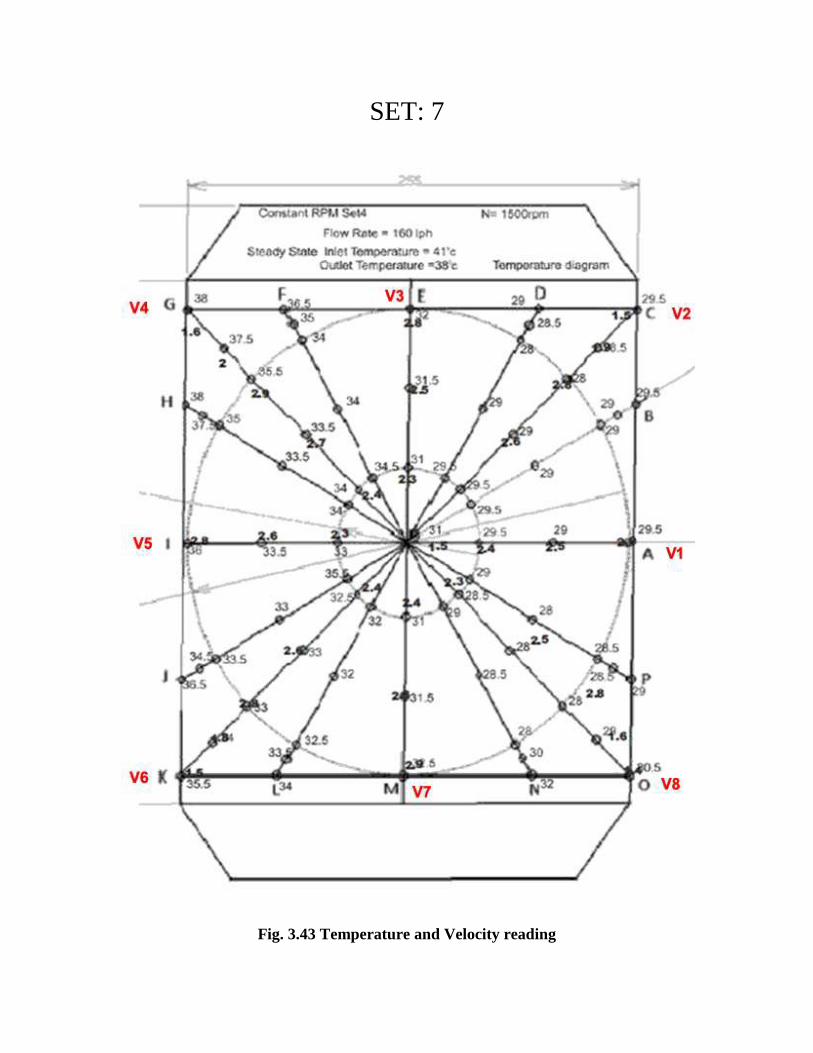
SET: 7
Fig. 3.43 Temperature and Velocity reading
Temperature Vs Radial Distance
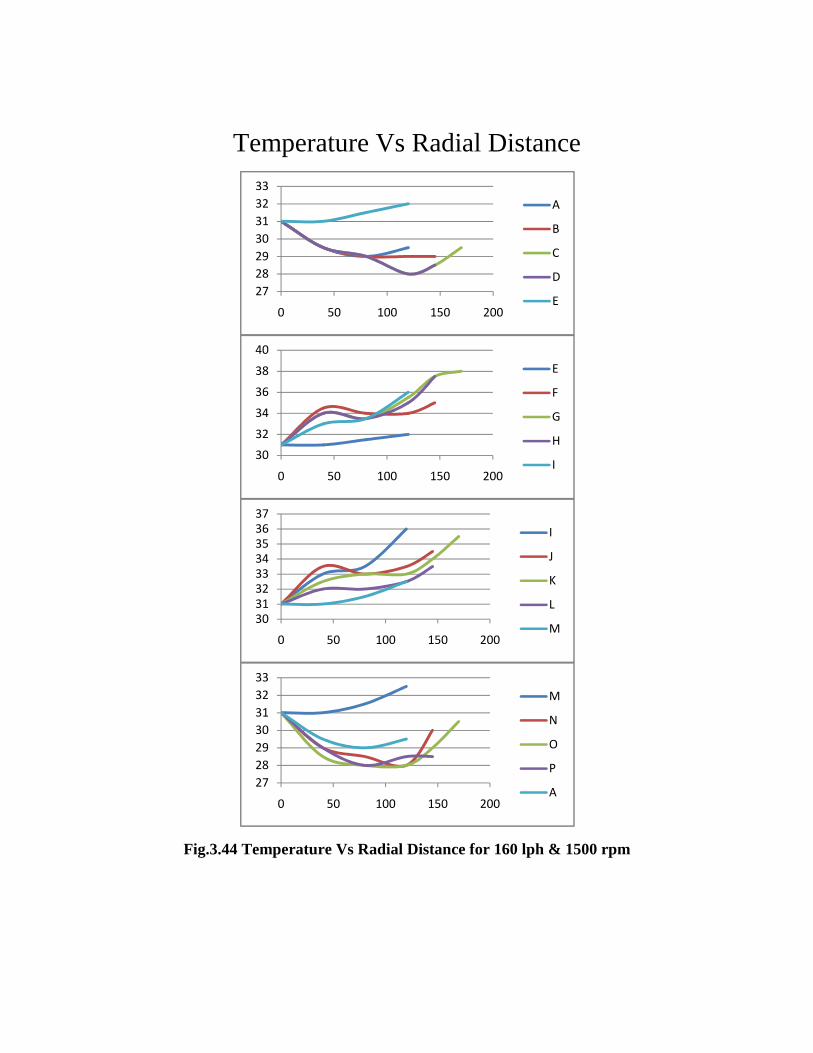
Fig.3.44 Temperature Vs Radial Distance for 160 lph & 1500 rpm
27
28
29
30
31
32
33
0 50 100 150 200
A
B
C
D
E
30
32
34
36
38
40
0 50 100 150 200
E
F
G
H
I
30
31
32
33
34
35
36
37
0 50 100 150 200
I
J
K
L
M
27
28
29
30
31
32
33
0 50 100 150 200
M
N
O
P
A
Velocity Vs Radial Distance
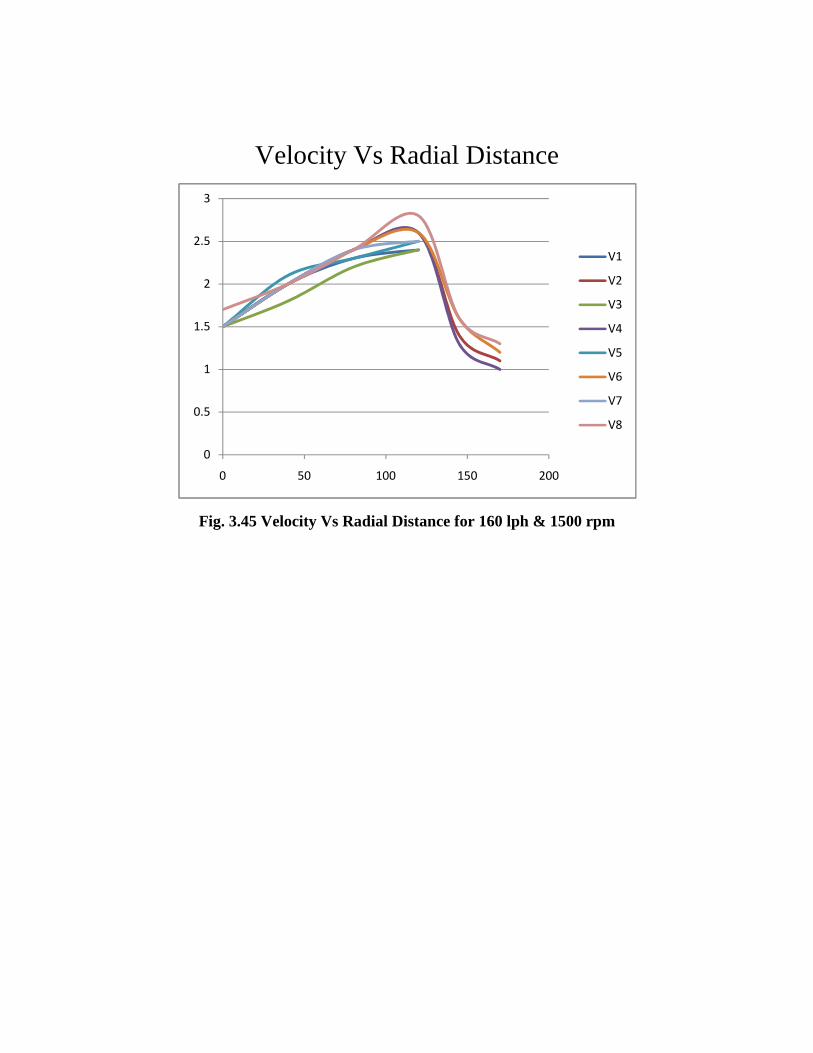
Fig. 3.45 Velocity Vs Radial Distance for 160 lph & 1500 rpm
0
0.5
1
1.5
2
2.5
3
0 50 100 150 200
V1
V2
V3
V4
V5
V6
V7
V8
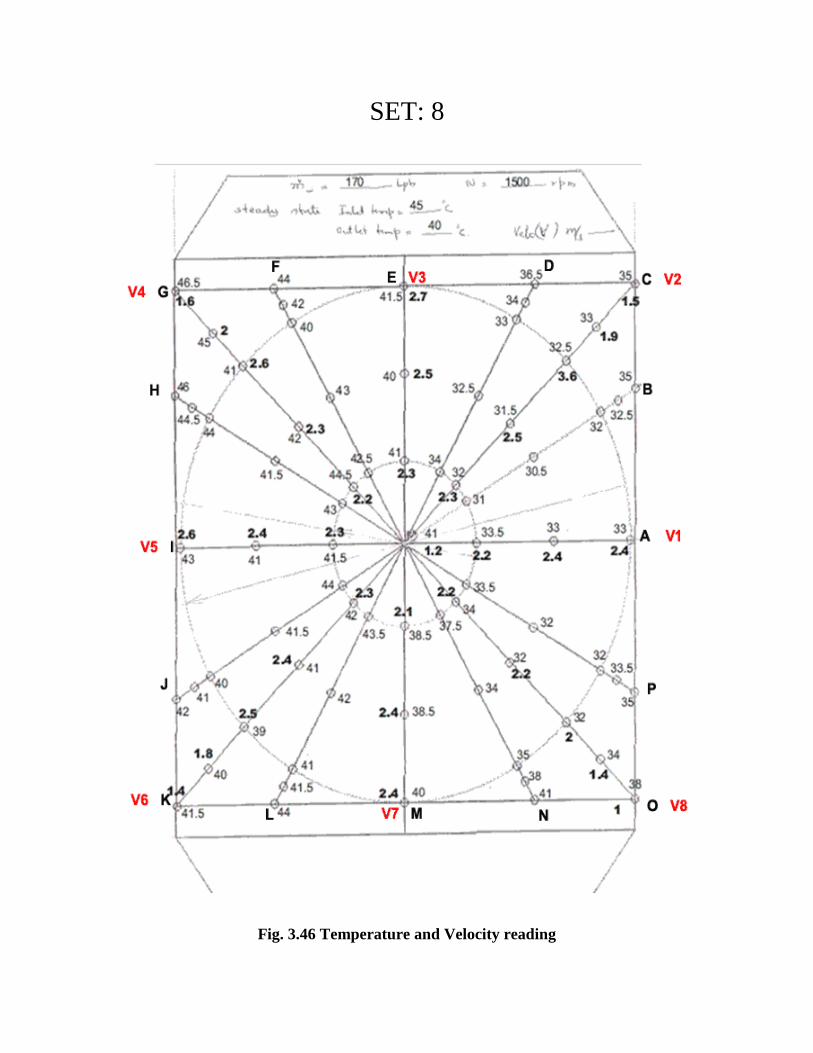
SET: 8
Fig. 3.46 Temperature and Velocity reading
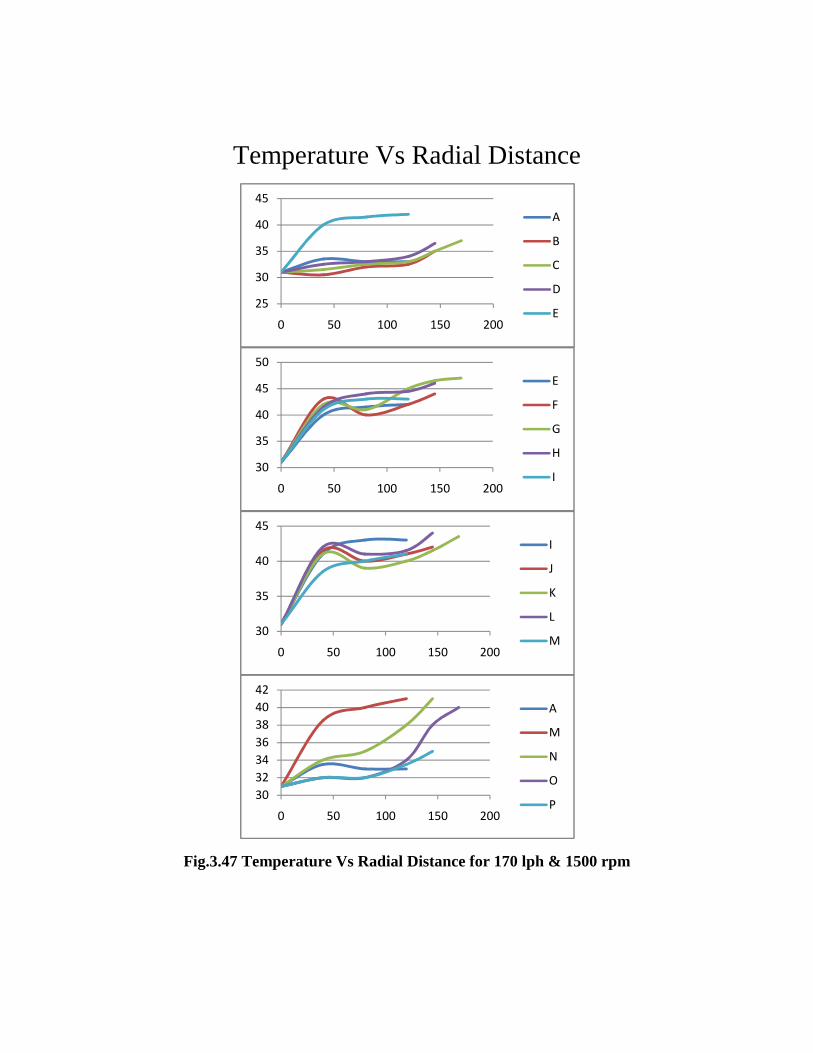
Temperature Vs Radial Distance
Fig.3.47 Temperature Vs Radial Distance for 170 lph & 1500 rpm
25
30
35
40
45
0 50 100 150 200
A
B
C
D
E
30
35
40
45
50
0 50 100 150 200
E
F
G
H
I
30
35
40
45
0 50 100 150 200
I
J
K
L
M
30
32
34
36
38
40
42
0 50 100 150 200
A
M
N
O
P
Velocity Vs Radial Distance
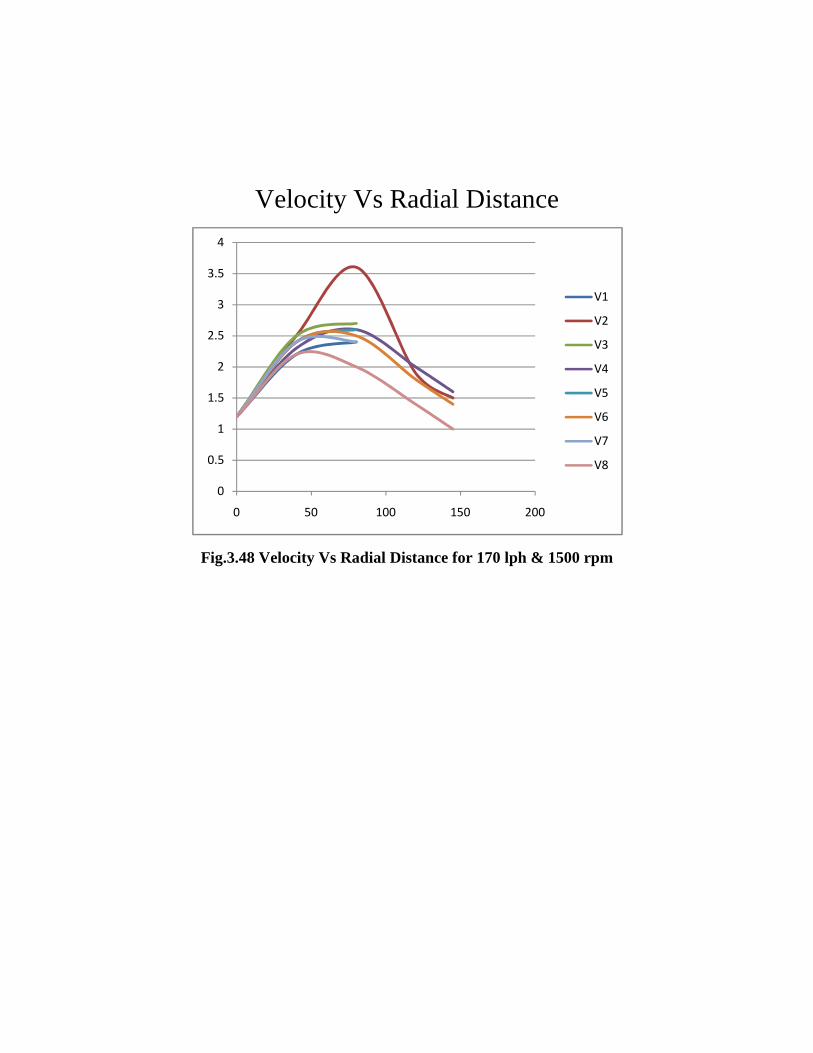
Fig.3.48 Velocity Vs Radial Distance for 170 lph & 1500 rpm
0
0.5
1
1.5
2
2.5
3
3.5
4
0 50 100 150 200
V1
V2
V3
V4
V5
V6
V7
V8
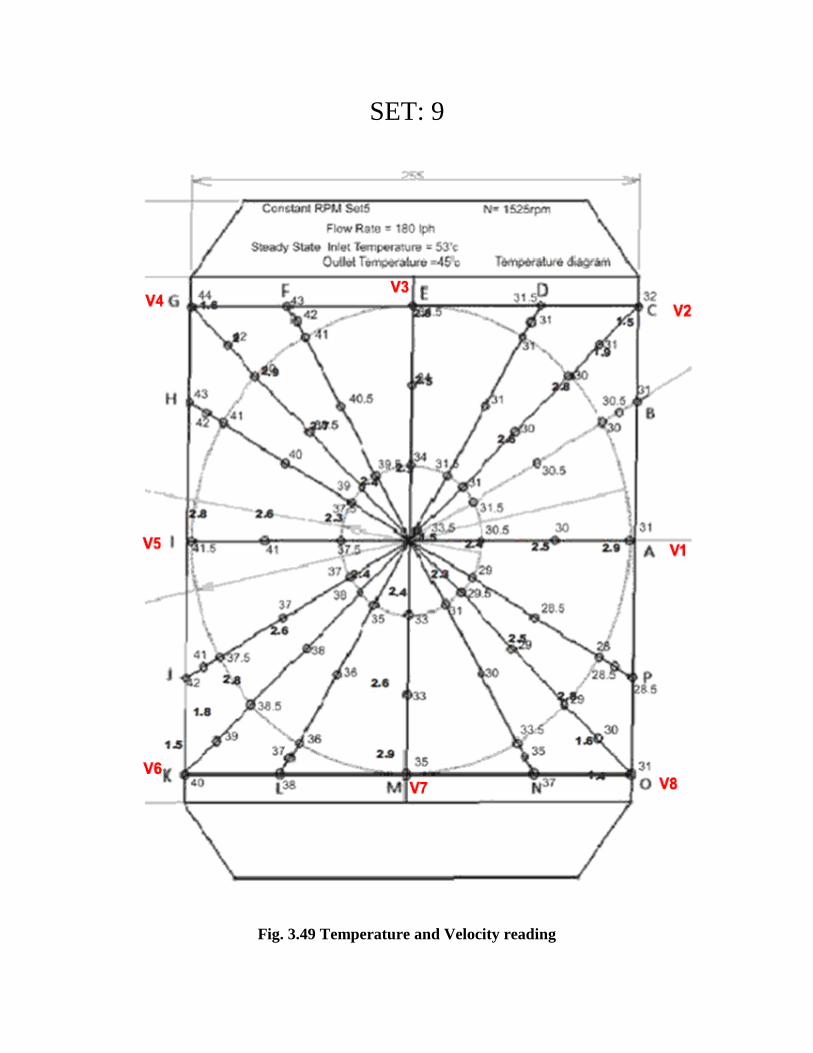
SET: 9
Fig. 3.49 Temperature and Velocity reading
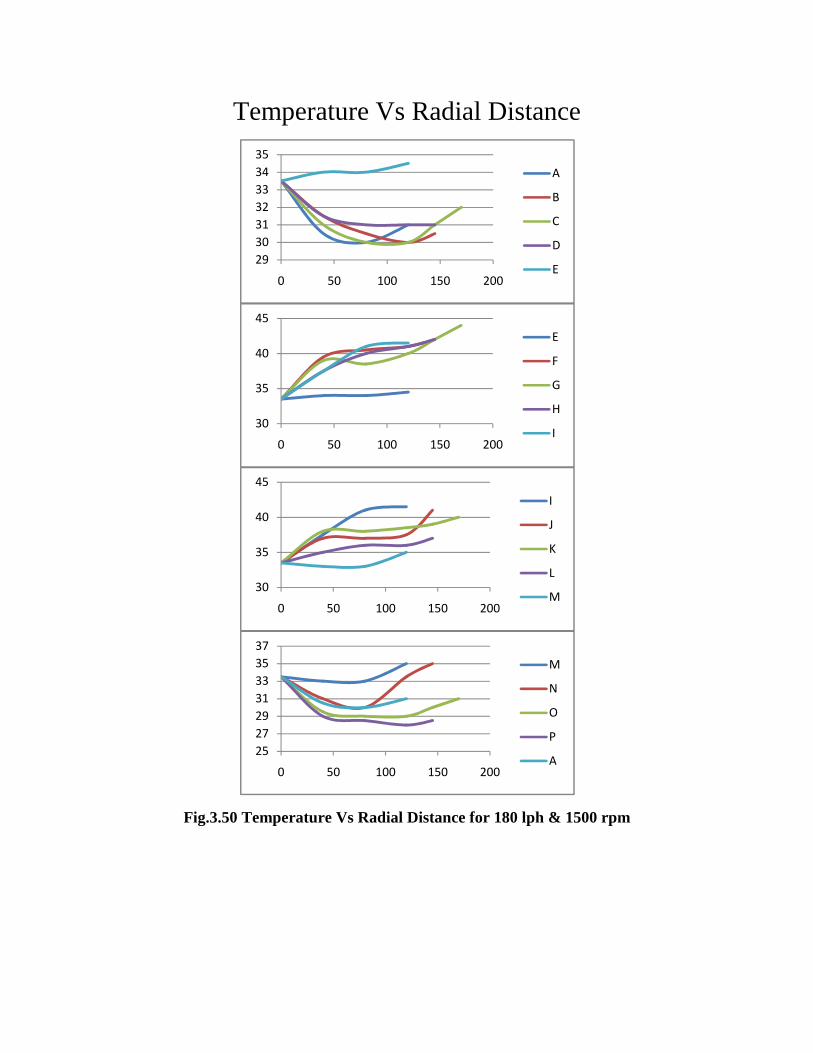
Temperature Vs Radial Distance
Fig.3.50 Temperature Vs Radial Distance for 180 lph & 1500 rpm
29
30
31
32
33
34
35
0 50 100 150 200
A
B
C
D
E
30
35
40
45
0 50 100 150 200
E
F
G
H
I
30
35
40
45
0 50 100 150 200
I
J
K
L
M
25
27
29
31
33
35
37
0 50 100 150 200
M
N
O
P
A
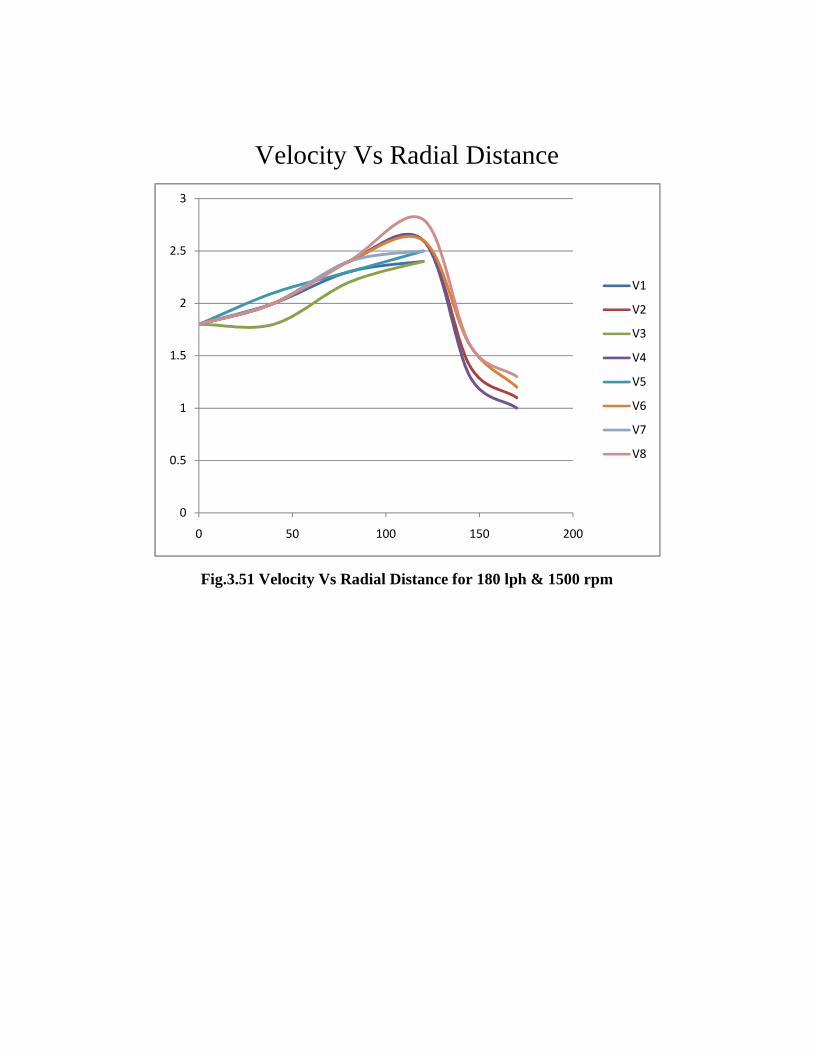
Velocity Vs Radial Distance
Fig.3.51 Velocity Vs Radial Distance for 180 lph & 1500 rpm
0
0.5
1
1.5
2
2.5
3
0 50 100 150 200
V1
V2
V3
V4
V5
V6
V7
V8

SET: 10
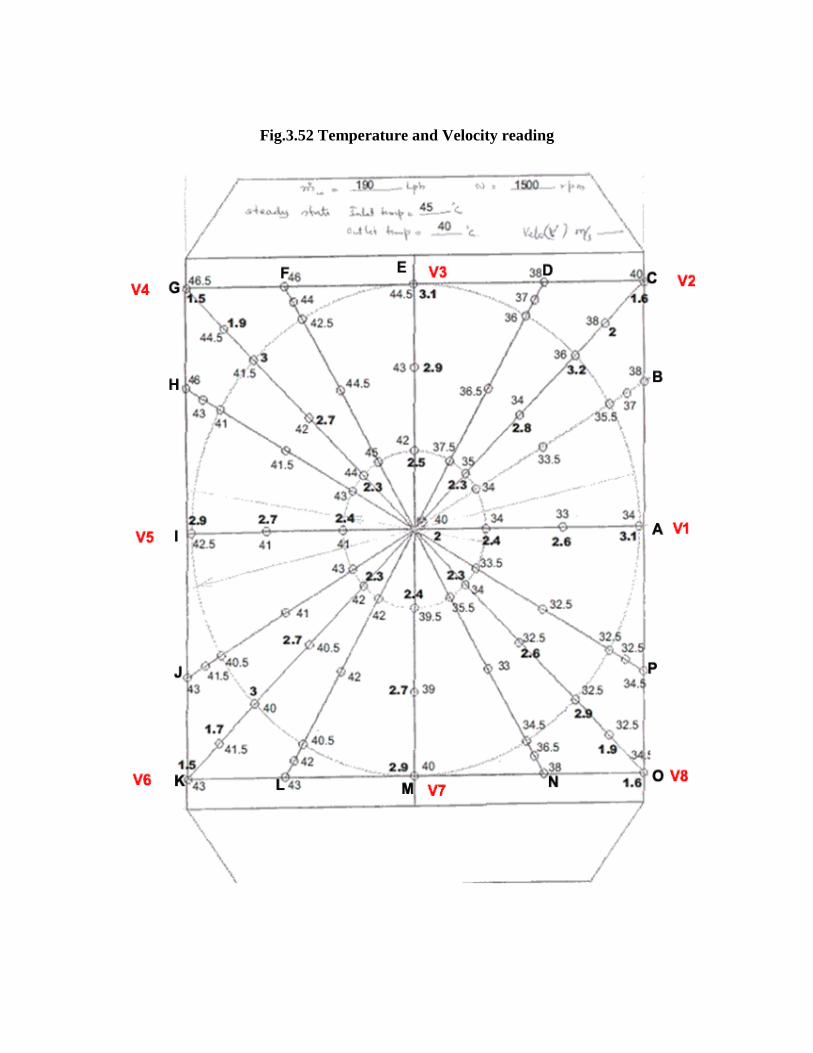
Fig.3.52 Temperature and Velocity reading
Temperature Vs Radial Distance
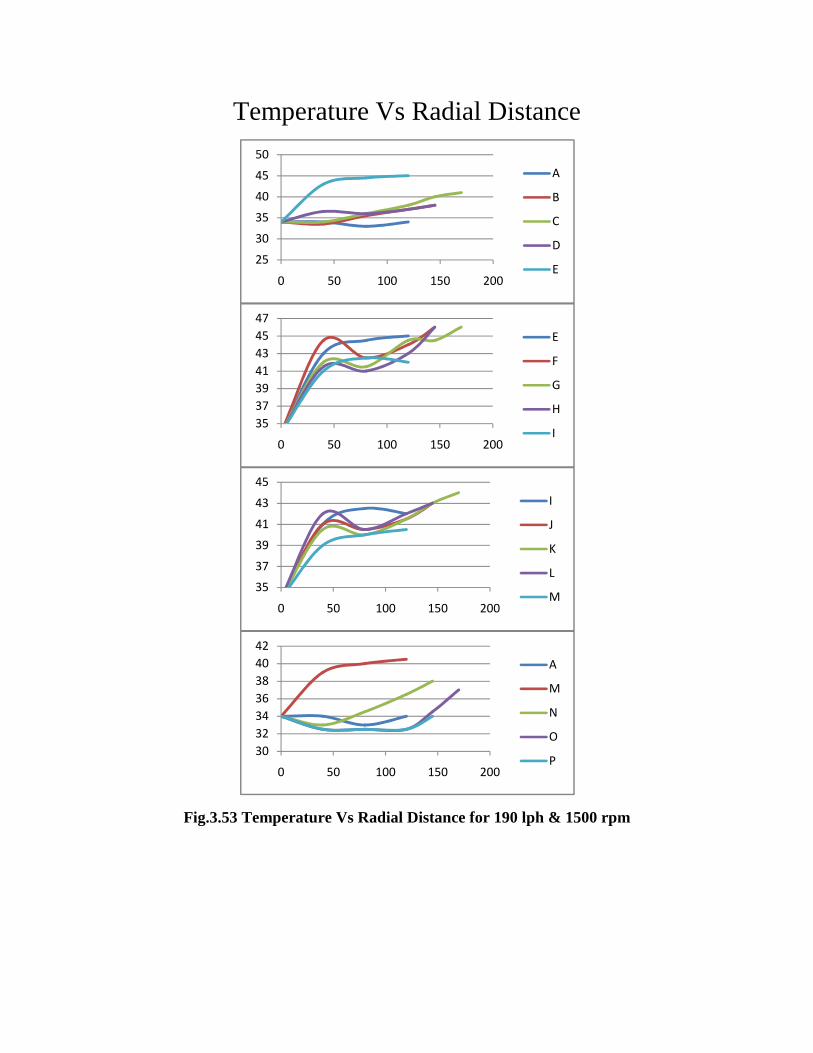
Fig.3.53 Temperature Vs Radial Distance for 190 lph & 1500 rpm
25
30
35
40
45
50
0 50 100 150 200
A
B
C
D
E
35
37
39
41
43
45
47
0 50 100 150 200
E
F
G
H
I
35
37
39
41
43
45
0 50 100 150 200
I
J
K
L
M
30
32
34
36
38
40
42
0 50 100 150 200
A
M
N
O
P
Velocity Vs Radial Distance
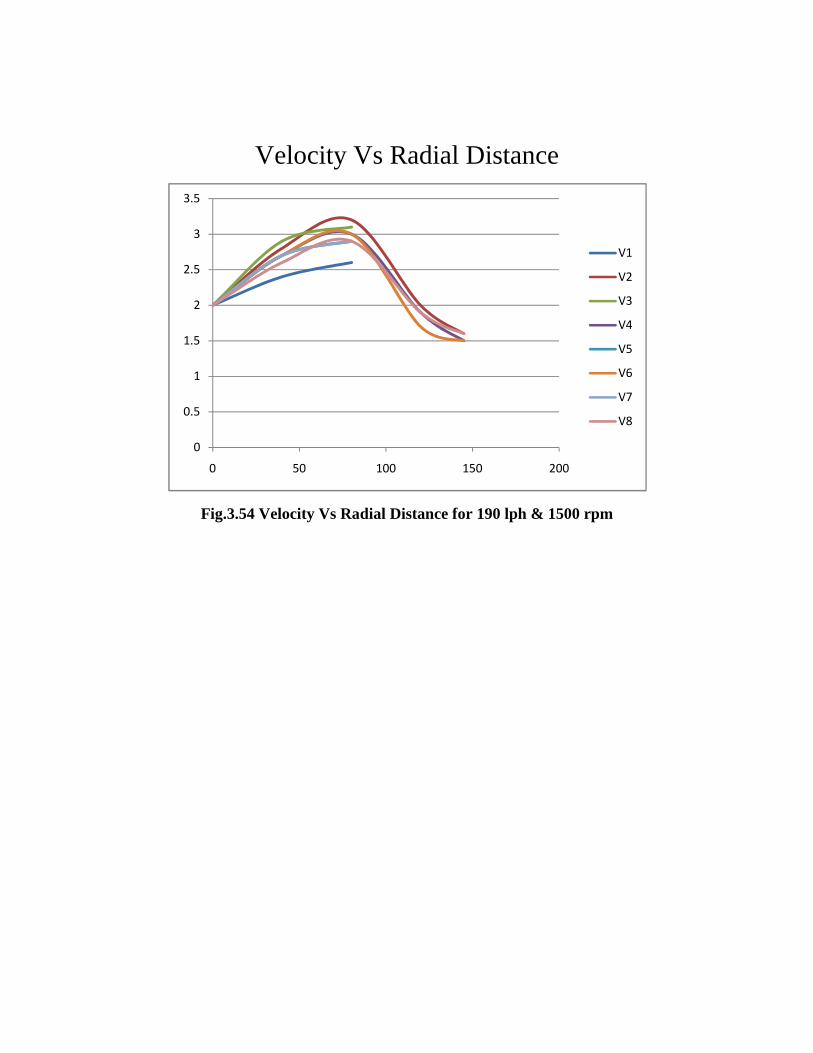
Fig.3.54 Velocity Vs Radial Distance for 190 lph & 1500 rpm
0
0.5
1
1.5
2
2.5
3
3.5
0 50 100 150 200
V1
V2
V3
V4
V5
V6
V7
V8
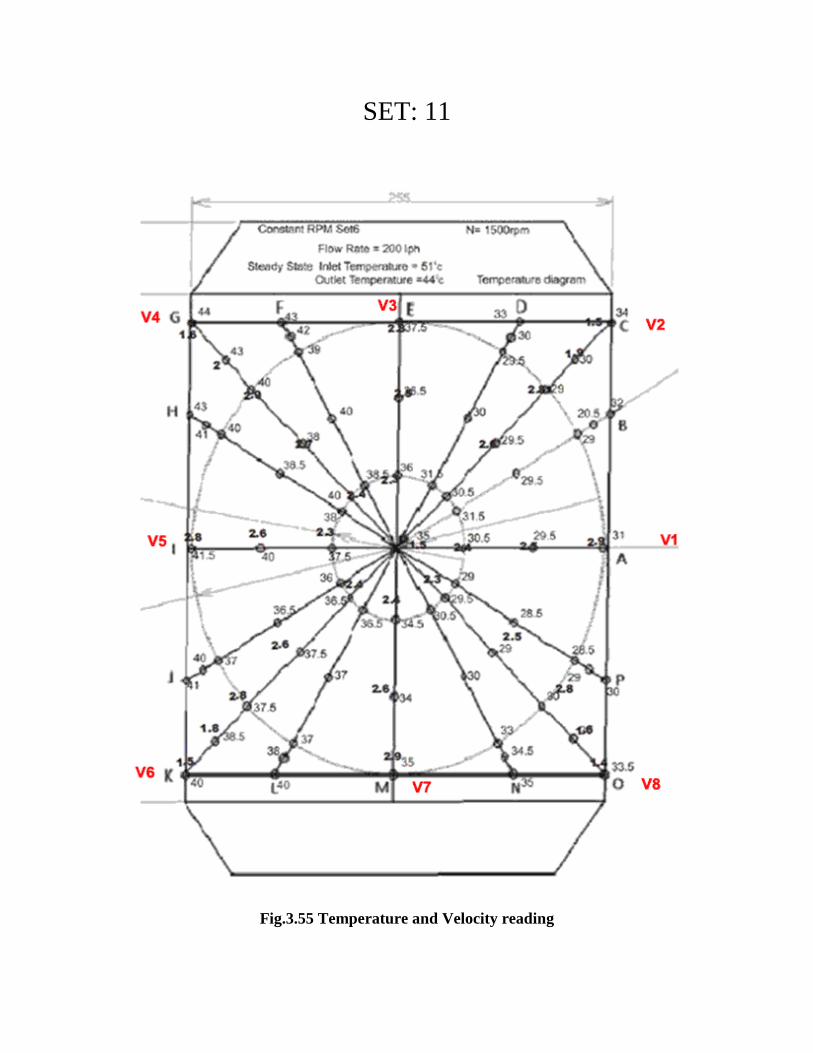
SET: 11
Fig.3.55 Temperature and Velocity reading
Temperature Vs Radial Distance
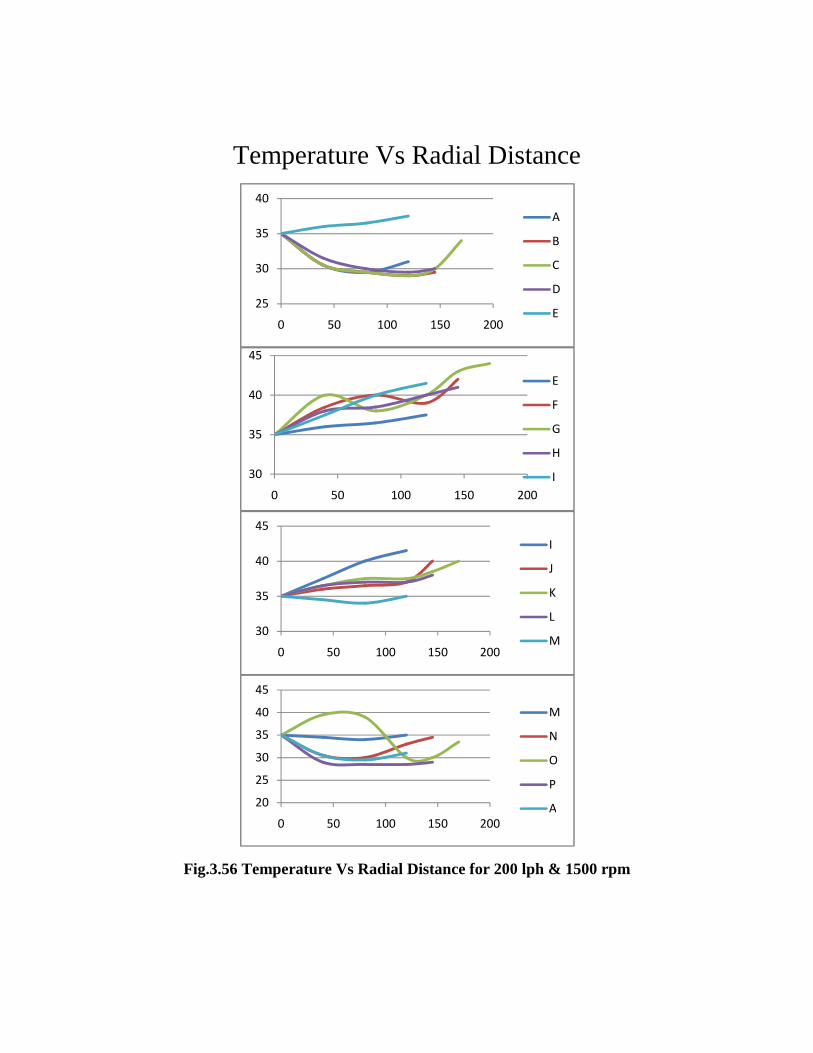
Fig.3.56 Temperature Vs Radial Distance for 200 lph & 1500 rpm
25
30
35
40
0 50 100 150 200
A
B
C
D
E
30
35
40
45
0 50 100 150 200
E
F
G
H
I
30
35
40
45
0 50 100 150 200
I
J
K
L
M
20
25
30
35
40
45
0 50 100 150 200
M
N
O
P
A
Velocity Vs Radial Distance
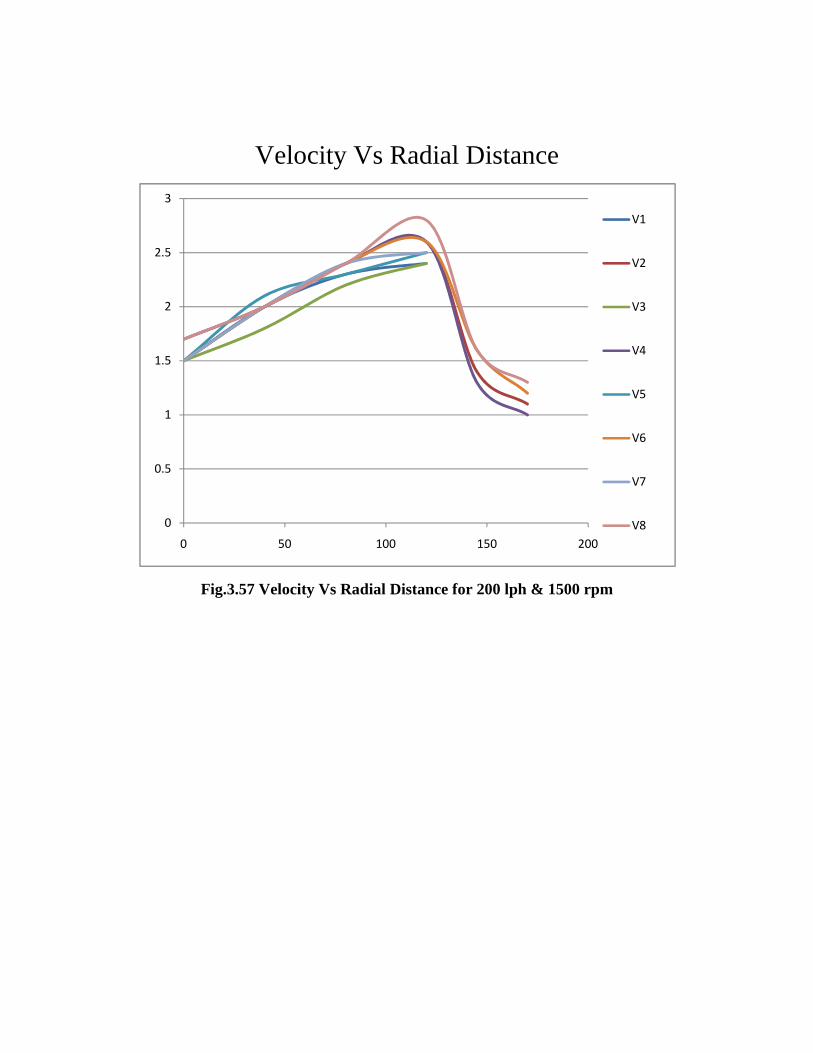
Fig.3.57 Velocity Vs Radial Distance for 200 lph & 1500 rpm
0
0.5
1
1.5
2
2.5
3
0 50 100 150 200
V1
V2
V3
V4
V5
V6
V7
V8
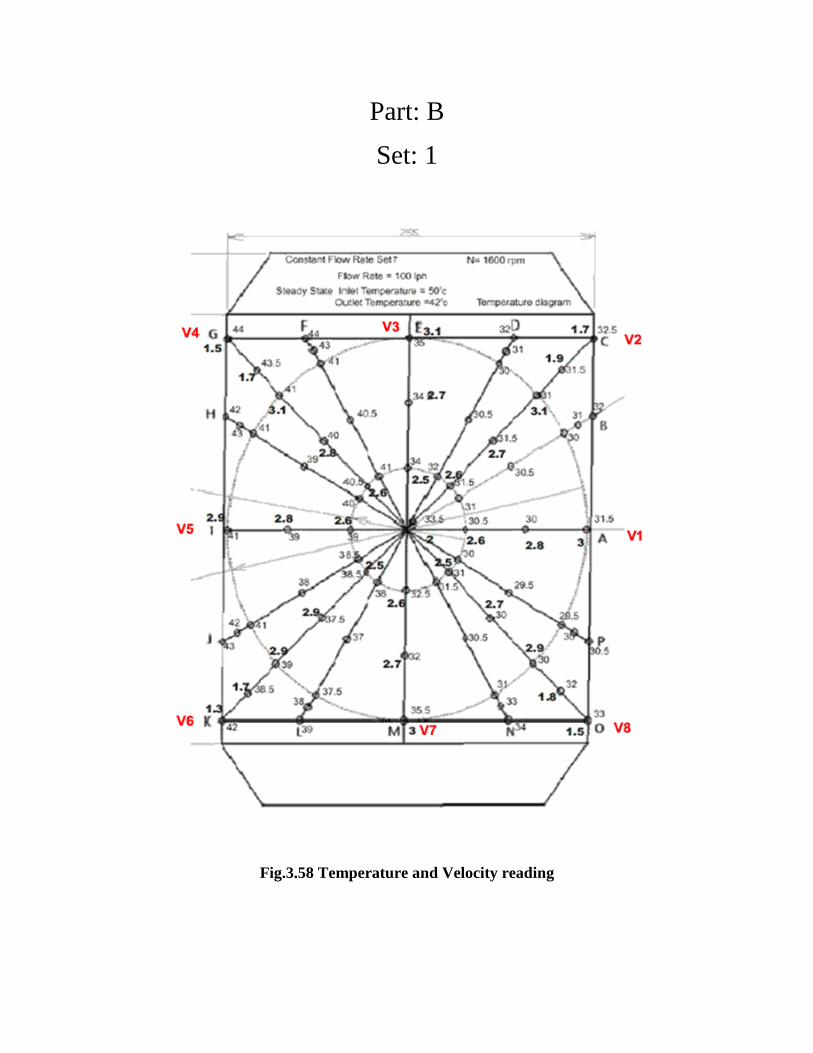
Part: B
Set: 1
Fig.3.58 Temperature and Velocity reading
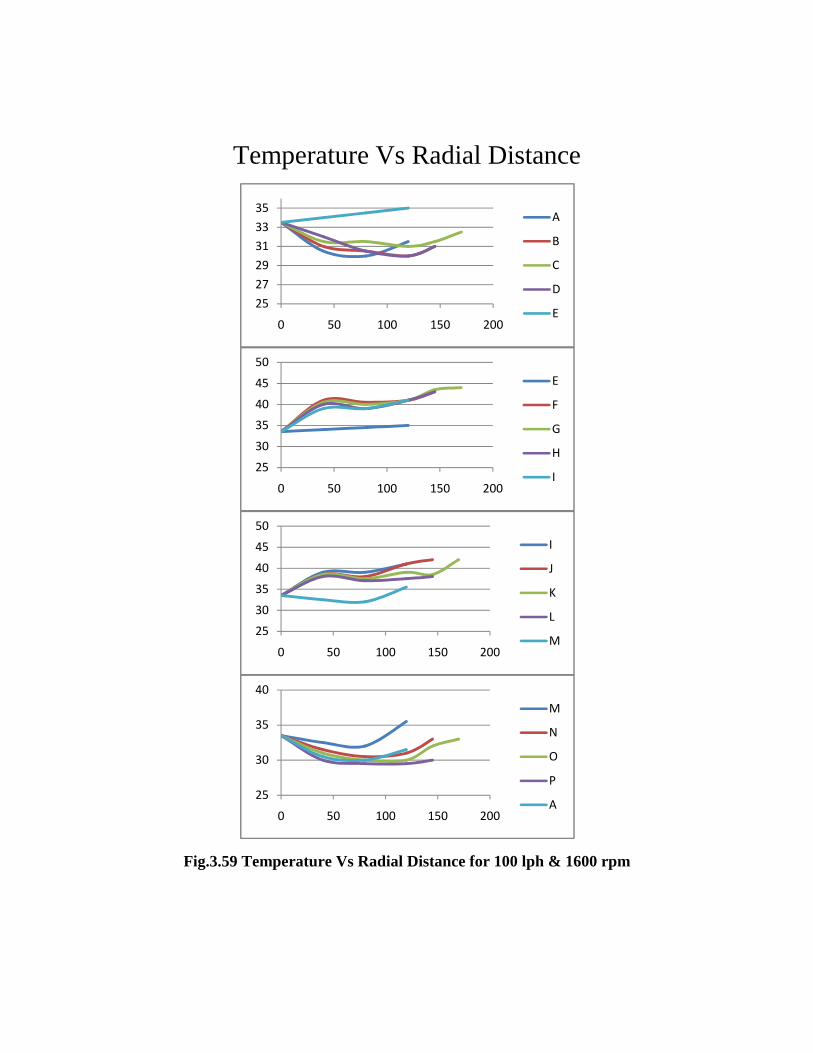
Temperature Vs Radial Distance
Fig.3.59 Temperature Vs Radial Distance for 100 lph & 1600 rpm
25
27
29
31
33
35
0 50 100 150 200
A
B
C
D
E
25
30
35
40
45
50
0 50 100 150 200
E
F
G
H
I
25
30
35
40
45
50
0 50 100 150 200
I
J
K
L
M
25
30
35
40
0 50 100 150 200
M
N
O
P
A
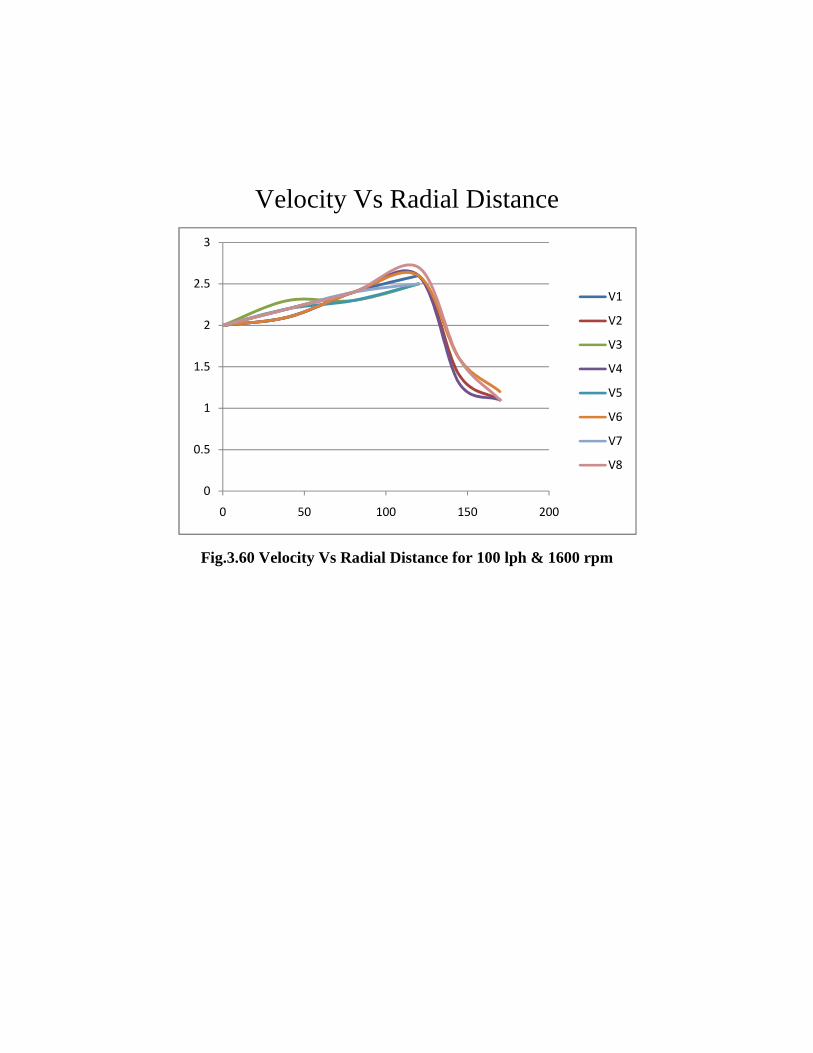
Velocity Vs Radial Distance
Fig.3.60 Velocity Vs Radial Distance for 100 lph & 1600 rpm
0
0.5
1
1.5
2
2.5
3
0 50 100 150 200
V1
V2
V3
V4
V5
V6
V7
V8
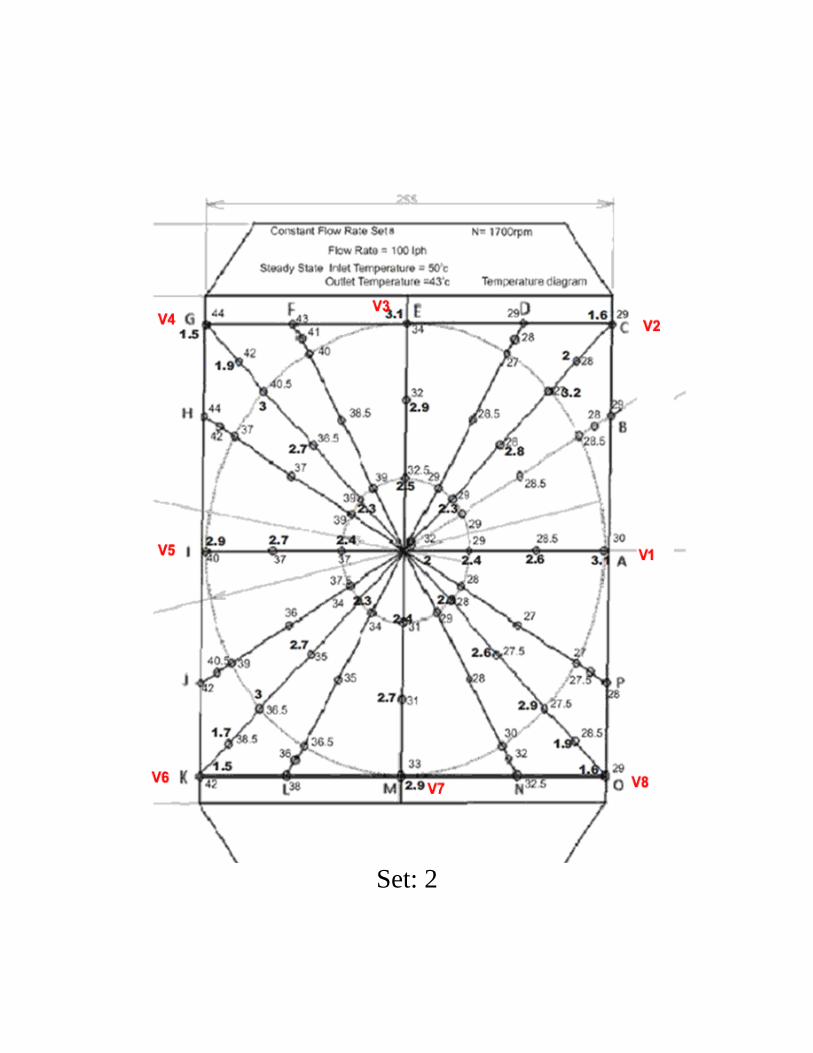
Set: 2
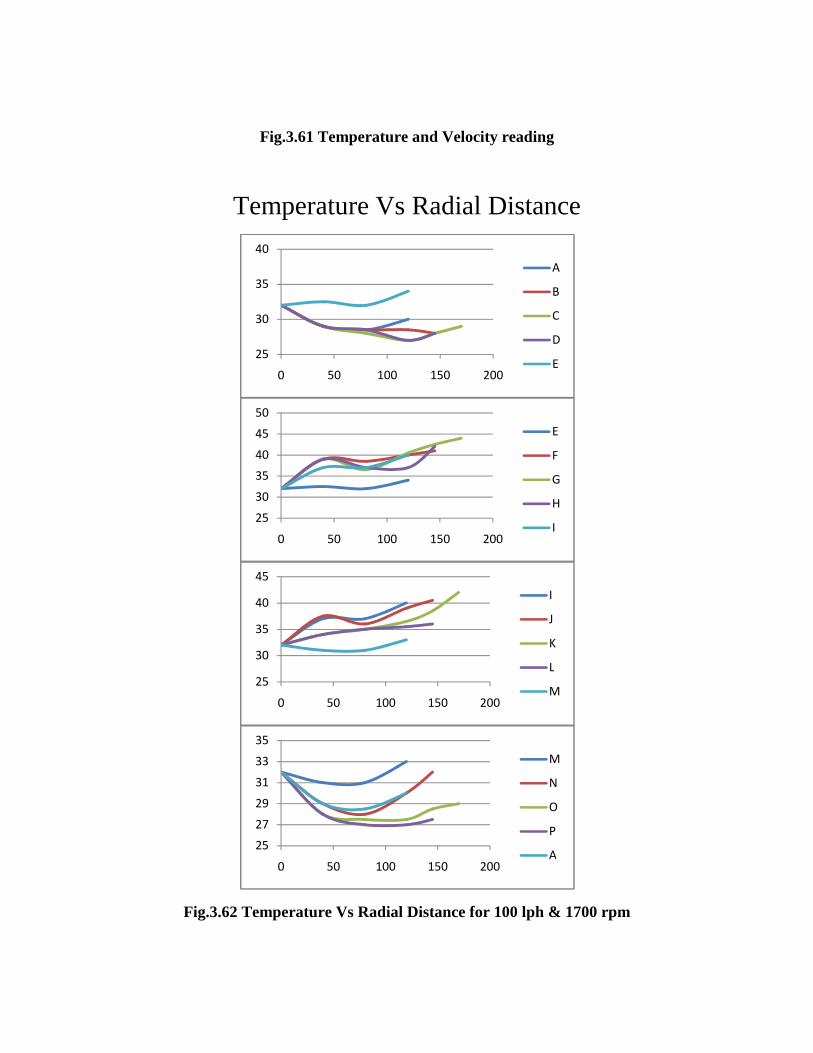
Fig.3.61 Temperature and Velocity reading
Temperature Vs Radial Distance
Fig.3.62 Temperature Vs Radial Distance for 100 lph & 1700 rpm
25
30
35
40
0 50 100 150 200
A
B
C
D
E
25
30
35
40
45
50
0 50 100 150 200
E
F
G
H
I
25
30
35
40
45
0 50 100 150 200
I
J
K
L
M
25
27
29
31
33
35
0 50 100 150 200
M
N
O
P
A
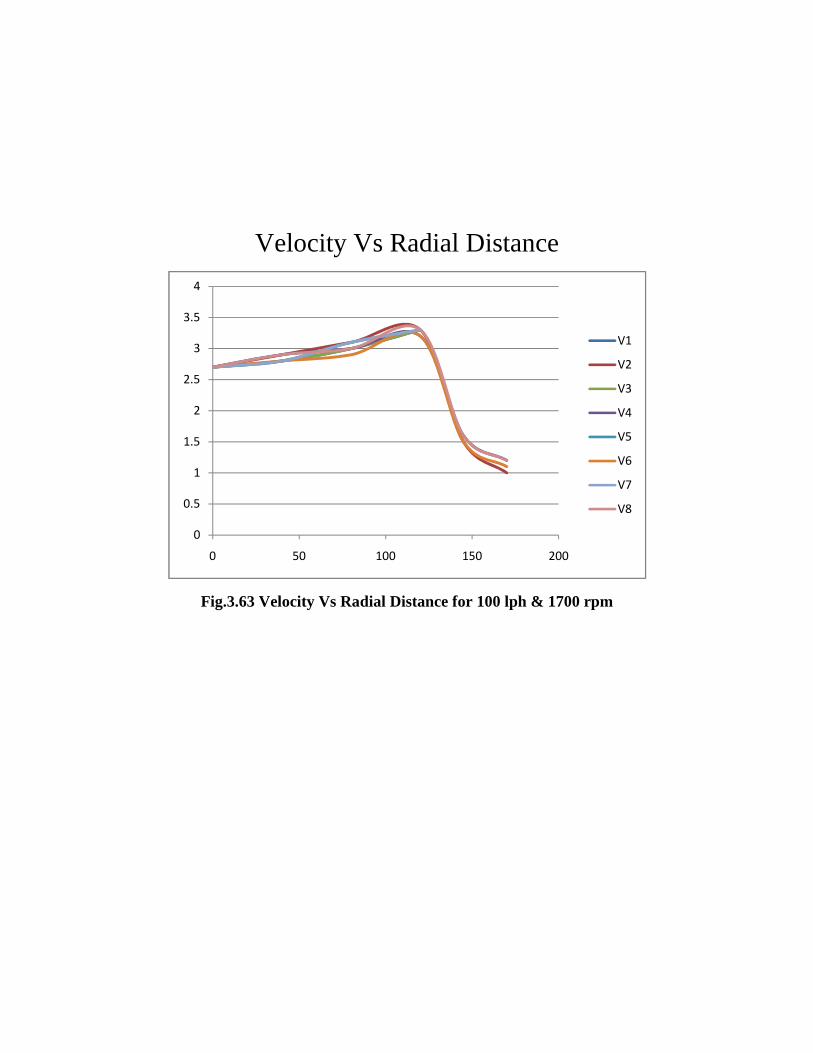
Velocity Vs Radial Distance
Fig.3.63 Velocity Vs Radial Distance for 100 lph & 1700 rpm
0
0.5
1
1.5
2
2.5
3
3.5
4
0 50 100 150 200
V1
V2
V3
V4
V5
V6
V7
V8

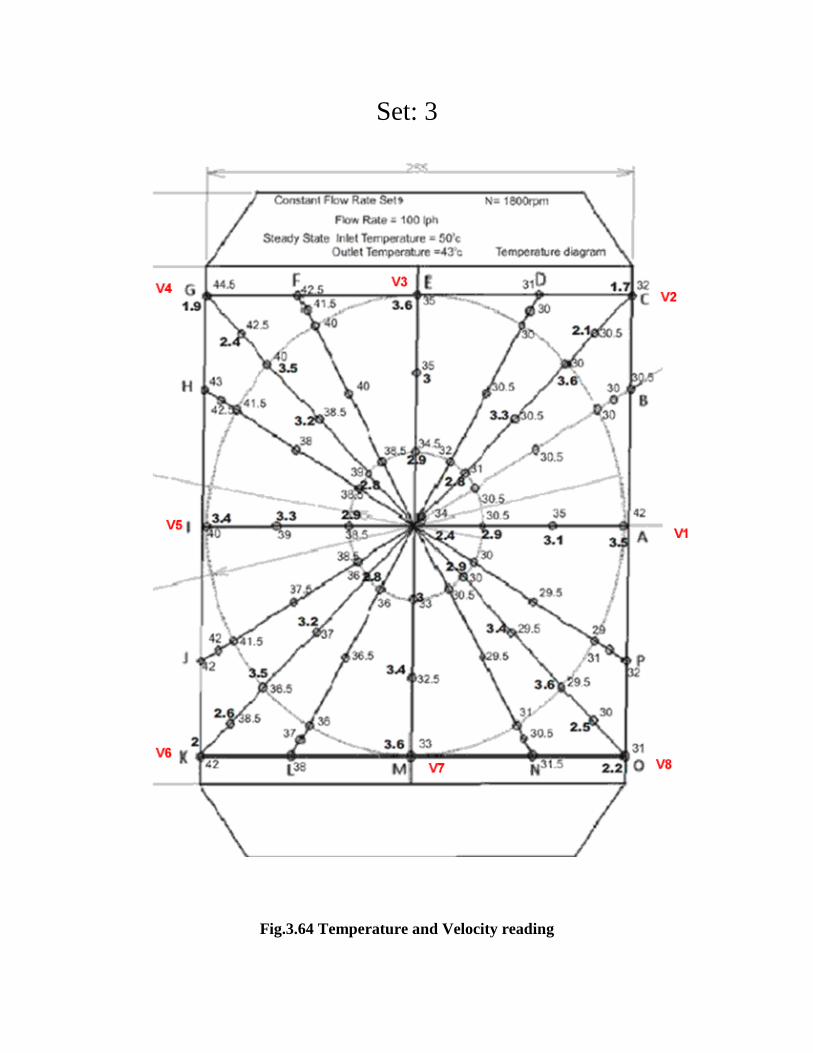
Set: 3
Fig.3.64 Temperature and Velocity reading
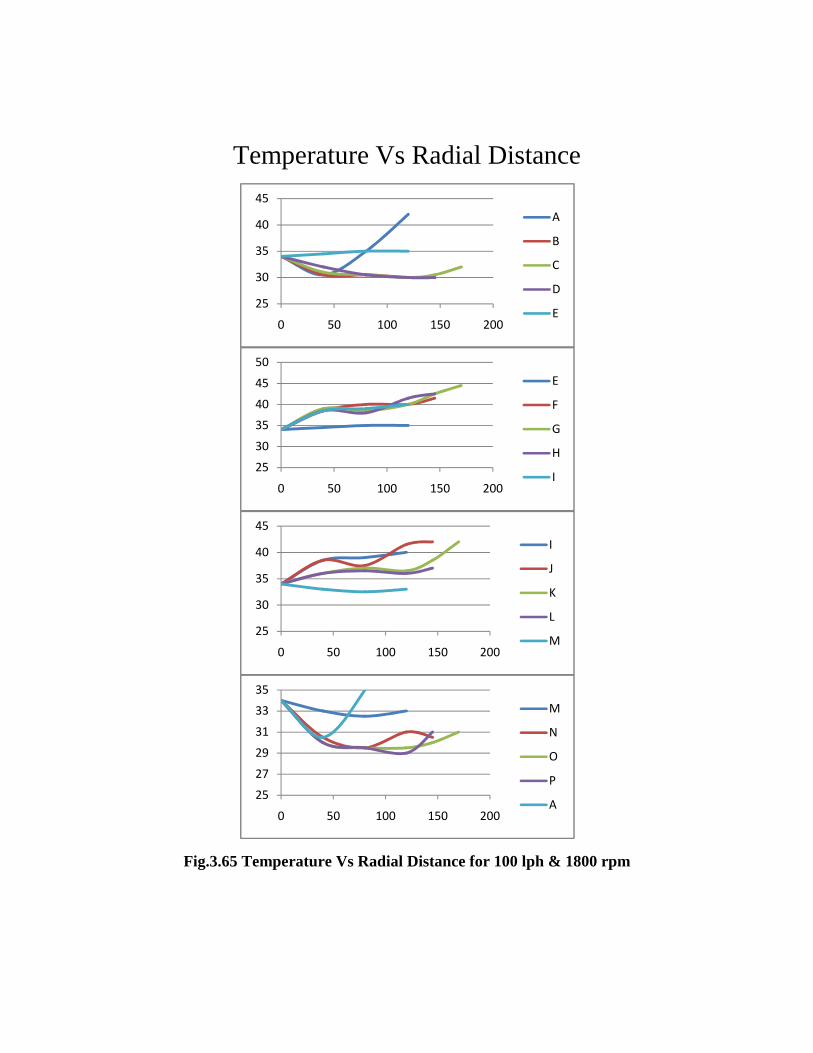
Temperature Vs Radial Distance
Fig.3.65 Temperature Vs Radial Distance for 100 lph & 1800 rpm
25
30
35
40
45
0 50 100 150 200
A
B
C
D
E
25
30
35
40
45
50
0 50 100 150 200
E
F
G
H
I
25
30
35
40
45
0 50 100 150 200
I
J
K
L
M
25
27
29
31
33
35
0 50 100 150 200
M
N
O
P
A
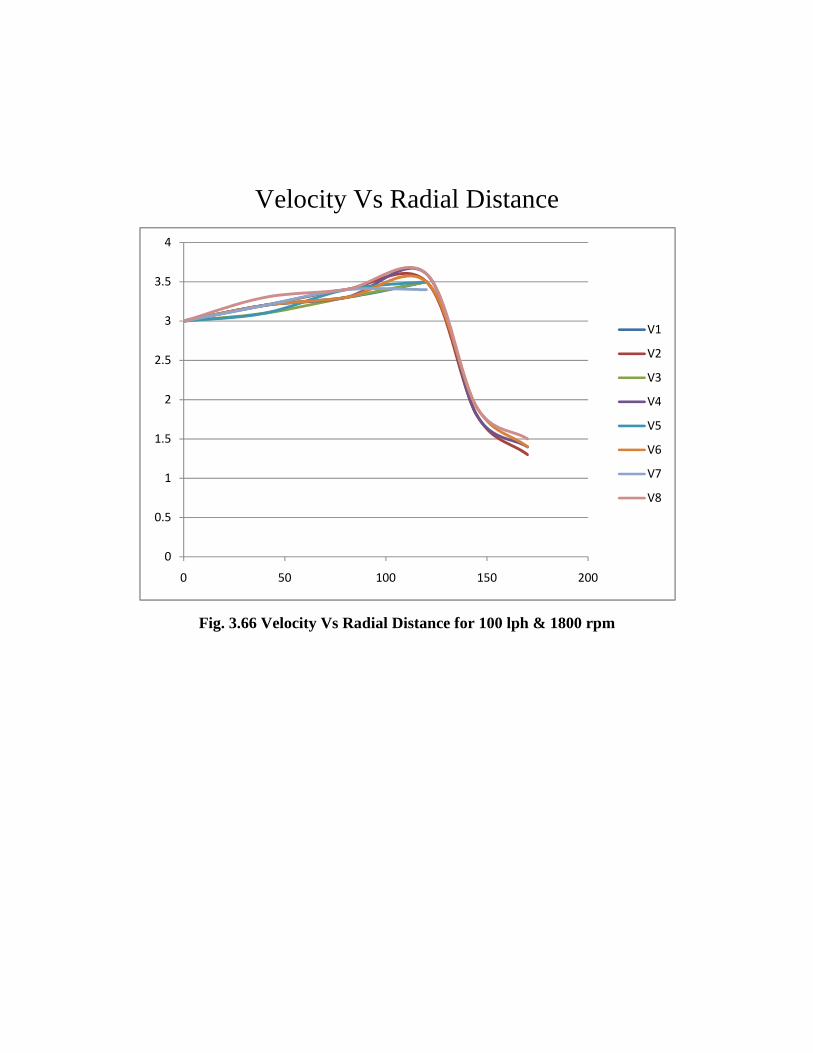
Velocity Vs Radial Distance
Fig. 3.66 Velocity Vs Radial Distance for 100 lph & 1800 rpm
0
0.5
1
1.5
2
2.5
3
3.5
4
0 50 100 150 200
V1
V2
V3
V4
V5
V6
V7
V8

Set: 4
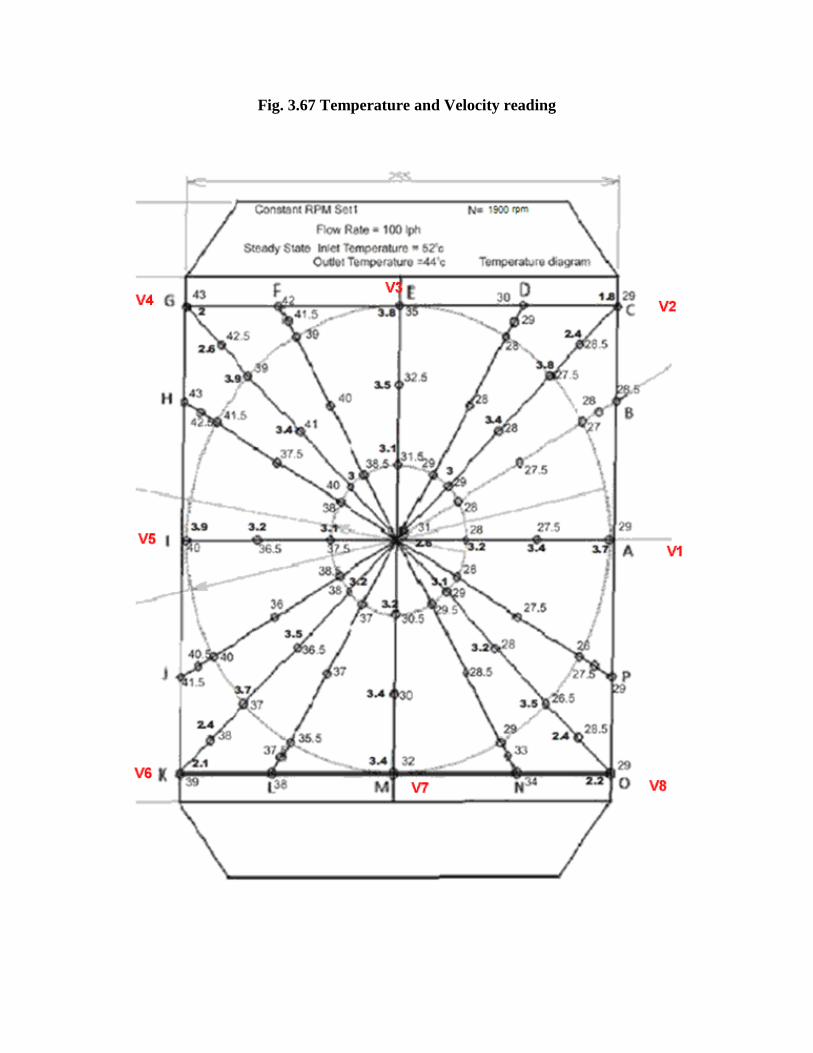
Fig. 3.67 Temperature and Velocity reading
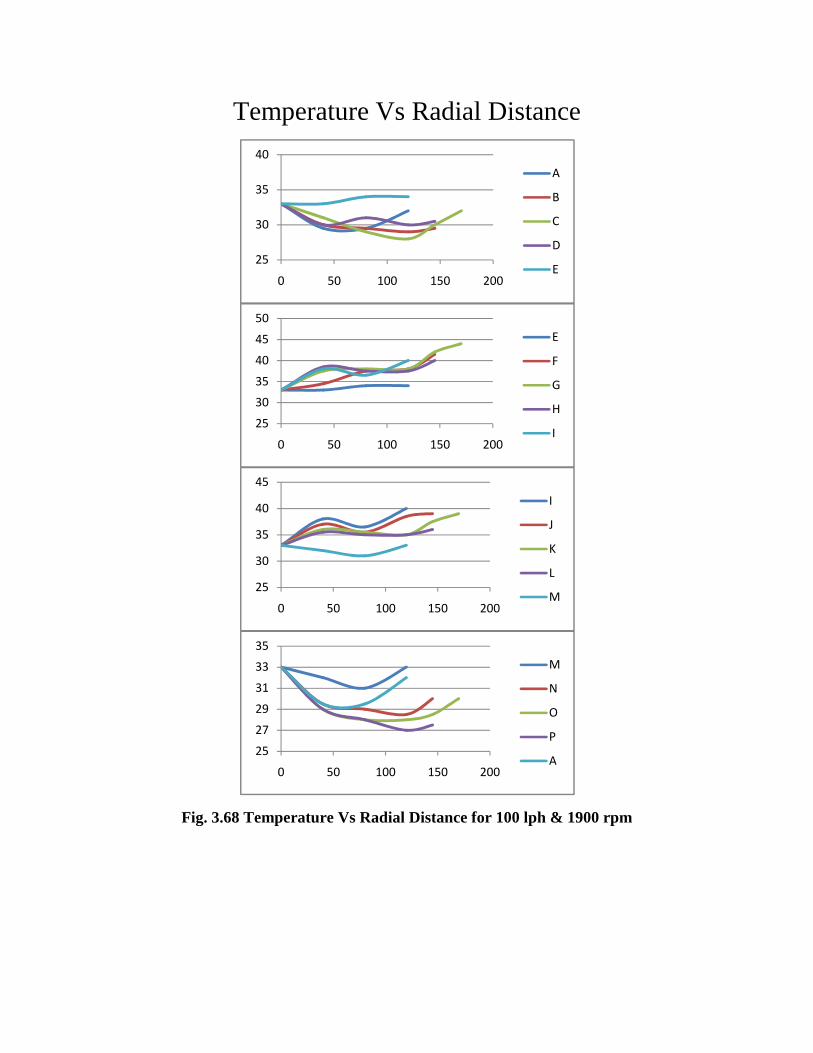
Temperature Vs Radial Distance
Fig. 3.68 Temperature Vs Radial Distance for 100 lph & 1900 rpm
25
30
35
40
0 50 100 150 200
A
B
C
D
E
25
30
35
40
45
50
0 50 100 150 200
E
F
G
H
I
25
30
35
40
45
0 50 100 150 200
I
J
K
L
M
25
27
29
31
33
35
0 50 100 150 200
M
N
O
P
A
Velocity Vs Radial Distance
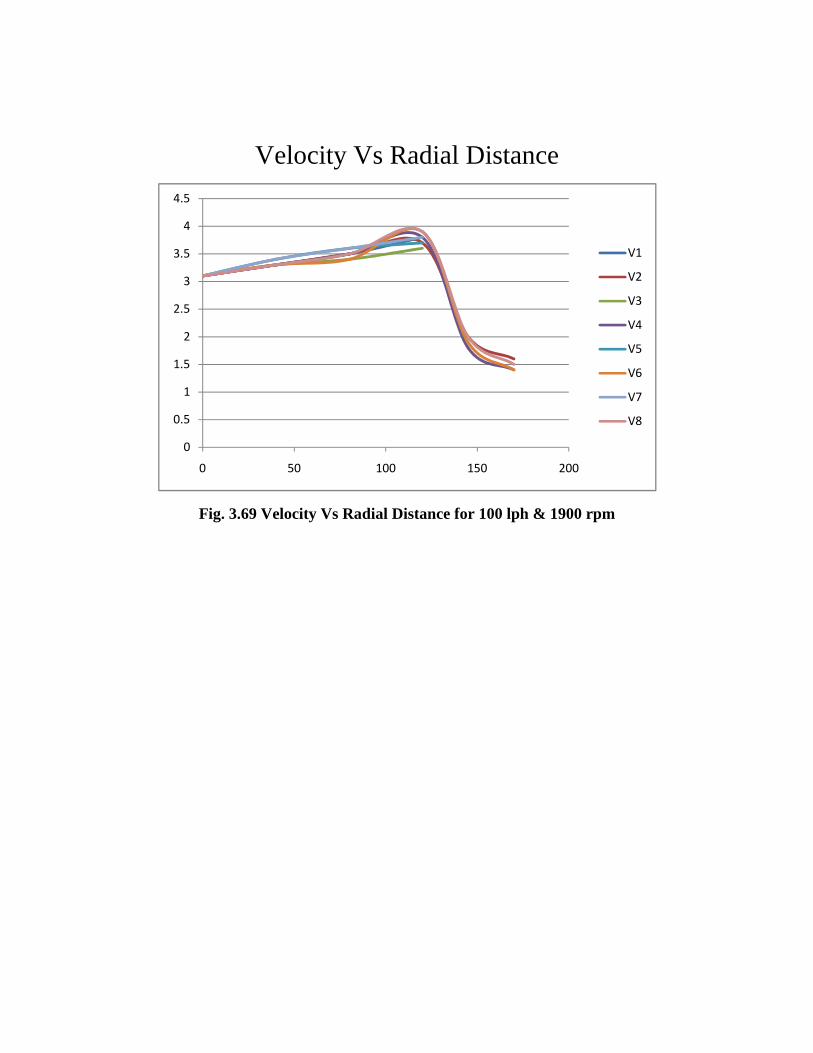
Fig. 3.69 Velocity Vs Radial Distance for 100 lph & 1900 rpm
0
0.5
1
1.5
2
2.5
3
3.5
4
4.5
0 50 100 150 200
V1
V2
V3
V4
V5
V6
V7
V8
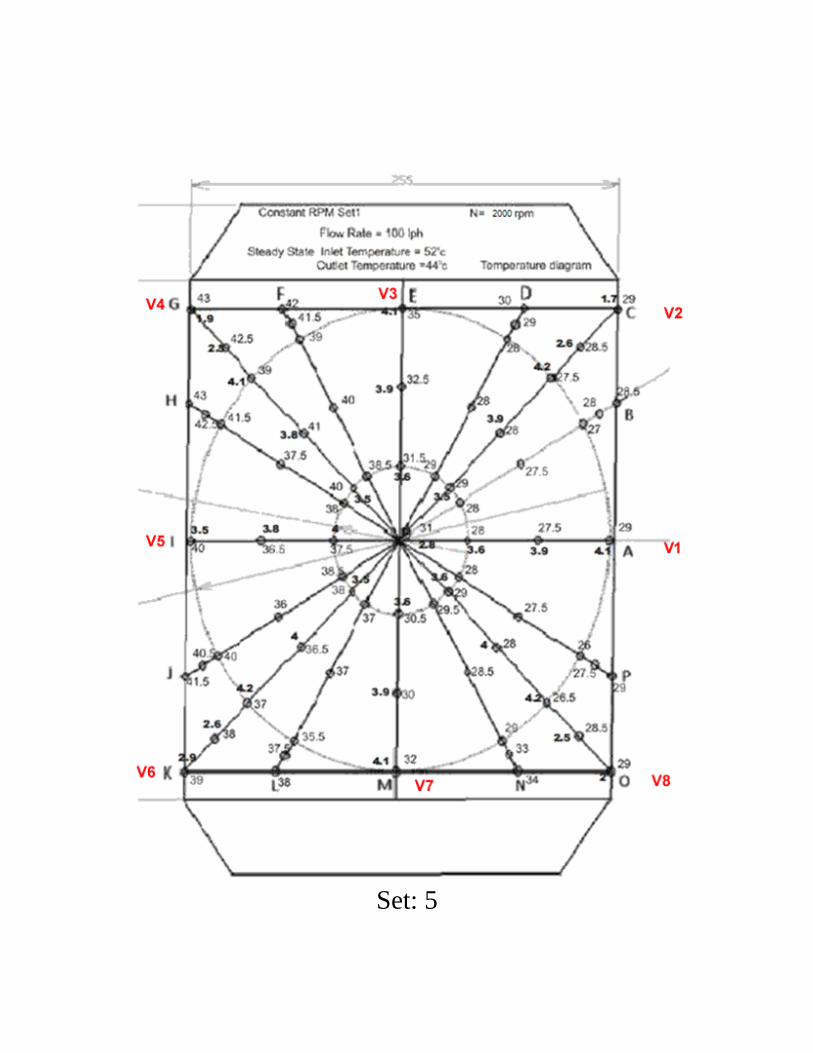
Set: 5
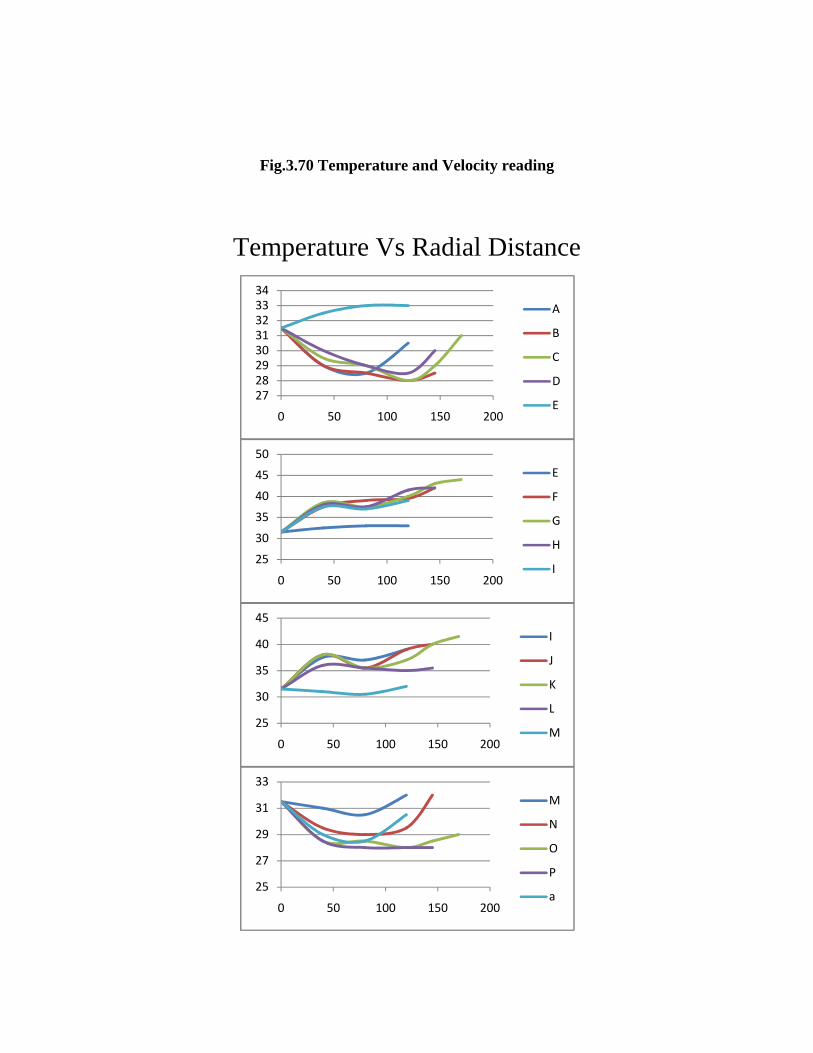
Fig.3.70 Temperature and Velocity reading
Temperature Vs Radial Distance
27
28
29
30
31
32
33
34
0 50 100 150 200
A
B
C
D
E
25
30
35
40
45
50
0 50 100 150 200
E
F
G
H
I
25
30
35
40
45
0 50 100 150 200
I
J
K
L
M
25
27
29
31
33
0 50 100 150 200
M
N
O
P
a
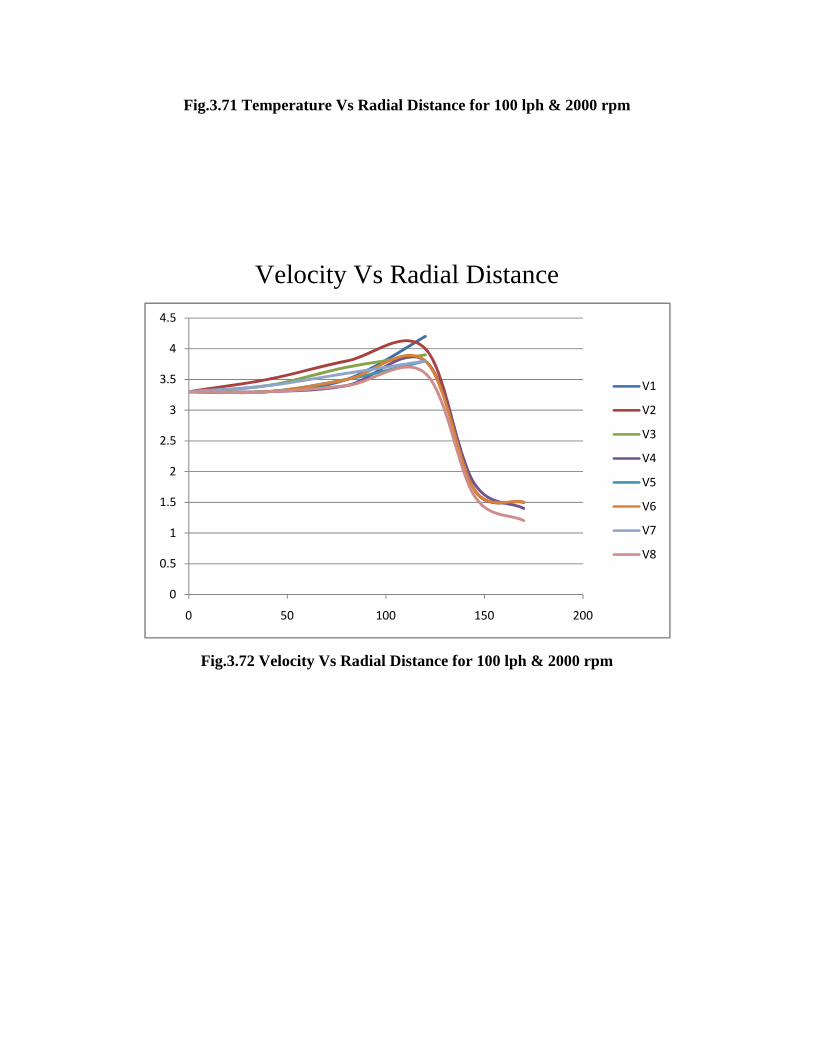
Fig.3.71 Temperature Vs Radial Distance for 100 lph & 2000 rpm
Velocity Vs Radial Distance
Fig.3.72 Velocity Vs Radial Distance for 100 lph & 2000 rpm
0
0.5
1
1.5
2
2.5
3
3.5
4
4.5
0 50 100 150 200
V1
V2
V3
V4
V5
V6
V7
V8
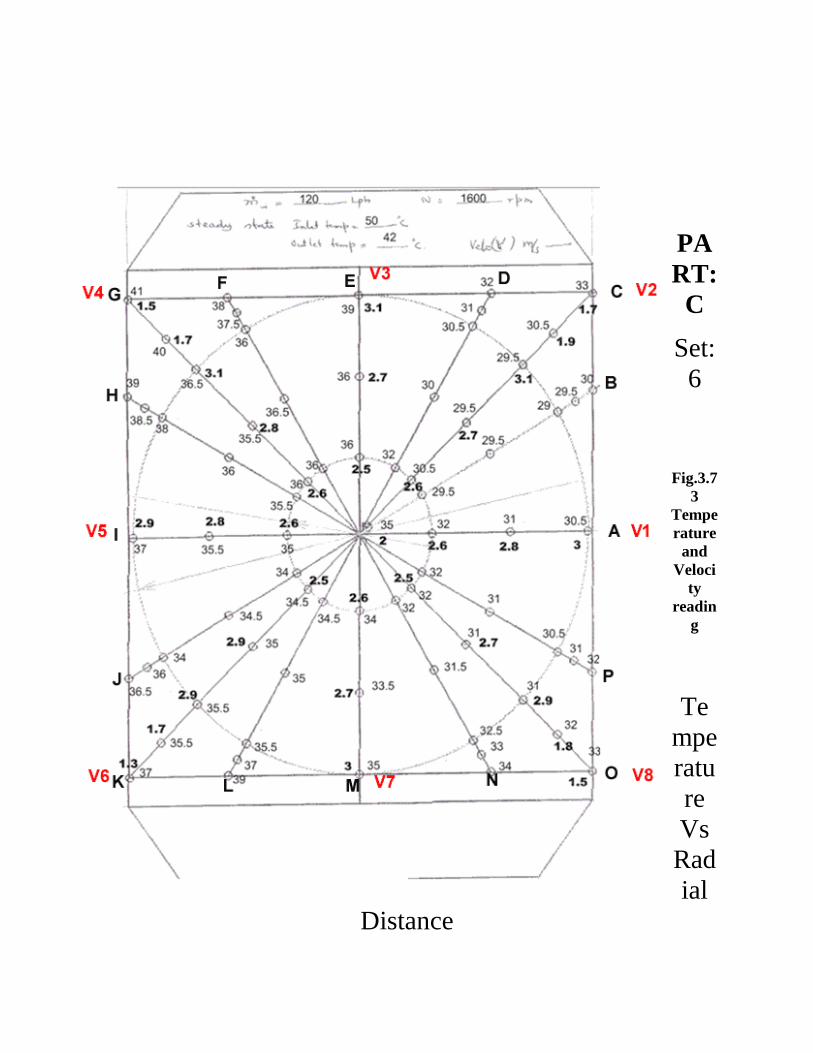
PART: C
Set: 6
Fig.3.73
Temperature and
Velocity
reading
Temperature Vs Radial
Distance
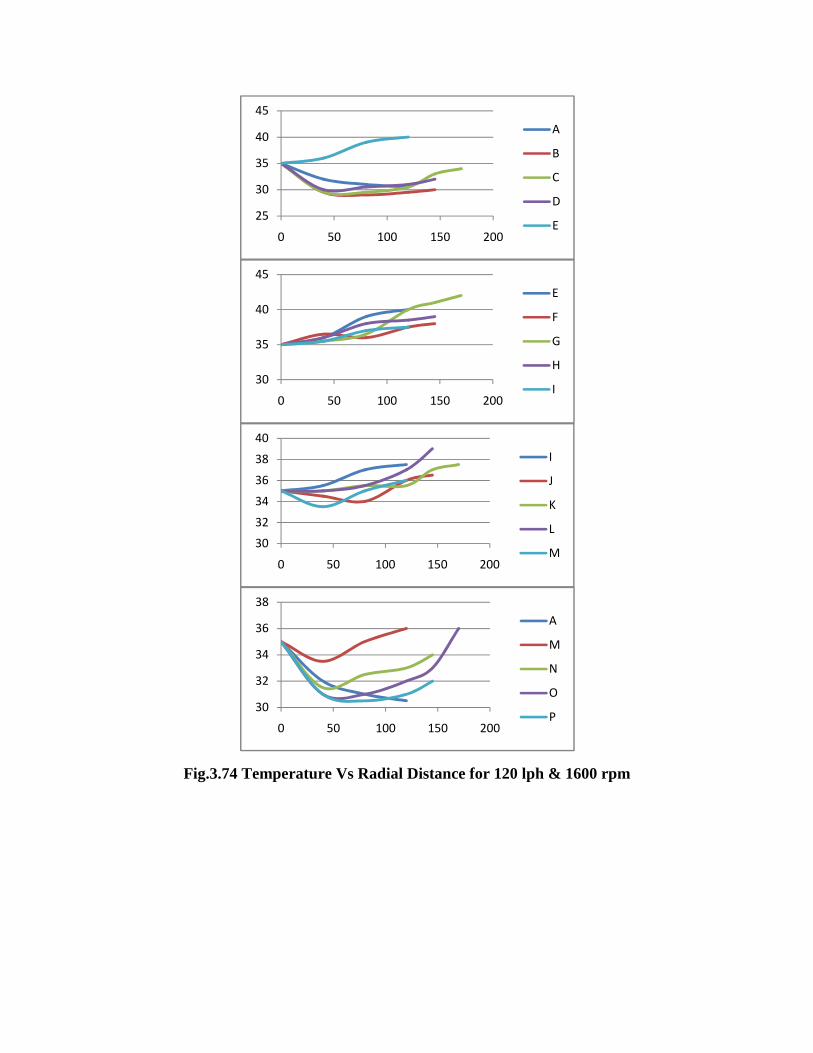
Fig.3.74 Temperature Vs Radial Distance for 120 lph & 1600 rpm
25
30
35
40
45
0 50 100 150 200
A
B
C
D
E
30
35
40
45
0 50 100 150 200
E
F
G
H
I
30
32
34
36
38
40
0 50 100 150 200
I
J
K
L
M
30
32
34
36
38
0 50 100 150 200
A
M
N
O
P
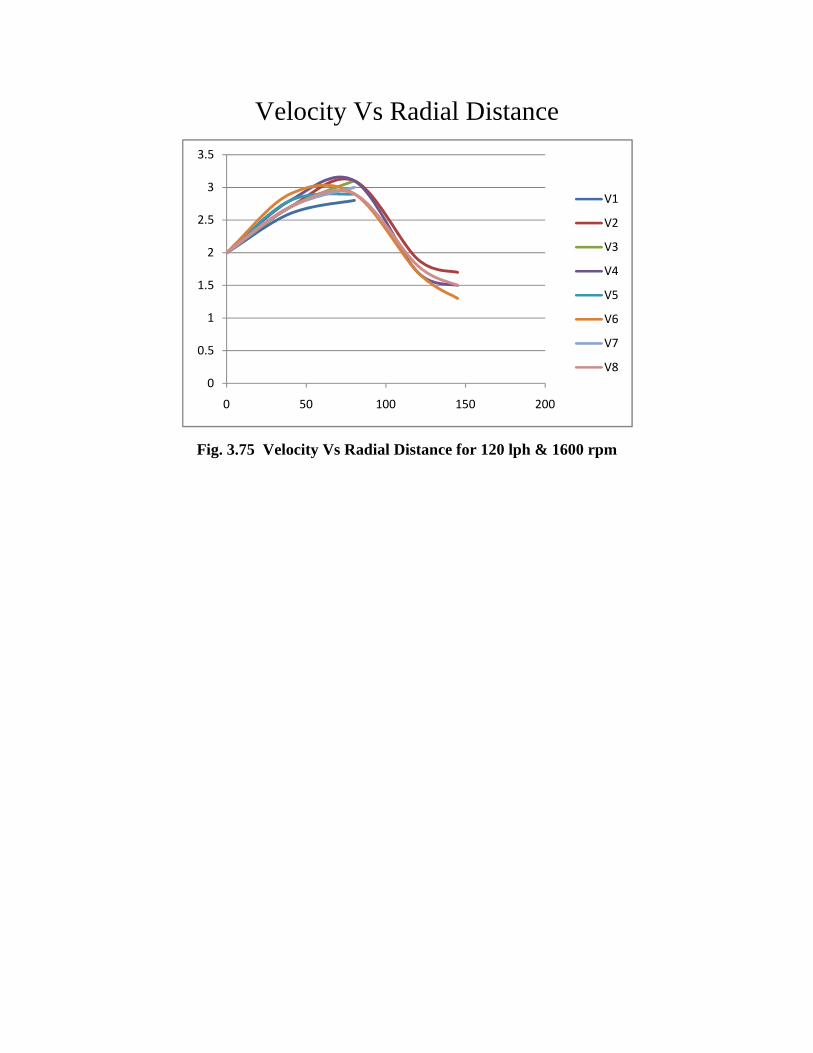
Velocity Vs Radial Distance
Fig. 3.75 Velocity Vs Radial Distance for 120 lph & 1600 rpm
0
0.5
1
1.5
2
2.5
3
3.5
0 50 100 150 200
V1
V2
V3
V4
V5
V6
V7
V8
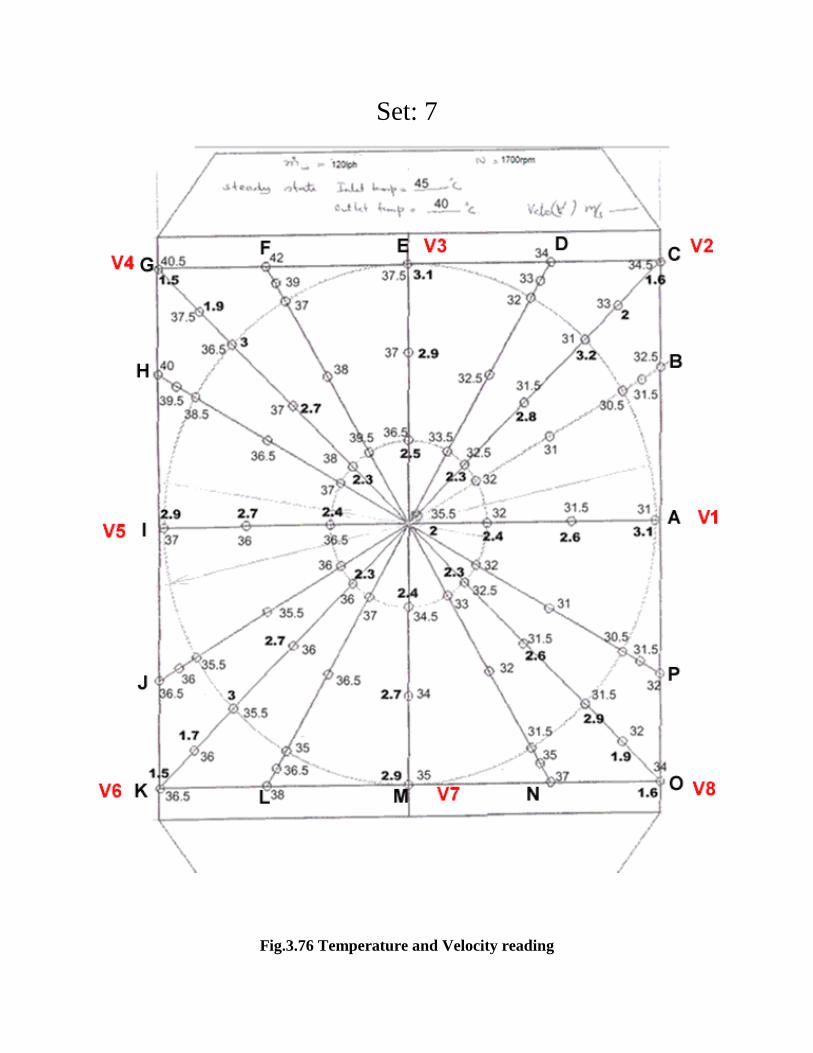
Set: 7
Fig.3.76 Temperature and Velocity reading
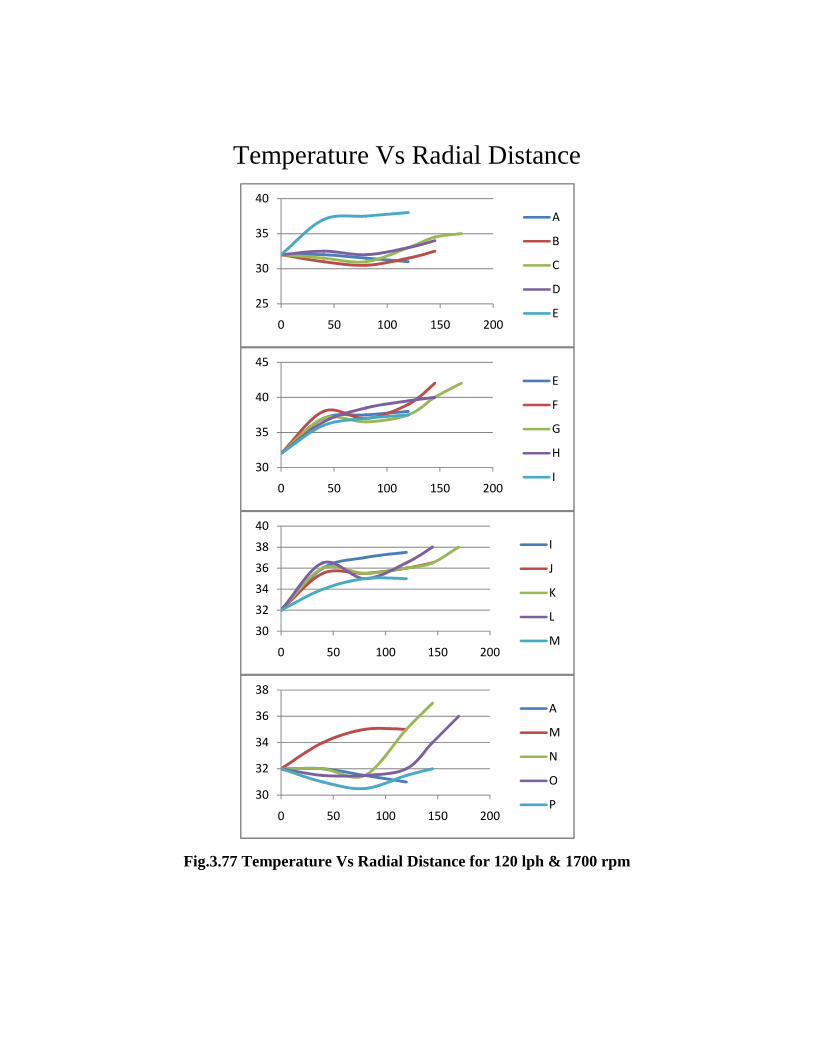
Temperature Vs Radial Distance
Fig.3.77 Temperature Vs Radial Distance for 120 lph & 1700 rpm
25
30
35
40
0 50 100 150 200
A
B
C
D
E
30
35
40
45
0 50 100 150 200
E
F
G
H
I
30
32
34
36
38
40
0 50 100 150 200
I
J
K
L
M
30
32
34
36
38
0 50 100 150 200
A
M
N
O
P
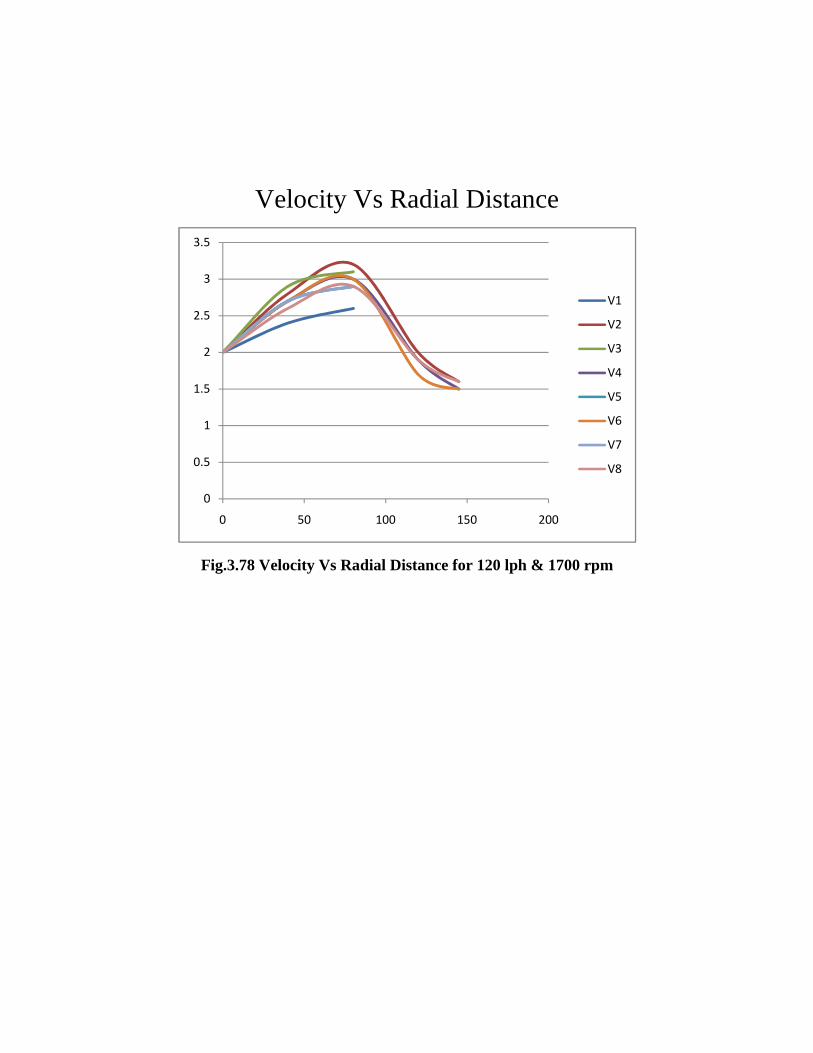
Velocity Vs Radial Distance
Fig.3.78 Velocity Vs Radial Distance for 120 lph & 1700 rpm
0
0.5
1
1.5
2
2.5
3
3.5
0 50 100 150 200
V1
V2
V3
V4
V5
V6
V7
V8
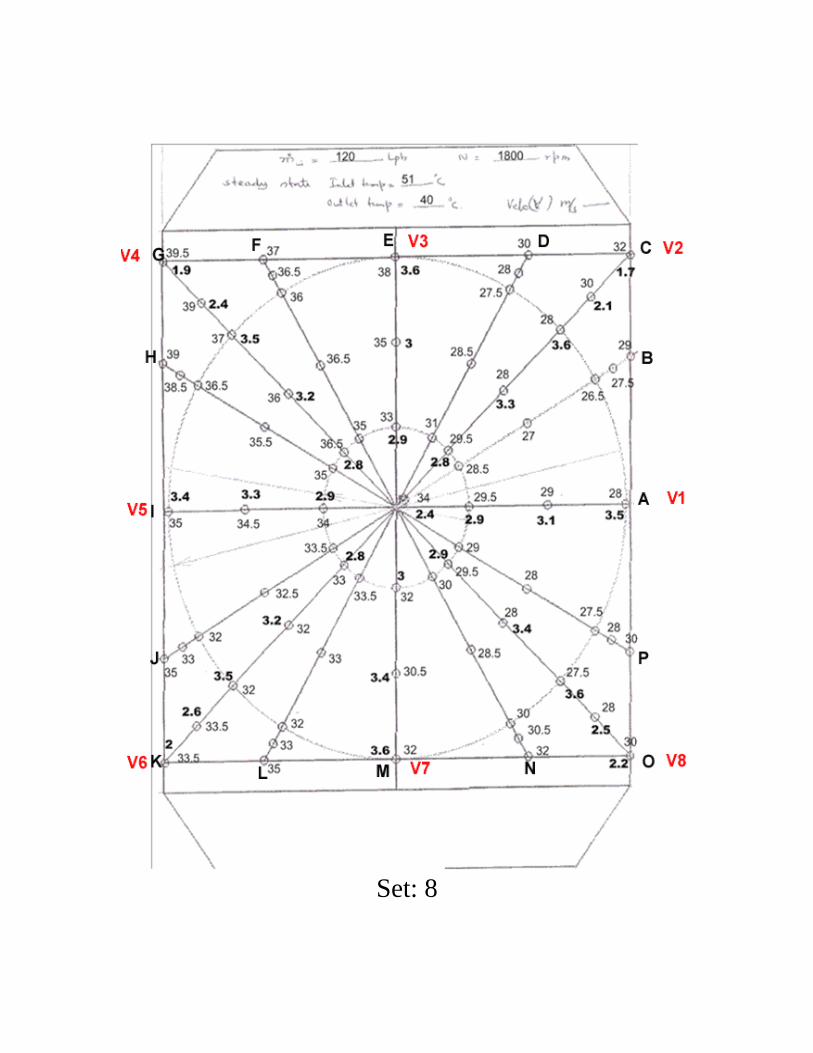
Set: 8
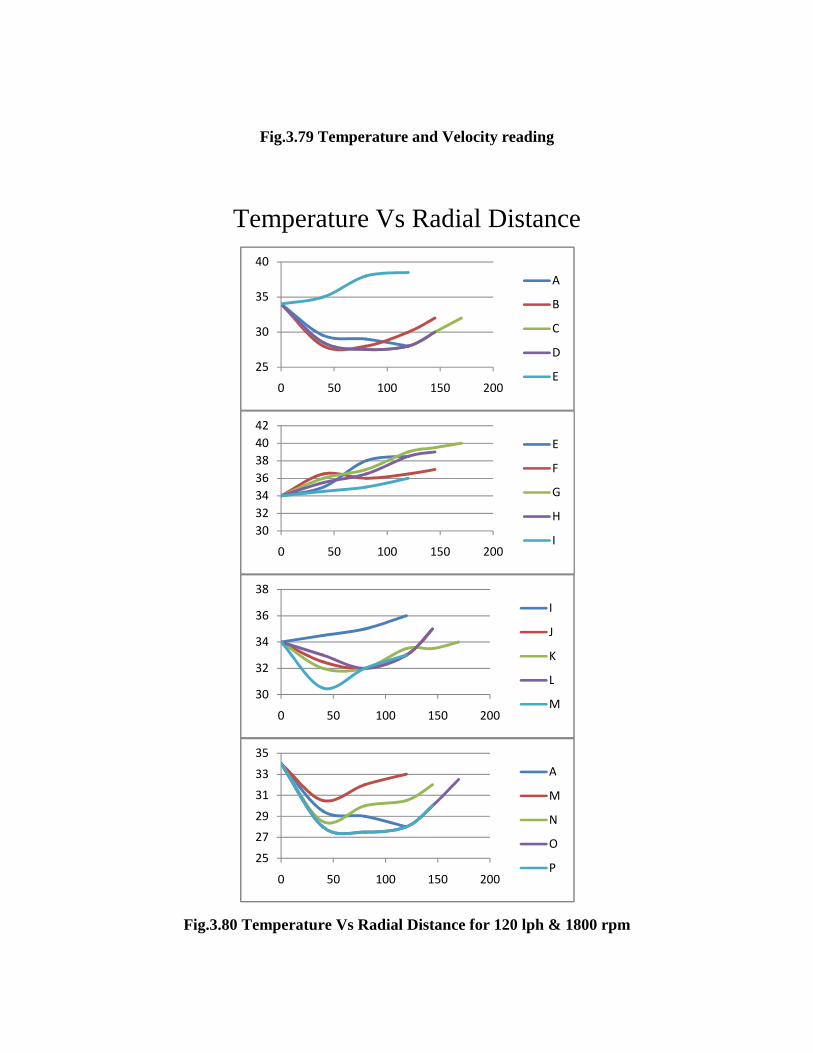
Fig.3.79 Temperature and Velocity reading
Temperature Vs Radial Distance
Fig.3.80 Temperature Vs Radial Distance for 120 lph & 1800 rpm
25
30
35
40
0 50 100 150 200
A
B
C
D
E
30
32
34
36
38
40
42
0 50 100 150 200
E
F
G
H
I
30
32
34
36
38
0 50 100 150 200
I
J
K
L
M
25
27
29
31
33
35
0 50 100 150 200
A
M
N
O
P
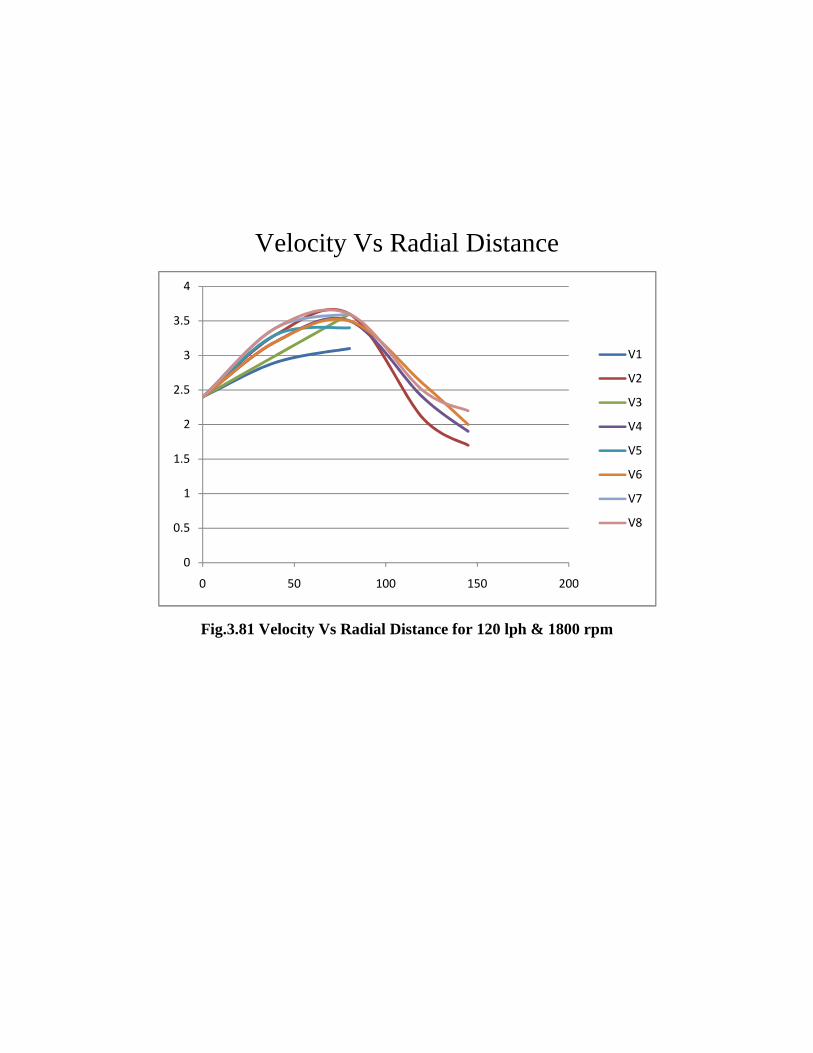
Velocity Vs Radial Distance
Fig.3.81 Velocity Vs Radial Distance for 120 lph & 1800 rpm
0
0.5
1
1.5
2
2.5
3
3.5
4
0 50 100 150 200
V1
V2
V3
V4
V5
V6
V7
V8

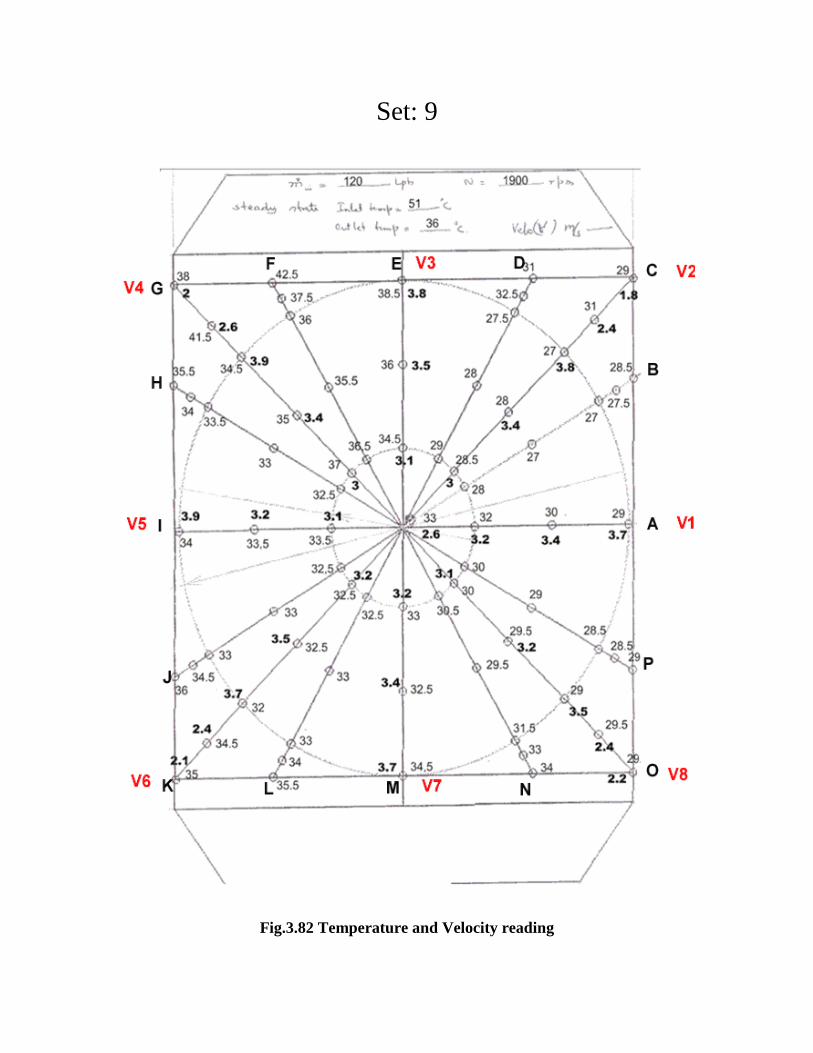
Set: 9
Fig.3.82 Temperature and Velocity reading
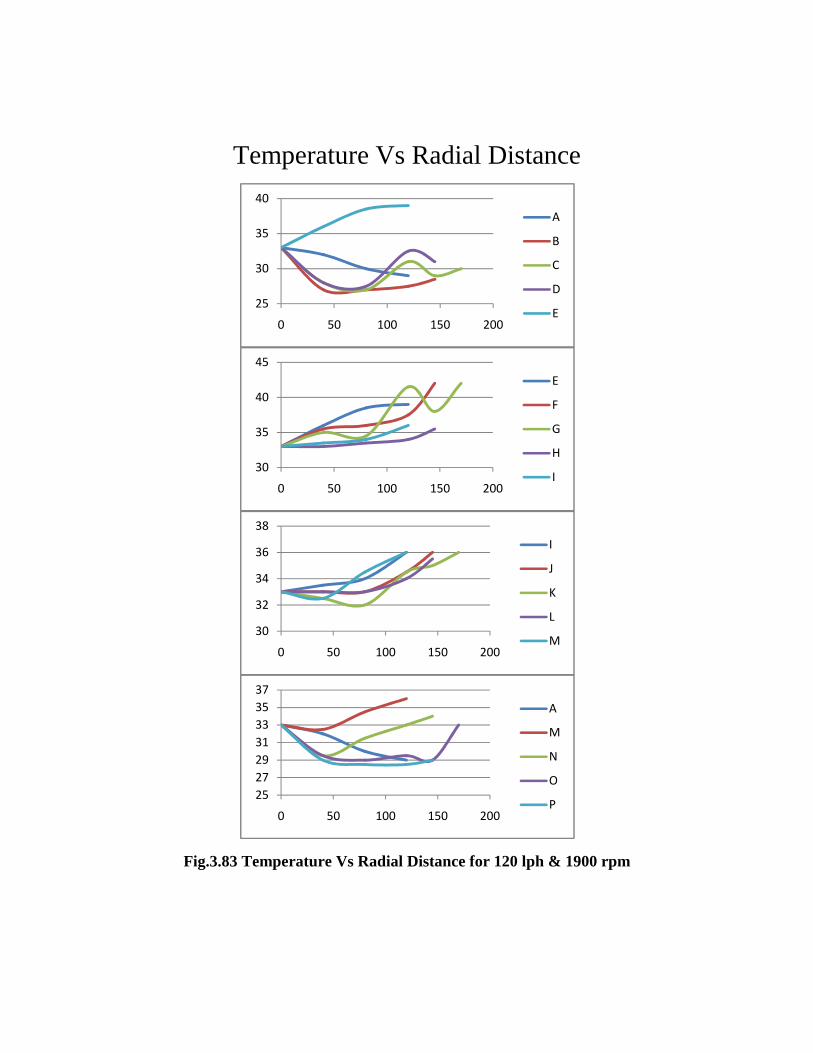
Temperature Vs Radial Distance
Fig.3.83 Temperature Vs Radial Distance for 120 lph & 1900 rpm
25
30
35
40
0 50 100 150 200
A
B
C
D
E
30
35
40
45
0 50 100 150 200
E
F
G
H
I
30
32
34
36
38
0 50 100 150 200
I
J
K
L
M
25
27
29
31
33
35
37
0 50 100 150 200
A
M
N
O
P
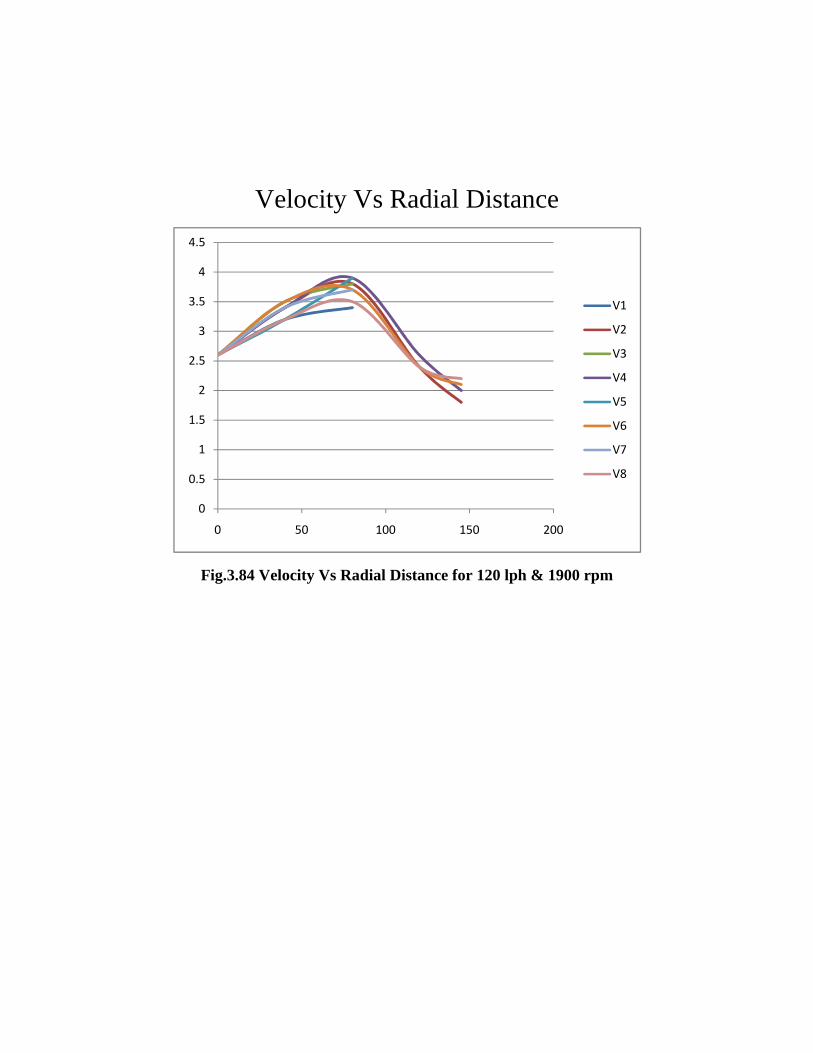
Velocity Vs Radial Distance
Fig.3.84 Velocity Vs Radial Distance for 120 lph & 1900 rpm
0
0.5
1
1.5
2
2.5
3
3.5
4
4.5
0 50 100 150 200
V1
V2
V3
V4
V5
V6
V7
V8
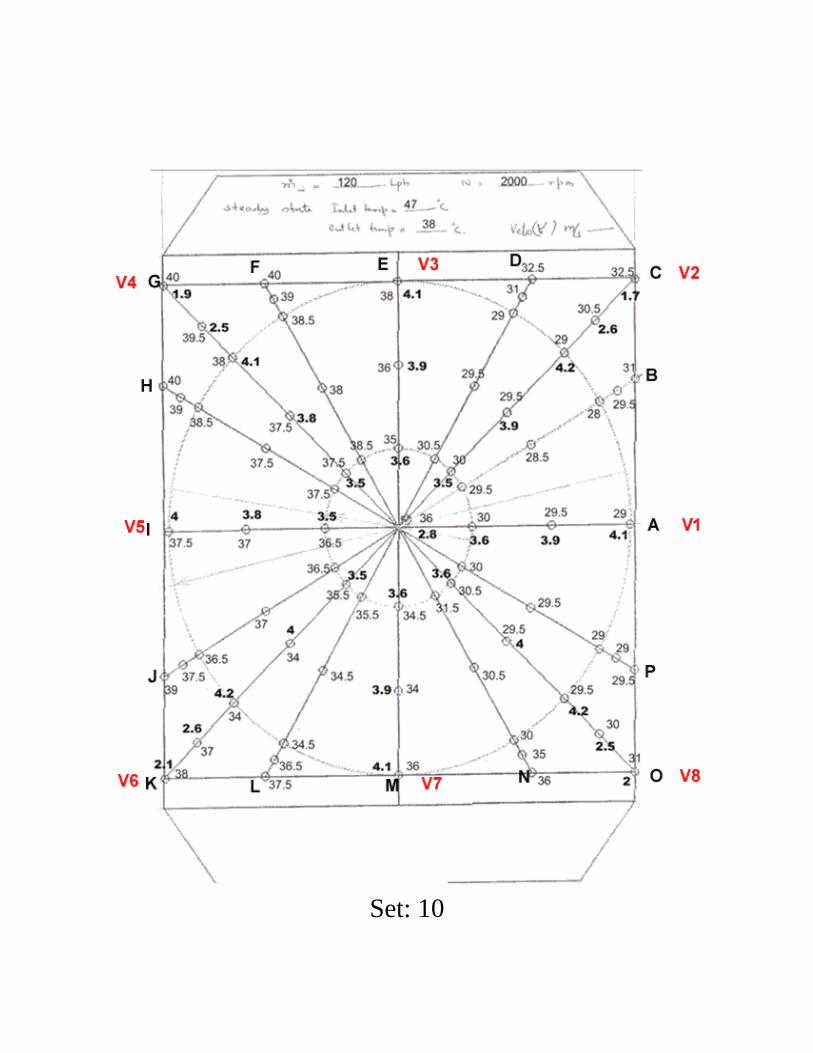
Set: 10
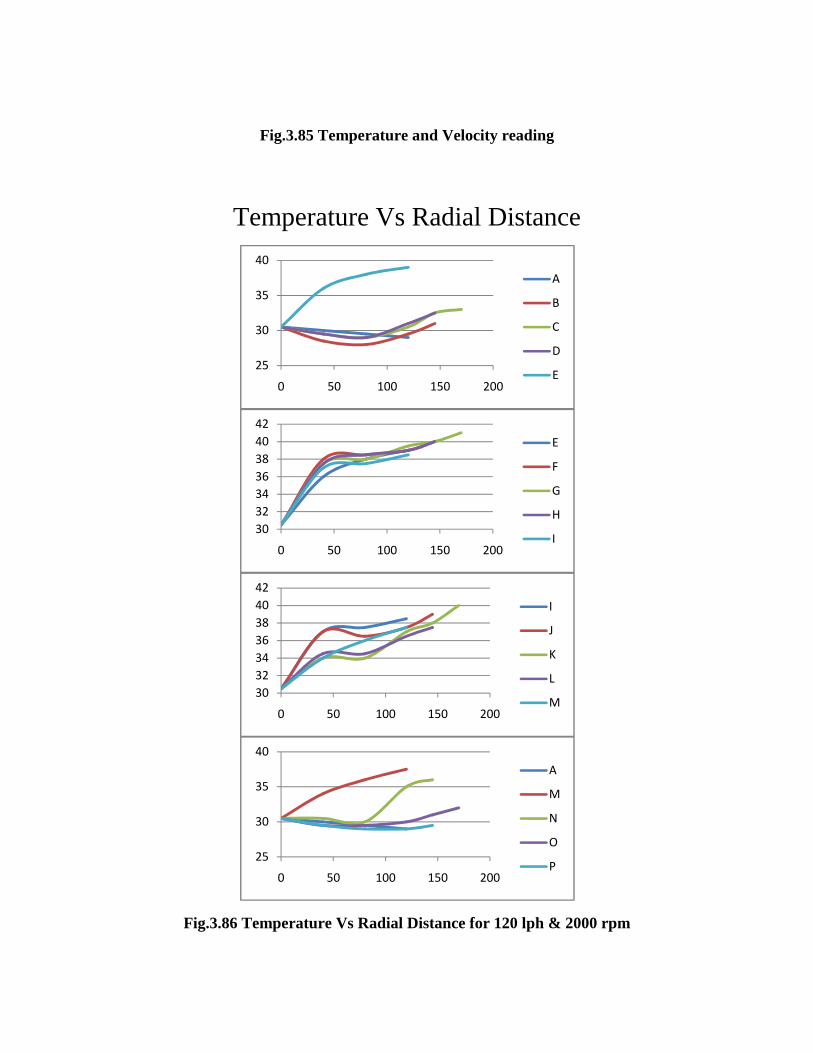
Fig.3.85 Temperature and Velocity reading
Temperature Vs Radial Distance
Fig.3.86 Temperature Vs Radial Distance for 120 lph & 2000 rpm
25
30
35
40
0 50 100 150 200
A
B
C
D
E
30
32
34
36
38
40
42
0 50 100 150 200
E
F
G
H
I
30
32
34
36
38
40
42
0 50 100 150 200
I
J
K
L
M
25
30
35
40
0 50 100 150 200
A
M
N
O
P
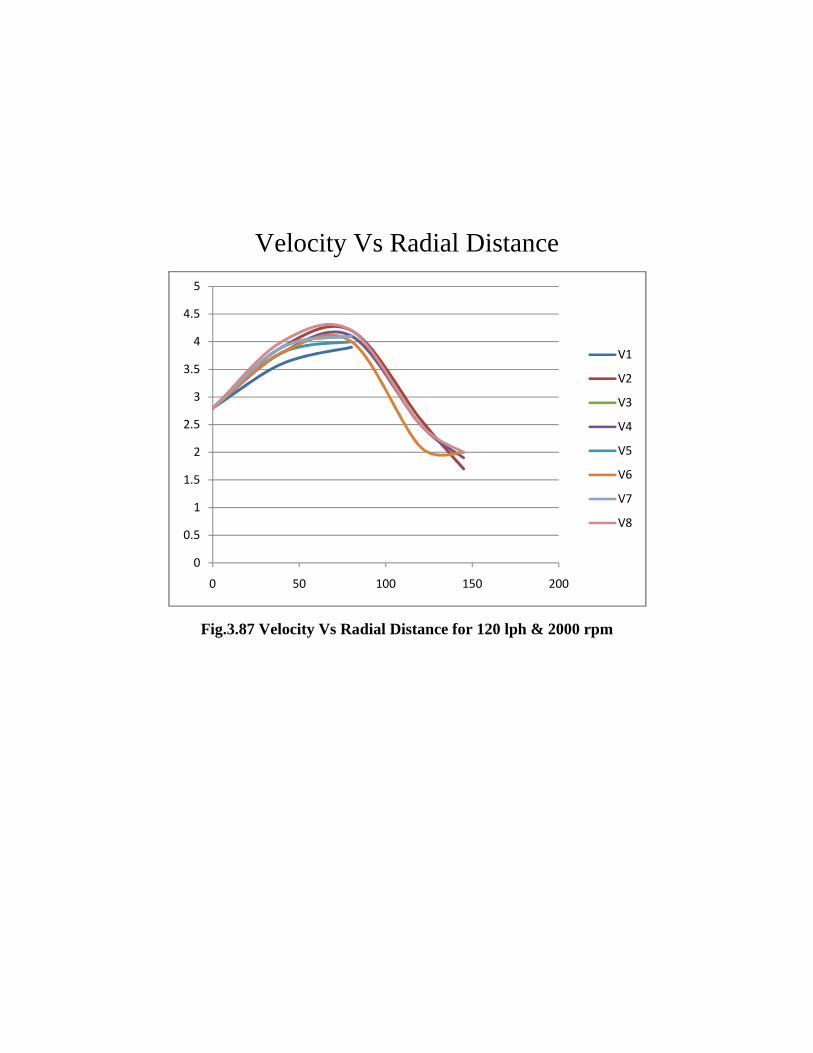
Velocity Vs Radial Distance
Fig.3.87 Velocity Vs Radial Distance for 120 lph & 2000 rpm
0
0.5
1
1.5
2
2.5
3
3.5
4
4.5
5
0 50 100 150 200
V1
V2
V3
V4
V5
V6
V7
V8

PART: D
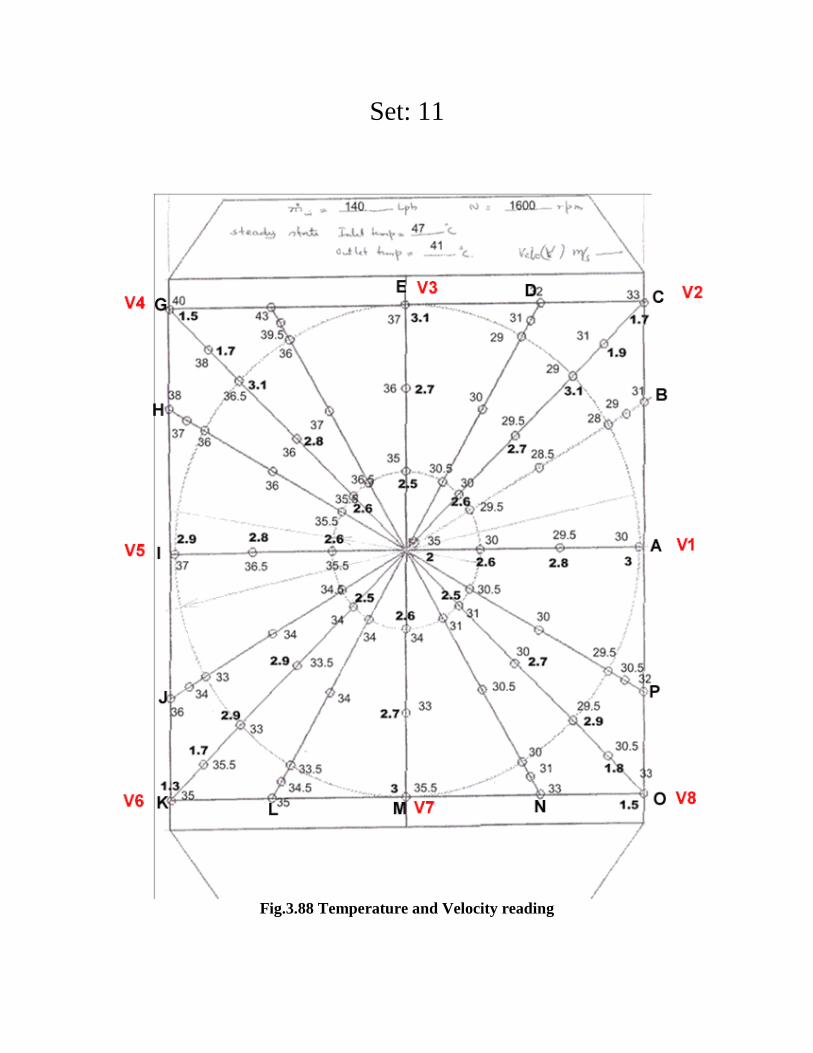
Set: 11
Fig.3.88 Temperature and Velocity reading
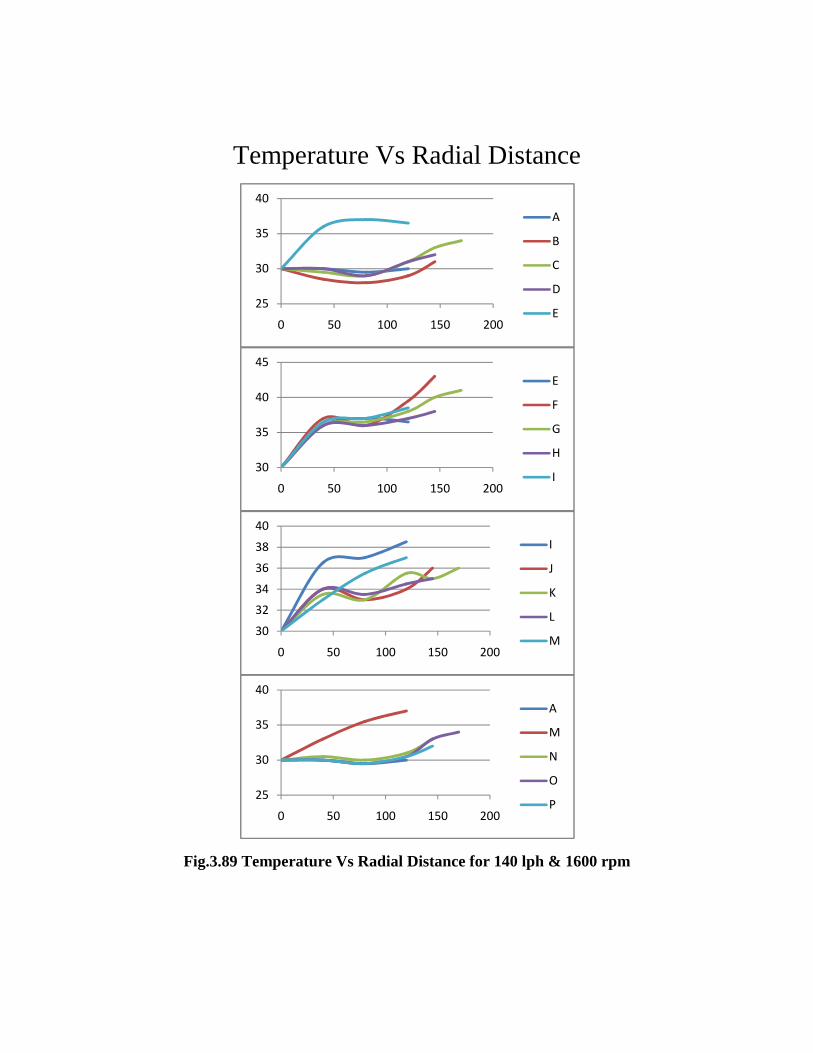
Temperature Vs Radial Distance
Fig.3.89 Temperature Vs Radial Distance for 140 lph & 1600 rpm
25
30
35
40
0 50 100 150 200
A
B
C
D
E
30
35
40
45
0 50 100 150 200
E
F
G
H
I
30
32
34
36
38
40
0 50 100 150 200
I
J
K
L
M
25
30
35
40
0 50 100 150 200
A
M
N
O
P
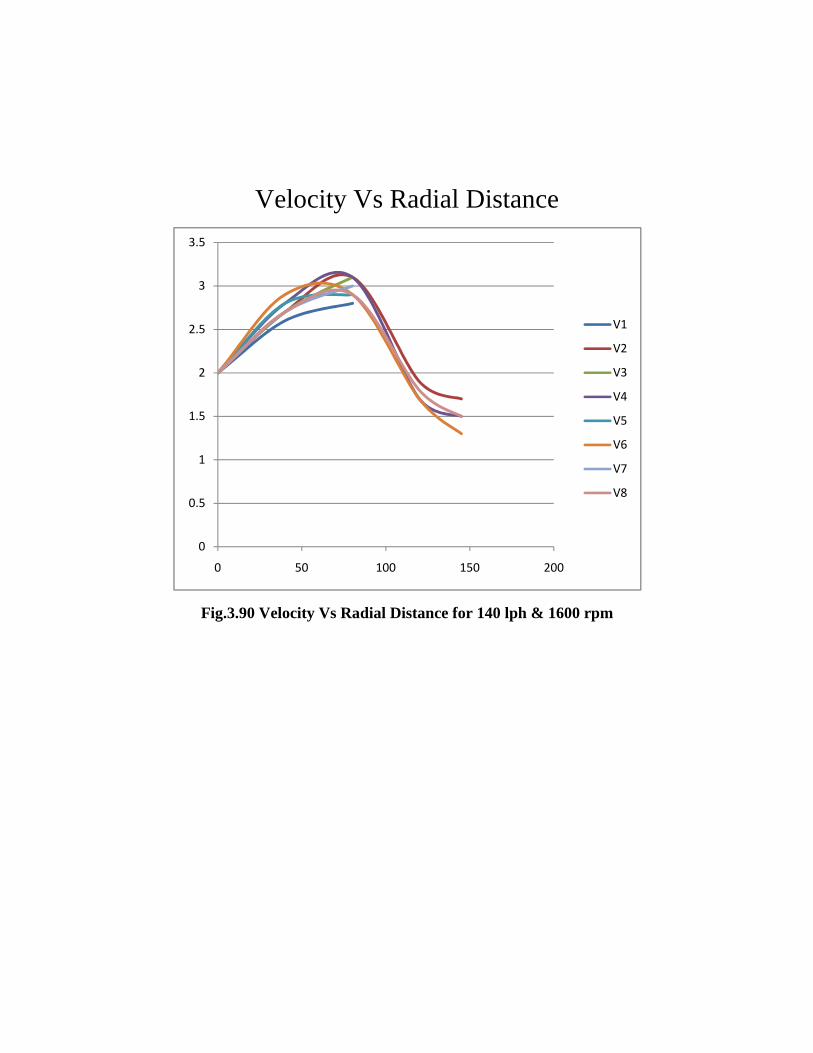
Velocity Vs Radial Distance
Fig.3.90 Velocity Vs Radial Distance for 140 lph & 1600 rpm
0
0.5
1
1.5
2
2.5
3
3.5
0 50 100 150 200
V1
V2
V3
V4
V5
V6
V7
V8
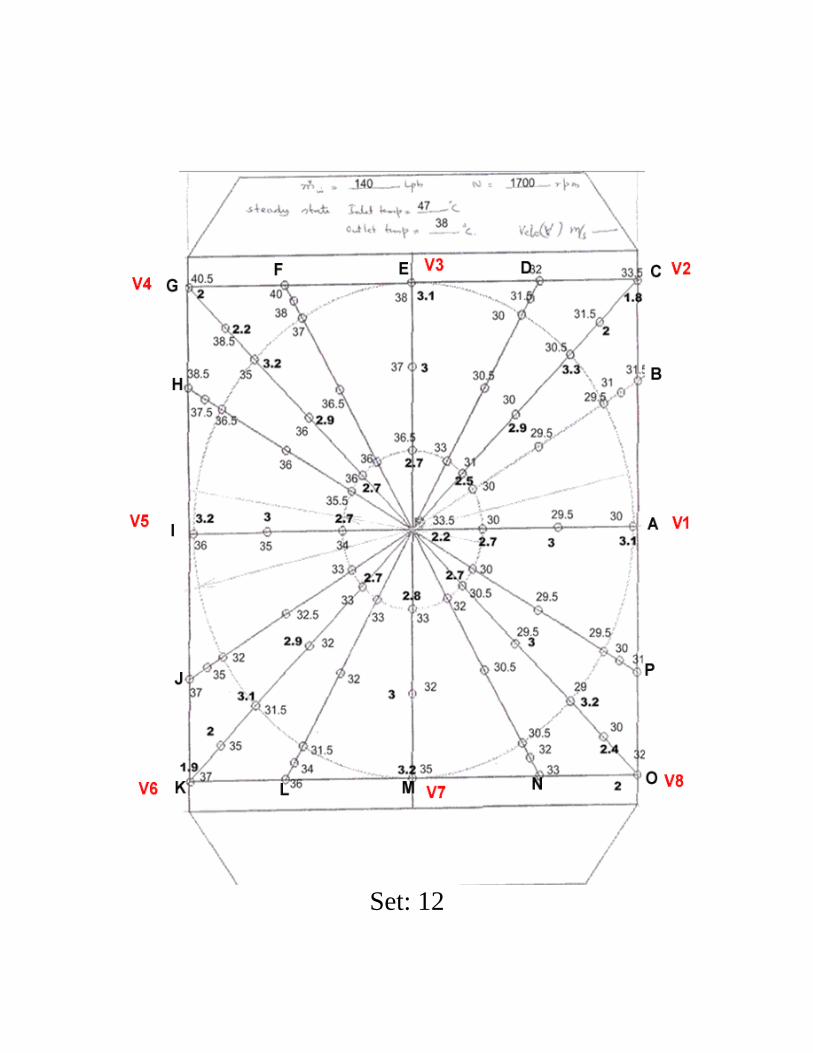
Set: 12
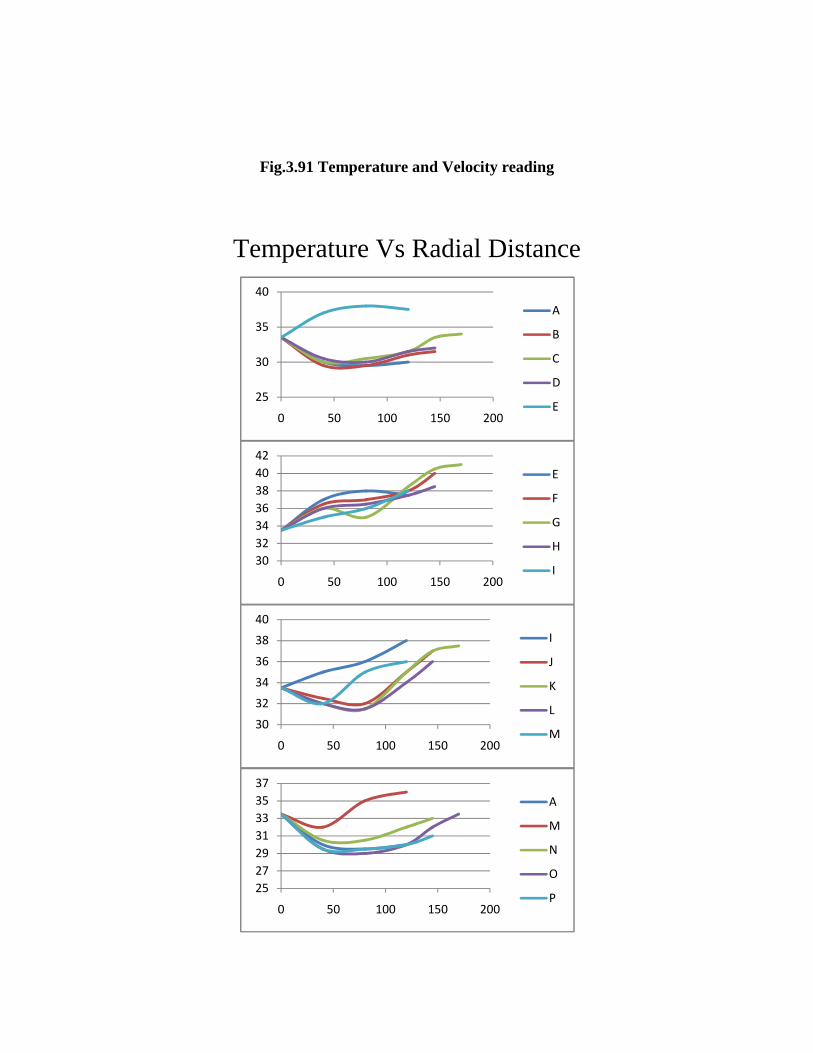
Fig.3.91 Temperature and Velocity reading
Temperature Vs Radial Distance
25
30
35
40
0 50 100 150 200
A
B
C
D
E
30
32
34
36
38
40
42
0 50 100 150 200
E
F
G
H
I
30
32
34
36
38
40
0 50 100 150 200
I
J
K
L
M
25
27
29
31
33
35
37
0 50 100 150 200
A
M
N
O
P
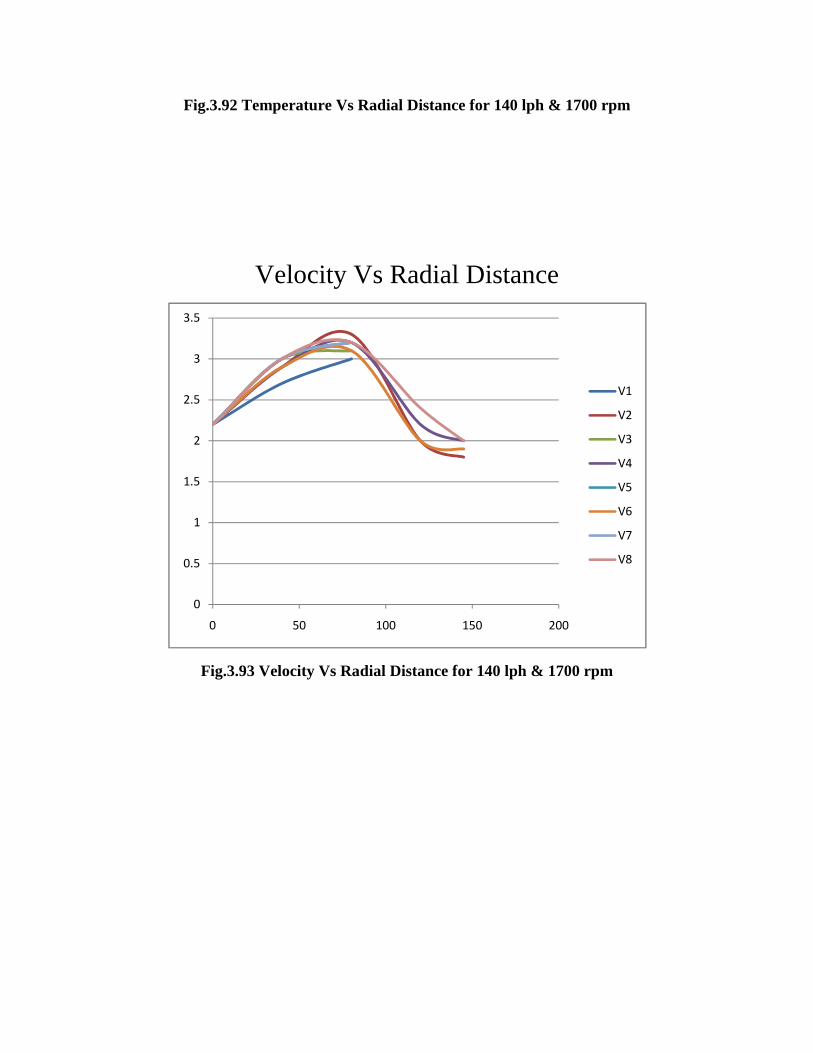
Fig.3.92 Temperature Vs Radial Distance for 140 lph & 1700 rpm
Velocity Vs Radial Distance
Fig.3.93 Velocity Vs Radial Distance for 140 lph & 1700 rpm
0
0.5
1
1.5
2
2.5
3
3.5
0 50 100 150 200
V1
V2
V3
V4
V5
V6
V7
V8

Set: 13
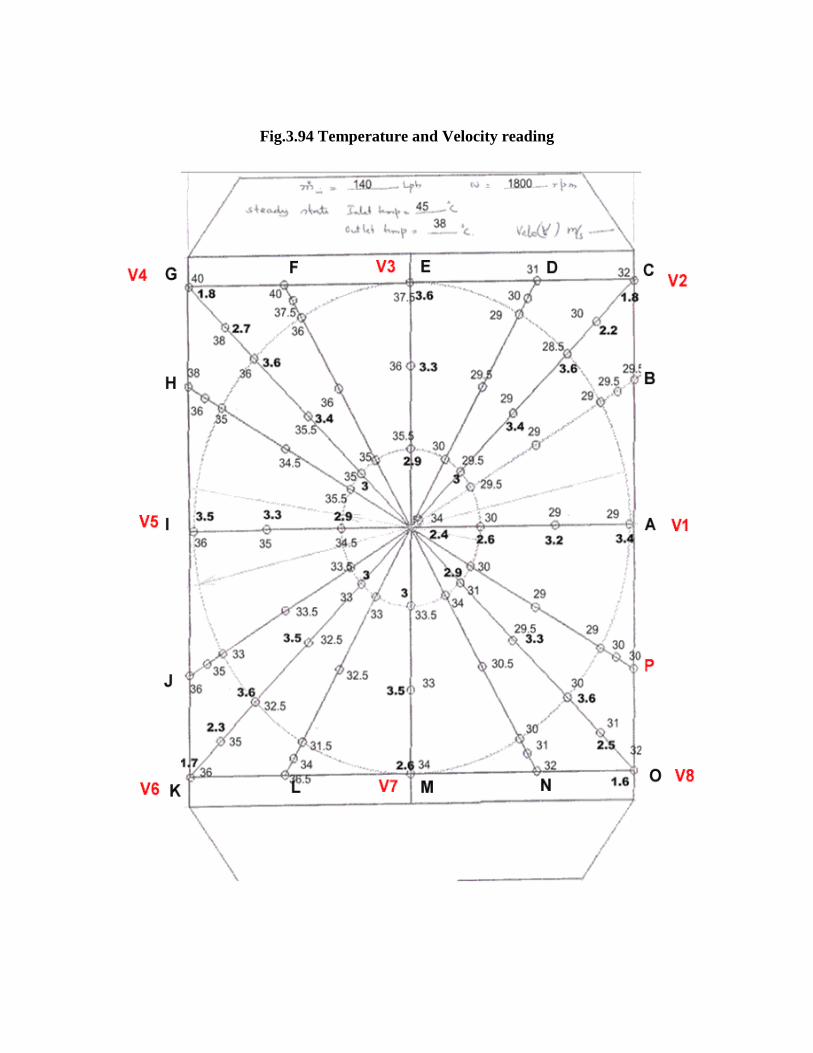
Fig.3.94 Temperature and Velocity reading
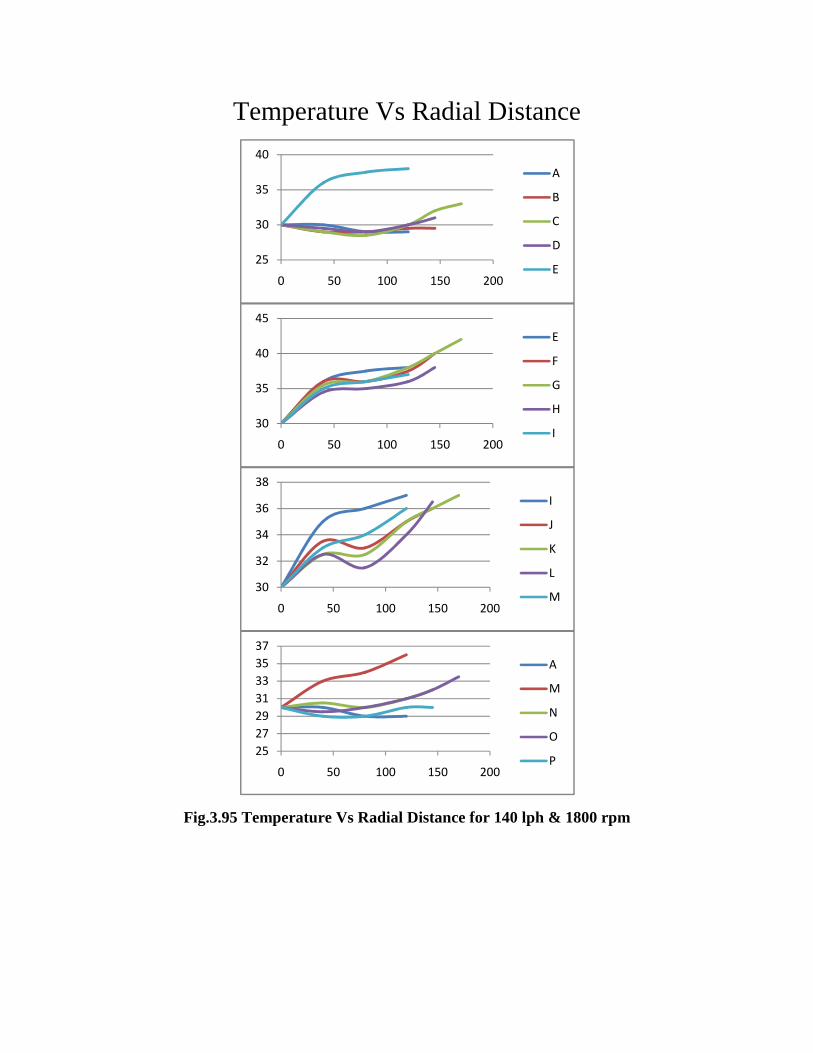
Temperature Vs Radial Distance
Fig.3.95 Temperature Vs Radial Distance for 140 lph & 1800 rpm
25
30
35
40
0 50 100 150 200
A
B
C
D
E
30
35
40
45
0 50 100 150 200
E
F
G
H
I
30
32
34
36
38
0 50 100 150 200
I
J
K
L
M
25
27
29
31
33
35
37
0 50 100 150 200
A
M
N
O
P
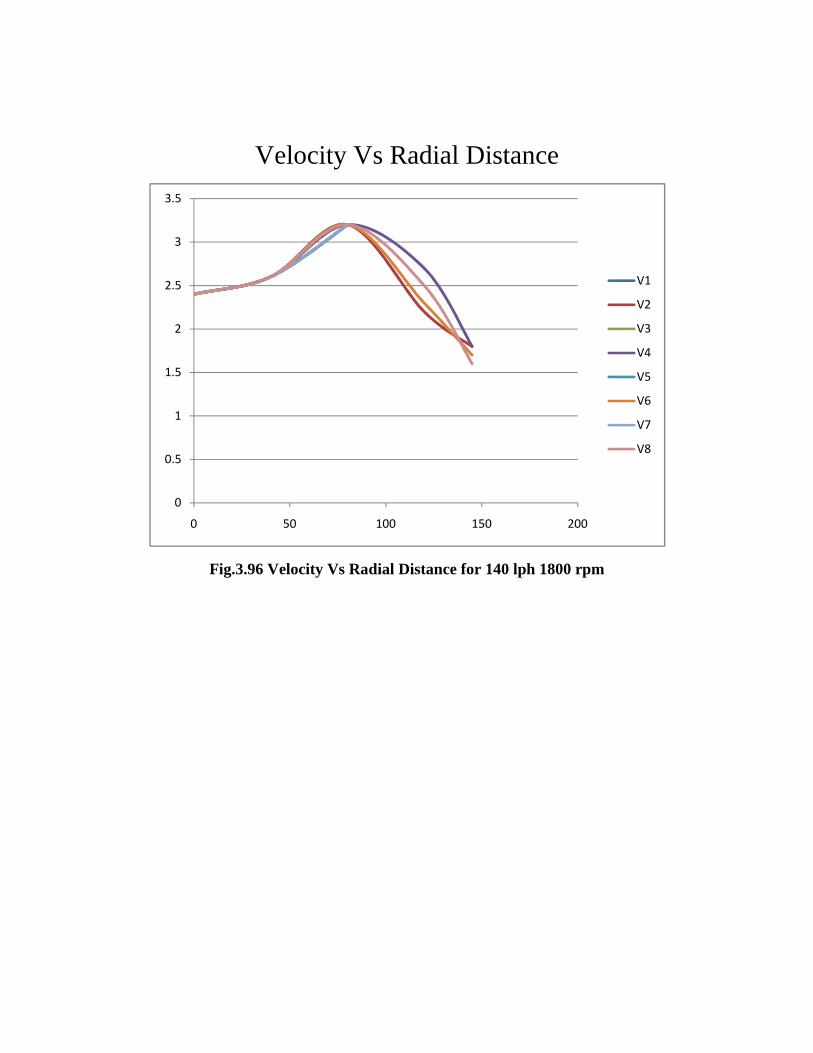
Velocity Vs Radial Distance
Fig.3.96 Velocity Vs Radial Distance for 140 lph 1800 rpm
0
0.5
1
1.5
2
2.5
3
3.5
0 50 100 150 200
V1
V2
V3
V4
V5
V6
V7
V8
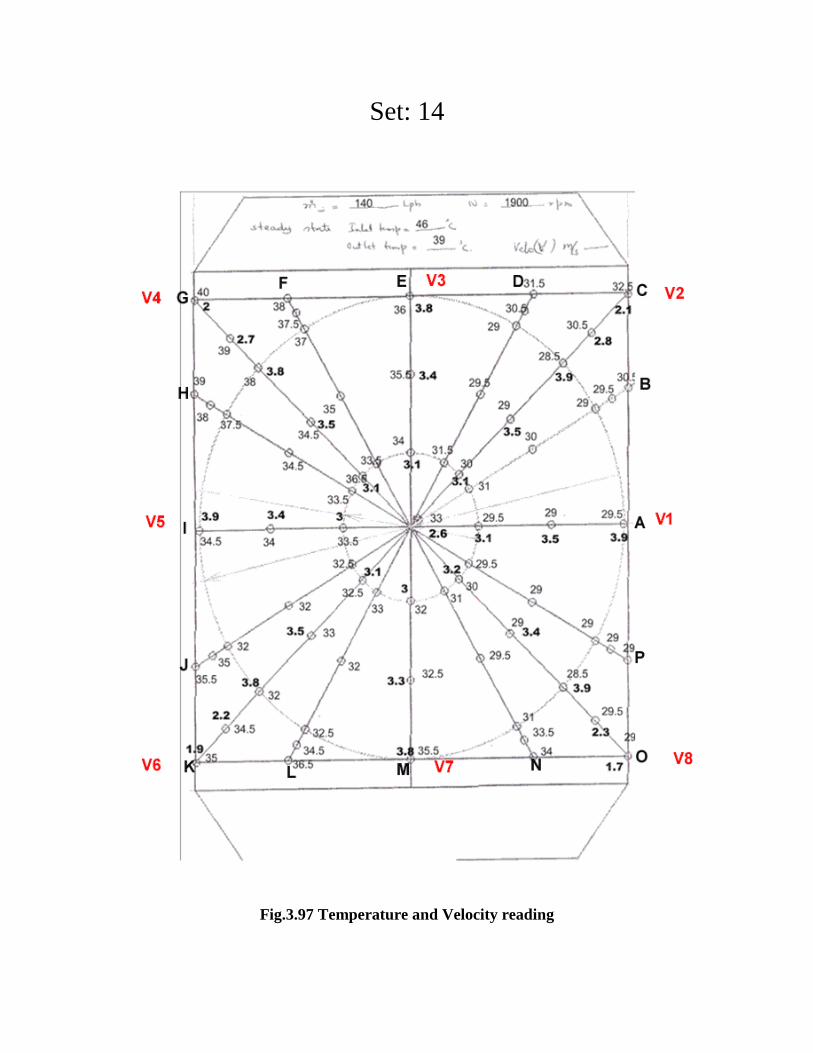
Set: 14
Fig.3.97 Temperature and Velocity reading
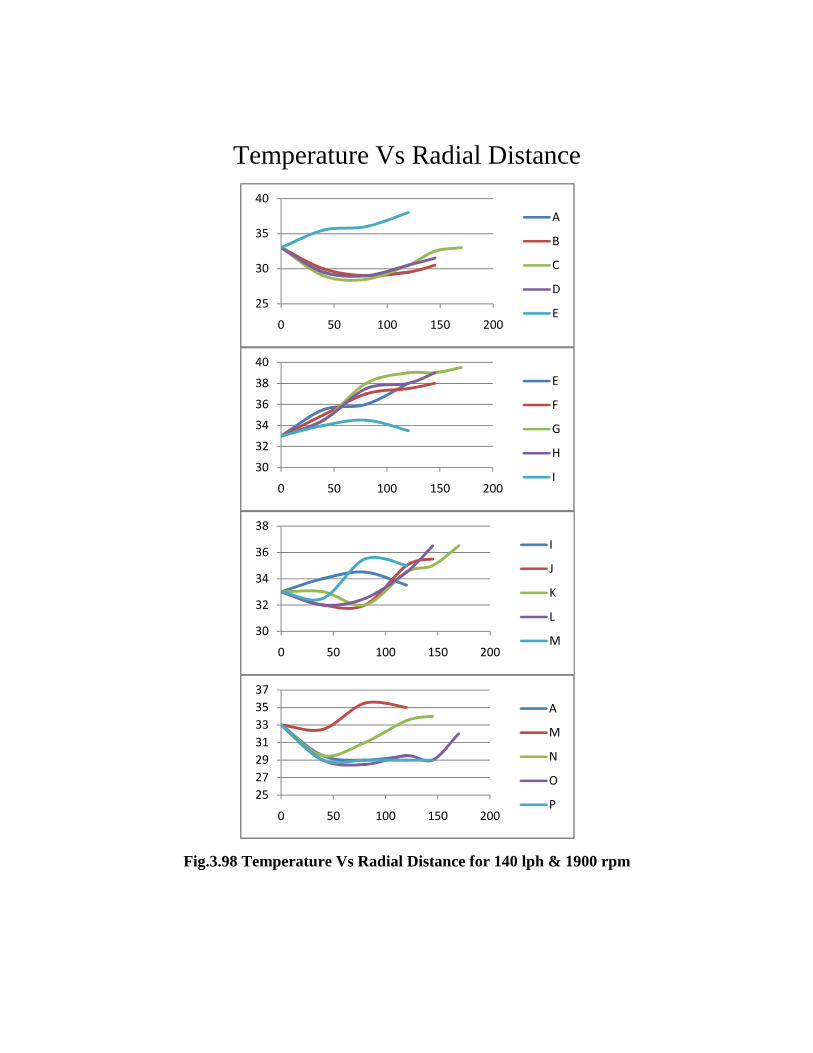
Temperature Vs Radial Distance
Fig.3.98 Temperature Vs Radial Distance for 140 lph & 1900 rpm
25
30
35
40
0 50 100 150 200
A
B
C
D
E
30
32
34
36
38
40
0 50 100 150 200
E
F
G
H
I
30
32
34
36
38
0 50 100 150 200
I
J
K
L
M
25
27
29
31
33
35
37
0 50 100 150 200
A
M
N
O
P
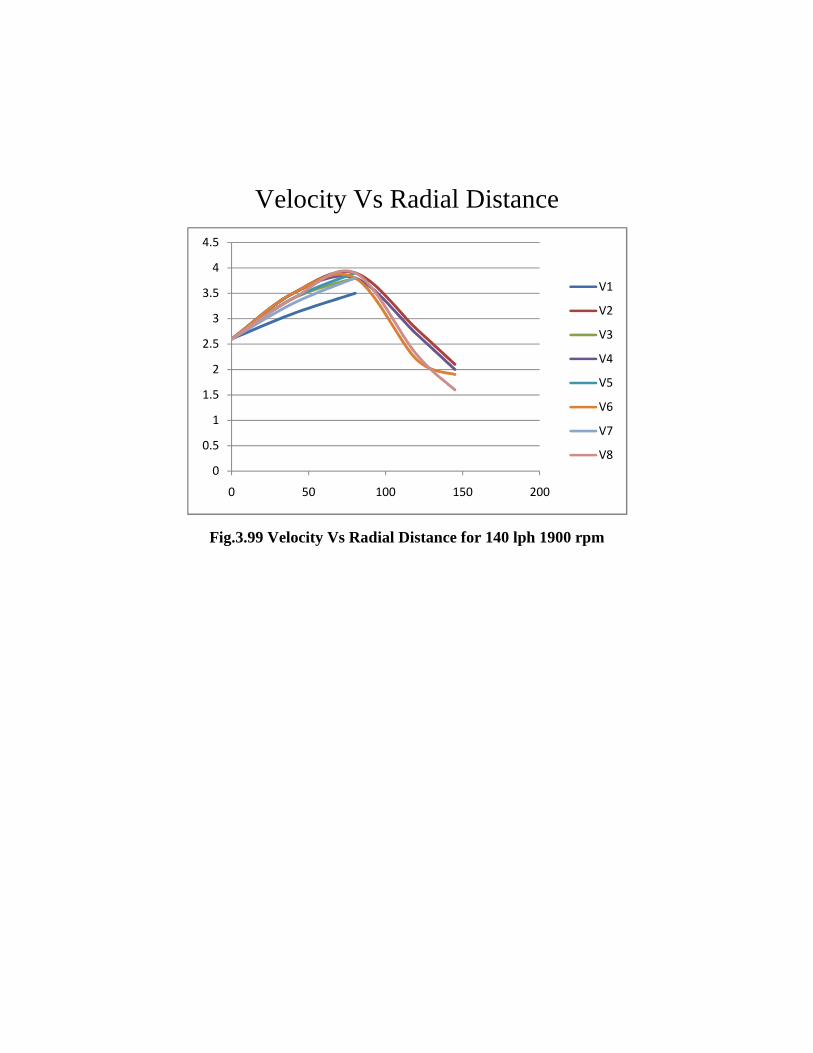
Velocity Vs Radial Distance
Fig.3.99 Velocity Vs Radial Distance for 140 lph 1900 rpm
0
0.5
1
1.5
2
2.5
3
3.5
4
4.5
0 50 100 150 200
V1
V2
V3
V4
V5
V6
V7
V8
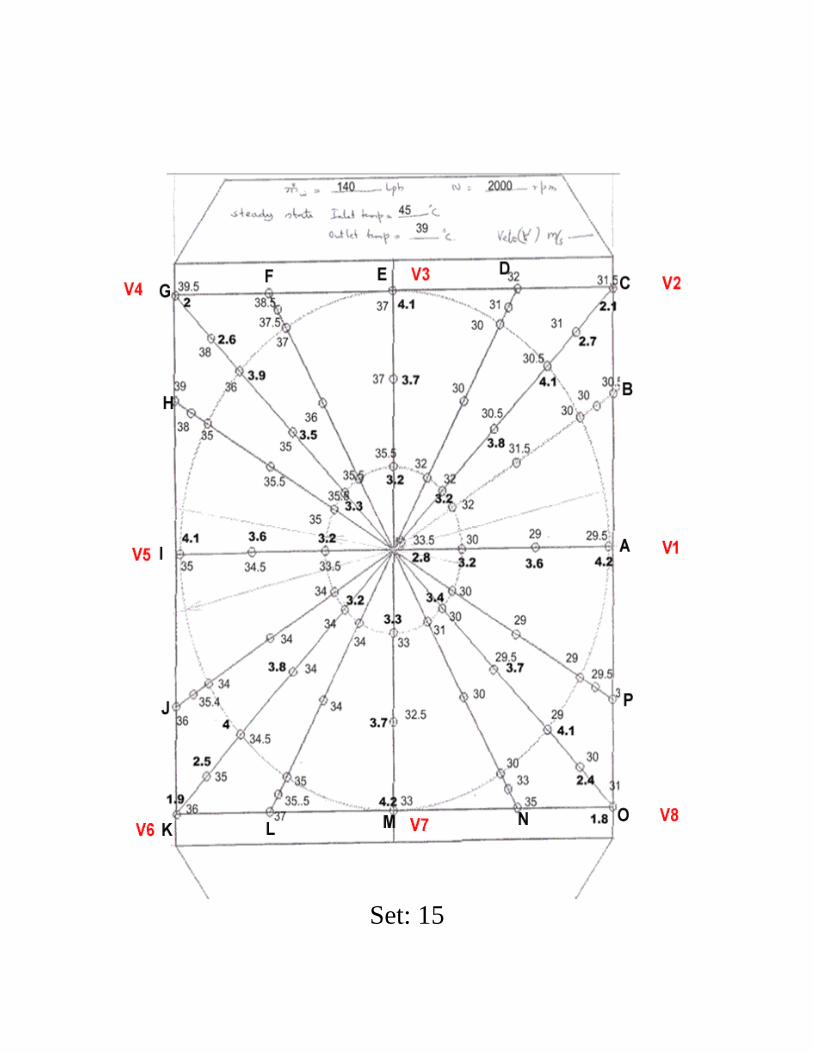
Set: 15
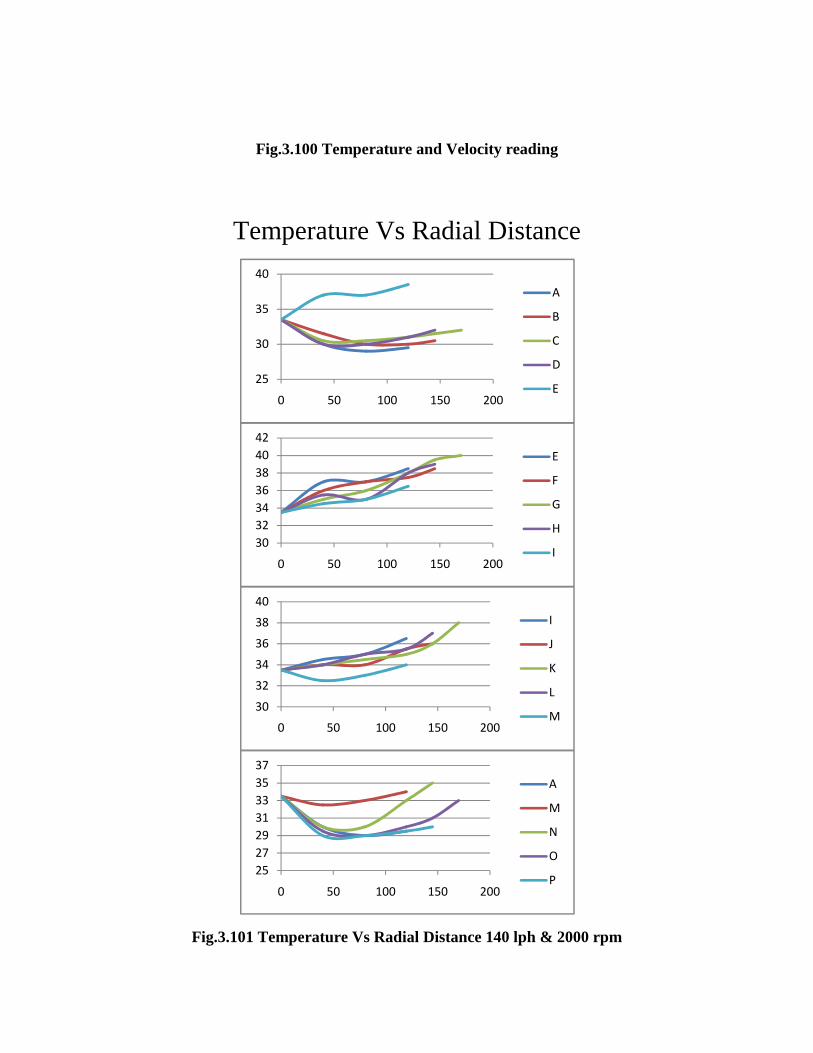
Fig.3.100 Temperature and Velocity reading
Temperature Vs Radial Distance
Fig.3.101 Temperature Vs Radial Distance 140 lph & 2000 rpm
25
30
35
40
0 50 100 150 200
A
B
C
D
E
30
32
34
36
38
40
42
0 50 100 150 200
E
F
G
H
I
30
32
34
36
38
40
0 50 100 150 200
I
J
K
L
M
25
27
29
31
33
35
37
0 50 100 150 200
A
M
N
O
P
Velocity Vs Radial Distance
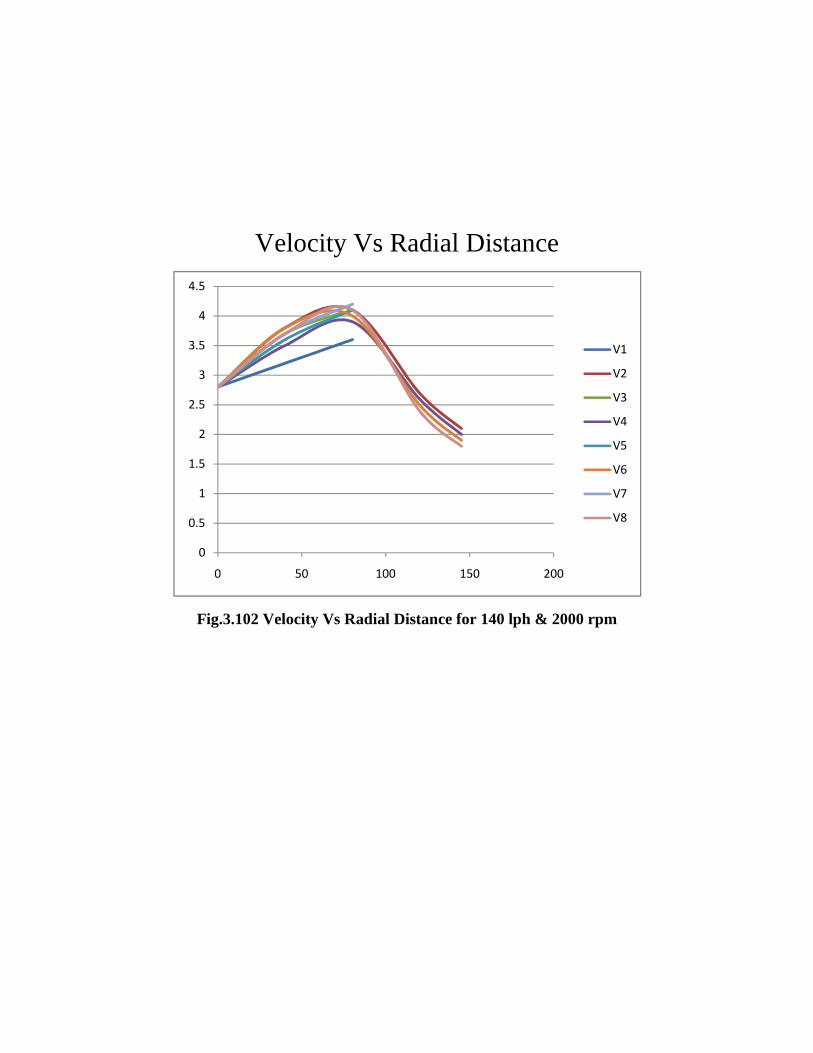
Fig.3.102 Velocity Vs Radial Distance for 140 lph & 2000 rpm
0
0.5
1
1.5
2
2.5
3
3.5
4
4.5
0 50 100 150 200
V1
V2
V3
V4
V5
V6
V7
V8
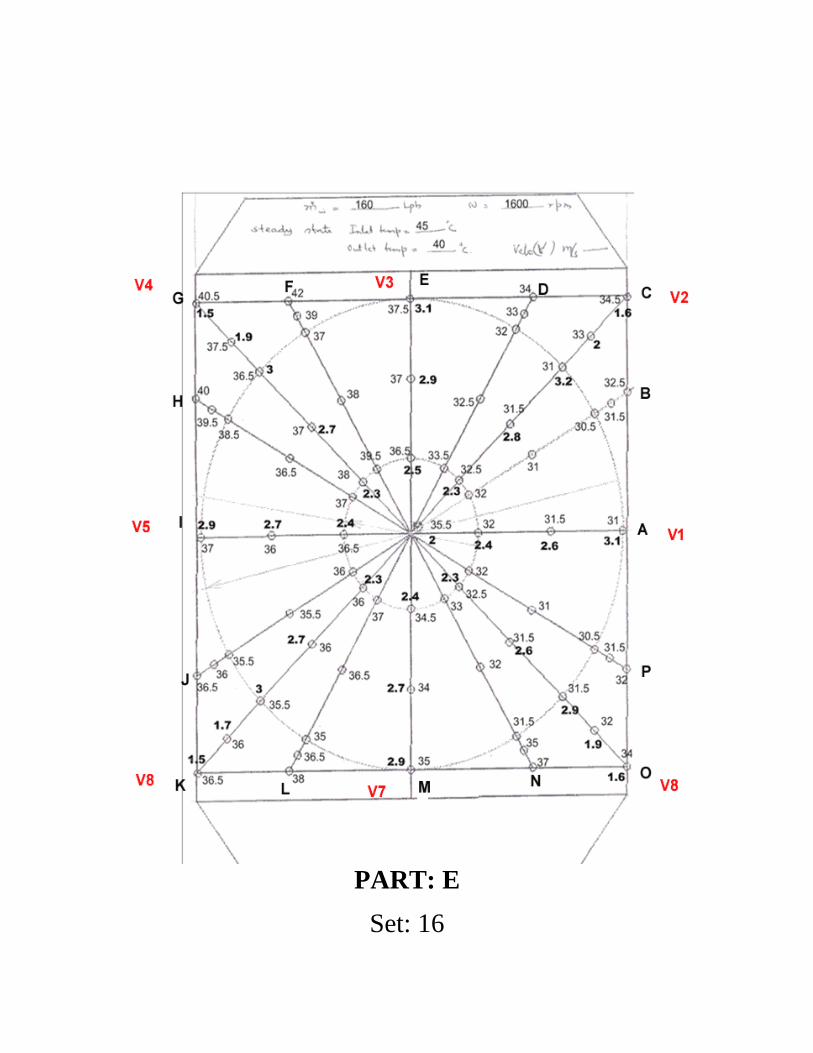
PART: E
Set: 16
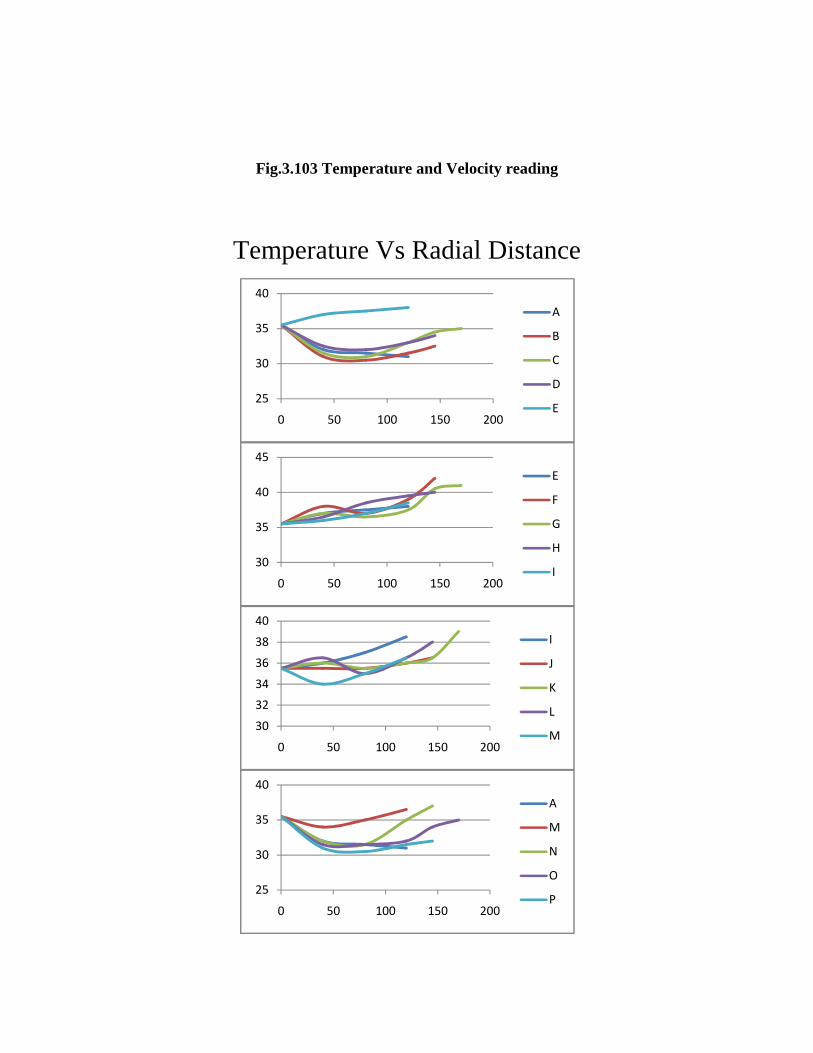
Fig.3.103 Temperature and Velocity reading
Temperature Vs Radial Distance
25
30
35
40
0 50 100 150 200
A
B
C
D
E
30
35
40
45
0 50 100 150 200
E
F
G
H
I
30
32
34
36
38
40
0 50 100 150 200
I
J
K
L
M
25
30
35
40
0 50 100 150 200
A
M
N
O
P
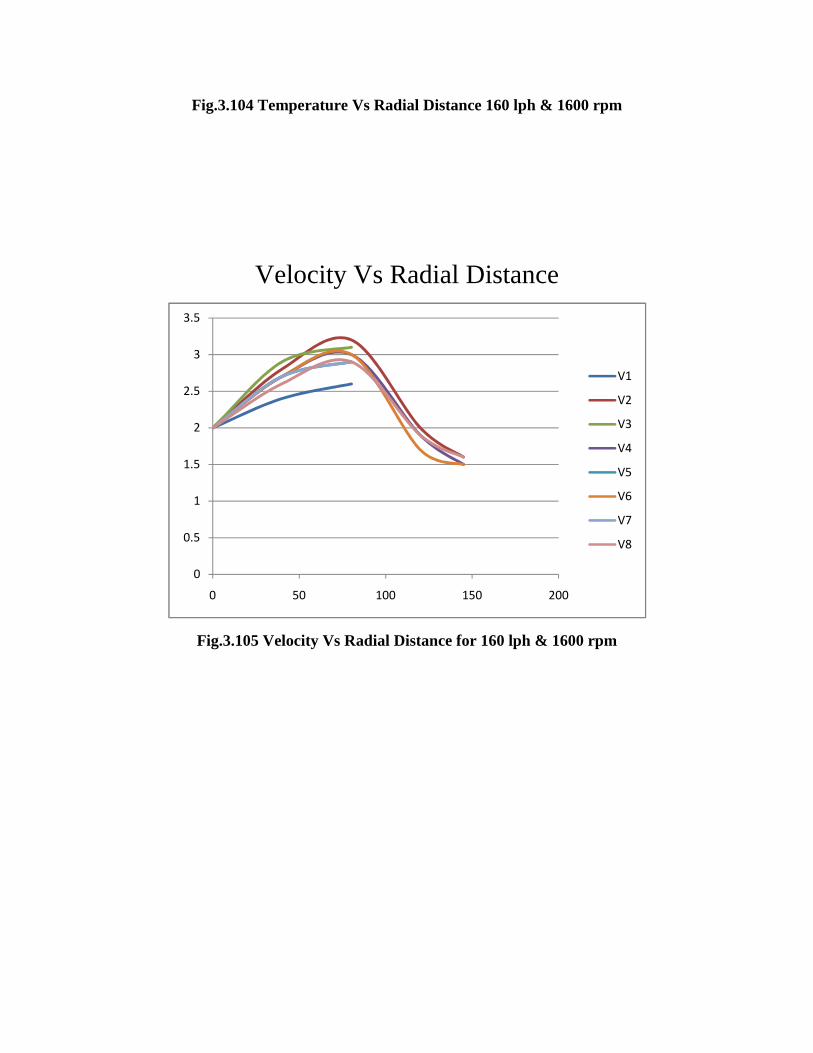
Fig.3.104 Temperature Vs Radial Distance 160 lph & 1600 rpm
Velocity Vs Radial Distance
Fig.3.105 Velocity Vs Radial Distance for 160 lph & 1600 rpm
0
0.5
1
1.5
2
2.5
3
3.5
0 50 100 150 200
V1
V2
V3
V4
V5
V6
V7
V8
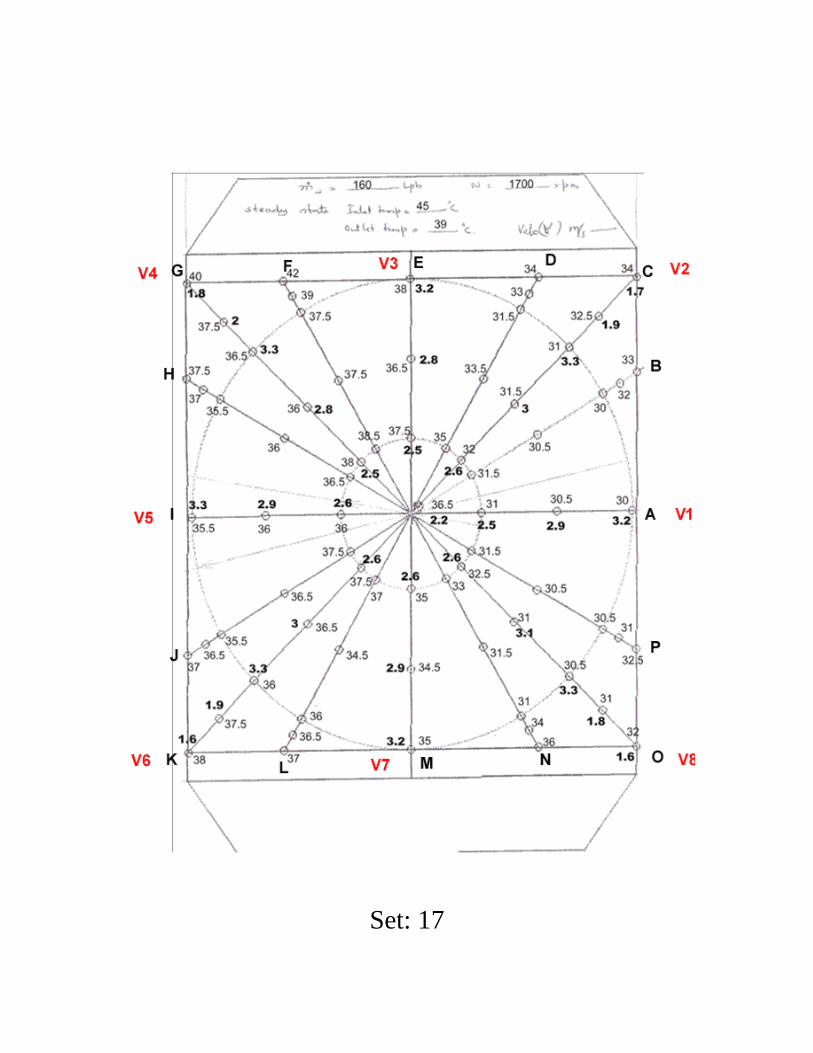
Set: 17
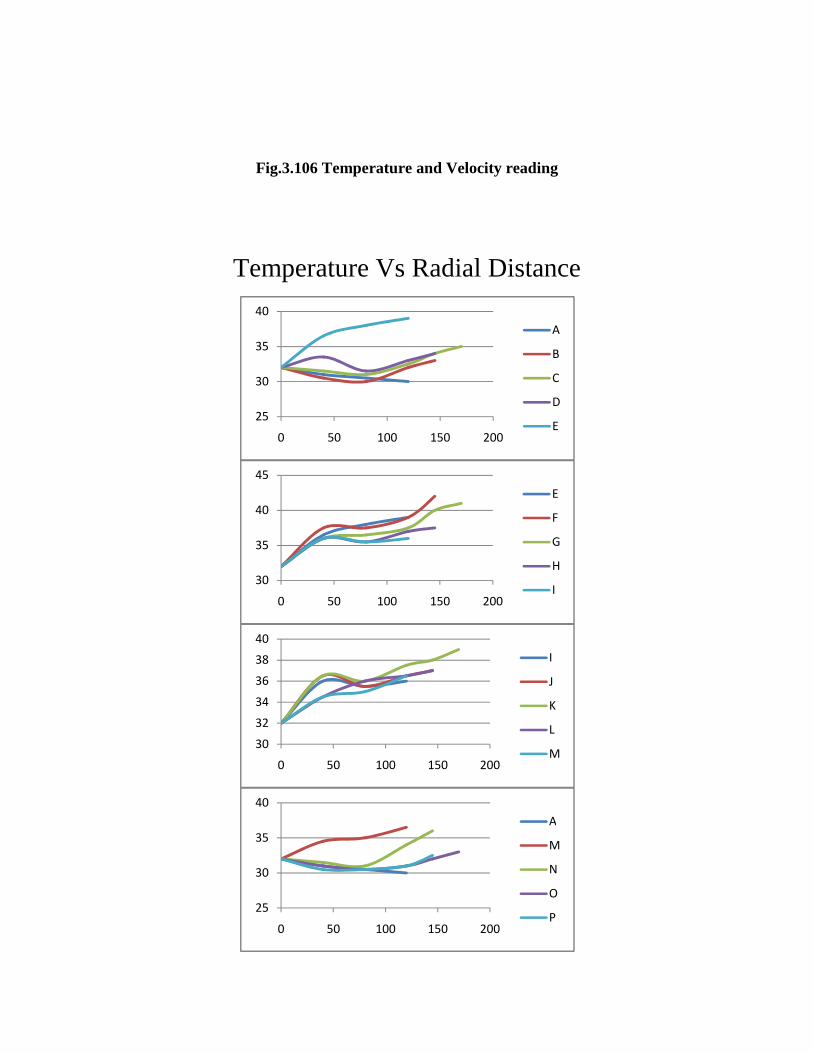
Fig.3.106 Temperature and Velocity reading
Temperature Vs Radial Distance
25
30
35
40
0 50 100 150 200
A
B
C
D
E
30
35
40
45
0 50 100 150 200
E
F
G
H
I
30
32
34
36
38
40
0 50 100 150 200
I
J
K
L
M
25
30
35
40
0 50 100 150 200
A
M
N
O
P
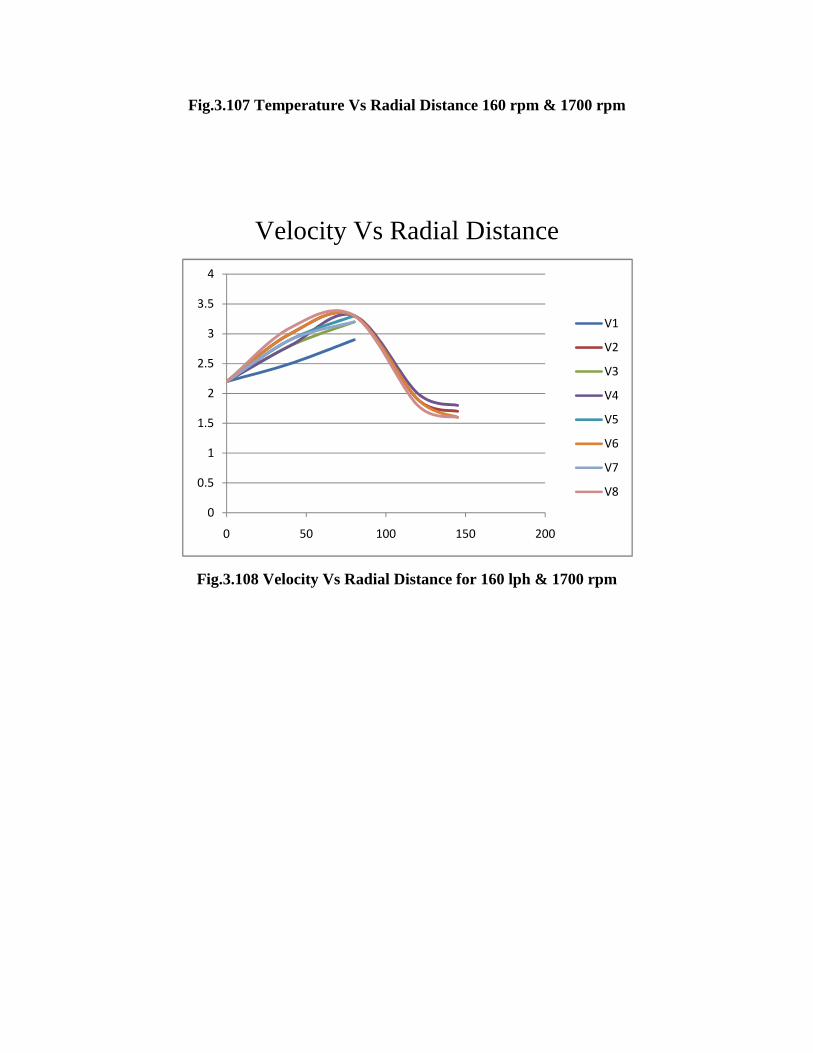
Fig.3.107 Temperature Vs Radial Distance 160 rpm & 1700 rpm
Velocity Vs Radial Distance
Fig.3.108 Velocity Vs Radial Distance for 160 lph & 1700 rpm
0
0.5
1
1.5
2
2.5
3
3.5
4
0 50 100 150 200
V1
V2
V3
V4
V5
V6
V7
V8
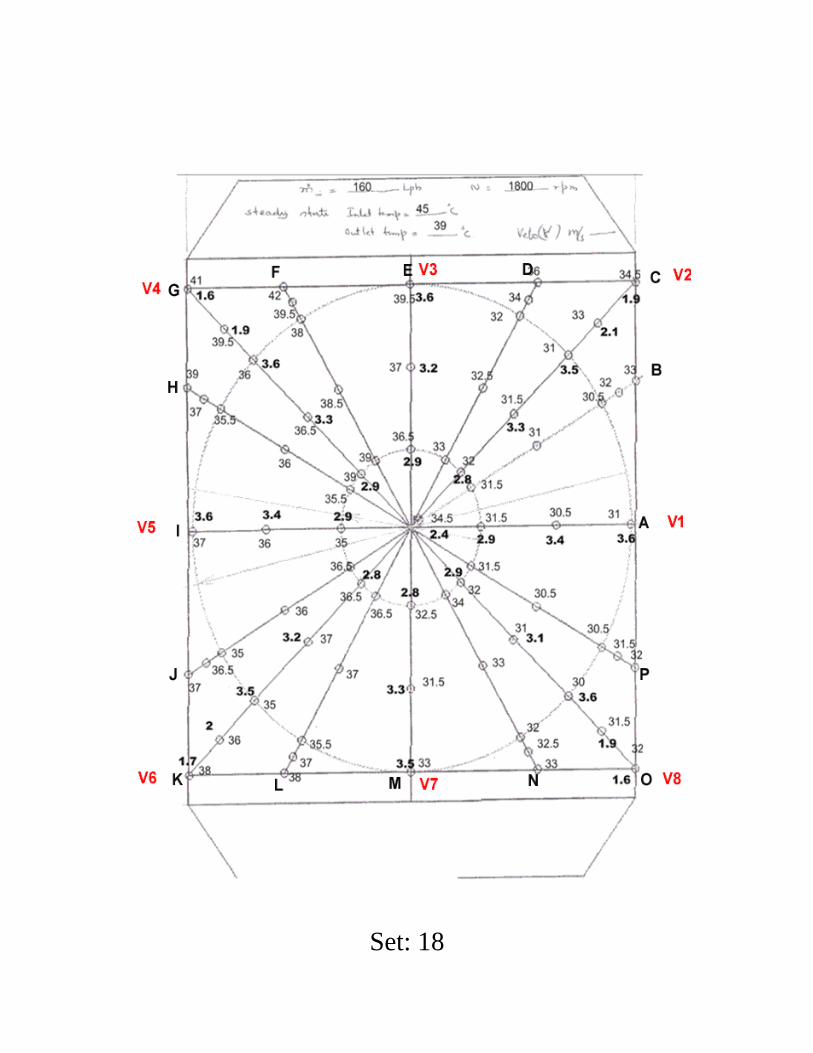
Set: 18
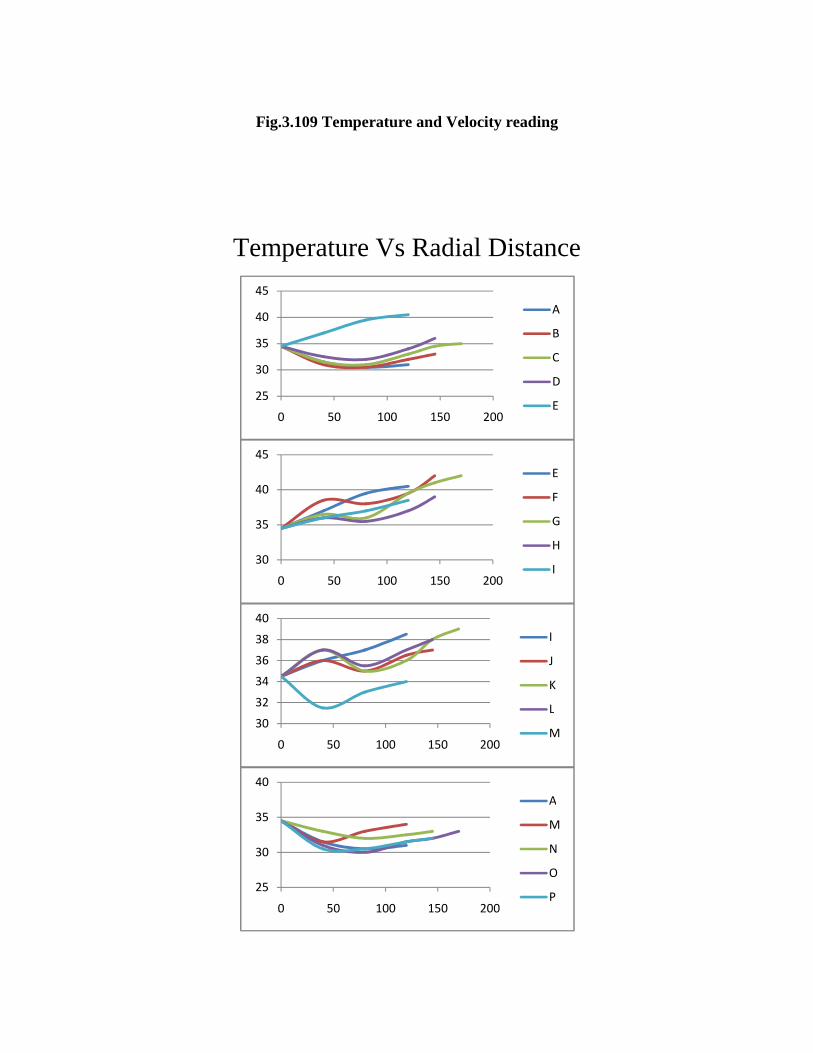
Fig.3.109 Temperature and Velocity reading
Temperature Vs Radial Distance
25
30
35
40
45
0 50 100 150 200
A
B
C
D
E
30
35
40
45
0 50 100 150 200
E
F
G
H
I
30
32
34
36
38
40
0 50 100 150 200
I
J
K
L
M
25
30
35
40
0 50 100 150 200
A
M
N
O
P
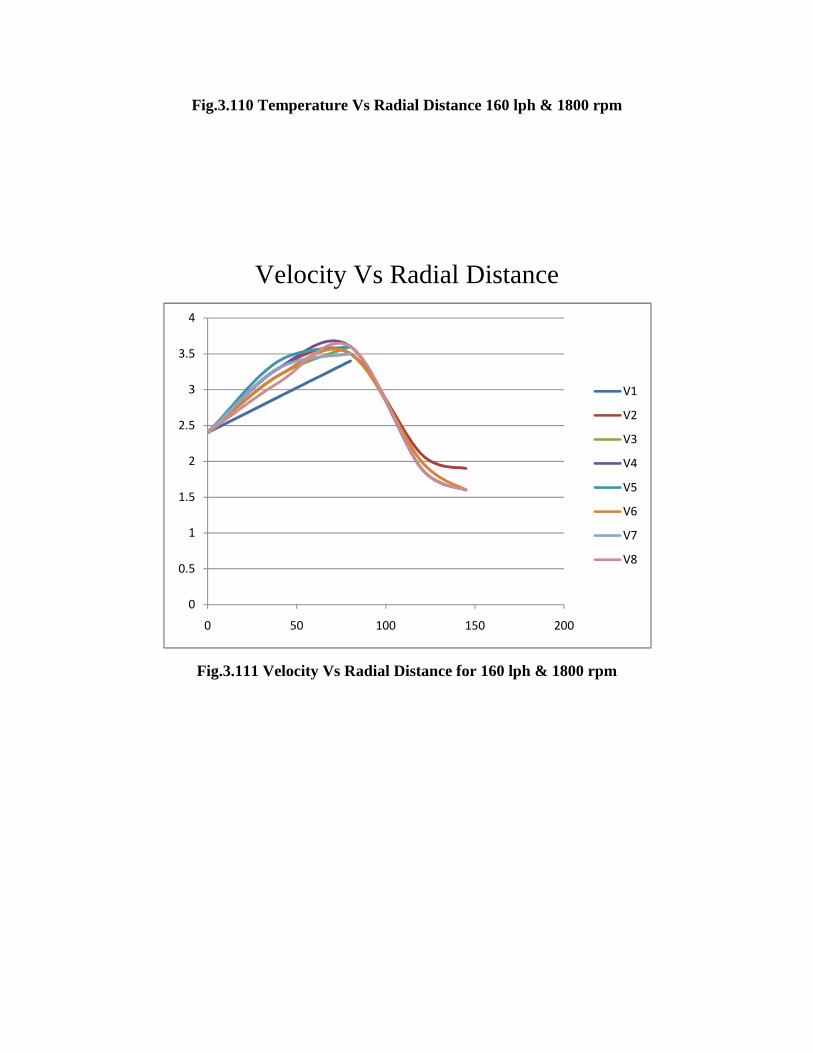
Fig.3.110 Temperature Vs Radial Distance 160 lph & 1800 rpm
Velocity Vs Radial Distance
Fig.3.111 Velocity Vs Radial Distance for 160 lph & 1800 rpm
0
0.5
1
1.5
2
2.5
3
3.5
4
0 50 100 150 200
V1
V2
V3
V4
V5
V6
V7
V8

Set: 19
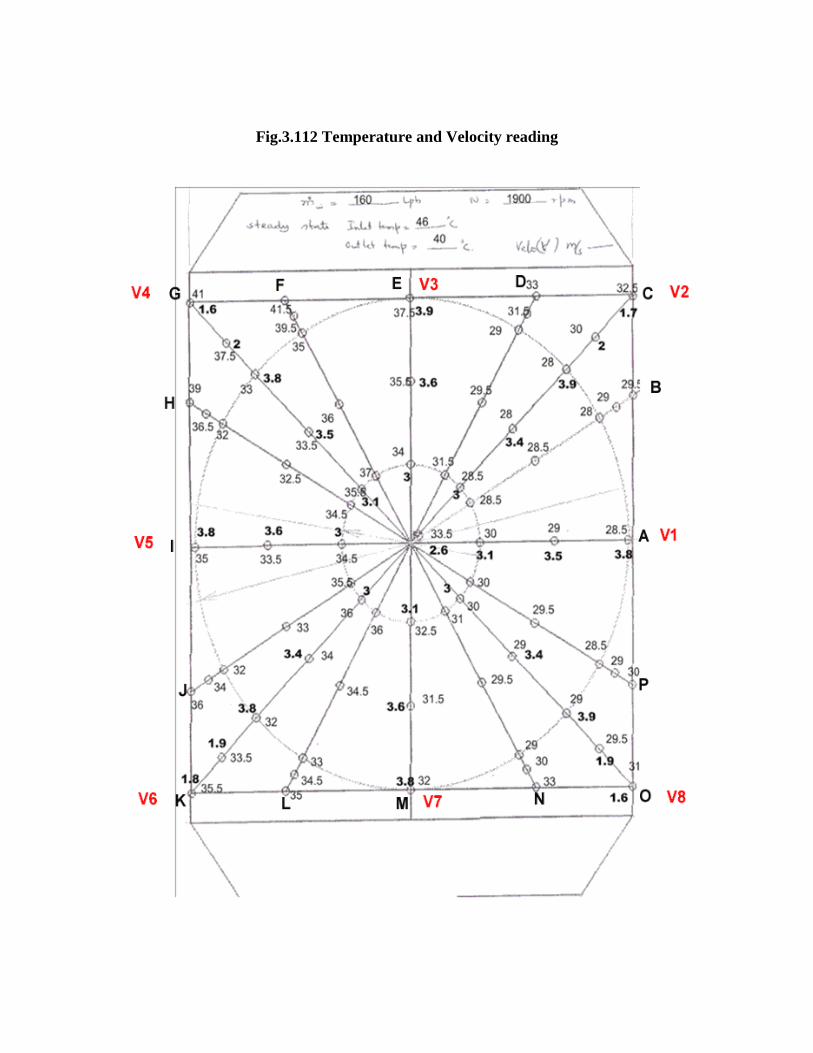
Fig.3.112 Temperature and Velocity reading
Temperature Vs Radial Distance
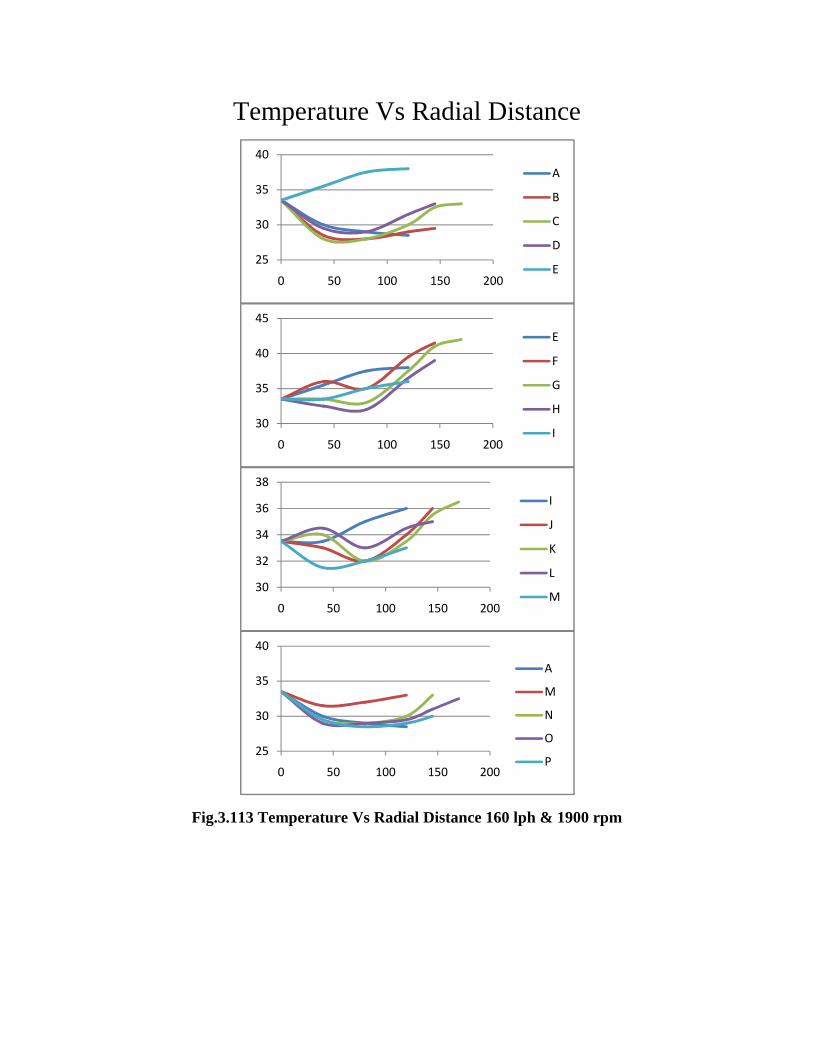
Fig.3.113 Temperature Vs Radial Distance 160 lph & 1900 rpm
25
30
35
40
0 50 100 150 200
A
B
C
D
E
30
35
40
45
0 50 100 150 200
E
F
G
H
I
30
32
34
36
38
0 50 100 150 200
I
J
K
L
M
25
30
35
40
0 50 100 150 200
A
M
N
O
P
Velocity Vs Radial Distance
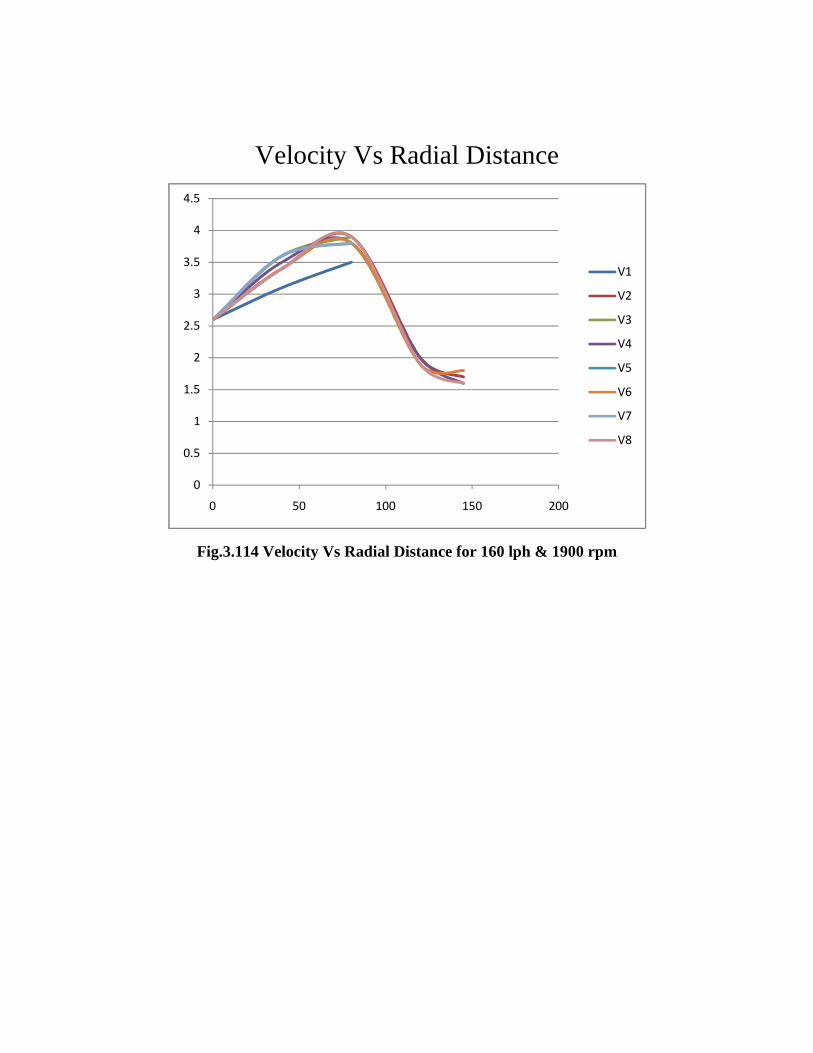
Fig.3.114 Velocity Vs Radial Distance for 160 lph & 1900 rpm
0
0.5
1
1.5
2
2.5
3
3.5
4
4.5
0 50 100 150 200
V1
V2
V3
V4
V5
V6
V7
V8
Set: 20
Fig.3.115 Temperature and Velocity reading
Temperature Vs Radial Distance
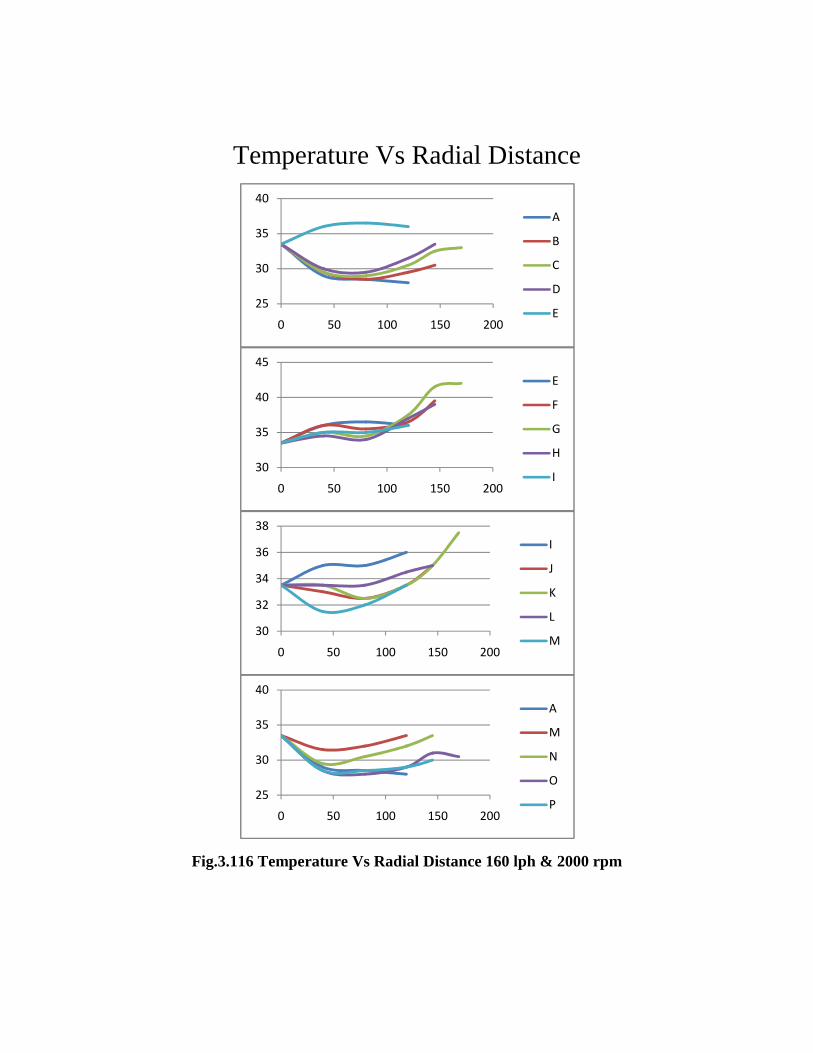
Fig.3.116 Temperature Vs Radial Distance 160 lph & 2000 rpm
25
30
35
40
0 50 100 150 200
A
B
C
D
E
30
35
40
45
0 50 100 150 200
E
F
G
H
I
30
32
34
36
38
0 50 100 150 200
I
J
K
L
M
25
30
35
40
0 50 100 150 200
A
M
N
O
P
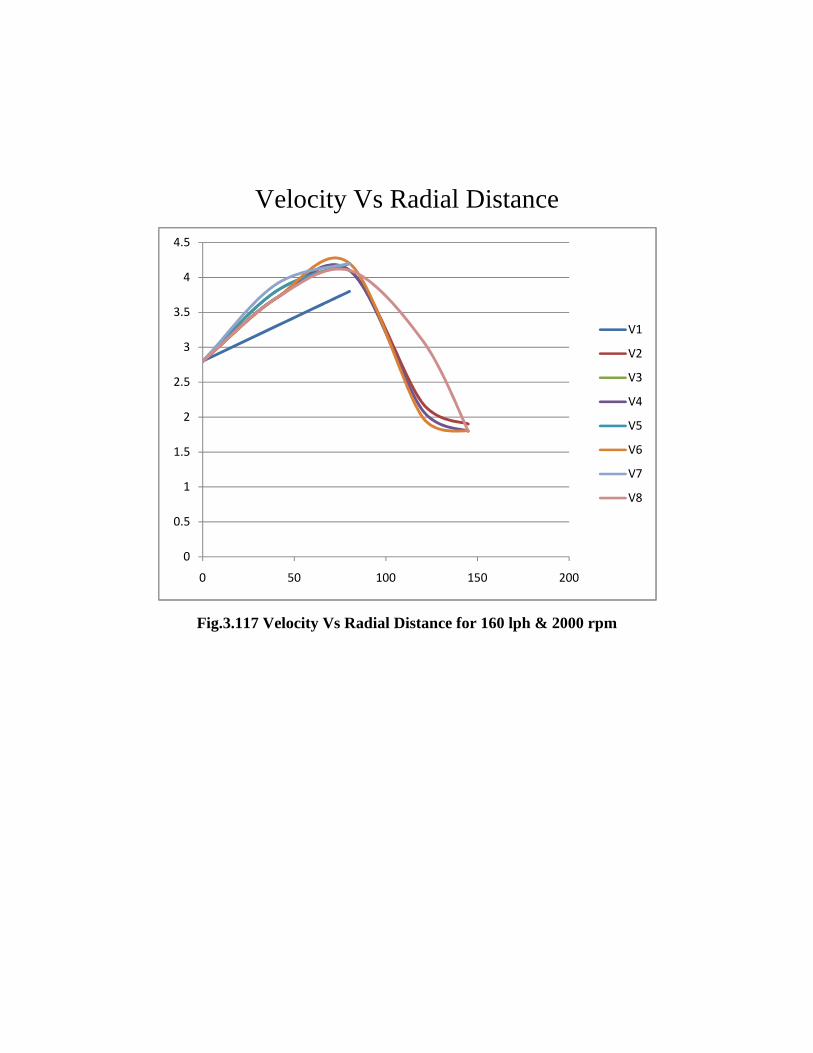
Velocity Vs Radial Distance
Fig.3.117 Velocity Vs Radial Distance for 160 lph & 2000 rpm
0
0.5
1
1.5
2
2.5
3
3.5
4
4.5
0 50 100 150 200
V1
V2
V3
V4
V5
V6
V7
V8
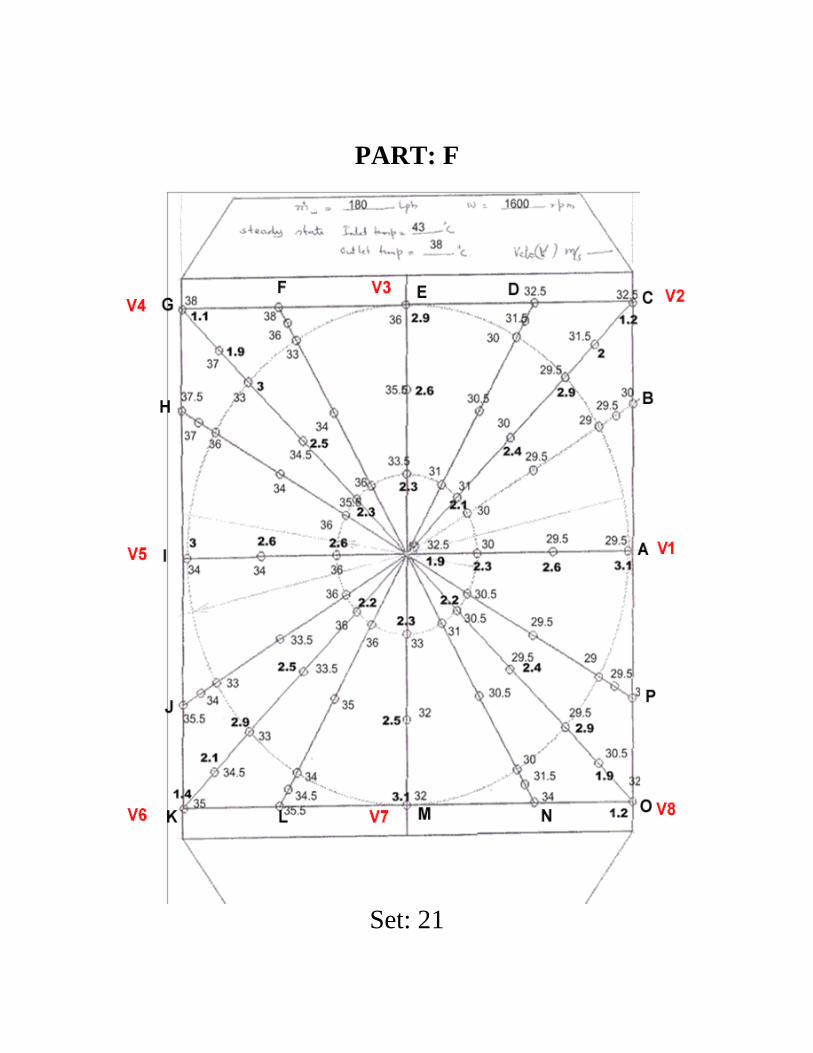
PART: F
Set: 21
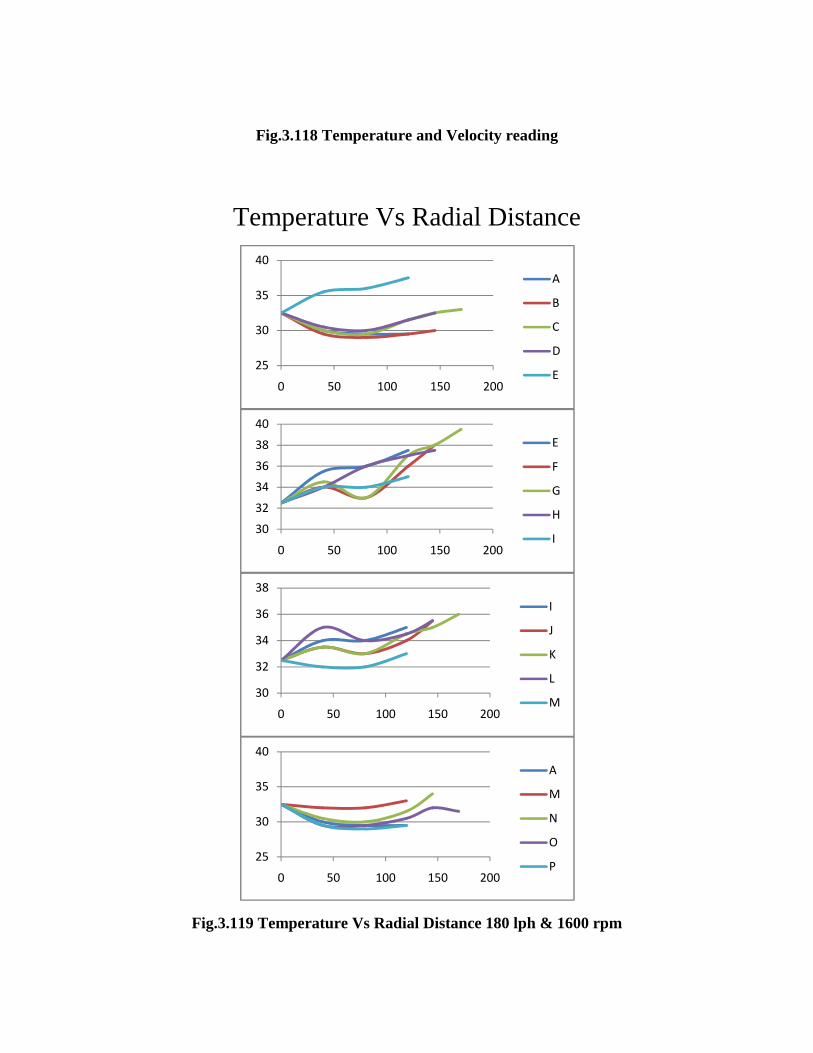
Fig.3.118 Temperature and Velocity reading
Temperature Vs Radial Distance
Fig.3.119 Temperature Vs Radial Distance 180 lph & 1600 rpm
25
30
35
40
0 50 100 150 200
A
B
C
D
E
30
32
34
36
38
40
0 50 100 150 200
E
F
G
H
I
30
32
34
36
38
0 50 100 150 200
I
J
K
L
M
25
30
35
40
0 50 100 150 200
A
M
N
O
P
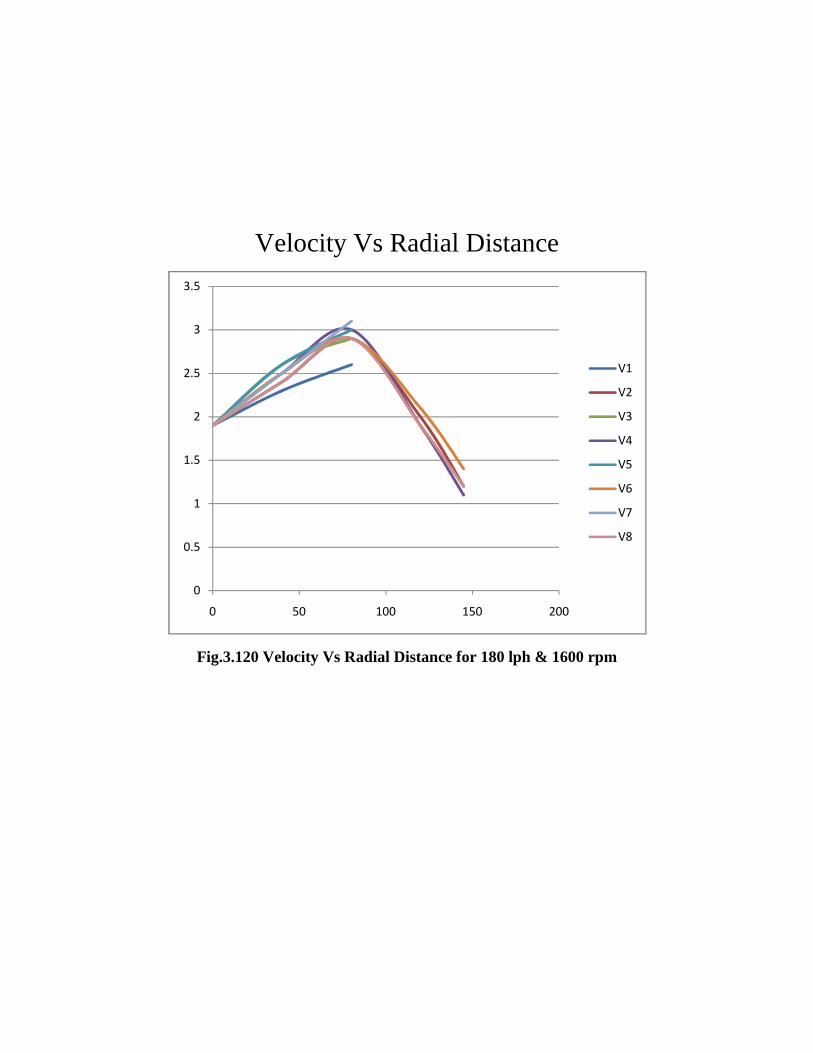
Velocity Vs Radial Distance
Fig.3.120 Velocity Vs Radial Distance for 180 lph & 1600 rpm
0
0.5
1
1.5
2
2.5
3
3.5
0 50 100 150 200
V1
V2
V3
V4
V5
V6
V7
V8

Set: 22
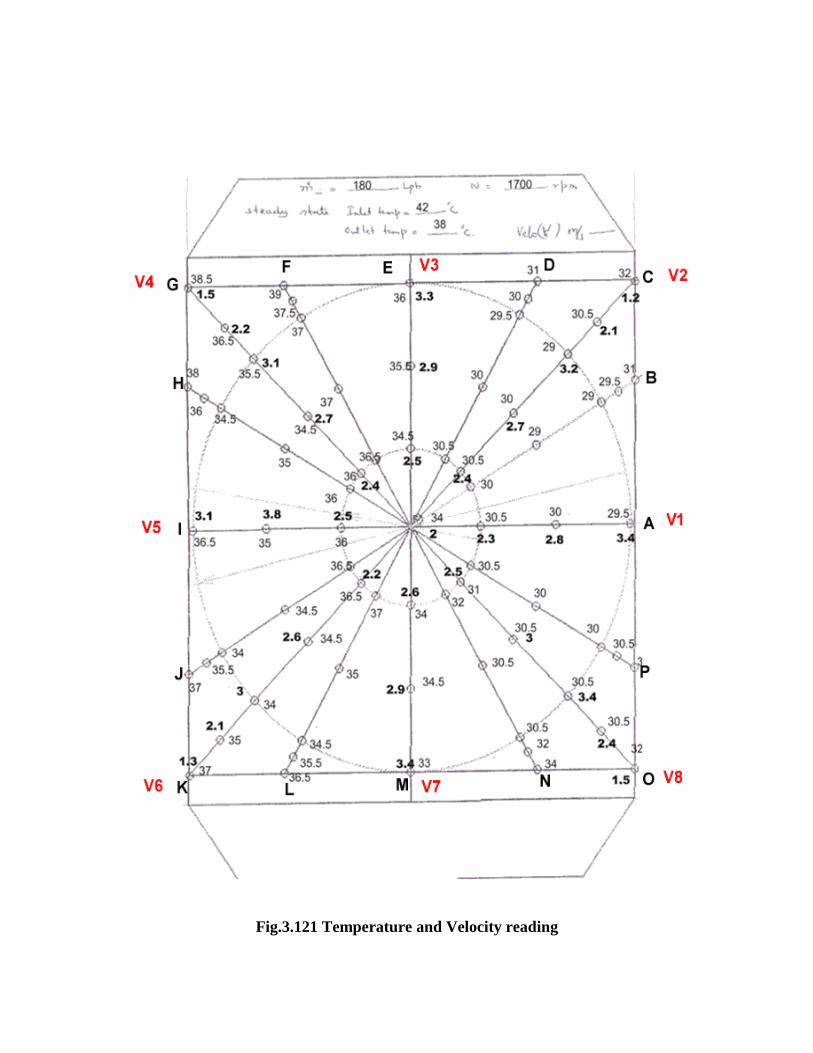
Fig.3.121 Temperature and Velocity reading
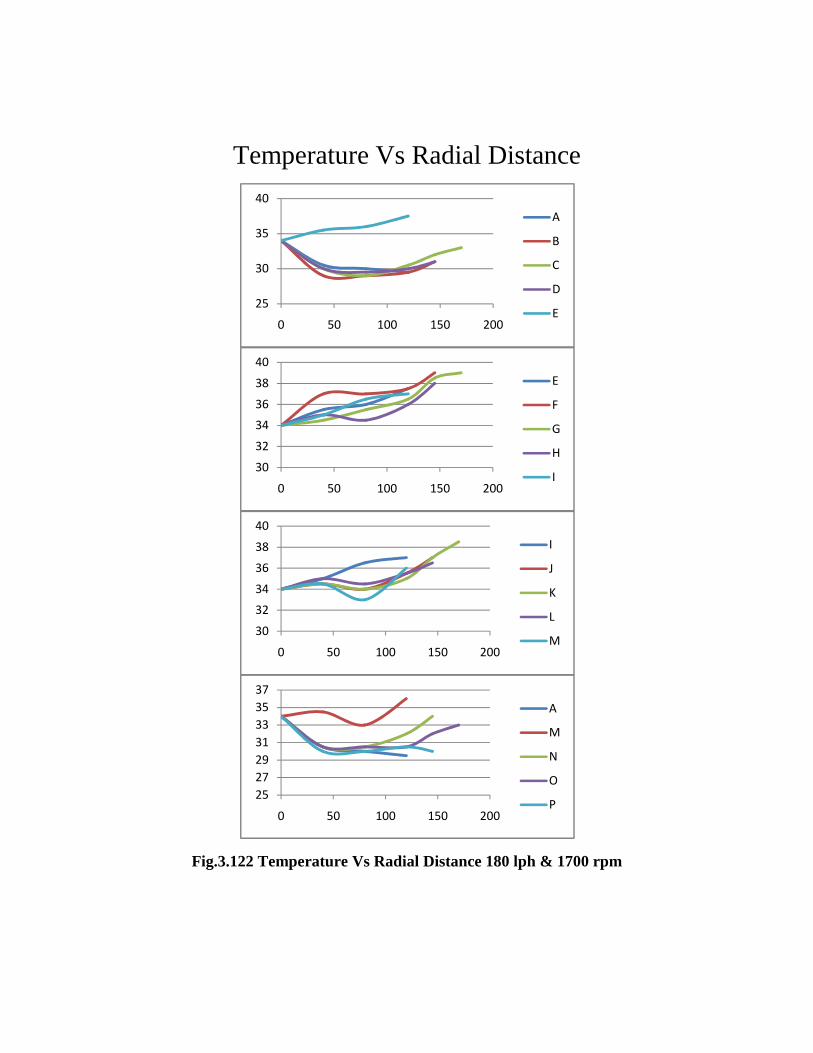
Temperature Vs Radial Distance
Fig.3.122 Temperature Vs Radial Distance 180 lph & 1700 rpm
25
30
35
40
0 50 100 150 200
A
B
C
D
E
30
32
34
36
38
40
0 50 100 150 200
E
F
G
H
I
30
32
34
36
38
40
0 50 100 150 200
I
J
K
L
M
25
27
29
31
33
35
37
0 50 100 150 200
A
M
N
O
P
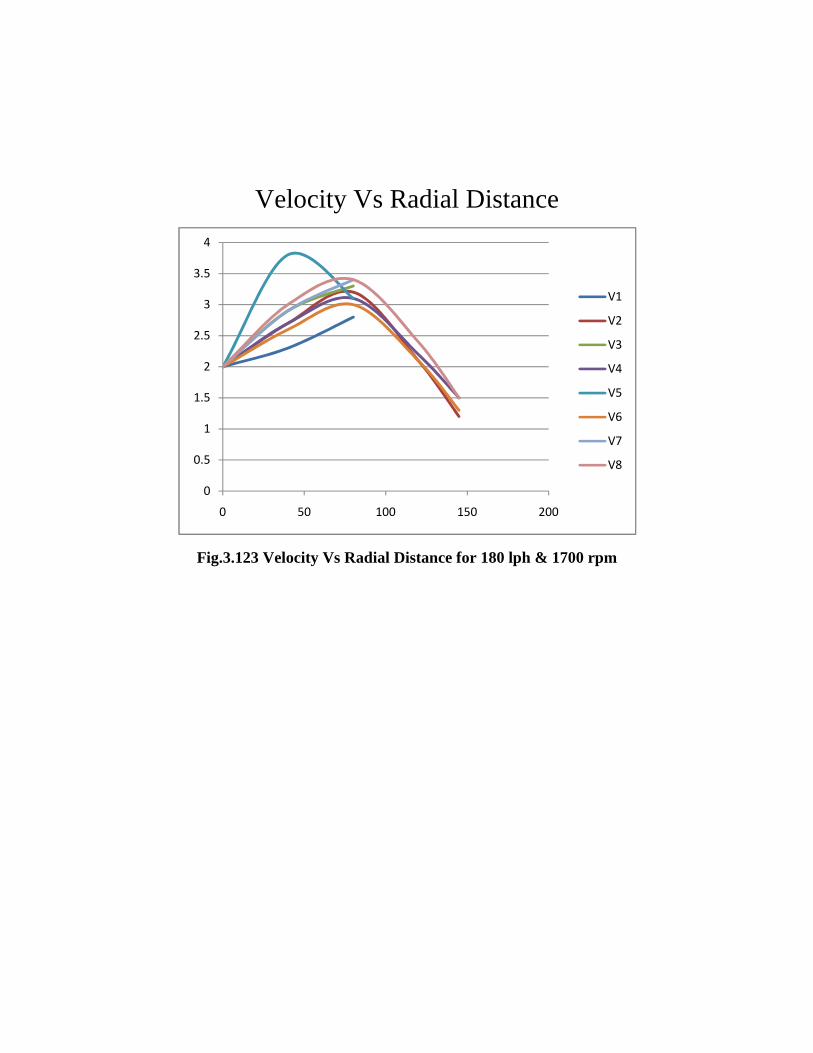
Velocity Vs Radial Distance
Fig.3.123 Velocity Vs Radial Distance for 180 lph & 1700 rpm
0
0.5
1
1.5
2
2.5
3
3.5
4
0 50 100 150 200
V1
V2
V3
V4
V5
V6
V7
V8

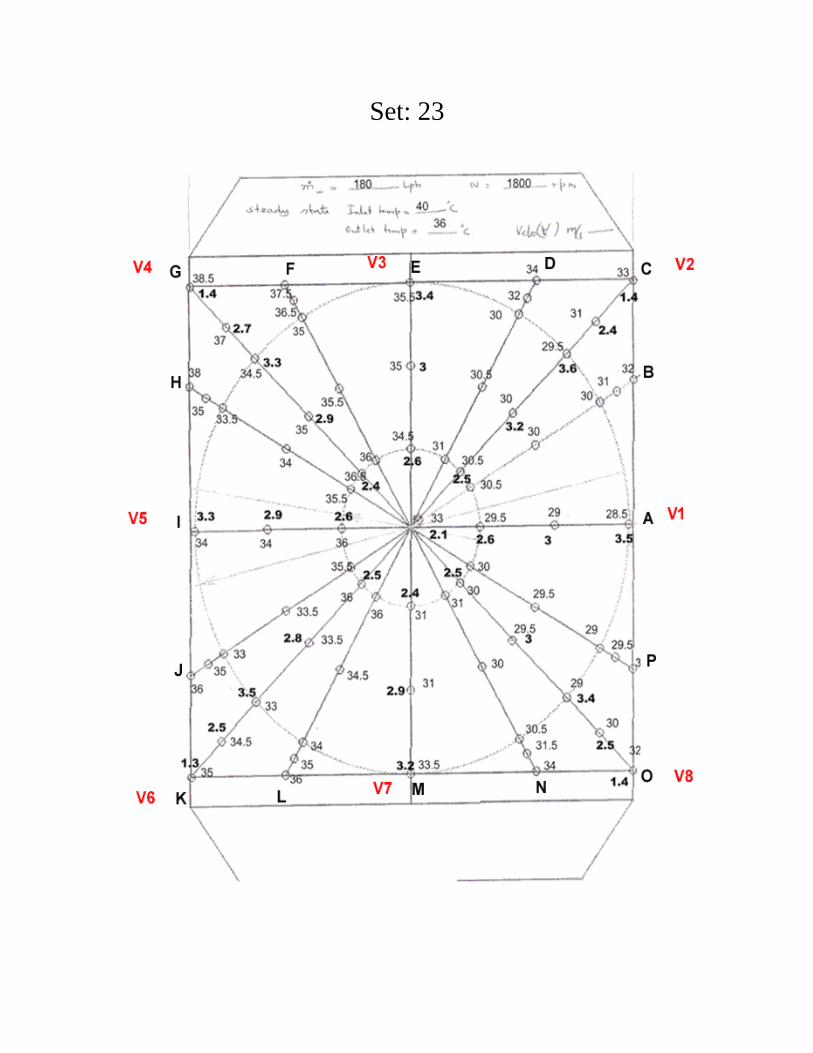
Set: 23
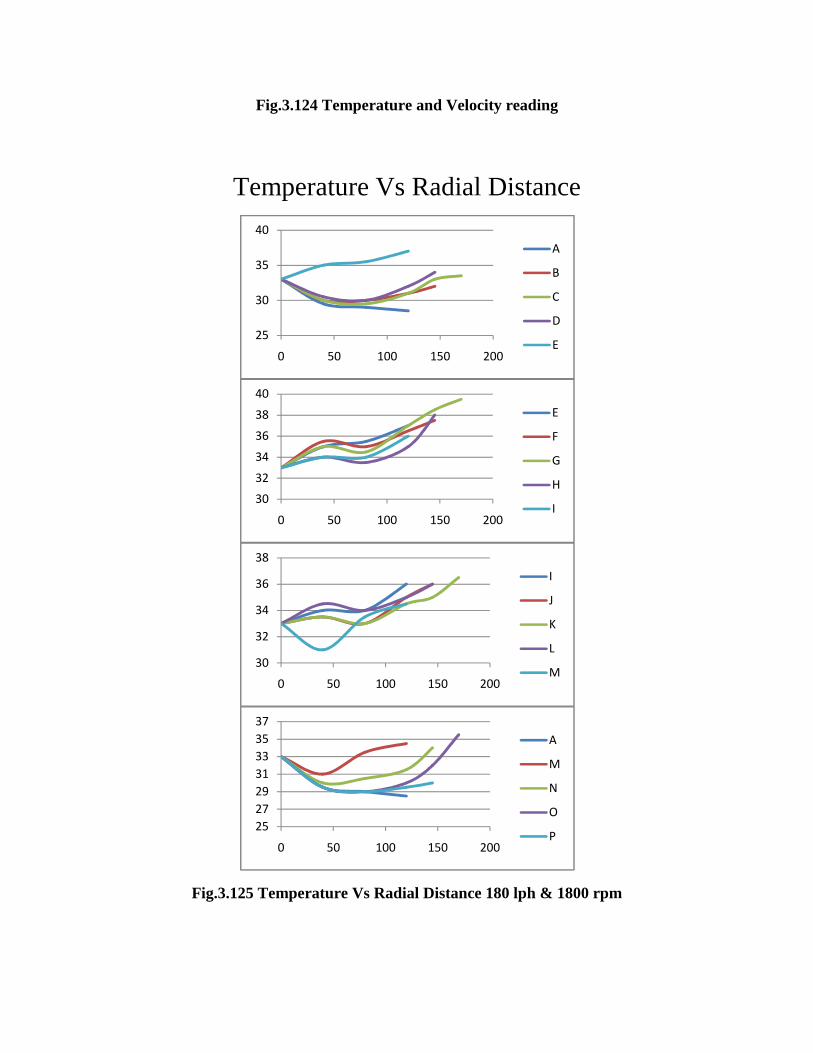
Fig.3.124 Temperature and Velocity reading
Temperature Vs Radial Distance
Fig.3.125 Temperature Vs Radial Distance 180 lph & 1800 rpm
25
30
35
40
0 50 100 150 200
A
B
C
D
E
30
32
34
36
38
40
0 50 100 150 200
E
F
G
H
I
30
32
34
36
38
0 50 100 150 200
I
J
K
L
M
25
27
29
31
33
35
37
0 50 100 150 200
A
M
N
O
P
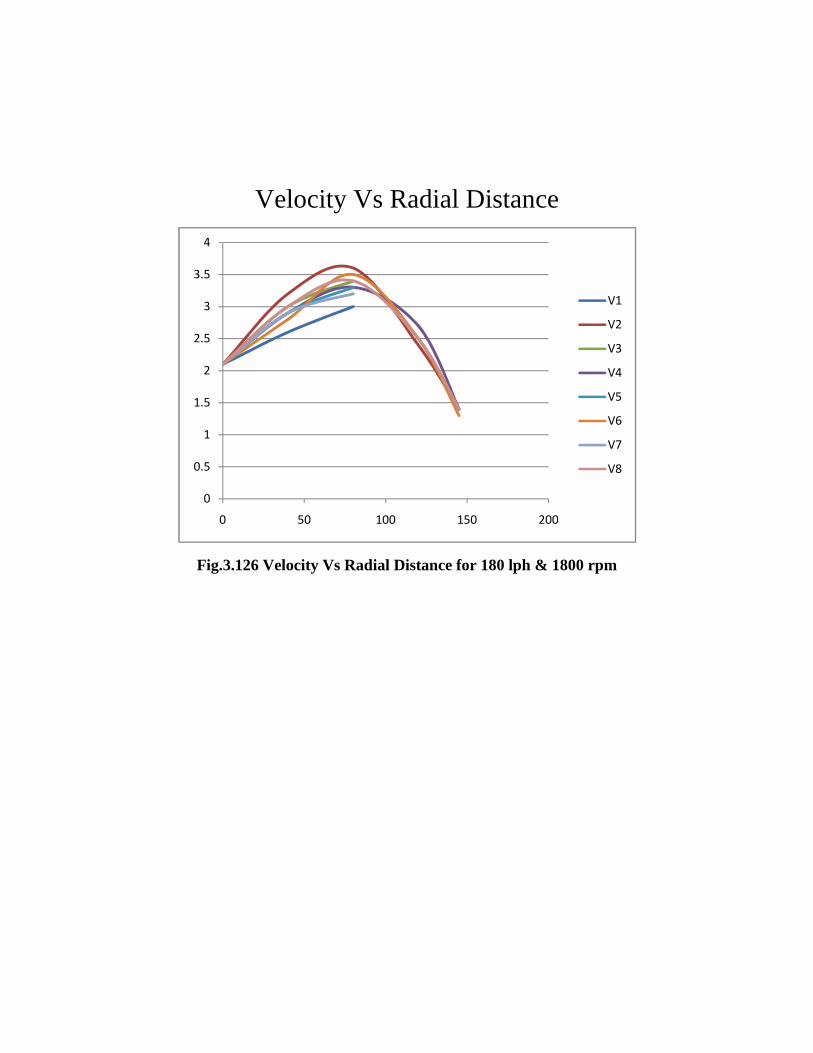
Velocity Vs Radial Distance
Fig.3.126 Velocity Vs Radial Distance for 180 lph & 1800 rpm
0
0.5
1
1.5
2
2.5
3
3.5
4
0 50 100 150 200
V1
V2
V3
V4
V5
V6
V7
V8
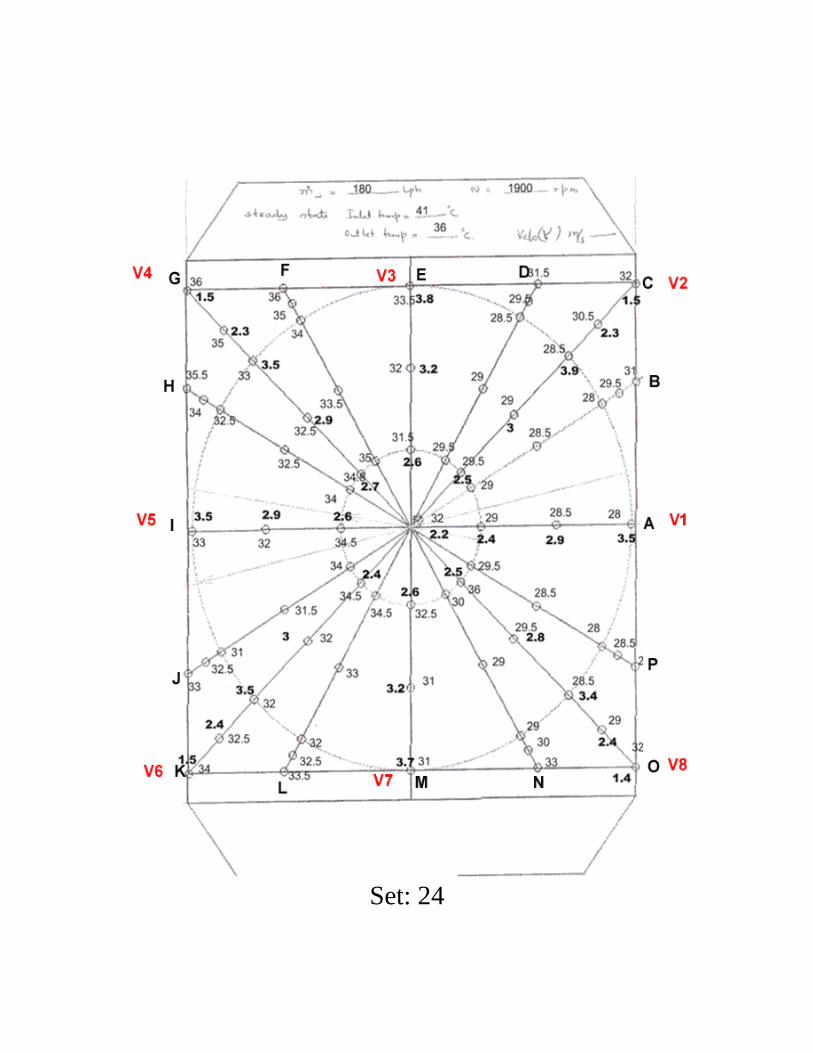
Set: 24
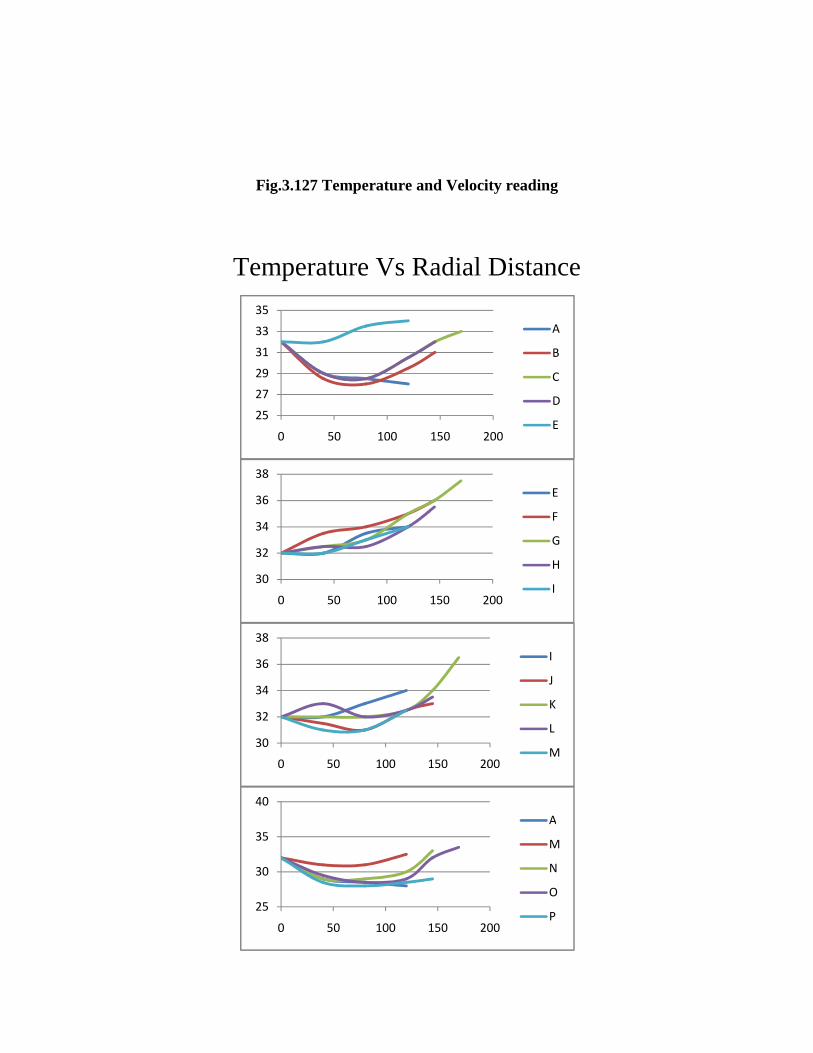
Fig.3.127 Temperature and Velocity reading
Temperature Vs Radial Distance
25
27
29
31
33
35
0 50 100 150 200
A
B
C
D
E
30
32
34
36
38
0 50 100 150 200
E
F
G
H
I
30
32
34
36
38
0 50 100 150 200
I
J
K
L
M
25
30
35
40
0 50 100 150 200
A
M
N
O
P
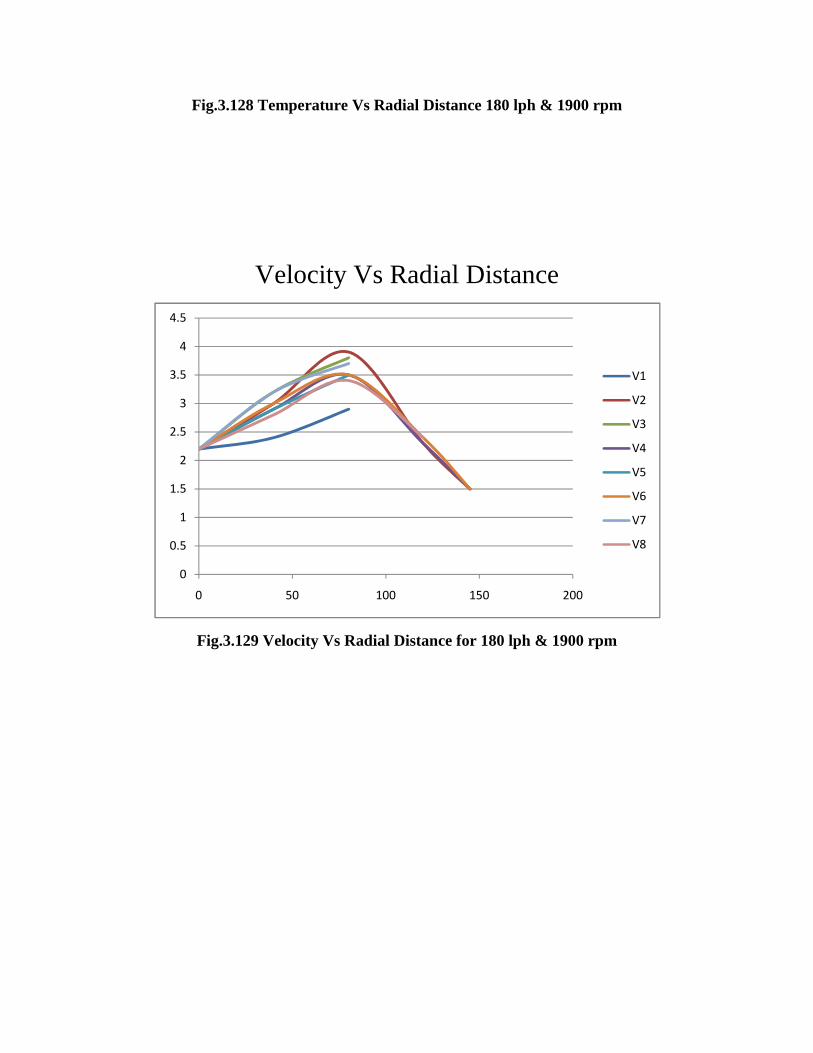
Fig.3.128 Temperature Vs Radial Distance 180 lph & 1900 rpm
Velocity Vs Radial Distance
Fig.3.129 Velocity Vs Radial Distance for 180 lph & 1900 rpm
0
0.5
1
1.5
2
2.5
3
3.5
4
4.5
0 50 100 150 200
V1
V2
V3
V4
V5
V6
V7
V8

Set: 25
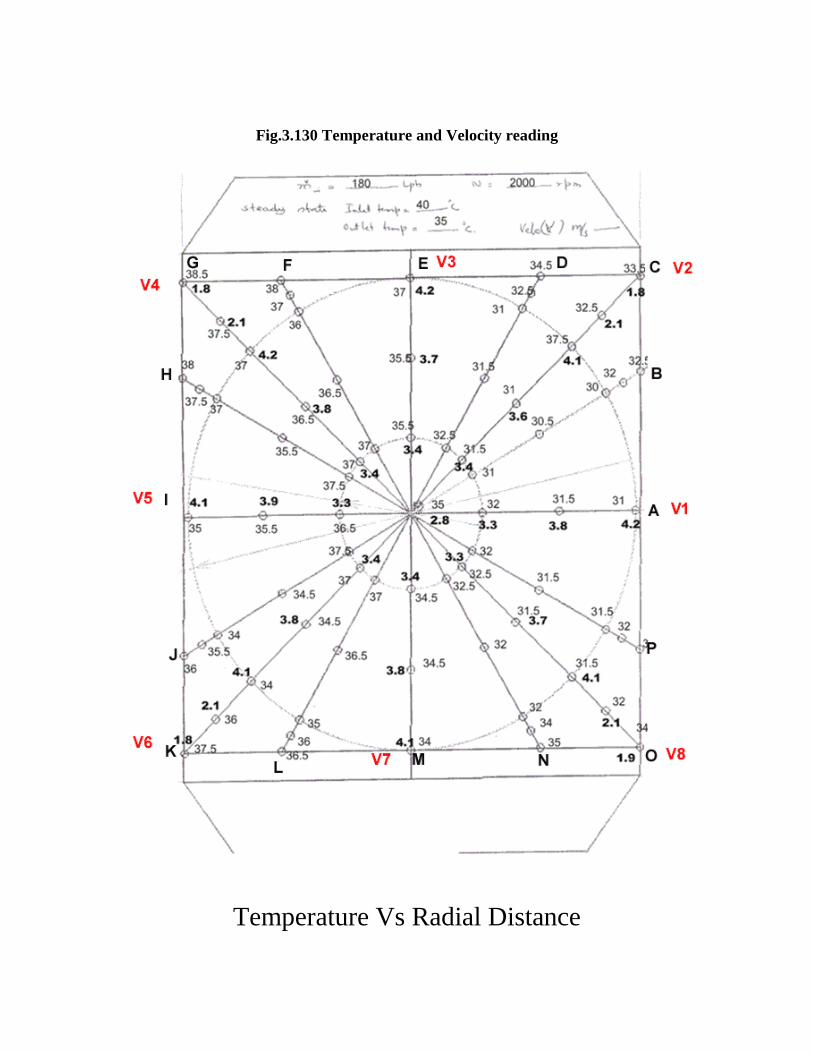
Fig.3.130 Temperature and Velocity reading
Temperature Vs Radial Distance
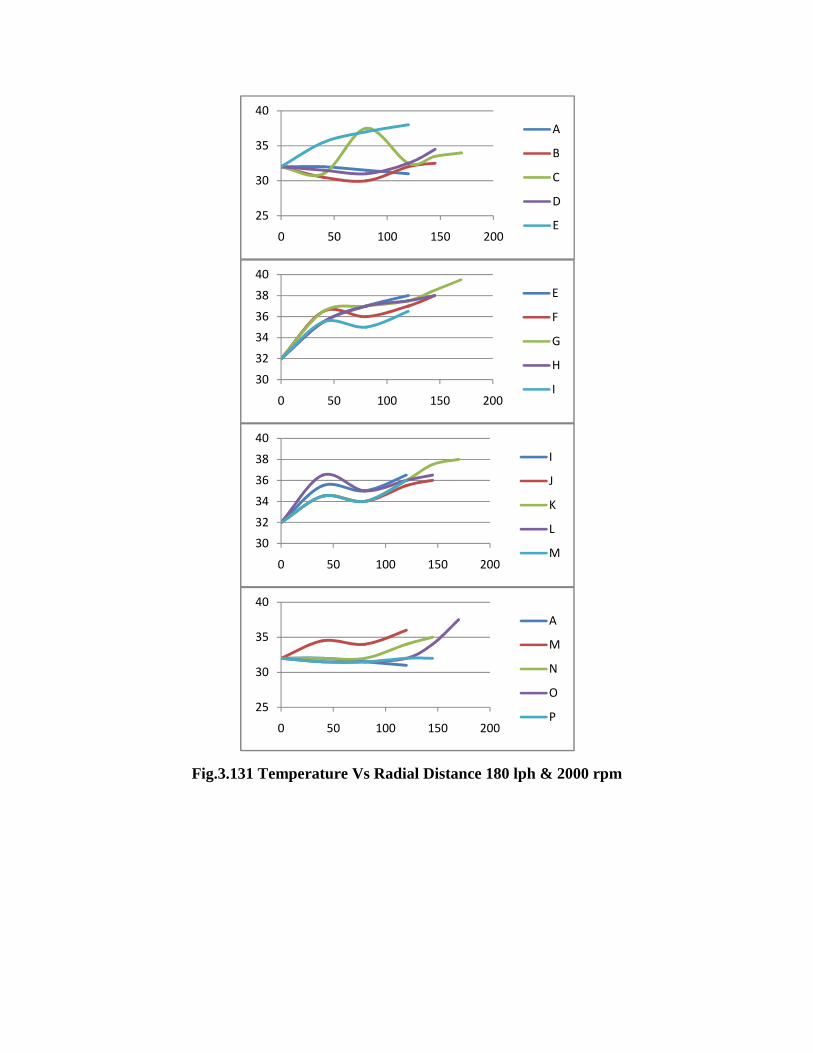
Fig.3.131 Temperature Vs Radial Distance 180 lph & 2000 rpm
25
30
35
40
0 50 100 150 200
A
B
C
D
E
30
32
34
36
38
40
0 50 100 150 200
E
F
G
H
I
30
32
34
36
38
40
0 50 100 150 200
I
J
K
L
M
25
30
35
40
0 50 100 150 200
A
M
N
O
P
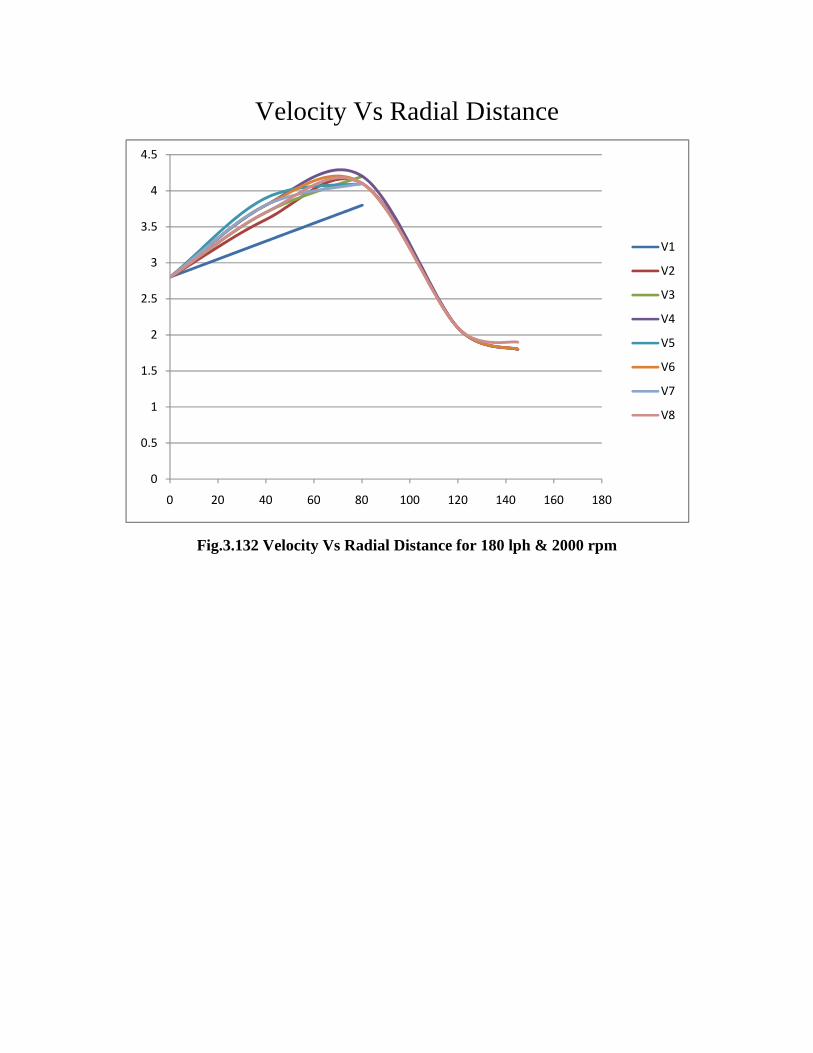
Velocity Vs Radial Distance
Fig.3.132 Velocity Vs Radial Distance for 180 lph & 2000 rpm
0
0.5
1
1.5
2
2.5
3
3.5
4
4.5
0 20 40 60 80 100 120 140 160 180
V1
V2
V3
V4
V5
V6
V7
V8
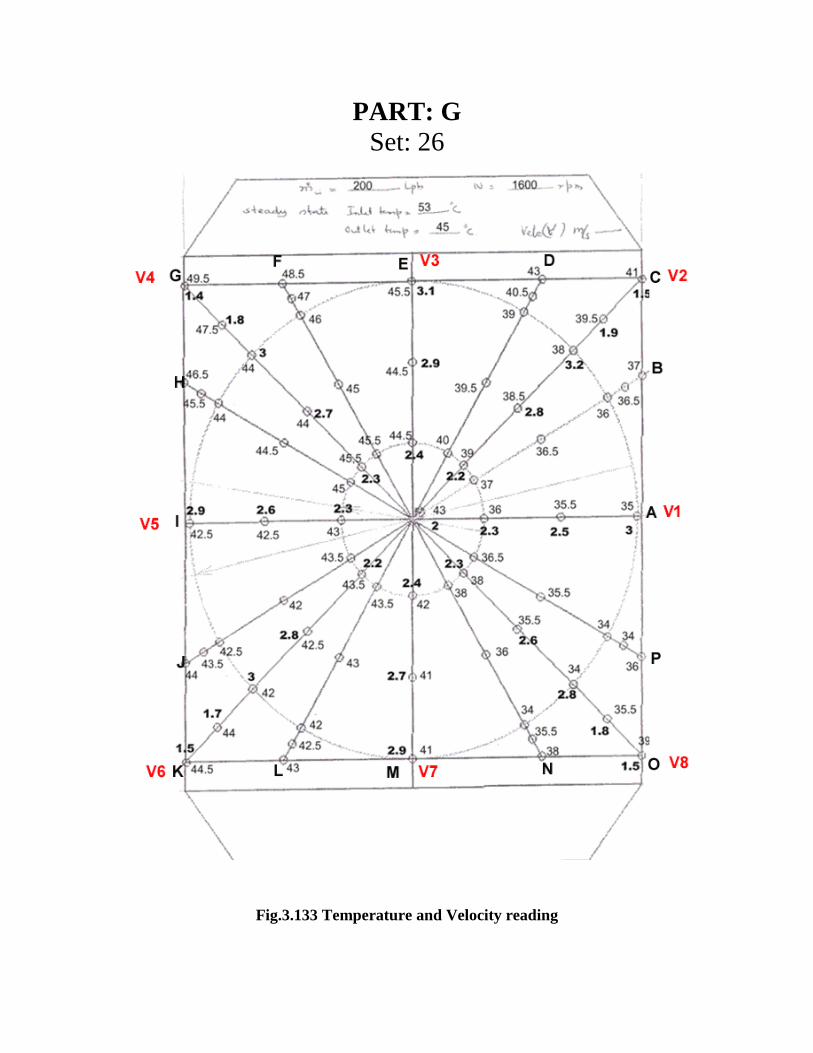
PART: G Set: 26
Fig.3.133 Temperature and Velocity reading
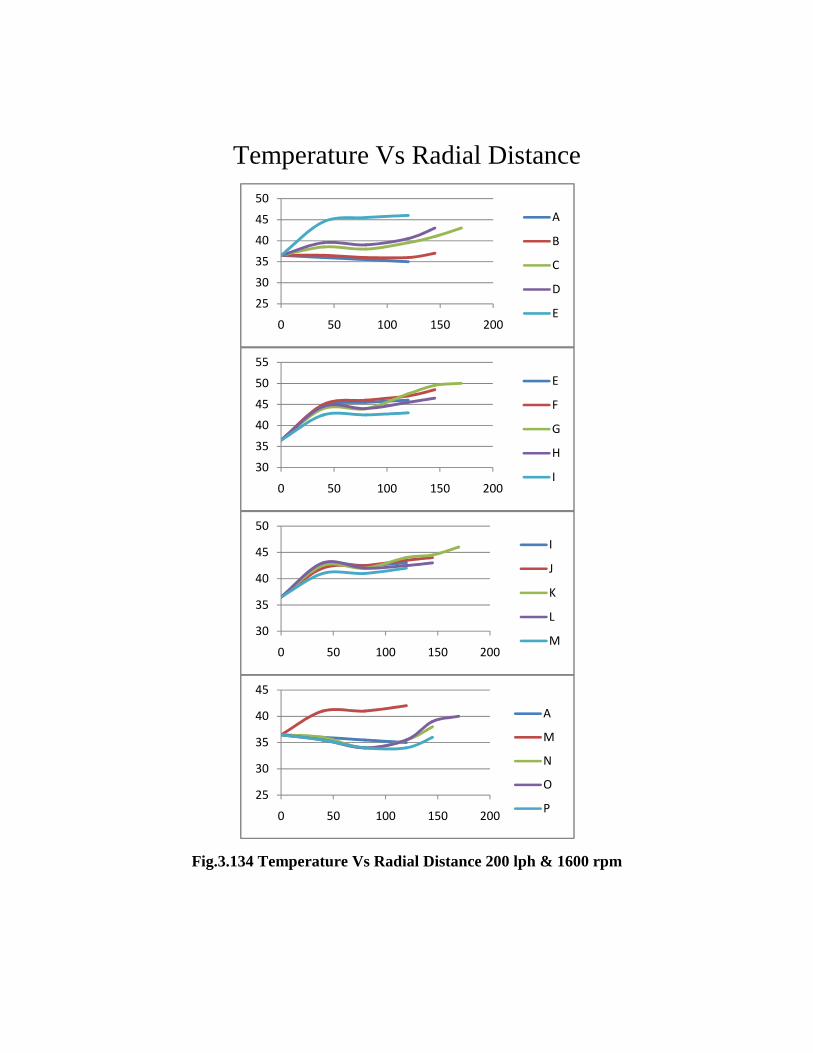
Temperature Vs Radial Distance
Fig.3.134 Temperature Vs Radial Distance 200 lph & 1600 rpm
25
30
35
40
45
50
0 50 100 150 200
A
B
C
D
E
30
35
40
45
50
55
0 50 100 150 200
E
F
G
H
I
30
35
40
45
50
0 50 100 150 200
I
J
K
L
M
25
30
35
40
45
0 50 100 150 200
A
M
N
O
P
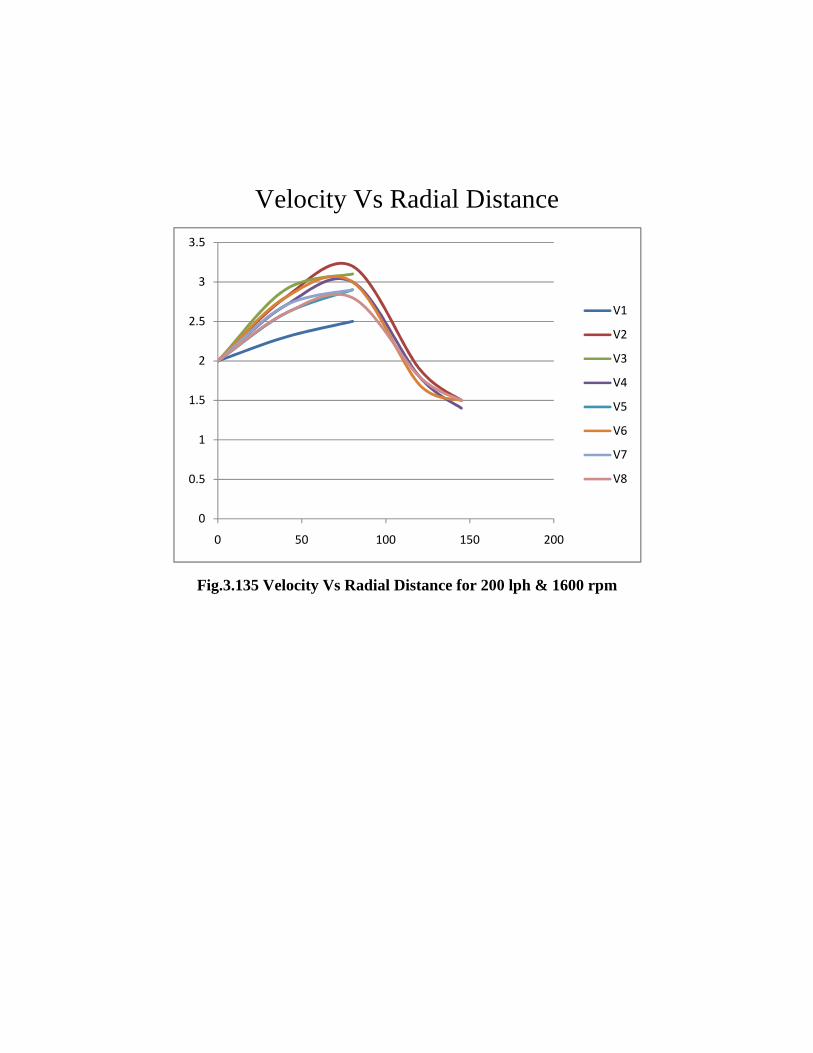
Velocity Vs Radial Distance
Fig.3.135 Velocity Vs Radial Distance for 200 lph & 1600 rpm
0
0.5
1
1.5
2
2.5
3
3.5
0 50 100 150 200
V1
V2
V3
V4
V5
V6
V7
V8
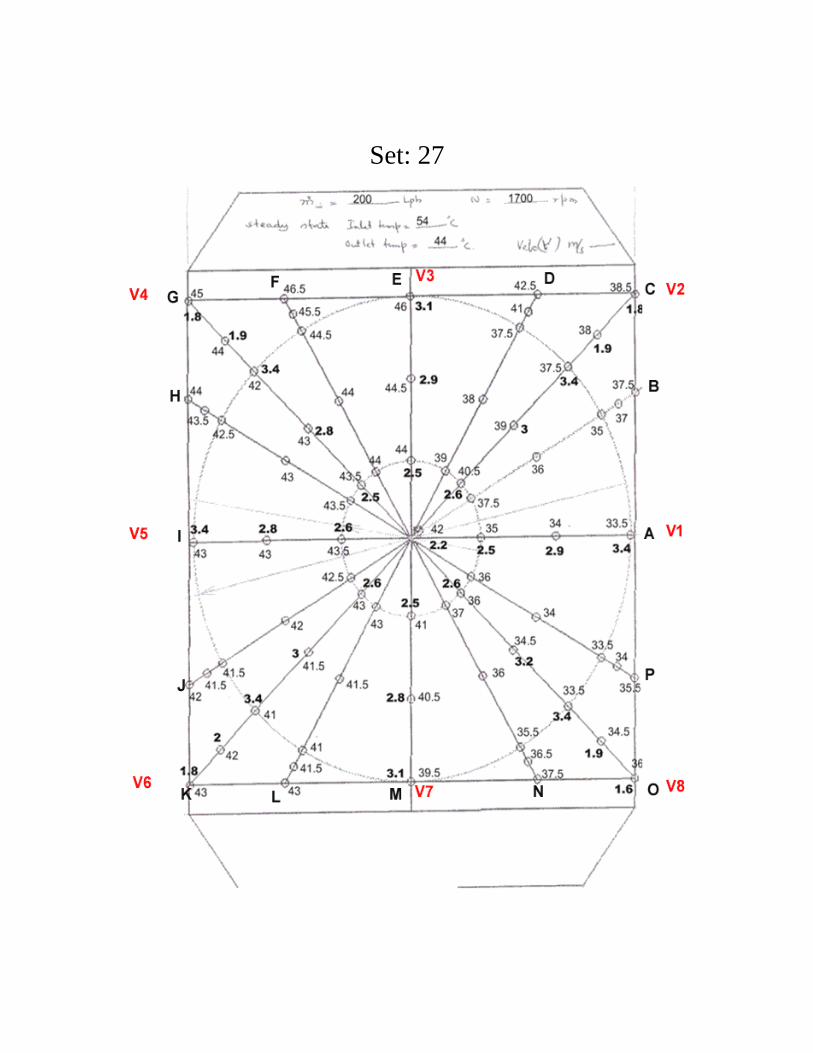
Set: 27
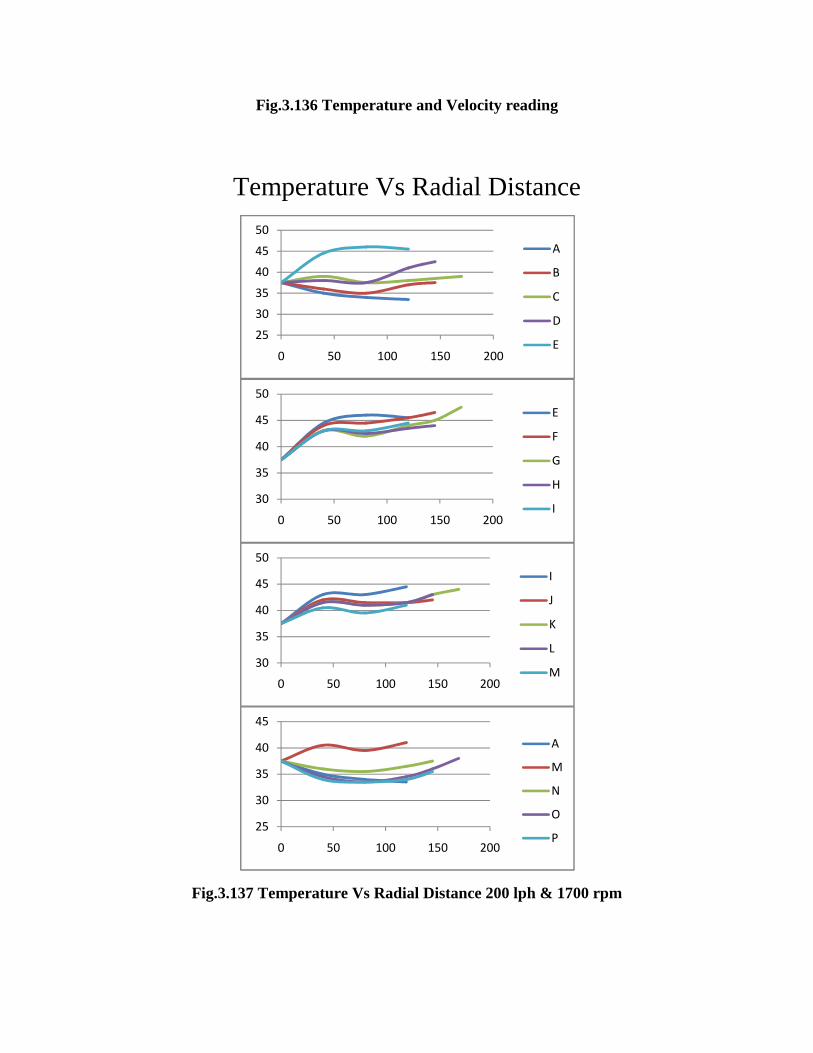
Fig.3.136 Temperature and Velocity reading
Temperature Vs Radial Distance
Fig.3.137 Temperature Vs Radial Distance 200 lph & 1700 rpm
25
30
35
40
45
50
0 50 100 150 200
A
B
C
D
E
30
35
40
45
50
0 50 100 150 200
E
F
G
H
I
30
35
40
45
50
0 50 100 150 200
I
J
K
L
M
25
30
35
40
45
0 50 100 150 200
A
M
N
O
P
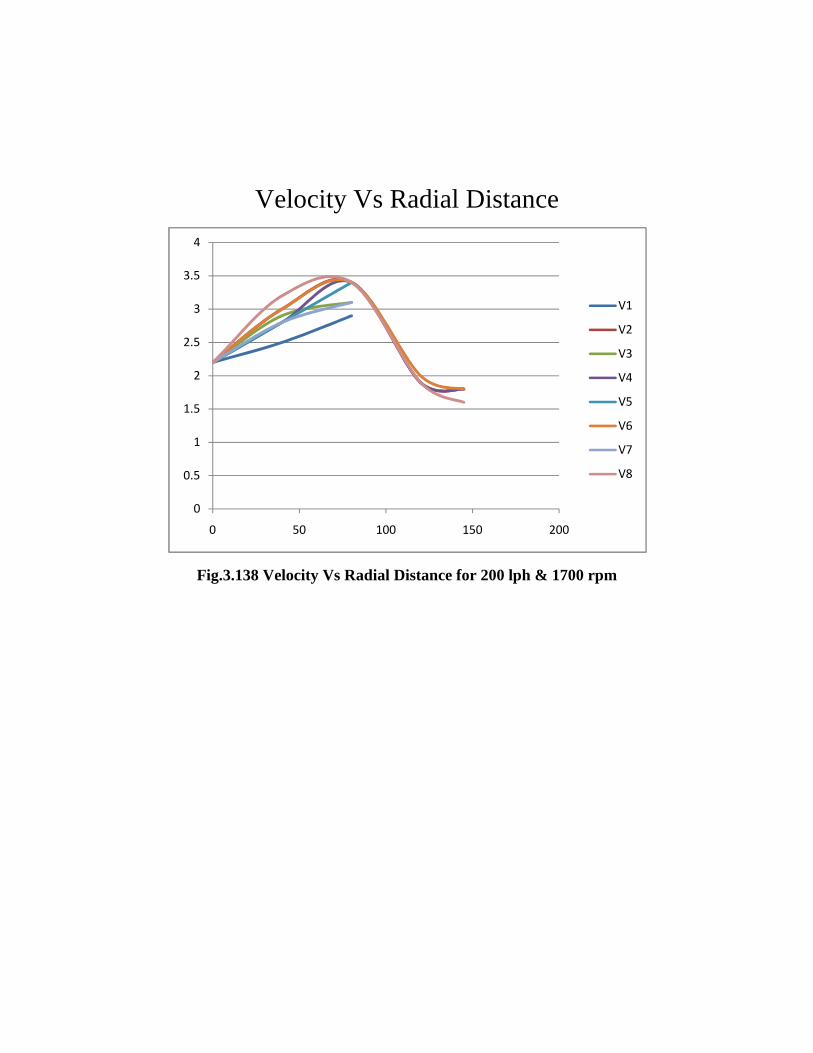
Velocity Vs Radial Distance
Fig.3.138 Velocity Vs Radial Distance for 200 lph & 1700 rpm
0
0.5
1
1.5
2
2.5
3
3.5
4
0 50 100 150 200
V1
V2
V3
V4
V5
V6
V7
V8
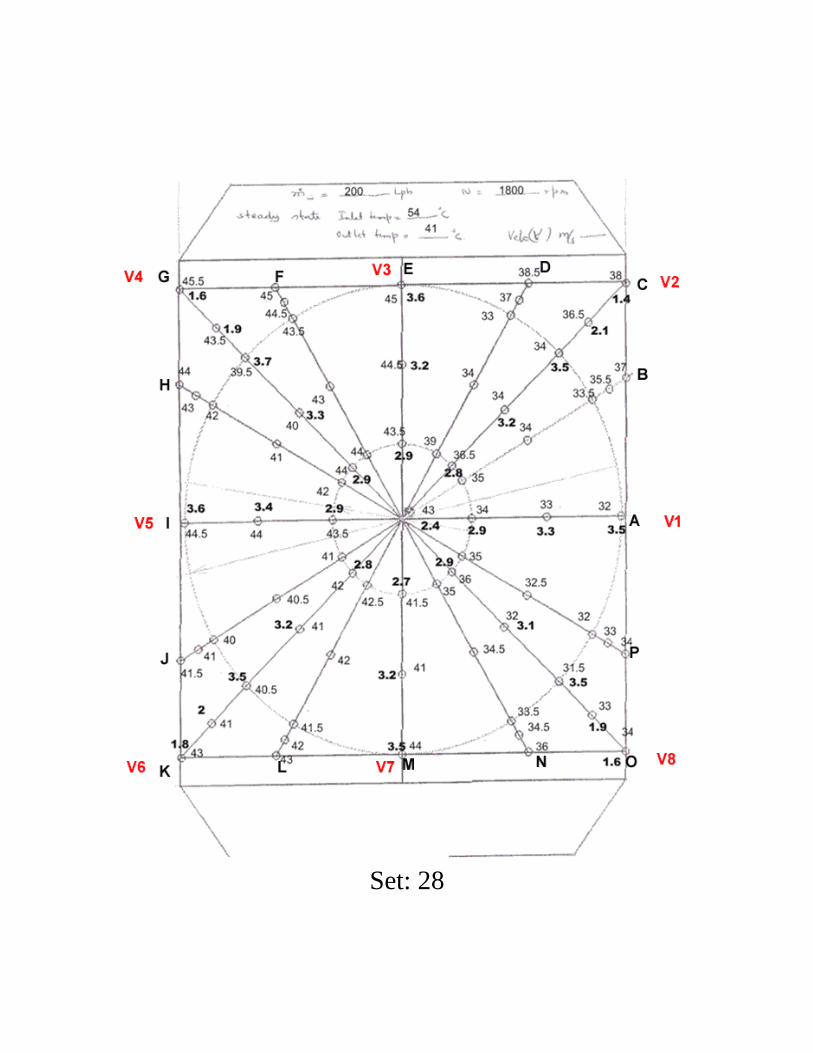
Set: 28
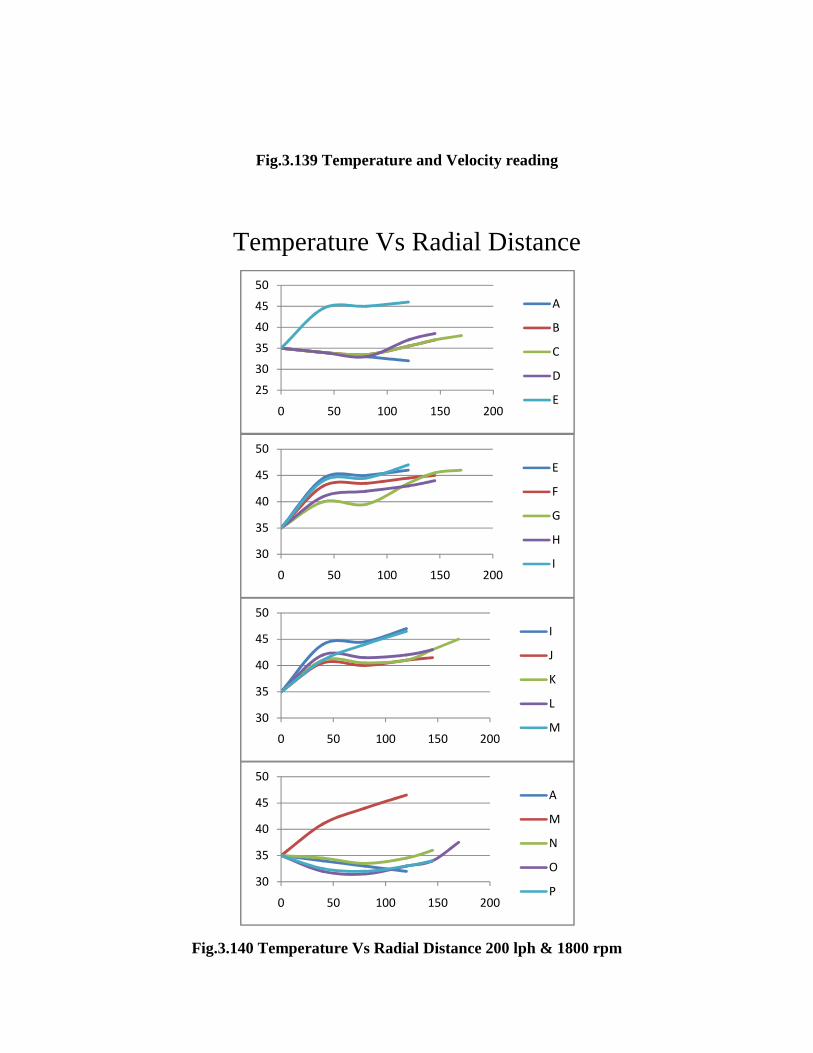
Fig.3.139 Temperature and Velocity reading
Temperature Vs Radial Distance
Fig.3.140 Temperature Vs Radial Distance 200 lph & 1800 rpm
25
30
35
40
45
50
0 50 100 150 200
A
B
C
D
E
30
35
40
45
50
0 50 100 150 200
E
F
G
H
I
30
35
40
45
50
0 50 100 150 200
I
J
K
L
M
30
35
40
45
50
0 50 100 150 200
A
M
N
O
P
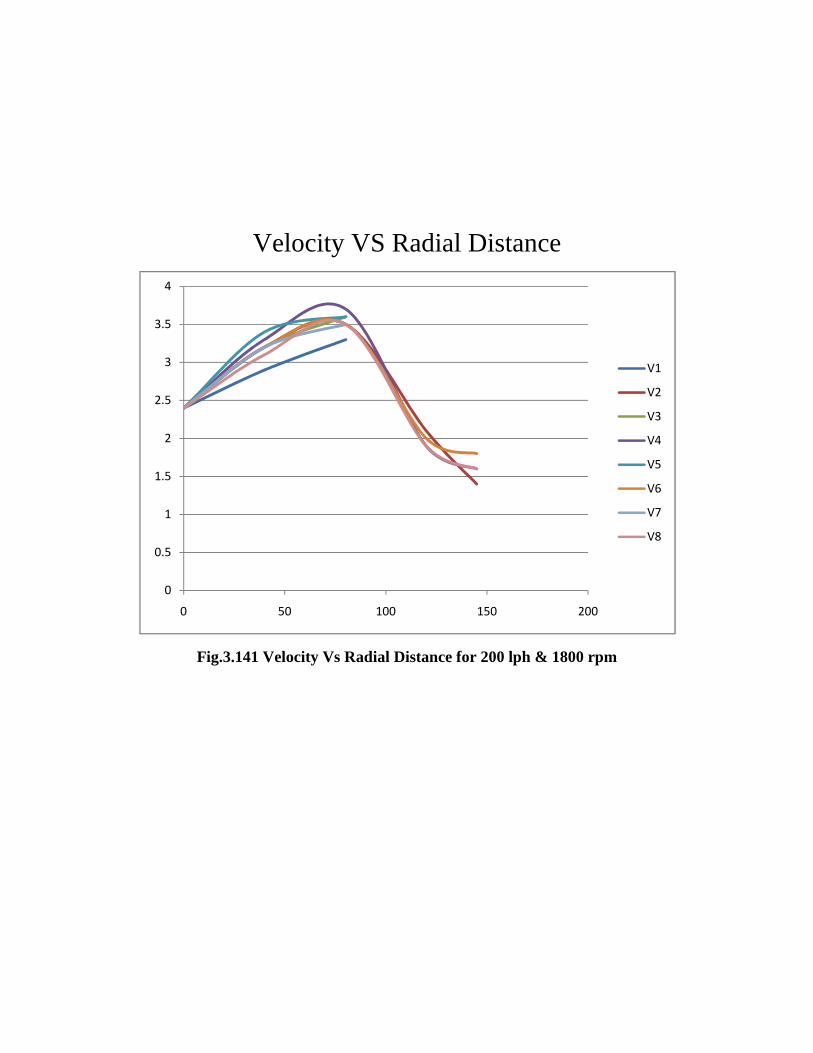
Velocity VS Radial Distance
Fig.3.141 Velocity Vs Radial Distance for 200 lph & 1800 rpm
0
0.5
1
1.5
2
2.5
3
3.5
4
0 50 100 150 200
V1
V2
V3
V4
V5
V6
V7
V8
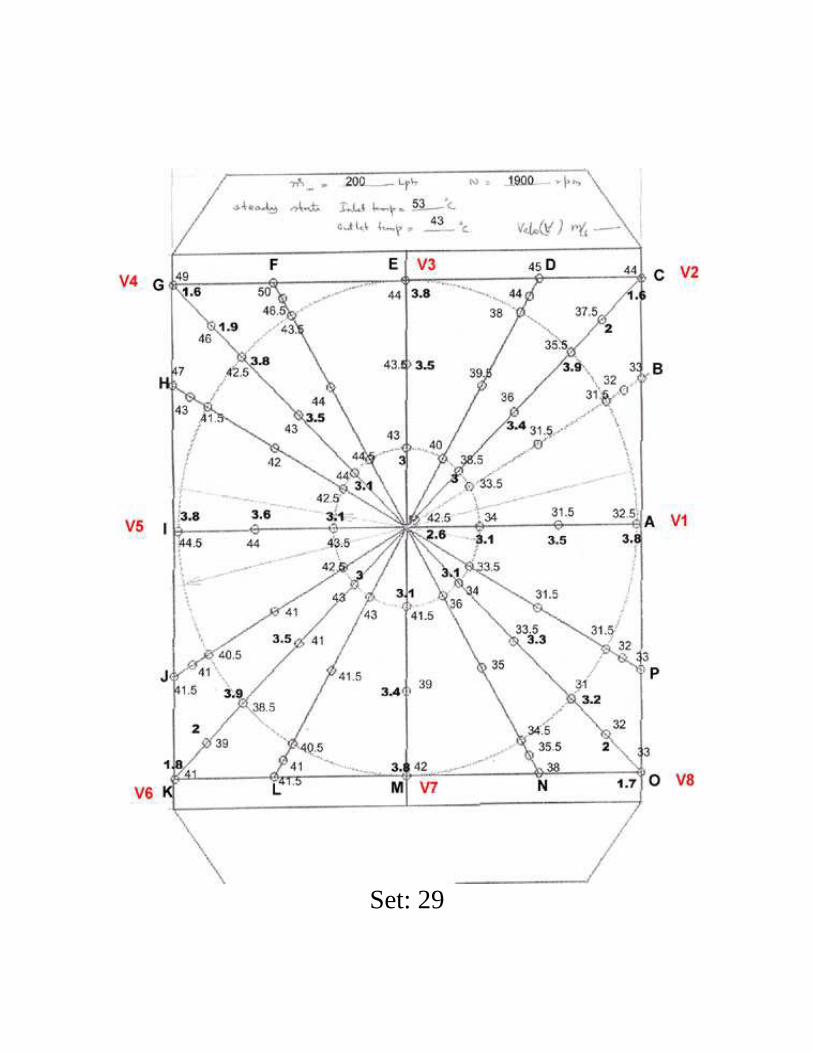
Set: 29
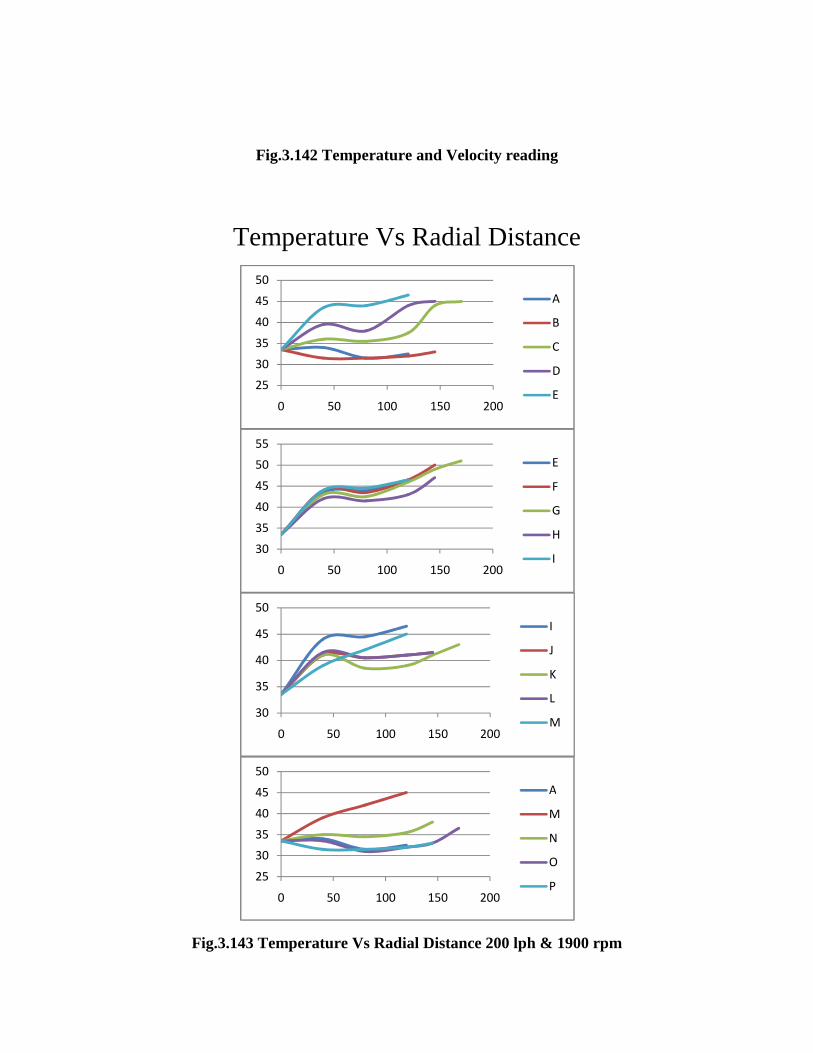
Fig.3.142 Temperature and Velocity reading
Temperature Vs Radial Distance
Fig.3.143 Temperature Vs Radial Distance 200 lph & 1900 rpm
25
30
35
40
45
50
0 50 100 150 200
A
B
C
D
E
30
35
40
45
50
55
0 50 100 150 200
E
F
G
H
I
30
35
40
45
50
0 50 100 150 200
I
J
K
L
M
25
30
35
40
45
50
0 50 100 150 200
A
M
N
O
P
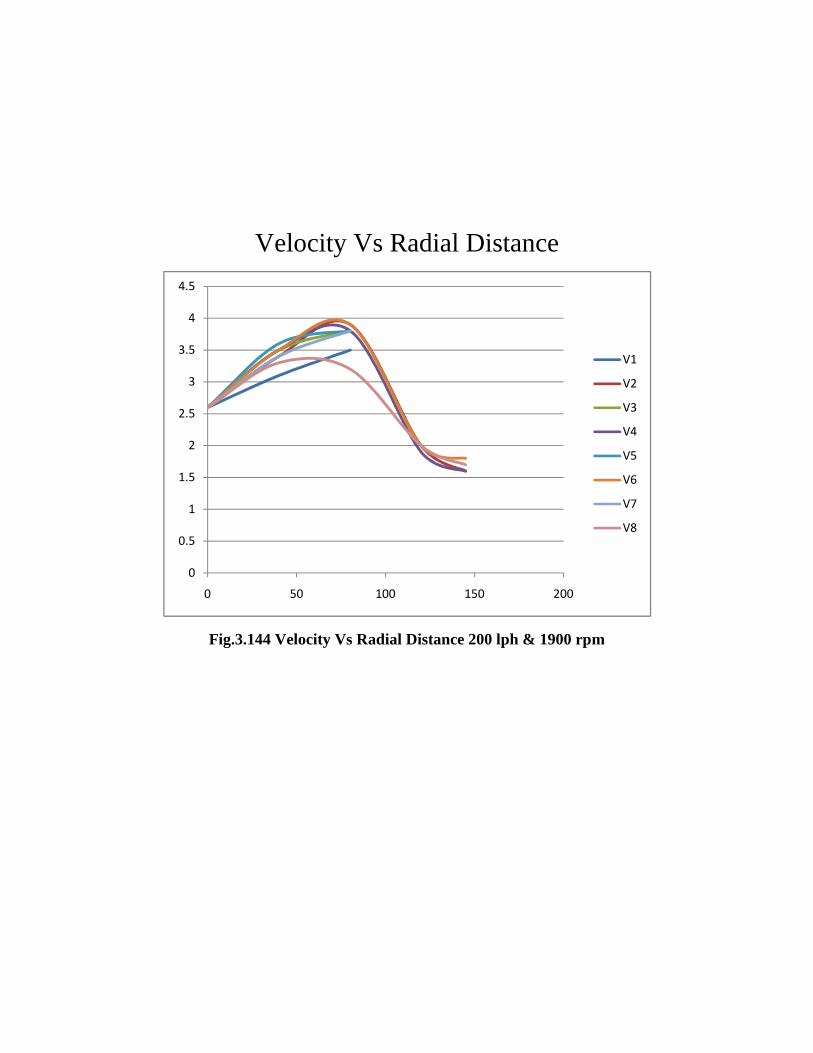
Velocity Vs Radial Distance
Fig.3.144 Velocity Vs Radial Distance 200 lph & 1900 rpm
0
0.5
1
1.5
2
2.5
3
3.5
4
4.5
0 50 100 150 200
V1
V2
V3
V4
V5
V6
V7
V8
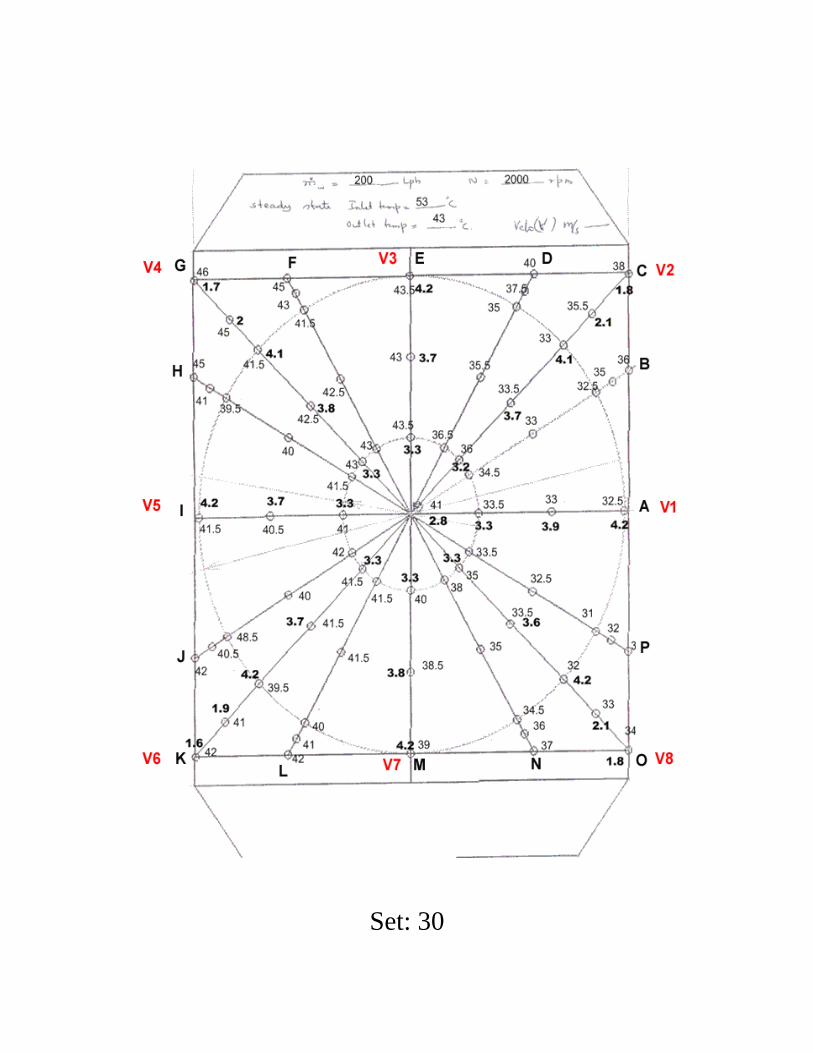
Set: 30
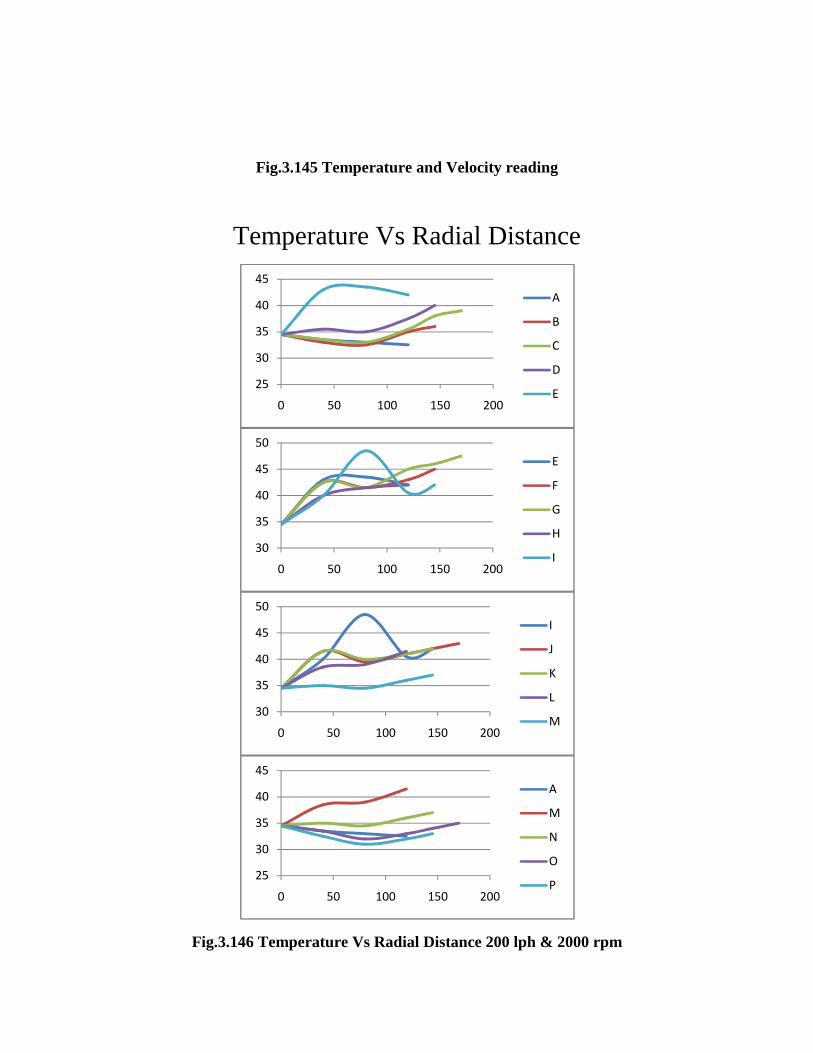
Fig.3.145 Temperature and Velocity reading
Temperature Vs Radial Distance
Fig.3.146 Temperature Vs Radial Distance 200 lph & 2000 rpm
25
30
35
40
45
0 50 100 150 200
A
B
C
D
E
30
35
40
45
50
0 50 100 150 200
E
F
G
H
I
30
35
40
45
50
0 50 100 150 200
I
J
K
L
M
25
30
35
40
45
0 50 100 150 200
A
M
N
O
P
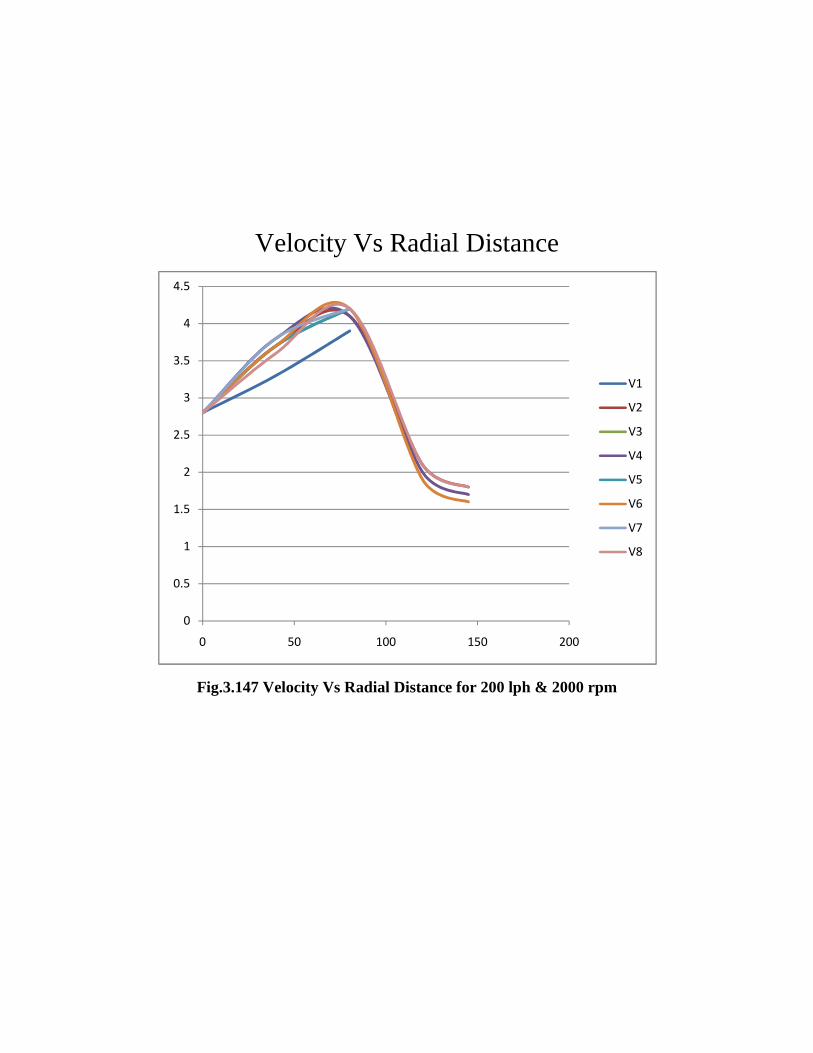
Velocity Vs Radial Distance
Fig.3.147 Velocity Vs Radial Distance for 200 lph & 2000 rpm
0
0.5
1
1.5
2
2.5
3
3.5
4
4.5
0 50 100 150 200
V1
V2
V3
V4
V5
V6
V7
V8