Evaluacion_de_proyectos_de_inversion TIR Y TIRM UCEMA EDU AR

CFA Institute Research Challenge Hosted in
CFA Society Argentina & Uruguay

1
UCEMA Research This report is published for educational purposes only by students competing in the CFA Institute Research Challenge.
11 Nov 2014 Ticker: CRESY (NasdaQ) Recommendation: BUY
Current Price: USD 10.32 (as of 10/11/14) Target Price: USD 13.05
Recommendation and Summary
Buy land, they are not making it any more ~ Mark Twain
We issue a BUY recommendation on Cresud’s ADR (CRESY) with a target price of USD13.05 (see decomposition of value Fig S2). Our estimated price reflects a premium of 27% above the current price of USD10.32. We believe Cresud is able to capitalize on the potential appreciation of its portfolio of undeveloped land in Argentina and Paraguay (the latter through BrasilAgro) and the prime real estate assets in Argentina (through its stake in IRSA), which includes a leading position in the shopping mall and in AAA-office business segments.
Moreover, Cresud's shares have a significant upside potential of another 33% (USD17.33, see Appendix 3 for instance), but this is largely dependent on obtaining the permits to go forward with some of their projects, which is difficult to estimate if and when they will be granted. Management has significant experience in the real estate market and solid expertise in selecting profitable investments. However, investment decisions are concentrated at the senior management level and, in certain cases, may not be aligned with the interests of individual shareholders
A first simple approximation of such a complex business model shows that when using a general benchmark of EV/ EBITDA (Fig S3 and Appendix 6), CRESY is worth USD10.30 for fully diluted shares (USD11.48 for outstanding shares). This supports our recomemendation that, at current price of USD 10.32, investors would be buying operational cash flows at fair value while getting Cresud’s undeveloped land and other investments for free.
Management has significant experience in the real estate market and solid expertise in selecting profitable investments. However, investment decisions are concentrated at the senior management level and, in certain cases, may not be aligned with the interests of individual shareholders.
Highlights
Cresud provides an opportunity for individual investors to gain exposure to Argentine return premiums as well as agricultural commodities and real estate in their portfolios. However, investors must be aware that this type of investment has a high potential for volatility, driven by commodity prices, unstable economic environment and uncertainty about undeveloped projects and their potential appreciation. It is also worth mentioning, that we see a positive sign in the recent share repurchases made by Cresud. Cresud’s stake in IRSA allows it to participate in a solid cash generating business with strong long-term prospects.
Main Risks
Key risks investors must be aware of include the effect of Argentina risk; Lower commodity prices; Concentration of management decisions in Mr. Eduardo Elsztain (39.3% ownership) and hence corporate governance issues; Regulatory risks; Complex Organizational and Business Structure; Higher-than-expected deceleration in GDP/consumption growth on IRSA’s business; Effect of local
Fig. S1. Market Profile
Closing Price (CRESY) 10.32
52-Week Price Range 8.26 - 14.35
Average Volume (3m) 60,675
Shares Outstanding 50.1M
Fully dilluted shares 56.1M
Market Capitalization 516.60M
Dividend & Yield 0.39 (3.70%)
P/B 2.05
Source: Thomson Reuters
Fig S2. Target Price Decomposition
IRSA (Shopping Centers, Offices and Hotels)
4.89
IRSA (Santa María del Plata land) 4.72
IRSA (BHSA) 1.16
Agro (Agriculture and agroindustrial)
0.66
Agro (Land sale and transf. assets)
1.47
BrasilAgroSA (Agriculture) 0.07
BrasilAgroSA (Paraguay land reserves)
0.08
PRICE TARGET 13.05
Source: Team estimations
Fig. S3. EV/EBITDA
3y avg. EBITDA 245M
ARG/BR xEBITDA 5.61
Market Value 1.372M
- Net Debt (796)M
Enterprise value 576M
@ 561M Fully diluted Shares
Price for ongoing activities 10.30
@ 561M Fully diluted Shares
Price for ongoing activities 11.48
Source: Team estimations
CRESUD
REAL ESTATE

2
currency depreciation on Cresud’s USD-denominated debt and high leverage; and Adverse weather conditions.
Business Description
Cresud is a diverse real estate developer in Argentina engaged in the acquisition, development and sale of both rural and urban land. The Company’s portfolio of businesses includes 33 farms, 13 shopping centers, premium office buildings, 3 luxury hotels and a large portfolio of vacant land. Although its major operations are located in Argentina, the Company, through its 40% affiliate BrasilAgro, is developing rural lands in Brazil and Paraguay, and also has presence in Bolivia and Uruguay. The Company’s strategy focuses on maximizing its return by acquiring urban and rural lands with high appreciation potential and selling properties that have reached a considerable appraisal to reinvest in new properties. In the mean time, the Company exploits rural lands for cattle and agriculture activities and also generates stable cash flows through the operation of shopping centers, office buildings and hotels.
Cresud’s Main Businesses’
Rural Lands On average, 38.5% of Cresud’s total revenues are derived from their investments and development of rural lands, managing a portfolio of 33 farms in Latin America with exposure to ~768k hectares under control. The portfolio is distributed 66% in Argentina, 18% in Brazil, 15% in Paraguay and 2% in Bolivia. Argentinean harvest campaign in 2013-14 showed an improvement due to adequate levels of rainfall in comparison with the previous campaign. On the other hand bad weather conditions in Bolivia and Brazil resulted in a reduction in the plated area.
Urban Lands Cresud derives 61.5% of its total revenues from the urban real estate business through its stake in IRSA, which owns a non-replicable prime real estate portfolio in Argentina, and offers exposure to: 1) growing consumption level, and 2) the development of its unique urban land bank. IRSA has a portfolio of 15 shopping centers in the country with ~311k square meters (sqm) of Gross Leasable Area (GLA), with a 60-70% market share in the City of Buenos Aires. In addition, the Company has a total GLA of ~123k sqm of premium offices with a ~15% share in the high-end segment in the Metropolitan area; and a majority stake in three 5-star hotels with more than 710 rooms and ~79k sqm.
Investment in Banco Hipotecario
Fig S4. Cresud’s Current/ Targeted Price – (Upside Potential)
0
5
10
15
20
25
30
Ma
r-9
7
Ma
r-9
9
Ma
r-0
1
Ma
r-0
3
Ma
r-0
5
Ma
r-0
7
Ma
r-0
9
Ma
r-1
1
Ma
r-1
3
Volume Price
Fig S5. Share Price Movement (CRESY)
Source: Thomson Reuters
Fig B1. Land Development Strategy
Source: Company Data

3
Through IRSA, Cresud also has a 30% interest in Banco Hipotecario (BHSA), an Argentina-based financial institution historically engaged in the mortgage sector but currently in consumer financing. This strategic investment leverages the acquisitions and developments of the Company as well as giving the opportunity of exploiting underperforming assets. In addition, APSA (a company owned by IRSA) has also a 20% stake in a credit card Company (Tarshop SA) with the strategic purpose of boosting shopping center’s sales with its financial facilities.
Share Ownership and Organizational Structure IFISA is owner of a 38% of Cresud. This company based in Uruguay is mainly owned by the Elsztein family. Regarding the rest of Cresud, ANSES owns a 3.4% and director and officers own a 2.2%. The remaining 55% of the company floats in NASDAQ and Buenos Aires Stock Exchange.
Regarding its organizational structure, Cresud has a complex network of partially-owned subsidiaries and associated companies, among which are worth mentioning: 65% of IRSA, (which owns 95.71% of APSA and also has a 30% interest in BHSA); 40% of BrasilAgro’s capital stock, a Brazilian Company mainly involved in sugarcane and crop production (BOVESPA: AGRO3); 100% of Cactus (a feedlot); and 60% of FyO.com, a Company dedicated to brokerage activities, among others.
Please refer to Appendix 7 for detailed information chart.
Industry Overview and Competitive Positioning
Argentine Economic Performance
According to IMF latest reports, a real GDP growth of 0.5% for 2014 is expected for Argentina. This decrease mainly responds to the imbalance of the Balance of Payments and the deterioration in international funding conditions. High inflation, which is privately estimated to be at around 30% for the year, is also weighing down the Argentine economy. Regarding construction, this industry entered a negative growth territory in 2012 and is not expected to show positive results until 2016.
Industrial activity has experienced a 3.2% decrease for the first half of 2014 compared with the same period of 2013. Despite this, high consumption expenditure was the main driver of economic activity: shopping center and supermarket sales grew in the past ten years, at a CAGR of 17% in real terms according to the INDEC.
Market Leadership
Favorable Position in Competitive Environment Cresud’s leading position in the agro business industry, grants bargaining power with suppliers and customers, generally obtaining good discounts for purchases and superior sales prices. There are numerous restrictions on the construction of shopping malls and buildings in general imposed by the Autonomous City of Buenos Aires, which combined with high start-up costs, result in a business with high barriers to entry. Please refer to the table in the right for a detail of main competitors by segment. Venturing into international markets and growing presence in the region The Company has initiated an expansion process of rural land acquisitions in other Latin American countries in order to capture a significant portion of the growth in the region.
Their intention is to replicate their successful business model of Argentina in other countries with potential.
Fig B2. Farm Appreciation Strategy
Source: Company Data
Fig IO1. Global Economic Outlook
Source: World Economic Outlook provided by IMF
Fig IO2. Main Competitors by business segment

4
Investment Summary
We issue a BUY recommendation on Cresud’s ADR (CRESY) with a target price of USD 13.05, and a 27% upside from its current price of USD 10.32 on November 7, 2014. Additionally, through its stake in IRSA, Cresud has an upside potential if permits are granted to fully develop Santa Maria's land bank. If so, the price of its stock could reach a value in the USD17.00-USD 18.00 range, offering approximately a further ~48% upside.
Valuation Methods We derived our target price by combining the use of three different valuation approaches for three distinct types of assets in Cresud's portfolio. These approaches include Discounted Free Cash Flow to Firm Method for cash generating assets, Multiples valuation for IRSA's stake in BHSA and current market prices for undeveloped land banks.
Investors Should Expect Significant Price Volatility Going Forward Argentine ADRs have shown considerable volatility in 2014. Given the current restrictions to access the foreign exchange market, ADRs were used by investors as an instrument to gain access to foreign currency. Particularly, CRESY has shown a 13. Coefficient of Variation. Furthermore, we expect this volatility to continue at least until the governments comes to an agreement with the holdouts regarding the argentine restructured debt. With respect to volatility affecting the Company in particular, there is a significant level of uncertainty related to commodity prices. An interest rate rise in US may cause capital outflows from emerging markets, putting pressure on local currencies and also negatively affecting commodity prices. The Company has been partially mitigating commodity prices exposure by performing future contracts agreements on their agricultural production.
Strong Market Leadership CRESY is able to capitalize on the potential appreciation of its portfolio of undeveloped land in Argentina and Brazil (the latter through BrasilAgro) and the prime real estate assets in Argentina (through its stake in IRSA), which includes a leading position in the shopping mall and in AAA-office business segments.
Increasing financial leverage compensated by USD linked assets The Company presented a negative net result in the 2014 fiscal year, mainly due to financial losses, owing to the 20% devaluation in the argentine peso in January 2014 and Cresud's levered position in US dollars. Currently, over 80% of Cresud's debt is dollar denominated. However, the Company holds an unrealized gain through its vast portfolio of real estate, as real estate value in Argentina has been historically linked to the evolution of the US dollar, and has been a refuge for investors during economic turbulent periods. Moreover, Cresud values its property at book value until they are sold.
Enterprise Value to EBITDA Multiple suggests the Company is Undervalued We derived a benchmark EV/ EBITDA multiple for both Argentina and Brazil by selecting local companies trading in US markets, based on a three year period average and a sample of 26 listed companies. Using this method, we reached a price of USD 11.48 for CRESY, which confirms a that the Company is currently undervalued at USD 10.32, and that the stock price does not fully reflect the value of undeveloped urban and rural land. Please see Appendix 6.
Fig IS1. Land price vs. FX evolution
0
200
400
600
800
1000
1200
1400
2011-2012 2012-2013 2013-2014
Source: company data
Figure V5: Grain and Sugarcane
sold (in k tons)
Argentina
Bolivia
Brazil
Paraguay

5
Valuation
In order to arrive at a value per common share for Cresud, a Sum of the Parts Approach was taken, by decomposing the Company into three blocks namely IRSA, CRESUD alone and BrasilAgro SA. Cresud alone includes agricultural businesses in Argentina and Bolivia, Cactus SA and FyO.com SA. According to this approach, these blocks would represent an 83%, 15% and 1% of the total value of the Company.
DCF to Firm + Market Value + Multiples Valuation
Given the complex structure of Cresud and its various subsidiaries, we used three different methods in order to value the different parts of the firm. The main criteria used to determine which method to apply was whether the assets used in each segment were cash generating or non-cash generating, excluding BHSA, which was valued through multiples. By cash generating assets we are referring to all those assets by which the Company receives a regular cash flow. For these kinds of assets we decided to use a two-stage DCF to Firm method, by projecting drivers, incorporating a terminal growth value and discounting by appropriate rates. By non-cash generating assets we mean all those assets by which the Company does not receive a regular cash flow, mainly land reserves. For this kind of assets we took a market value approach. For BHSA, partially owned by IRSA, we used the multiples valuation method.
Fig V2. Decomposition of CRESY used for valuation and contribution of each block to total value
Method FCF to Firm Market Value Multiples Own.
IRSA
Shopping Centers, Offices and Hotels
Santa María del Plata land BHSA 66.0%
USD TH 371,300 USD TH 359,095 USD TH 88,131
Agro (Argentina & Bolivia)
Agriculture and Agro industrial
Land sale and transformation - 100.0%
USD TH 33,192 USD TH 73,781
BrasilAgroSA Agriculture Paraguay land reserves
- 39.6%
USD TH 8,296 USD TH 9,845
*The missing land reserves of IRSA were valuated according to market values.
Valuation of IRSA
Cash Generating Assets The segments included in this definition are Shopping Centers, Offices and Hotels.
• Sales projection – Our statistical analysis indicates that there is a significant relation between the evolution of nominal GDP and the evolution of sales in each segment. The segment of ‘Shopping Centers’ reported a coefficient of 0.79, the segment ‘Offices’ reported a coefficient of 1.08 and the segment ‘Hotels’ reported a coefficient of 0.25 (please refer to Table…) when we tested the regression for the period 2003-2014.
• EBIT projection – In order to arrive to EBIT (from which we estimated Free Cash Flow to Firm) we projected operating costs by analyzing its average relationship with the sales of each segment during the last three exercises. For general expenses, we used ratios concerning IRSA as a whole (rather than for each segment).
• Working capital projection – We used the average of the last three exercises for days inventory outstanding, days sales outstanding and days payable outstanding in order to project Inventories, Account Receivables and Accounts Payable.
• CAPEX projection – Given the irregularity in the firm’s past capital expenditure, we assumed that the company will match it with amortization and depreciation.
• Taxes – The taxes were calculated using the relevant national tax rates.
-
2.000
4.000
6.000
8.000
10.000
12.000
20
12
20
13
20
14
E 2
01
5
E 2
01
6
E 2
01
7
E 2
01
8
E 2
01
9
E 2
02
0
E 2
02
1
E 2
02
2
E 2
02
3
E 2
02
4Figure V3. IRSA: Sales evolution per
segment
HotelsOfficeShopping Sales
Source: Company data and team estimations.
37,4%
36,2%
8,9%
5,1%
11,3%0,5%
Figure V1: Participation of
each block on CRESY's value
IRSA (Shopping Centers, Offices and Hotels)
IRSA (Santa María del Plata land)
IRSA (BHSA)
Agro (Agriculture and agroindustrial)
Agro (Land sale and trasf. assets)
BrasilAgroSA (Agriculture)
BrasilAgroSA (Paraguay land reserves)
Source: Team estimates
6
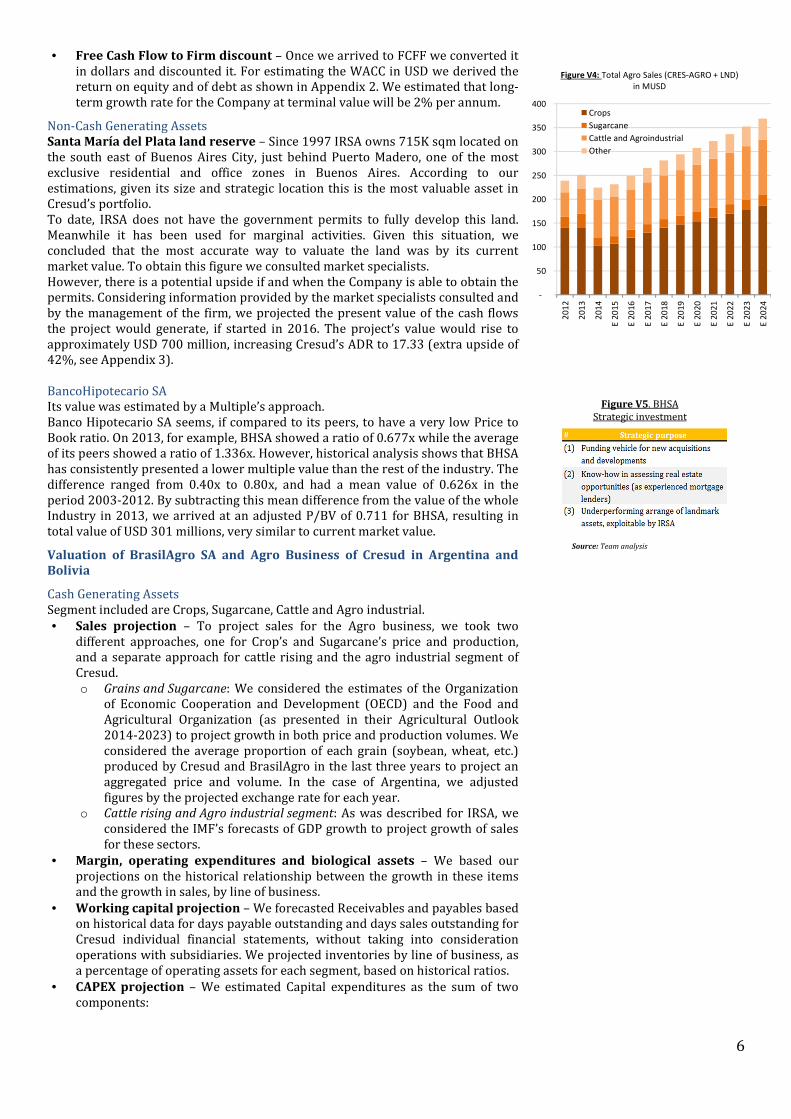
• Free Cash Flow to Firm discount – Once we arrived to FCFF we converted it in dollars and discounted it. For estimating the WACC in USD we derived the return on equity and of debt as shown in Appendix 2. We estimated that long-term growth rate for the Company at terminal value will be 2% per annum.
Non-Cash Generating Assets Santa María del Plata land reserve – Since 1997 IRSA owns 715K sqm located on the south east of Buenos Aires City, just behind Puerto Madero, one of the most exclusive residential and office zones in Buenos Aires. According to our estimations, given its size and strategic location this is the most valuable asset in Cresud’s portfolio. To date, IRSA does not have the government permits to fully develop this land. Meanwhile it has been used for marginal activities. Given this situation, we concluded that the most accurate way to valuate the land was by its current market value. To obtain this figure we consulted market specialists. However, there is a potential upside if and when the Company is able to obtain the permits. Considering information provided by the market specialists consulted and by the management of the firm, we projected the present value of the cash flows the project would generate, if started in 2016. The project’s value would rise to approximately USD 700 million, increasing Cresud’s ADR to 17.33 (extra upside of 42%, see Appendix 3). BancoHipotecario SA Its value was estimated by a Multiple’s approach. Banco Hipotecario SA seems, if compared to its peers, to have a very low Price to Book ratio. On 2013, for example, BHSA showed a ratio of 0.677x while the average of its peers showed a ratio of 1.336x. However, historical analysis shows that BHSA has consistently presented a lower multiple value than the rest of the industry. The difference ranged from 0.40x to 0.80x, and had a mean value of 0.626x in the period 2003-2012. By subtracting this mean difference from the value of the whole Industry in 2013, we arrived at an adjusted P/BV of 0.711 for BHSA, resulting in total value of USD 301 millions, very similar to current market value.
Valuation of BrasilAgro SA and Agro Business of Cresud in Argentina and Bolivia
Cash Generating Assets Segment included are Crops, Sugarcane, Cattle and Agro industrial.
• Sales projection – To project sales for the Agro business, we took two different approaches, one for Crop’s and Sugarcane’s price and production, and a separate approach for cattle rising and the agro industrial segment of Cresud. o Grains and Sugarcane: We considered the estimates of the Organization
of Economic Cooperation and Development (OECD) and the Food and Agricultural Organization (as presented in their Agricultural Outlook 2014-2023) to project growth in both price and production volumes. We considered the average proportion of each grain (soybean, wheat, etc.) produced by Cresud and BrasilAgro in the last three years to project an aggregated price and volume. In the case of Argentina, we adjusted figures by the projected exchange rate for each year.
o Cattle rising and Agro industrial segment: As was described for IRSA, we considered the IMF’s forecasts of GDP growth to project growth of sales for these sectors.
• Margin, operating expenditures and biological assets – We based our projections on the historical relationship between the growth in these items and the growth in sales, by line of business.
• Working capital projection – We forecasted Receivables and payables based on historical data for days payable outstanding and days sales outstanding for Cresud individual financial statements, without taking into consideration operations with subsidiaries. We projected inventories by line of business, as a percentage of operating assets for each segment, based on historical ratios.
• CAPEX projection – We estimated Capital expenditures as the sum of two components:
Figure V5. BHSA Strategic investment
Source: Team analysis
-
50
100
150
200
250
300
350
400
20
12
20
13
20
14
E 2
01
5
E 2
01
6
E 2
01
7
E 2
01
8
E 2
01
9
E 2
02
0
E 2
02
1
E 2
02
2
E 2
02
3
E 2
02
4
Figure V4: Total Agro Sales (CRES-AGRO + LND)
in MUSD
Crops
Sugarcane
Cattle and Agroindustrial
Other

7
o Maintenance CAPEX: Matches the projected Depreciation and Amortization of assets.
o Expansion CAPEX: investment needed to increase the productivity of the land owned by Cresud and BrasilAgro. We estimated this component as a percentage of the increase in production for each line of business.
• Taxes – The taxes were calculated using the relevant national tax rates.
• Free Cash Flow to Firm Discount – The approach was similar to the one taken for IRSA (see above), but taking into account the differences in funding costs and capital structure, see Appendix 2. Terminal Value we estimated that long-term growth rate for the company will be 2% per annum.
Non-Cash Generating Assets Cresud and BrasilAgro own a stock of land bank reserves of approximately 230K has including farmlands in the north of Argentina (Los Pozos in Salta province and El Recreo in Catamarca) and in the center region of Paraguay (owned through BrasilAgro). These reserves are not being exploited at the time, therefore we concluded, as well as in Santa Maria del Plata’s case, that the market value would be the most accurate approach.
Financial Analysis
RATIOS 2012 2013 2014 E 2015 E 2016 E 2017 E 2018 E 2019 E 2020 E 2021 E 2022 E 2023 E 2024
Profitability EBITDA margin 31% 39% 23% 31% 30% 30% 29% 28% 28% 28% 28% 28% 28% Gross profit margin 38% 37% 40% 43% 41% 40% 39% 38% 38% 37% 37% 37% 37% Operating profit margin 23% 31% 26% 28% 27% 27% 26% 25% 25% 25% 25% 25% 25% Net profit margin -1% -1% -19% 8% 8% 8% 8% 7% 8% 8% 8% 8% 8% Return on assets 0% 0% -5% 2% 2% 3% 3% 3% 3% 3% 3% 3% 4% Return on equity 0% 0% -11% 5% 6% 7% 8% 8% 9% 9% 10% 10% 11% Liquidity Current ratio 2.12 2.57 1.81 2.05 2.27 2.49 2.58 2.70 2.83 2.96 3.09 3.23 3.36 Quick ratio 1.99 2.49 1.73 1.99 2.19 2.39 2.47 2.58 2.70 2.82 2.95 3.07 3.20 Cash asset ratio 0.68 0.73 0.57 0.59 0.61 0.63 0.64 0.65 0.66 0.66 0.67 0.67 0.68 Cash ratio 1.44 1.87 1.03 1.22 1.39 1.57 1.65 1.76 1.86 1.97 2.07 2.17 2.28 Activity Total asset turnover 0.24 0.26 0.24 0.28 0.31 0.33 0.35 0.37 0.38 0.39 0.41 0.42 0.43 Fixed asset turnover 0.64 0.74 0.88 1.08 1.33 1.58 1.81 1.98 2.15 2.35 2.56 2.79 3.03 Financial leverage Long-term debt to assets 0.22 0.27 0.27 0.31 0.35 0.39 0.41 0.42 0.43 0.44 0.44 0.44 0.45 Long-term debt to equity 0.39 0.54 0.64 0.75 0.95 1.10 1.26 1.30 1.33 1.35 1.36 1.37 1.36 Debt to equity 0.56 0.75 0.97 1.07 1.28 1.43 1.59 1.62 1.64 1.64 1.64 1.63 1.61 EBITDA to Interest coverage
2.72 3.86 1.77 3.52 3.65 3.56 3.44 3.30 3.40 3.51 3.62 3.74 3.86
Shareholder Ratios Earnings per ADR (0.10) (0.11) (2.18) 0.89 0.92 0.97 0.98 0.96 1.01 1.06 1.11 1.17 1.23 Dividend payout ratio - - - - - - 0.59 0.30 0.30 0.30 0.30 0.30 0.30
Source: Team estimation
Stable Consolidated Margins and increasing ROE
The Company presented a negative net result in the 2014 fiscal year, mainly due to negative financial losses owing to the 20% devaluation in the argentine peso in January 2014. Currently, over 80% of Cresud's debt is dollar denominated. Going forward, we expect the consolidated net income be at a stable 8% margin with respect to sales, driven by stronger expected performance in the commodities market and a more moderate devaluation in the exchange rate. Similarly the company’s ROA should be around 3% in the upcoming years with a ROE increasing steadily from 5% on 2015 to 11% on 2024. Gross margins are expected to stay in line with previous years (37%-43%).

8
521
9271.036
804800
650
500450400
0
200
400
600
800
1.000
1.200
20
10
20
11
20
12
20
13
20
14
E
20
15
E
20
16
E
20
17
E
20
18
E
Increasing liquidity and increase in interest coverage ratios
We estimate that the increase in the Company’s revenues will reflect in a higher working capital therefore boosting all liquidity ratios and improving CRESUD’s financial position. In 2014, the EBITDA coverage ratio decreased, also as a consequence of the devaluation in the local currency. However, cash flows are still sufficient to cover interest payments. In the future, we expect an increase of the EBITDA interest coverage ratio, returning to levels similar to 2013.
Increasing Revenue in the Shopping Centers Segment
With the opening of two establishments projected for 2015 (Arcos Gourmet and NQN Shopping), IRSA will own more than 341k hectares of GLA in 15 shopping centers across Argentina. Over the past years, occupancy rates have been close to a 100% in every establishment, with a CAGR on revenues of 15%. Tenants are usually charged a rent which is the higher of (1) the base rent; and (2) complementary rent (which generally ranges between from 4% to 10% of the sales). Furthermore, pursuant to the rent escalation clause in most lease arrangements, the tenants’ base rent generally increases between 7% and 24% each year during the lease term. We expect a growth from 21% on 2015 to a stable 9.68% on the 2019-2020 period on sales, levered by both an increase in ARS per square meter and a maintenance in occupancy rates.
Sustainable Gross Profit from Shopping Centers and Office Rentals
IRSA’s dominant position allows high rates with their tenants. These leases have an average term raging from three to five years, with some leases relating to anchor stores having terms of ten years, which are generally renewable. This provides for a stable growth in revenues. With labor costs and maintenance services accounting for almost 50% of IRSA’s direct costs, we expect a raise in costs due to inflationary pressure that may undermine some of the increased profitability but nonetheless gross profit should stabilize around 53% for Shopping Centers and 63% for Office Rentals.
Increasing ROA on Agricultural Business
We expect Gross Margins of Agricultural Business to continue on the same levels as during 2011-2014, sustained by CRESUD’s consistent policy to hedge the majority of the commodities sales through future contracts, and which combined with an increase on commodities prices (according OECD- FAO Outlook 2014-2023) will result in an increase of the Operating Margin from 1% on E2015 to 6% on 2024E, the ROA (from -1% to 1.3%) for Argentina and Bolivia. These forecasted ratios have similar behavior in the case of BrasilAgro.
Investment Risks
Higher Country Risk: Argentina’s ability to obtain financing from international markets is limited, which may impair its ability to implement reforms and foster economic growth. The evolution of Cresud’s stock price is highly correlated with the performance of the local stock exchange, which is subject to the evolution of macroeconomic variables in Argentina.
Major Shareholder exercising a significant influence: The Chairman, Mr. Eduardo Elsztain, has 39.3% of the common shares, therefore the Company’s principal shareholder has great influence over fundamental decisions and this situation could derive in a conflict of interest with minority shareholders. The Company highly depends on its chairman and senior management.
Regulatory Risks: Lack of authorization for development projects, shopping centers habilitations, stricter restrictions on FX/cash dividends, higher and/or new taxes and fines. In our valuation model, urban and rural undeveloped land reserves represent 48% of Cresud’s total value.
Complex organizational structure: the quantity of subsidiaries of the company and the fact that Cresud IRSA, APSA and BrasilAgro share most of their board of directors, makes it very difficult for minor share holder to understand and control the company’s activity.
Fig R2. Portfolio in South America
ARG: 66%; 18 farms 618,266 has (Cresud) +95% of IRSA
BR: 17% 8 farms 160,815
PAR: 15% 1 farm
BOL: 2% 6 farms 15,059
Source: Company data
Figure R3. EMBI Evolution for Argentina (in bps)
Source: JPMorgan’s EMBI and Team estimates
Fig R1. Top Management
Source: Financial Statements of the Company as of June 30, 2014

9
Higher-than-expected deceleration in GDP/consumption growth on IRSA’s business: Companies with earnings linked to consumer purchasing power could be negatively affected. Representing 60% of consolidated EBITDA generation, the IRSA’s shopping center segment is highly dependent on the business cycle of the Argentine economy.
Rising Inflation Pressure on Costs and Margins: The inability of the Company to minimize the inflation impact on costs and expenses will translate into lower operating margins in the coming years.
Exchange rate depreciation of the Argentine Peso: Cresud has a high exposure to USD-denominated debt, representing 70% of total consolidated debt. However, land values in USD are the collateral for this debt, therefore mitigating this risk.
An interest rate rise in US may cause capital outflows from emerging markets, putting down pressure on local currencies and also affecting negatively commodity prices. The Company has been partially mitigating commodity prices exposure by performing future contracts agreements on their agricultural production.
Adverse weather conditions, seasonality of the business and unexpected diseases could affect the Company’s business: The most effective instrument to mitigate this risk is crop insurance. However, crop insurance is expensive and the Company’s crops are not currently under coverage.
Fig R5. Sensibility Analysis - Multiscenario valuation
Base Bear Bull
Abstract
Interest rates converging to historical levels
Rapdily increasing interest rates Stable interest rates
Stable market return Lower market return Higher market return
GDP & Country risk converging to historical levels
Lower investment in emerging markets, hence lower growth &
higher country risk
Higher capital flows towards emerging markets, hence higher
growth & lower country risk
Lower prices on commodities, due to lower demand on China, USA &
Europe
Higher prices on commodities, given higher demand on China,
USA & Europe
Risk-free rate (rf) 2.44% 4.0% 2.4%
Market return (rm) 9.1% 8.5% 9.5%
Country risk AR 6.6% 9.0% 4.0%
Country risk BR 2.45% 4.0% 2.2%
Expected Growth 2.0% 1.0% 3.0%
Land Price var. Vs. Base 0.0% -15.0% +15%
GDP growth var. -1pp 1pp
Commodities price var.
-10pp +10pp
CRESY 13.05 11.14 15,74 -15% +21%
Figure R4. Inflation Argentina
Source: Congress inflation and Team estimates
Figure R5. Real GDP Variation Argentina
Source: World Economic Outlook provided by IMF

10
Other relevant matters
Share Repurchase
During 2014, Cresud has launched a plan to repurchase up to USD25 million or 5% of their capital stock. As of June 2014, the Company has repurchased 5.6 million shares, representative of 1.11% of their capital stock, for a total amount of USD 7 million. In relation to IRSA’s repurchase of shares, the Company has decided to finalize its repurchase plan. As of June 2014, the Company has repurchased 4.9 million of IRSA’s shares, representative of 0.85% of their capital stock, for a total amount of USD6 million.
Debt issuance
Cresud issued debt in the local market. It is important to mention the negative impact of the depreciation of the peso currency this year in Argentina that had affected their financial results because a significant portion of their debt is denominated in dollars while most of their assets, which historically have been correlated with the dollar, are valued at historical cost unaffected by any type of revaluation of fluctuating market prices. (Please refer to Appendix 15 for further detail).
Dividend distribution
Last November 2013, a dividend of USD 20 million representing 24.1% of the share capital of Cresud was made available to their BCBA and NASDAQ shareholders. On June 2014, IRSA approved the distribution of cash dividends in advance totaling USD7 million representing 9.87% of share capital.
Warrants
Each shareholder has received at no cost a warrant that allows him to buy 0.33333333 (now 0.35) new shares at USD 1.68 each. 180 millons of warrantas had been issued giving right to additional 60 millons shares originally. They mature in Mayo 22th 2015 and are listed under the ticker "CREW2" (BCBA) and "CRESW" (NASDAQ).

11
Appendices
Appendix 1: Financial Statements CONSOLIDATED BALANCE SHEET (CRESY-CONSOLIDATED)
IN USD MILLIONS 2012 2013 2014 E 2015 E 2016 E 2017 E 2018
ASSETS Non-Current Assets
Fixed Assets 1,041 977 644 536 444 384 347 Other Non-Current Assets 758 580 629 559 501 462 437 Total Non-Current Assets 1,799 1,557 1,273 1,095 945 847 784 Current Assets
Inventories 57 37 49 33 36 39 42 Trade Receivables 170 237 153 167 170 175 181 Cash 627 907 614 601 610 629 632 Other Current Assets 70 64 265 212 179 154 135 Current Assets 923 1,245 1,081 1,013 996 997 990 TOTAL ASSETS 2,722 2,801 2,354 2,108 1,941 1,843 1,774 SHAREHOLDERS' EQUITY
TOTAL SHAREHOLDERS' EQUITY 1,522 1,402 1,000 866 727 648 584 LIABILITIES
Non-Current Liabilities
Long Term Debt 599 762 636 645 688 716 734 Other Non-Current Liabilities 165 153 121 103 89 79 73 Total Non-Current Assets 763 915 758 748 776 795 807 Current Liabilities
Trade Payables 163 185 160 128 133 136 145 Borrowing 261 288 331 282 240 212 194 Other Current Liabilities 12 11 105 84 65 52 44 Total Current Liabilities 436 484 597 494 438 400 383 TOTAL LIABILITIES 1,200 1,399 1,354 1,242 1,214 1,195 1,190
TOTAL EQUITY AND LIABILITIES 2,722 2,801 2,354 2,108 1,941 1,843 1,774
BALANCE SHEET (CRESY-CONSOLIDATED)
IN USD MILLIONS E 2019 E 2020 E 2021 E 2022 E 2023 E 2024
ASSETS Non-Current Assets
Fixed Assets 327 309 292 277 263 250 Other Non-Current Assets 423 410 398 386 376 366 Total Non-Current Assets 750 719 690 663 639 616 Current Assets
Inventories 44 46 49 51 54 56 Trade Receivables 187 192 199 205 212 219 Cash 659 680 703 725 749 774 Other Current Assets 122 114 108 102 98 93 Current Assets 1,012 1,033 1,058 1,084 1,112 1,142 TOTAL ASSETS 1,762 1,752 1,748 1,747 1,750 1,758 SHAREHOLDERS' EQUITY
TOTAL SHAREHOLDERS' EQUITY 574 567 564 565 569 577 LIABILITIES
Non-Current Liabilities
Long Term Debt 744 753 762 770 778 785 Other Non-Current Liabilities 70 67 64 61 59 56 Total Non-Current Assets 814 820 826 831 836 841 Current Liabilities
Trade Payables 151 155 160 165 170 175 Borrowing 184 174 166 157 150 143 Other Current Liabilities 40 36 32 28 25 22 Total Current Liabilities 375 365 357 350 344 340 TOTAL LIABILITIES 1,189 1,185 1,183 1,182 1,181 1,181
TOTAL EQUITY AND LIABILITIES 1,762 1,752 1,748 1,747 1,750 1,758
12
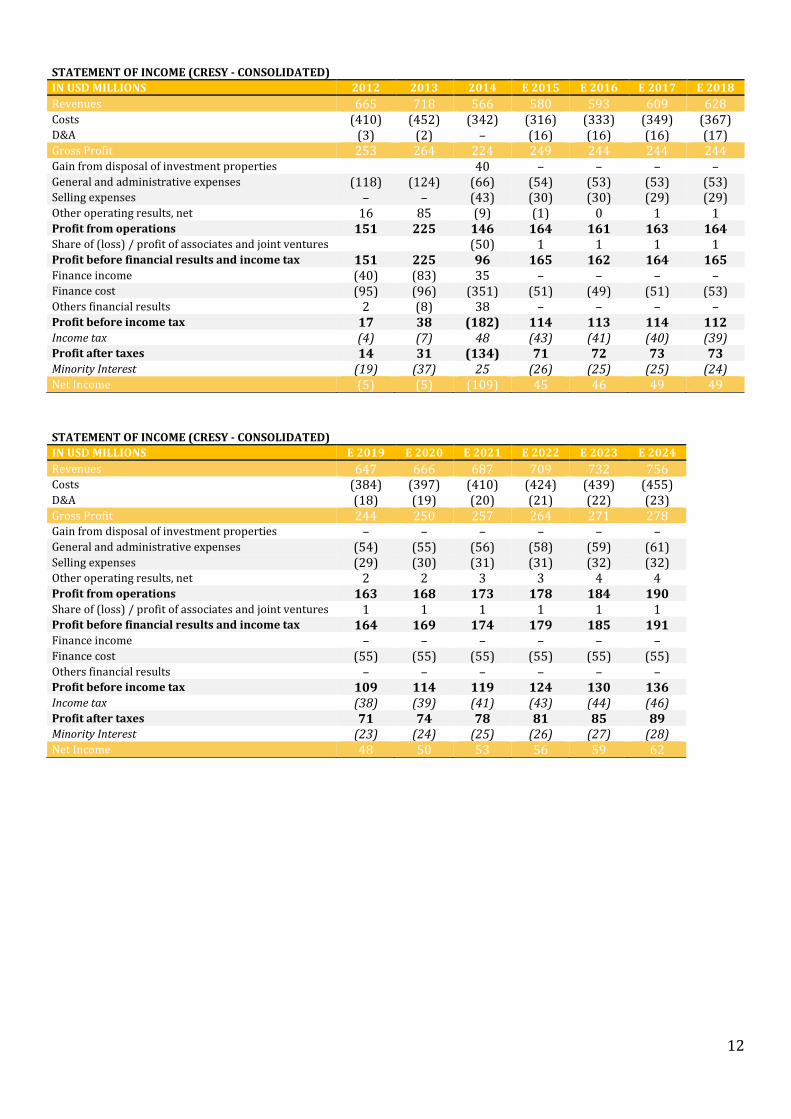
STATEMENT OF INCOME (CRESY - CONSOLIDATED)
IN USD MILLIONS 2012 2013 2014 E 2015 E 2016 E 2017 E 2018
Revenues 665 718 566 580 593 609 628 Costs (410) (452) (342) (316) (333) (349) (367) D&A (3) (2) – (16) (16) (16) (17) Gross Profit 253 264 224 249 244 244 244 Gain from disposal of investment properties
40 – – – –
General and administrative expenses (118) (124) (66) (54) (53) (53) (53) Selling expenses – – (43) (30) (30) (29) (29) Other operating results, net 16 85 (9) (1) 0 1 1 Profit from operations 151 225 146 164 161 163 164 Share of (loss) / profit of associates and joint ventures (50) 1 1 1 1 Profit before financial results and income tax 151 225 96 165 162 164 165 Finance income (40) (83) 35 – – – – Finance cost (95) (96) (351) (51) (49) (51) (53) Others financial results 2 (8) 38 – – – – Profit before income tax 17 38 (182) 114 113 114 112 Income tax (4) (7) 48 (43) (41) (40) (39) Profit after taxes 14 31 (134) 71 72 73 73 Minority Interest (19) (37) 25 (26) (25) (25) (24) Net Income (5) (5) (109) 45 46 49 49
STATEMENT OF INCOME (CRESY - CONSOLIDATED)
IN USD MILLIONS E 2019 E 2020 E 2021 E 2022 E 2023 E 2024
Revenues 647 666 687 709 732 756 Costs (384) (397) (410) (424) (439) (455) D&A (18) (19) (20) (21) (22) (23) Gross Profit 244 250 257 264 271 278 Gain from disposal of investment properties – – – – – – General and administrative expenses (54) (55) (56) (58) (59) (61) Selling expenses (29) (30) (31) (31) (32) (32) Other operating results, net 2 2 3 3 4 4 Profit from operations 163 168 173 178 184 190 Share of (loss) / profit of associates and joint ventures 1 1 1 1 1 1 Profit before financial results and income tax 164 169 174 179 185 191 Finance income – – – – – – Finance cost (55) (55) (55) (55) (55) (55) Others financial results – – – – – – Profit before income tax 109 114 119 124 130 136 Income tax (38) (39) (41) (43) (44) (46) Profit after taxes 71 74 78 81 85 89 Minority Interest (23) (24) (25) (26) (27) (28) Net Income 48 50 53 56 59 62

13
IRSA STATEMENT OF FINANCIAL POSITION (IRS) IN USD MILLIONS 2011 2012 2013 2014 E 2015 E 2016 E 2017
ASSETS
Total Non-Current Assets 1,414.2 1,338.6 1,205.8 842.7 694.3 566.5 481.5 Current Assets
Trading properties 6.4 2.1 2.2 0.6 0.5 0.4 0.3 Inventories 1.7 3.5 3.0 2.1 2.0 2.0 2.0 Restricted assets – – 0.2 – – – – Credits for tax – – – 2.0 1.6 1.3 1.1 Assets for sale – – – 167.0 137.6 112.3 95.4 Trade and other receivables 102.2 105.3 143.0 86.9 100.7 99.3 99.2 Investments in financial assets 15.8 17.5 45.4 28.8 23.7 19.4 16.5 Investment in derivative financial instruments
– – – 1.6 1.3 1.1 0.9
Cash and cash equivalents 73.4 57.3 148.1 75.0 114.7 162.9 202.1 Total Current Assets 199.4 185.7 341.9 364.0 382.2 398.5 417.5 TOTAL ASSETS 1,613.6 1,524.3 1,547.7 1,206.7 1,076.5 965.1 899.0 SHAREHOLDERS' EQUITY
Retained earnings 159.7 113.0 44.5 (63.1) (50.4) (67.0) (67.9) Total capital 669.3 586.1 510.3 281.0 233.1 164.3 128.7 Non-controlling interest 80.7 86.4 71.6 72.9 60.1 49.0 41.7 TOTAL SHAREHOLDERS' EQUITY 750.0 672.5 581.9 353.9 293.2 213.3 170.4 LIABILITIES Non-Current Liabilities
Trade and other payables 36.3 36.9 39.2 24.9 20.5 16.8 14.2 Borrowings 419.8 453.2 543.2 462.0 453.9 467.7 476.8 Deferred income tax liabilities 118.0 91.0 73.6 42.5 35.0 28.6 24.3 Salaries and social security liabilities – – 0.6 0.5 0.4 0.3 0.3 Provisions 3.1 3.9 10.7 25.2 20.8 17.0 14.4 Total Non-Current Liabilities 577.3 585.0 667.4 555.1 530.6 530.3 530.0 Current Liabilities
Trade and other payables 100.8 110.8 125.8 83.5 76.2 77.5 76.3 Income tax liabilities 14.1 23.2 16.9 8.0 6.6 5.3 4.5 Liabilities for sale – – – 99.2 81.7 66.7 56.7 Salaries and social security liabilities 8.3 8.8 9.1 12.2 10.1 8.2 7.0 Derivative financial instruments – – 0.3 1.7 1.4 1.2 1.0 Borrowings 162.4 123.4 143.6 90.7 74.7 61.0 51.8 Provisions 0.8 0.5 2.6 2.3 1.9 1.5 1.3 Total Current Liabilities 286.3 266.8 298.4 297.6 252.6 221.5 198.6 TOTAL LIABILITIES 863.6 851.7 965.8 852.7 783.3 751.7 728.7 EQUITY AND LIABILITIES 1,613.6 1,524.3 1,547.7 1,206.7 1,076.5 965.1 899.0

14
STATEMENT OF FINANCIAL POSITION (IRS)
IN USD MILLIONS E 2018 E 2019 E 2020 E 2021 E 2022 E 2023 E 2024
ASSETS
Total Non-Current Assets 427.1 396.0 367.2 340.5 315.8 292.8 271.5
Current Assets
Trading properties 0.3 0.3 0.2 0.2 0.2 0.2 0.2
Inventories 2.1 2.2 2.2 2.2 2.3 2.3 2.4
Restricted assets – – – – – – –
Credits for tax 1.0 0.9 0.9 0.8 0.7 0.7 0.6
Assets for sale 84.7 78.5 72.8 67.5 62.6 58.0 53.8
Trade and other receivables 100.0 101.8 103.6 105.5 107.5 109.5 111.6
Investments in financial assets 14.6 13.5 12.5 11.6 10.8 10.0 9.3
Investment in derivative financial instruments 0.8 0.7 0.7 0.6 0.6 0.6 0.5
Cash and cash equivalents 245.6 290.3 330.9 371.2 409.9 447.9 485.4
Total Current Assets 449.1 488.2 523.8 559.7 594.5 629.2 663.8
TOTAL ASSETS 876.2 884.3 891.1 900.2 910.3 922.0 935.3
SHAREHOLDERS' EQUITY
Retained earnings (54.7) (26.8) 0.9 28.5 56.0 83.6 111.4
Total capital 119.7 135.0 150.9 167.5 184.9 203.2 222.3
Non-controlling interest 37.0 34.3 31.8 29.5 27.3 25.3 23.5
TOTAL SHAREHOLDERS' EQUITY 156.6 169.2 182.7 197.0 212.3 228.5 245.7
LIABILITIES
Non-Current Liabilities
Trade and other payables 12.6 11.7 10.9 10.1 9.3 8.7 8.0
Borrowings 482.7 486.0 489.1 492.0 494.7 497.1 499.4
Deferred income tax liabilities 21.5 20.0 18.5 17.2 15.9 14.8 13.7
Salaries and social security liabilities 0.2 0.2 0.2 0.2 0.2 0.2 0.1
Provisions 12.8 11.9 11.0 10.2 9.5 8.8 8.1
Total Non-Current Liabilities 529.9 529.8 529.7 529.6 529.6 529.5 529.4
Current Liabilities
Trade and other payables 81.2 84.6 85.4 87.1 88.3 89.6 91.1
Income tax liabilities 4.0 3.7 3.5 3.2 3.0 2.8 2.6
Liabilities for sale 50.3 46.6 43.2 40.1 37.2 34.5 32.0
Salaries and social security liabilities 6.2 5.7 5.3 4.9 4.6 4.2 3.9
Derivative financial instruments 0.9 0.8 0.8 0.7 0.7 0.6 0.6
Borrowings 46.0 42.6 39.5 36.7 34.0 31.5 29.2
Provisions 1.1 1.1 1.0 0.9 0.8 0.8 0.7
Total Current Liabilities 189.7 185.3 178.7 173.6 168.5 164.0 160.1
TOTAL LIABILITIES 719.6 715.1 708.4 703.3 698.0 693.5 689.6
EQUITY AND LIABILITIES 876.2 884.3 891.1 900.2 910.3 922.0 935.3

15
STATEMENT OF INCOME (IRS)
IN USD MILLION 2012 2013 2014 E 2015 E 2016 E 2017 E 2018
Revenues 396 407 350 349 344 344 347 Costs (190) (202) (167) (139) (142) (145) (151) Gross Profit 206 204 183 210 202 199 196 Gain from disposal of investment properties 26 34 29 – – – – General and administrative expenses (39) (36) (37) (34) (33) (33) (34) Selling expenses (19) (20) (18) (17) (17) (17) (17) Other operating results, net (7) 17 (6) – – – – Profit from operations 167 200 152 159 151 148 145 Share of (loss) / profit of associates and joint ventures
3 (1) (51) – – – –
Profit before financial results and income tax 170 199 101 159 151 148 145 Finance cost (117) (144) (212) (42) (39) (41) (43) Profit before income tax 76 80 (71) 118 112 107 103 Income tax (26) (25) 8 (43) (41) (39) (37) Profit for the year 50 55 (63) 75 71 68 65
STATEMENT OF INCOME (IRS)
IN USD MILLION E 2019 E 2020 E 2021 E 2022 E 2023 E 2024
Revenues 353 359 365 372 379 387 Costs (158) (161) (164) (166) (169) (172) Gross Profit 194 198 202 206 210 215 Gain from disposal of investment properties – – – – – – General and administrative expenses (34) (35) (35) (36) (37) (37) Selling expenses (17) (18) (18) (18) (19) (19) Other operating results, net – – – – – – Profit from operations 143 146 148 152 155 158 Share of (loss) / profit of associates and joint ventures
– – – – – –
Profit before financial results and income tax 143 146 148 152 155 158 Finance cost (45) (45) (45) (45) (45) (45) Profit before income tax 98 101 104 107 110 114 Income tax (36) (37) (38) (39) (40) (41) Profit for the year 62 64 66 68 70 72

16
BRASILAGRO (LND) STATEMENT OF FINANCIAL POSITION (LND)
IN USD MILLIONS 2011 2012 2013 2014 E 2015 E 2016 E 2017 E 2018
ASSETS Non-Current Assets
Property, plant and equipment 34.0 23.7 23.1 20.2 22.5 23.3 24.2 25.3 Intangible assets 1.8 1.4 1.2 2.2
Deferred income tax assets 2.0 7.4 11.3 19.7 Trade and other receivables 18.4 17.7 26.6 30.4 30.4 30.4 30.4 30.4 Investments in financial assets 259.6 206.8 160.1 192.0 192.0 192.0 192.0 192.0 Other LT Assets 0.1 0.1 1.5 2.1 – – – – Total Non-Current Assets 315.8 257.1 223.7 266.7 264.5 265.4 266.3 267.4 Current Assets
Inventories 50.5 22.5 13.4 18.8 15.3 16.4 17.6 18.9 Trade and other receivables 24.5 35.2 62.5 31.6 35.6 38.2 41.0 43.7 Investments in financial assets – – 4.1 9.7 9.7 9.7 9.7 9.7 Cash and cash equivalents 86.8 33.6 33.9 39.2 20.6 19.3 18.8 18.4 Others 3.4 17.9 7.7 8.2 8.2 8.2 8.2 8.2 Total Current Assets 165.3 109.1 121.7 107.6 89.5 91.9 95.4 98.9 TOTAL ASSETS 481.1 366.2 345.4 374.2 354.0 357.3 361.7 366.3 SHAREHOLDERS' EQUITY
Capital and reserves attributable to equity holders of the parent Share capital 374.1 290.8 261.8 263.9 263.9 263.9 263.9 263.9 Treasury Stock – – – (0.9) (0.9) (0.9) (0.9) (0.9) Retained earnings (8.9) (9.1) 2.6 (3.1) (2.4) (1.2) 1.0 3.5 Other Equity – (3.4) (1.3) 3.8 3.8 3.8 3.8 3.8 Total capital and reserves attributable to equity holders of the parent 365.2 278.2 263.0 263.8 264.4 265.6 267.8 270.3
Non-controlling interest TOTAL SHAREHOLDERS' EQUITY 365.2 278.2 263.0 263.8 264.4 265.6 267.8 270.3
LIABILITIES Non-Current Liabilities
Borrowings 35.5 25.5 25.5 26.2 26.2 26.2 26.2 26.2 Deferred income tax liabilities 2.9 – 2.6 1.1 1.1 1.1 1.1 1.1 Minority Interest 4.2 – – – – – – – Others 1.3 7.0 2.9 2.1 – – – – Total Non-Current Liabilities 44.0 32.5 31.1 29.3 27.3 27.3 27.3 27.3 Current Liabilities
Trade and other payables 44.0 28.8 26.2 46.1 27.4 29.4 31.6 33.8 Income tax liabilities 0.5 1.5 1.0 2.9 2.9 2.9 2.9 2.9 Current Port. of LT Debt/Capital Leases 24.3 21.4 20.1 28.1 28.1 28.1 28.1 28.1 Provisions 3.1 3.7 3.9 3.9 3.9 3.9 3.9 3.9 Total Current Liabilities 71.9 55.5 51.3 81.1 62.4 64.4 66.6 68.8 TOTAL LIABILITIES 115.9 88.0 82.4 110.4 89.6 91.7 93.9 96.1 TOTAL SHAREHOLDERS' EQUITY AND LIABILITIES 481.1 366.2 345.4 374.2 354.0 357.3 361.7 366.3

17
STATEMENT OF FINANCIAL POSITION (LND)
IN USD MILLIONS E 2019 E 2020 E 2021 E 2022 E 2023 E 2024
ASSETS Non-Current Assets
Property, plant and equipment 26.6 27.7 28.7 29.8 31.2 32.5 Intangible assets
Deferred income tax assets Trade and other receivables 30.4 30.4 30.4 30.4 30.4 30.4 Investments in financial assets 192.0 192.0 192.0 192.0 192.0 192.0 Other LT Assets – – – – – – Total Non-Current Assets 268.7 269.8 270.8 271.9 273.3 274.6 Current Assets
Inventories 19.9 21.0 22.1 23.2 24.5 25.9 Trade and other receivables 46.2 48.7 51.3 53.8 56.9 60.0 Investments in financial assets 9.7 9.7 9.7 9.7 9.7 9.7 Cash and cash equivalents 18.2 18.5 19.1 20.0 20.6 21.6 Others 8.2 8.2 8.2 8.2 8.2 8.2 Total Current Assets 102.3 106.2 110.5 114.9 120.0 125.4 TOTAL ASSETS 371.0 375.9 381.3 386.8 393.2 400.0 SHAREHOLDERS' EQUITY
Capital and reserves attributable to equity holders of the parent Share capital 263.9 263.9 263.9 263.9 263.9 263.9
Treasury Stock (0.9) (0.9) (0.9) (0.9) (0.9) (0.9) Retained earnings 6.2 9.2 12.5 16.1 20.2 24.6 Other Equity 3.8 3.8 3.8 3.8 3.8 3.8 Total capital and reserves attributable to equity holders of the parent 273.0 276.1 279.4 283.0 287.0 291.4 Non-controlling interest
TOTAL SHAREHOLDERS' EQUITY 273.0 276.1 279.4 283.0 287.0 291.4 LIABILITIES
Non-Current Liabilities Borrowings 26.2 26.2 26.2 26.2 26.2 26.2
Deferred income tax liabilities 1.1 1.1 1.1 1.1 1.1 1.1 Minority Interest – – – – – – Others – – – – – – Total Non-Current Liabilities 27.3 27.3 27.3 27.3 27.3 27.3 Current Liabilities
Trade and other payables 35.7 37.6 39.6 41.5 43.9 46.3 Income tax liabilities 2.9 2.9 2.9 2.9 2.9 2.9 Current Port. of LT Debt/Capital Leases 28.1 28.1 28.1 28.1 28.1 28.1 Provisions 3.9 3.9 3.9 3.9 3.9 3.9 Total Current Liabilities 70.7 72.6 74.6 76.5 78.9 81.3 TOTAL LIABILITIES 98.0 99.9 101.9 103.8 106.2 108.6 TOTAL SHAREHOLDERS' EQUITY AND LIABILITIES 371.0 375.9 381.3 386.8 393.2 400.0

18
STATEMENT OF INCOME (LND)
IN USD MILLIONS 2012 2013 2014 E 2015 E 2016 E 2017 E 2018
Revenues 80.8 95.2 61.6 66.6 71.3 76.5 81.7 Costs (76.3) (84.4) (61.0) (59.9) (63.7) (67.5) (72.3) Gross Profit 4.5 10.9 0.5 6.7 7.6 9.1 9.5 Gains from disposal of investment properties
6.5 24.7 4.9 – – – –
General and administrative expenses (18.4) (18.5) (16.6) (6.3) (6.3) (6.4) (6.4) Other operating results, net 0.0 (3.8) (0.8) 1.4 1.4 1.4 1.5 Profit from operations (7.4) 13.2 (12.0) 1.7 2.7 4.1 4.5 Finance income – 5.9 17.5 Finance cost (3.5) (4.1) (4.7) (0.8) (0.8) (0.8) (0.8) Others financial results – (2.1) (13.5) – – – – Profit before income tax (10.9) 12.9 (12.6) 0.9 1.9 3.3 3.7 Income tax 7.2 1.2 6.8 (0.3) (0.6) (1.1) (1.3) Profit after taxes (3.7) 14.1 (5.8) 0.6 1.2 2.2 2.5 Minority Interest 0.6 – – – – – – Net Income (3.1) 14.1 (5.8) 0.6 1.2 2.2 2.5
STATEMENT OF INCOME (LND)
IN USD MILLIONS E 2019 E 2020 E 2021 E 2022 E 2023 E 2024
Revenues 86.3 91.0 95.9 100.5 106.3 112.1 Costs (76.2) (80.1) (84.4) (88.3) (93.1) (98.0) Gross Profit 10.1 10.9 11.5 12.2 13.2 14.0 Gains from disposal of investment properties
– – – – – –
General and administrative expenses (6.8) (7.2) (7.5) (7.9) (8.3) (8.8) Other operating results, net 1.6 1.7 1.8 1.9 2.0 2.1 Profit from operations 4.9 5.4 5.8 6.2 6.9 7.4 Finance income Finance cost (0.8) (0.8) (0.8) (0.8) (0.8) (0.8) Others financial results – – – – – – Profit before income tax 4.2 4.6 5.0 5.5 6.1 6.6 Income tax (1.4) (1.6) (1.7) (1.9) (2.1) (2.3) Profit after taxes 2.7 3.0 3.3 3.6 4.0 4.4 Minority Interest – – – – – – Net Income 2.7 3.0 3.3 3.6 4.0 4.4

19
CRESUD ALONE (ARG & BOL) STATEMENT OF FINANCIAL POSITION (CRESY - AGRO) IN USD MILLIONS 2012 2013 2014 E 2015 E 2016 E 2017 E 2018
ASSETS Total Non-Current Assets 199 124 164 136 113 99 90 Current Assets
Biological Assets 20 (19) 21 6 7 8 8 Inventories 31 21 28 15 18 20 21 Income Tax Assets 12 23 26 23 20 14 7 Trade and other receivables 29 31 34 31 33 35 37 Cash and cash equivalents 534 723 500 465 428 408 368 Total Current Assets 626 779 609 541 506 484 442 TOTAL ASSETS 825 903 773 677 619 582 531 SHAREHOLDERS' EQUITY
TOTAL SHAREHOLDERS' EQUITY 568 555 382 308 248 210 157 LIABILITIES
Non-Current Liabilities Trade and other payables – – – – – – –
Borrowings 144 214 173 190 219 238 250 Deferred income tax liabilities – – – – – – – Salaries and social security liabilities – – – – – – – Provisions – – – – – – – Total Non-Current Liabilities 144 214 173 190 219 238 250 Current Liabilities
Trade and other payables 23 33 31 24 26 28 30 Income tax liabilities – – – – – – – Salaries and social security liabilities – – – – – – – Derivative financial instruments – – – – – – – Borrowings 90 101 187 154 126 107 95 Provisions – – – – – – – Total Current Liabilities 113 134 218 179 152 135 125 TOTAL LIABILITIES 257 348 391 369 371 373 374 TOTAL SHAREHOLDERS' EQUITY AND LIABILITIES 825 903 773 677 619 582 531
STATEMENT OF FINANCIAL POSITION (CRESY - AGRO) IN USD MILLIONS E 2019 E 2020 E 2021 E 2022 E 2023 E 2024
ASSETS Total Non-Current Assets 86 82 78 75 72 70 Current Assets
Biological Assets 8 9 9 10 10 11 Inventories 22 23 24 26 27 28 Income Tax Assets 1 – – – – – Trade and other receivables 39 40 42 44 46 48 Cash and cash equivalents 351 331 312 295 280 267 Total Current Assets 421 403 388 374 363 353 TOTAL ASSETS 507 485 466 450 435 423 SHAREHOLDERS' EQUITY
TOTAL SHAREHOLDERS' EQUITY 132 109 88 70 54 40 LIABILITIES
Non-Current Liabilities Trade and other payables – – – – – –
Borrowings 257 263 269 275 280 284 Deferred income tax liabilities – – – – – – Salaries and social security liabilities – – – – – – Provisions – – – – – – Total Non-Current Liabilities 257 263 269 275 280 284 Current Liabilities
Trade and other payables 31 32 33 35 36 38 Income tax liabilities – – – – – – Salaries and social security liabilities – – – – – – Derivative financial instruments – – – – – – Borrowings 88 82 76 70 65 60 Provisions – – – – – – Total Current Liabilities 119 114 109 105 102 98 TOTAL LIABILITIES 376 377 378 380 381 383 TOTAL SHAREHOLDERS' EQUITY AND LIABILITIES 507 485 466 450 435 423

20
STATEMENT OF INCOME (CRESY - AGRO) IN ARS THOUSANDS 2012 2013 2014 E 2015 E 2016 E 2017 E 2018
Revenues 151.4 130.9 156.7 164.8 177.6 188.9 199.6 Costs (126.9) (117.4) (124.9) (132.7) (143.2) (152.7) (161.1) Gross Profit 24.6 13.5 31.8 32.1 34.4 36.2 38.5 Gain from disposal of investment properties 5.0 6.6 1.9 – – – – General and administrative expenses (18.9) (14.1) (19.1) (13.7) (13.5) (13.0) (12.7) Selling expenses (17.8) (19.7) (19.0) (14.3) (14.2) (13.7) (13.4) Other operating results, net (9.3) (4.0) (2.8) (2.3) (2.6) (2.8) (3.0) Profit from operations (16.5) (17.6) (7.1) 1.8 4.1 6.8 9.4 Share of (loss) / profit of associates and joint ventures 0.9 0.9 1.0 0.9 1.0 1.1 1.1 Profit before financial results and income tax (15.6) (16.8) (6.2) 2.7 5.1 7.8 10.5 Finance income – – – – – – – Finance cost (18.4) (21.3) (22.8) (9.1) (8.6) (9.0) (9.4) Others financial results – – – – – – – Profit before income tax (34.0) (38.1) (28.9) (6.4) (3.6) (1.1) 1.2 Income tax – – – – – – (0.4) Profit for the year (34.0) (38.1) (28.9) (6.4) (3.6) (1.1) 0.8
STATEMENT OF INCOME (CRESY - AGRO) IN ARS THOUSANDS E 2019 E 2020 E 2021 E 2022 E 2023 E 2024
Revenues 207.9 216.4 226.0 235.9 246.1 256.7 Costs (167.8) (174.7) (182.4) (190.5) (198.7) (207.2) Gross Profit 40.0 41.7 43.5 45.4 47.4 49.5 Gain from disposal of investment properties – – – – – – General and administrative expenses (12.9) (13.2) (13.5) (13.8) (14.1) (14.5) Selling expenses (13.7) (14.1) (14.4) (14.8) (15.1) (15.5) Other operating results, net (3.0) (3.0) (3.0) (3.0) (3.0) (3.0) Profit from operations 10.4 11.4 12.6 13.9 15.1 16.5 Share of (loss) / profit of associates and joint ventures 1.2 1.2 1.3 1.4 1.4 1.5 Profit before financial results and income tax 11.6 12.6 13.9 15.2 16.6 18.0 Finance income – – – – – – Finance cost (9.8) (9.8) (9.8) (9.8) (9.8) (9.8) Others financial results – – – – – – Profit before income tax 1.8 2.8 4.1 5.4 6.8 8.2 Income tax (0.6) (1.0) (1.4) (1.9) (2.4) (2.9) Profit for the year 1.1 1.8 2.7 3.5 4.4 5.3

21
Appendix 2: DCF to Firm IRSA Return on Equity: Based on the Capital Asset Pricing Model (CAPM); Risk free rate: the average yield for the US 10 year treasury bonds for the last fifty years (Damodaran). Market Return: the market return of the S&P500 (Damodaran). Beta: we used a beta of 1.51, according to market data extracted from Thomson Reuters Eikon. We also incorporated a premium for country risk in the cost of equity, given the high exposure to Argentina. Cost of Debt: IRSA currently holds 80% if its debt in USD, at a fixed average 9.13% rate.
Discounted Cash Flow to Firm (IRS)
IN USD MILLIONS E 2015 E 2016 E 2017 E 2018 E 2019
EBIT 159.1 151.5 148.3 145.3 142.8 D&A 27.5 23.5 21.0 19.6 19.0 Investment in WC (21.9) (2.1) (4.7) 1.1 0.1 Income tax paid (57.8) (55.0) (53.9) (52.8) (51.8)
Net cash generated by operating activities 106.8 117.9 110.7 113.2 110.1
Net cash used in investing activities (27.5) (23.5) (21.0) (19.6) (19.0)
FCF to Firm USD 79.4 94.4 89.7 93.7 91.1
Terminal Value – – – – –
WACC 11.3% 11.3% 11.3% 11.3% 11.3%
IN USD MILLIONS E 2020 E 2021 E 2022 E 2023 E 2024
EBIT 145.5 148.5 151.6 154.9 158.3
D&A 18.5 18.0 17.6 17.1 16.7
Investment in WC (2.5) (1.7) (2.3) (2.3) (2.3)
Income tax paid (52.8) (53.9) (55.0) (56.2) (57.5)
Net cash generated by operating activities 108.7 110.9 111.8 113.4 115.2
Net cash used in investing activities (18.5) (18.0) (17.6) (17.1) (16.7)
FCF to Firm USD 90.2 92.9 94.2 96.3 98.6
Terminal Value – – – – 1,082
WACC 11.3% 11.3% 11.3% 11.3% 11.3%
IN U$D MILLIONS
Value of IRSA related to cash generating assets 900
Present value of Debt in USD related to cash generating assets 529
Present value of Equity related to cash generating assets 371
Value of non-cash generating assets 359
Value of Banco Hipotecario SA 88
Total 819
No. Of Common Shares Outstanding 579
Price per ten Common Shares (ADR) 14.14
Source: Team estimations
Key assumptions for WACC estimation (IRS)
Component Value Source
Risk Free Rate 2.4% Reuters Eikon
Market Return 9.1% Damodaran estimation published on web site – S&P500
Beta 1.51 Reuters Eikon
Country Risk 6.6% JPMorgan's EMBI+ as of 7 november
Cost of Equity (ke) 19.1% Team estimations
Tax 36.3% Company data
Cost of Debt (kd) 9.1% Company data
Capital Structure (D/(D+E)) 64.3% Company explicited that they aim to maintain current Capital Structure
WACC for first year 11.29% Team estimations

22
BRASILAGRO (LND) Discounted Cash Flow to Firm (IRS)
IN USD MILLIONS E 2015 E 2016 E 2017 E 2018 E 2019 EBIT 1.7 2.7 4.1 4.5 4.9 D&A 10.2 10.4 10.1 10.9 11.4 Investment in WC (19.3) (1.6) (1.8) (1.8) (1.6) Income tax paid (0.3) (0.6) (1.1) (1.3) (1.4) Cash Flow from Operations (7.7) 10.8 11.3 12.4 13.3 Cash Flow from Investments (10.2) (11.3) (11.0) (12.0) (12.7) FCF to Firm U$S (17.9) (0.5) 0.2 0.4 0.6 Terminal Value – – – – – WACC 3.9% 3.9% 3.9% 3.9% 3.9%
IN USD MILLIONS E 2020 E 2021 E 2022 E 2023 E 2024
EBIT 5.4 5.8 6.2 6.9 7.4 D&A 11.9 12.4 12.9 13.3 14.0 Investment in WC (1.6) (1.7) (1.6) (2.1) (2.0) Income tax paid (1.6) (1.7) (1.9) (2.1) (2.3) Cash Flow from Operations 14.0 14.8 15.6 16.1 17.1
Cash Flow from Investments (12.9) (13.5) (13.9) (14.7) (15.3)
FCF to Firm U$S 1.1 1.3 1.7 1.4 1.8
Terminal Value – – – – 95.6
WACC 3.9% 3.9% 3.9% 3.9% 3.9%
IN U$D MILLIONS
Value of BrasilAgroSA related to cash generating assets 54
Present value of Debt in USD related to cash generating assets 46
Present value of Equity related to cash generating assets 8
Value of non-cash generating assets 10
Total 18
No. Of Common Shares Outstanding 6
Price per ten Common Shares (ADR) 3.11
Source: Team estimations
Key assumptions for WACC estimation (IRS)
Component Value Source
Risk Free Rate 2.4% Reuters Eikon
Market Return 9.1% Damodaran estimation published on web site – S&P500
Beta 1.6 Reuters Eikon
Country Risk 2.5% JPMorgan's EMBI+ as of …
Cost of Equity (ke) 15.5% Team estimations
Tax 34.0% Company data
Cost of Debt (kd) 2.7% Company data
Capital Structure (D/(D+E)) 84.6% Company explicited that they aim to maintain current Capital Structure
WACC 3.87% Team estimations

23
CRESUD ALONE (ARG & BOL) Discounted Cash Flow to Firm (IRS)
INUSD MILLIONS E 2015 E 2016 E 2017 E 2018 E 2019 EBIT 2.7 5.1 7.8 10.5 11.6 D&A 3.4 2.9 2.9 2.4 2.3 Investment in WC 15.6 (8.4) (7.6) (6.5) (4.3) Income tax paid (2.3) (1.2) 3.4 4.5 4.8 Net cash generated by operating activities 19.4 (1.6) 6.4 10.9 14.3 Net cash used in investing activities (4.9) (4.8) (5.4) (4.5) (4.9) FCF to Firm U$S 14.5 (6.4) 1.1 6.5 9.4 Terminal Value – – – – – WACC 3.5% 3.5% 3.5% 3.5% 3.5%
IN USD MILLIONS E 2020 E 2021 E 2022 E 2023 E 2024
EBIT 12.6 13.9 15.2 16.6 18.0
D&A 2.2 2.1 2.0 2.0 1.9
Investment in WC (4.4) (4.9) (5.0) (5.3) (5.4)
Income tax paid 0.4 (1.4) (1.9) (2.4) (2.9)
Net cash generated by operating activities 10.9 9.7 10.3 10.9 11.6
Net cash used in investing activities (5.1) (4.3) (4.8) (4.4) (4.4)
FCF to Firm U$S 5.8 5.5 5.6 6.4 7.1
Terminal Value – – – – 471
WACC 3.5% 3.5% 3.5% 3.5% 3.5%
IN U$D MILLIONS
Value of CRESY-AGRO related to cash generating assets 378
Present value of Debt in USD related to cash generating assets 345
Present value of Equity related to cash generating assets 33
Value of non-cash generating assets 74
Total 107
Source: Team estimations
Key assumptions for WACC estimation (IRS) Component Value Source
Risk Free Rate 2.4% Reuters Eikon
Market Return 9.1% Damodaran estimation published on web site – S&P500
Beta 1.59 Reuters Eikon
Country Risk 6.6% JPMorgan's EMBI+ as of …
Cost of Equity (ke) 19.6% Team estimations
Tax 35.0% Company data
Cost of Debt (kd) 3.1% Company data
Capital Structure (D/(D+E)) 91.2% Company explicited that they aim to maintain current Capital Structure
WACC for first year 3.5% Team estimations

24
Appendix 3: Land Reserves’ Valuation IRSA
Project Santa María del Plata…
Market Value of Santa María del Plata land
Price per sqm in USD 500
Total sqmts 714,951
Market Value of Santa María in USD THOU 338,775
Source: Team estimations from data provided by company and competitors.
…and possible Upside
YEAR Y1 Y2 Y3 Y4 Y5 Y6 Y7 Y8
% of Project Built per year (128,800) (128,800) (128,800) (128,800) (128,800) (128,800) (128,800) (128,800)
% of Project Sold per year – – – 644,000 644,000 644,000 644,000 644,000
FCF (128,800) (128,800) (128,800) 515,200 515,200 515,200 515,200 515,200
Y9 Y10 Y11 Y12 Y13 Y14 Y15
(128,800) (128,800) – – – – –
644,000 644,000 644,000 644,000 644,000 644,000 644,000
515,200 515,200 644,000 644,000 644,000 644,000 644,000
Market Value of Santa María del Plata land RELEVANT DATA
Project value at year 0 1,114,440 Cost per sqm in USD 0.500
WACC 20% Price pero sqm in USD 3.000
Total Sqm for construction 2,576,000
Project starts in 2016 (75%) $ 93,306
Project starts in 2020 (25%) $ 580,437
Value if Project is developed in USD THOU $ 673,743
Source: Team estimations from data provided by company and competitors.
BrasilAgro
LAND VALUATION: Non cash-generating assets
Jerovia
Undeveloped Land (Has) 34,747
Avg. Price (USD/Has) 283.33
Average Market Value (in k USD) 9,844.98
Total Non cash-generating assets 9,844.98

25
CRESUD ALONE (ARG&BOL)
LAND VALUATION: Non cash-generating assets
El Recreo
Book Value (in K USD) 148
Undeveloped Land (Has) 12,395
Average Price (USD/Has) 466.67
Average Market Value (in k USD) 5,784.33
Net Market Value (in K USD) 5,636.45
Los Pozos
Book Value (in K USD) 16,279.06
Los Pozos (undeveloped land) 180,908
Average Price (USD/Has) 466.67
Average Market Value (in k USD) 84,423.73
Net Market Value (in K USD) 68,144.67
Total Non cash-generating assets (in K USD)
73,781.13
Appendix 4: BHSA’s Multiple Valuation
2003 2004 2005 2006 2007 2008 2009 2010 2011 2012 2013
BHIP P/B 0.670 0.742 0.737 1.200 1.190 0.283 0.739 1.471 0.628 0.537 0.677
ROE 0.164 0.153 0.121 0.144 0.031 (0.009) 0.073 0.068 0.081 0.103 0.115
Financials P/B mean 1.466 1.395 1.413 2.032 1.624 0.730 1.422 2.321 1.064 0.987 1.336
ROE mean (0.337) 0.034 (0.024) 0.136 0.119 0.174 0.283 0.298 0.306 0.301 0.311 Mean
Dif. P/B dif. 0.796 0.653 0.676 0.832 0.435 0.447 0.683 0.850 0.436 0.450 0.659 0.626
REO dif. (0.501) (0.120) (0.145) (0.008) 0.088 0.183 0.210 0.230 0.225 0.198 0.196 0.096
BGAL P/B 1.359 1.462 1.394 1.643 1.353 0.688 0.885 1.919 1.015 0.940 1.752
ROE (0.143) (0.087) 0.148 (0.095) 0.020 0.105 0.084 0.199 0.357 0.306 0.315
BRIO P/B 1.558 1.141 1.573 2.107 1.956 0.994 1.773 3.182 1.370 1.254 1.596
ROE (0.675) 0.047 (1.001) 0.199 0.196 0.200 0.463 0.461 0.390 0.342 0.292
BFRA P/B 1.240 1.314 1.272 1.558 1.303 0.609 1.204 1.988 1.102 1.201 1.525
ROE (0.193) (0.034) 0.067 0.096 0.117 0.156 0.287 0.359 0.264 0.281 0.329
BMACRO P/B 1.706 1.662 – 2.819 1.968 0.905 2.001 2.852 1.039 0.841 1.090
ROE – 0.079 0.338 0.188 0.153 0.227 0.319 0.229 0.268 0.282 0.332
BPAT P/B – – – – 1.542 0.453 1.248 1.662 0.796 0.697 0.719
ROE – 0.163 0.328 0.291 0.109 0.182 0.263 0.243 0.251 0.296 0.286
P/B financials 2013
1.336
Mean Dif. 0.626
Adjusted P/B 0.711
According to Damodaran (2009), one possible approach to the valuation of Financial Service Firms is the multiples approach. At first sight Banco Hipotecario seemed, if compared to its peers, to have a very low Price to Book ratio. On 2013, for example BHSA showed a ratio of 0.677x while the rest of the industry showed a ratio of 1.336x. Using this multiple in order to valuate BHSA would result in a value too far from the market. Nonetheless a deeper insight reveals that the presence of the government as a major shareholder could be an explanatory factor in this difference (the bank possesses assets of...). A historical analysis shows that BHSA has consistently presented a lower value than the rest of the industry. The difference ranged (as shown in the table above) from 0.40x to 0.80x, and had a mean value of 0.626x in the period 2003-2012. By subtracting this mean difference from the value of the whole Industry in 2013, we arrived at an adjusted P/B of 0.711 for BHSA.

26
Appendix 5: Warrants Valuation Warrants were valued by applying a usual 10-step binomial tree. They have very little effect on the valuation as they represent a 0.2% of the value before its incorporations. The next table shows information used for each issue, which was taken from the Financial Statements of the Company as of June, 2014.
Warrants and buy Option of BrasilAgro
Price in RS
Quant. of Options
Value of Options
Exchange rate
Value in USD THOU
Buy options
First issue 7.49 301.8 2,260.8 2.55 886.6
Second issue 2.25 315.5 709.8 2.55 278.4
Third issue 2.16 261.0 563.7 2.55 221.0
Warrants
First issue 3.88 2.6 9.9 2.55 3.9
Total value (in USD THOU)
1,389.9
Source: Team estimations

27
Appendix 6: Cresud’s Value Corroboration by Multiples Market Cap EV Avg. EBITDA 3yrs EV/EBITDA Relative Weight
Argentina
1 Edenor 418 570 84 6.79 1.26% 2 Nortel Invesora 913 143 1,290 0.11 2.76% 3 Pampa Energia 99 1,307 126 10.37 0.30% 4 Petrobras Argentina S.A. 2,075 2,125 545 3.90 6.28% 5 Telecom Argentina 3,498 2,814 1,418 1.98 10.58% 6 Ternium 4,412 7,391 1,475 5.01 13.34% 7 Transportadora de Gas del Sur 402 580 189 3.07 1.22% 8 YPF 21,250 24,215 3,666 6.61 64.26%
EV/EBITDA weighted avg. 5.53
Brasil
1 Braskem 4,995 10,726 2,067 5.19 1.82%
2 BRF S.A. 22,090 24,176 1,450 16.67 8.04%
3 Comp. Paranaense de Energia-COPEL 3,262 2,938 946 3.11 1.19%
4 Companhia Brasileira de Distribuicao-CBD 11,450 13,260 1,780 7.45 4.17%
5 Companhia Energetica de Minas Gerais-CEMIG 7,666 10,219 1,107 9.23 2.79%
6 Companhia Siderurgica Nacional-CSN 4,811 11,186 2,306 4.85 1.75%
7 CPFL Energia 7,522 12,990 1,356 9.58 2.74%
8 Embraer 7,391 7,592 817 9.29 2.69%
9 Fibria Celulose 6,776 9,494 1,390 6.83 2.47%
10 Gerdau 7,554 12,972 2,378 5.46 2.75%
11 Gol 1,479 2,689 276 9.74 0.54%
12 Oi 2,460 21,497 3,360 6.40 0.90%
13 Petroleo Brasileiro-Petrobras 80,985 179,941 31,747 5.67 29.48%
14 Sabesp 5,570 8,358 1,884 4.44 2.03%
15 Telefonica Brasil 22,023 21,485 5,059 4.25 8.02%
16 TIM Participacoes 13,292 13,041 2,488 5.24 4.84%
17 Ultrapar 12,638 12,775 1,267 10.08 4.60%
18 Vale 52,785 71,689 21,665 3.31 19.21%
EV/EBITDA weighted
avg. 6.52
Market Cap EV Avg. EBITDA 3yrs EV/EBITDA
CRESUD 835 1,917 245 7.82
ARG 767 91.8%
BR 68 8.2% -> CRESUD's stake in BrasilAgro
EV/EBITDA
3y avg. EBITDA 245M
ARG/BR xEBITDA 5.61
Market Value 1.372M
- Net Debt (796)M
Enterprise value 576M
@ 561M Fully diluted Shares
Price for ongoing activities 10.30
@ 501M Shares outstanding
Price for ongoing activities 11.48
Source: Team estimations based on Company´s public releases (Investor´s presentation)

28
Appendix 7: Organizational Structure and Share Ownership as of June 2014
Source: Financial Statements of the Company as of June 30, 2014
Appendix 8: Cresud’s History
Source: Company data
Appendix 9: Cresud’s Board of Directos as of June 2014
Name Date of birth Position / Role In office since Until Eduardo S. Elsztain 26/01/1960 President 1994 2014 Saúl Zang 30/12/1945 VP 1° 1994 2014 Alejandro G. Elsztain 31/03/1966 VP 2° and CEO 1994 2016 Gabriel A. G. Reznik 18/11/1958 Director 2003 2015 Jorge O. Fernández 08/01/1939 Director 2003 2015 Fernando A. Elsztain 04/01/1961 Director 2004 2016 David A. Perednik 15/11/1957 Director and AdmMgr. 2004 2016 Pedro D. Labaquie Palacio 22/02/1943 Director 2006 2015 Daniel E. Mellincovsky 17/01/1948 Director 2008 2014 Alejandro C. Casaretto 15/10/1952 Director 2008 2014 Salvador D. Bergel 17/04/1932 Alternate Director 1996 2014 Gastón A. Lernoud 04/06/1968 Alternate Director 1999 2014 Enrique Antonini 16/03/1950 Alternate Director 2007 2016 Eduardo Kalpakian 03/03/1964 Alternate Director 2007 2016
Source: Financial Statements of the Company as of June 30, 2014

29
Appendix 10: IRSA’s Board of Directors as of June 2014
Name Date of birth Position / Role In office since Until
Eduardo S. Elsztain 26/01/1960 President 1991 2015
Saúl Zang 30/12/1945 VP 1° 1994 2015
Alejandro G. Elsztain 31/03/1966 VP 2° 2001 2013
Fernando A. Elsztain 04/01/1961 Director 1999 2014
Carlos Ricardo Esteves 25/05/1949 Director 2005 2014
Cedric D. Bridger 09/11/1935 Director 2003 2015
Marcos Fischman 09/04/1960 Director 2003 2015
Fernando Rubín 20/06/1966 Director 2004 2013
Gary S. Gladstein 07/07/1944 Director 2004 2013
Mario Blejer 11/06/1948 Director 2005 2014
Mauricio Wior 23/10/1956 Director 2006 2015
Gabriel A. G. Reznik 18/11/1958 Director 2008 2014
Ricardo H. Liberman 18/12/1959 Director 2008 2014
Daniel Ricardo Elsztain 22/12/1972 Director 2007 2013
Salvador D. Bergel 17/04/1932 Alternate Director 1996 2014
Enrique Antonini 16/03/1950 Alternate Director 2007 2013
Source: Financial Statements of the Company as of June 30, 2014
Appendix 11: Cross Management Analysis
Member Company Position Since
Alejandro G. Elsztain Cresud CEO/Director 1994
IRSA Director 2001 Carlos Blousson Cresud COO 2008
David A. Perednik Cresud
AdmMgr/ 1997 Director 2004
IRSA AdmMgr 2002
MatiasGaivironsky Cresud
CFO 2011 IRSA
Eduardo S. Elsztain IRSA CEO/Chairman 1991
Cresud Chairman 1994
Daniel R. Elsztain IRSA COO/ 2012
Director 2007 Jorge Cruces IRSA Real Estate Mgr 2007
Source: Team analysis

30
Appendix 12: Urban Properties Breakdown as of June 2014
Property (Location) GLA (m2) Stores Ownership
(IRSA) Occupancy
Shopping Malls
Alto Palermo Shopping (CABA) 19.354 145 100,0% 98,9%
Abasto Shopping (CABA) 38.026 170 100,0% 99,4%
Alto Avellaneda (GBA) 36.565 141 100,0% 99,5%
Paseo Alcorta (CABA) 15.113 107 100,0% 99,8%
Patio Bullrich (CABA) 11.738 83 100,0% 99,6%
Alto Noa Shopping (Salta) 19.157 89 100,0% 99,7%
Buenos Aires Design (CABA) 14.592 63 53,7% 92,3%
Alto Rosario Shopping (Sta.Fe) 29.516 144 100,0% 97,0%
Mendoza Plaza Shopping (MDZ) 41.108 146 100,0% 95,0%
Córdoba Shopping (CDBA) 46.707 153 100,0% 99,7%
DotBaires Shopping (CABA) 15.881 106 80,0% 99,8%
Soleil (GBA) 15.190 78 100,0% 100,0%
La Ribera Shopping (Sta.Fe) 8.285 50 50,0% 99,6%
Total Shopping Malls 311.232 1.475 98,4%
Offices
Edificio República 19.884 100,0% 94,0%
Torre Bankboston 14.873 100,0% 100,0%
Bouchard 551 7.592 100,0% 100,0%
Intercontinental Plaza 22.535 100,0% 100,0%
Bouchard 710 15.044 100,0% 99,8%
Dique IV, Juana Manso 295 11.298 100,0% 94,4%
Maipú 1300 7.655 100,0% 87,3%
Libertador 498 620 100,0% 100,0%
Suipacha 652/64 11.453 100,0% 100,0%
DotBuilding 11.242 96,0% 100,0%
OtherOffices 274 100,0% N/A
Subtotal Offices 122.470 97,5%
Otherproperties
Inmuebles Comerciales 312 N/A N/A
Santa María del Plata S.A. 60.100 100,0% 100,0%
Nobleza Picardo 45.587 50,0% 100,0%
OtherProperties 17.448 N/A 100,0%
Subtotal OtherProperties 123.447 99,7%
Total Offices and Others 245.917 98,6%
Hotels Rooms Ownership
(IRSA) Occupancy
Intercontinental 309 76,3% 70,5%
Sheraton Libertador 200 80,0% 76,5%
LlaoLlao 205 50,0% 58,6%
Bariloche Lands N/A 50,0% N/A
Total 714 68,8%
Source: Financial Statements of the Company as of June 30, 2014

31
Appendix 13: Farmland Breakdown as of June 2014
Farmland Location has MainActivities
La Adela Buenos Aires (ARG) 1.054 Agriculture
El Recreo Catamarca (ARG) 12.395 Land Reserve
Los Pozos Salta (ARG) 239.639 Cattle / Agriculture / Land reserve
San Nicolás Santa Fe (ARG) 1.431 Agriculture
Las Playas Córdoba (ARG) 1.534 Agriculture / Milk
La Gramilla / Santa Bárcara San Luis (ARG) 7.072 Agriculture
La Suiza Chaco (ARG) 36.380 Agriculture / Cattle
La Esmeralda Santa Fe (ARG) 9.370 Agriculture / Cattle
El Tigre La Pampa (ARG) 8.369 Agriculture / Milk
El Invierno La Pampa (ARG) 1.946 Agriculture
San Pedro Entre Rios (ARG) 6.022 Agriculture
8 de Julio / Estancia Carmen Santa Cruz (ARG) 100.911 Wool
Cactus Argentina San Luis (ARG) 171 Feedlot
Las Vertientes Córdoba (ARG) 4 Storage
La Esperanza La Pampa (ARG) 980 Agriculture
Las Londras Bolivia 4.566 Agriculture
San Ceyetano Bolivia 883 Agriculture
San Rafael Bolivia 2.969 Agriculture
La Fon Fon Bolivia 1.643 Agriculture
La Primavera Bolivia 2.340 Agriculture
Cuatro Vientos Bolivia 2.658 Agriculture
Jerovia Paraguay 40.495 Agriculture / Land Reserve
Finca Mendoza Mendoza (ARG) 389 Land Reserve
Cremaq Brazil 27.807 Agriculture
Jatoba Brazil 31.606 Agriculture
Alto Taquari Brazil 5.186 Agriculture
Araucaria Brazil 9.288 Agriculture
Chaparral Brazil 37.182 Agriculture
Nova Buruti Brazil 24.247 Forestry
Preferencia Brazil 17.799 Cattle
Subtotal Owned 636.336
Agropecuaria Anta SA Salta (ARG) 132.000
Subtotal Concessioned 132.000
Total 768.336
Source: Financial Statements of the Company as of June 30, 2014

32
Appendix 14: Main Indicators for the Last Three Fiscal Years for Rural Land
Description FY2014 FY2013 FY2012 %
Revenues
Corn 179.894 271.144 224.114 -33,7%
Soy 222.051 208.814 251.639 6,3%
Wheat 11.359 10.735 20.746 5,8%
Sorghum 3.843 5.807 8.497 -33,8%
Sunflower 9.745 10.551 18.095 -7,6%
Others 6.508 14.052 11.519 -53,7%
Sugarcane 675.670 1.179.877 636.335 -42,7%
Total CornRevenues (tons) 1.109.070 1.700.980 1.170.945 -34,8%
Total MeatRevenues (tons) 9.275 10.180 15.502 -8,9%
Total Milk Revenues (thousand of litres) 18.787 17.870 16.267 5,1%
Production
Corn 86.300 107.257 143.639 -19,5%
Soy 241.204 220.293 193.554 9,5%
Wheat 12.373 4.505 18.200 174,7%
Sorghum 4.058 2.848 7.513 42,5%
Sunflower 5.884 12.437 14.524 -52,7%
Others 1.939 8.051 8.887 -75,9%
Sugarcane 657.547 1.156.848 576.048 -43,2%
Total CornProduction (tons) 1.009.305 1.512.239 962.365 -33,3%
Total MeatProduction (tons) 7.380 8.196 9.329 -10,0%
Total Milk Production (thousand of litres) 19.320 18.459 16.563 4,7%
Exploitedland (has)
CornOwnedland 122.632 127.952 127.793 -4,2%
Leasedland 58.030 45.624 44.508 27,2%
Concessionedland 20.986 8.937 8.778 134,8%
Owned land leased to 3rd parties 7.616 18.223 23.595 -58,2%
MeatOwnedland 76.611 78.418 83.360 -2,3%
Leasedland 18.549 12.635 12.635 46,8%
Owned land leased to 3rd parties 5.495 13.371 1.943 -58,9%
MilkOwnedland 2.864 2.780 3.022 3,0%
WoolOwnedland 85.000 85.000 85.000 0,0%
Land Reserves (has)
Ownedland 144.704 148.508 350.063 -2,6%
Concessionedland 48.249 48.249 109.617 0,0%
Wateringland (has)
Ownedland 3.052 2.531 2.218 20,6%
Owned land leased to 3rd parties 1.250 1.367 1.626 -8,6%
Storage Capacity (has)
Ownedplants 98.500 98.500 98.500 0,0%
Cattle Stock (heads) 71.986 63.738 65.619 12,9%
Heads of milking cows (daily average) 2.588 2.439 2.046 6,1%
Source: Financial Statements of the Company as of June 30, 2014

33
Appendix 15: Consolidated Indebtedness as of June 30, 2014
Type of debt CCy. Amount in
USD MM Rate Maturity
Short term ARS 20,4 Float + 300 bps < 365 d
Bank loan - Banco Ciudad USD 14,5 LIBOR 180 d; floor 6% Jan-22
Bank loan - Banco de la Pampa ARS 2,5 Float (10.5%; 14.5%) Aug-17
Corporate Bond Cresud 2014 Class VIII USD 60,0 7,50% Sep-14
Corporate Bond Cresud 2015 Class XI ARS 6,6 BADLAR + 375 bps Jun-15
Corporate Bond Cresud 2014 Class XII ARS 8,4 BADLAR + 410 bps Nov-14
Corporate Bond Cresud 2015 Class XIII USD 79,4 1,90% May-15
Corporate Bond Cresud 2018 Class XIV USD 32,0 1,50% May-18
Corporate Bond Cresud 2015 Class XV ARS 21,7 BADLAR + 399 bps Nov-15
Corporate Bond Cresud 2018 Class XVI USD 109,1 1,50% Nov-18
OtherLoans (N°5319 comm.) ARS 1,5 15,01% Dec-15
Bolivia Investment Loan BOB 1,2 7,45% May-17
Cresud Total Debt 357,2 Bank Overdraft ARS 49,4 Float < 180 d
Corporate Bond IRSA Series I Class I USD 150,0 8,50% Feb-17
Corporate Bond IRSA Series II Class II USD 150,0 11,50% Jul-20
Corporate Bond IRSA Class V ARS 25,7 BADLAR + 395 bps Aug-13
Corporate Bond IRSA Class VI ARS 1,3 BADLAR + 450 bps Feb-14
Belmont Madison BuildingMortgage USD 74,8 4,22% Aug-17
OtherLoans ARS 1,1 15,25% Dec-16
IRSA Total Debt 452,3 Bank Overdraft ARS 42,7 Float < 30 d
Syndicated loan - Arcos ARS 9,7 15,01% Nov-15
Bank Loans ARS 2,4 15,01% Dec-15
Corporate Bond APSA Series I Class I USD 120 7,88% May-17
Syndicated loan - Neuquén ARS 12,1 15,25% Jun-16
Sellers' financing USD 12,6 5,00% Jul-17
OtherLoans ARS 2,0 15,25% Dec-16
APSA Total Debt 201,5
BrasilAgro Total Debt 54,7
Consolidated Total Debt 1.065,7
Consolidated Cash 123,3
DebtRepurchase 32,8
Consolidated Net Debt 909,6
Source: Financial Statement of the company as of June 2014

34
Appendix 17: CRESY, historical price evolution (in USD)
CRESY (monthly evolution)
Average Historical Price 12,29 Closing Price (Oct-14) 10,50 Average Historical Volume 86.139
Subprime mortgage crisis
CRESY listed on NASDAQ
Argentine financial crisis
BrasilAgro IPO for USD 276MM (7.3%);
IRSA (26.7%)
Consolidation of IRSA (50.2%);
BrasilAgro (14.4%)
Interest in IRSA (14.9%)
2013: BrasilAgro listed on NYSE
(39.6%); IRSA (65.4%)
23% devaluation of ARS in Jan-14
No agreement with holdouts
Bearish market
Bullish market
Expecting an agreement with holdouts

35
Appendix 16: Macroeconomic Assumptions
2014 E 2015 E 2016 E 2017 E 2018 E 2019 E 2020 E 2021 E 2022 E 2023 E 2024
Real Growth for ARG
0.50% 1.00% 1.50% 2.00% 2.00% 2.00% 2.00% 2.00% 2.00% 2.00% 2.00%
Inflation for ARG 25.3% 23.8% 25.0% 20.0% 15.0% 10.0% 10.0% 10.0% 10.0% 10.0% 10.0%
Nominal Growth 25.3% 23.8% 25.0% 20.0% 15.0% 10.0% 10.0% 10.0% 10.0% 10.0% 10.0%
Exchange Rate (by PPP)
8.13 9.87 12.09 14.23 16.04 17.30 18.66 20.12 21.70 23.40 25.23
Inflation USD
2.0% 2.0% 2.0% 2.0% 2.0% 2.0% 2.0% 2.0% 2.0% 2.0%
Source: Team Estimations

36
Appendix 18: Glossary AAA: Rating for premium offices (highest quality) Adm Mgr: Administrative Manager ADR: American Depositary Receipt AGRO3: Ticker for BrasilAgro SA listed on BOVESPA ANSES: Administración Nacional de la Seguridad Social (National Social Security Agency of Argentina) APSA: Alto Palermo SA ARG: Argentina ARS: Argentine Pesos BADLAR: rate for deposits over 1 million pesos with a maturity of 30-to-35 days BCBA: Bolsa de Comercio de Buenos Aires (Buenos Aires Stock Exchange) BCRA: Banco Central de la República Argentina (Argentina’s Central Bank) BHIP.BA: Ticker for Banco Hipotecario SA listed on BCBA BHSA: Banco Hipotecario SA BOL: Bolivia BOVESPA: São Paulo Stock Exchange bps: basic points BR: Brazil BrasilAgro: Brasilagro Companhia Brasileira de Propriedades Agrícolas SA CABA: Ciudad Autónoma de Buenos Aires (Autonomous City of Buenos Aires) CAGR: Compounded Average Growth Rate CAPM: Capital Asset Pricing Model CDBA: Córdoba Province (Argentina) CEO: Chief Executive Officer CFO: Chief Financial Officer CRES: Ticker for Cresud listed on BCBA Cresud: CRESUD S.A.C.I.F. Y A. CRESY: Ticker for Cresud listed on NASDAQ D&O: Directors and Officers D/E: Debt to Equity d: days DCF: Discounted Cash Flows E: Estimated (e.g. 2015E) EBIT: Earnings Before Interests & Taxes EBITDA: Earnings Before Interests, Taxes, Depreciation & Amortization FAO: Food and Agricultural Organization FCFF: Free Cash Flow to the Firm FX: Foreing Exchange FyO SA: Futuros y Opciones SA GBA: Gran Buenos Aires (Greater Buenos Aires Metropolitan Area) GDP: Gross Domestic Product GLA: Gross Leasable Area GSCI: Goldman Sachs Commodities Index has: hectares IMF: International Monetary Fund INDEC: Instituto Nacional de Estadísticas y Censos (National Institute of Statistics and Census) IPO: Initial Public Offering IRSA: Inversiones y Representaciones SA k: thousands LIBOR: London Interbank Offering Rate m2: square meter MDZ: Mendoza (Argentina) Mgr: Manager MM: millions NASDAQ: National Association of Securities Dealers Automated Quotations NYSE: New York Stock Exchange OECD: Organization of Economic Cooperation and Development PAR: Paraguay ROA: Return on Assets ROE: Return on Equity

37
ROFEX: Rosario Grain Exchange S&P500: Standard & Poor’s index of 500 hundred stocks sqm: square meters Sta. Fe: Santa Fe Province (Argentina) US/USA: United States of America USD: United States Dollars USDA: United States Department of Agriculture VP: Vice President WACC: Weighted Average Cost of Capital y/y: year on year

38
Disclosures: Ownership and material conflicts of interest: The author(s), or a member of their household, of this report does not hold a financial interest in the securities of this Company. The author(s), or a member of their household, of this report does not know of the existence of any conflicts of interest that might bias the content or publication of this report. Receipt of compensation: Compensation of the author(s) of this report is not based on investment banking revenue. Position as a officer or director: The author(s), or a member of their household, does not serve as an officer, director or advisory board member of the subject Company. Market making: The author(s) does not act as a market maker in the subject Company’s securities. Disclaimer: The information set forth herein has been obtained or derived from sources generally available to the public and believed by the author(s) to be reliable, but the author(s) does not make any representation or warranty, express or implied, as to its accuracy or completeness. The information is not intended to be used as the basis of any investment decisions by any person or entity. This information does not constitute investment advice, nor is it an offer or a solicitation of an offer to buy or sell any security. This report should not be considered to be a recommendation by any individual affiliated with Argentina & Uruguay CFA Institute, CFA Institute or the CFA Institute Research Challenge with regard to this Company’s stock.
CFA Institute Research Challenge