%ce%a0%ce%b1%cf%81%ce%bf%cf%85%cf%83%ce%af%ce%b1%cf%83%ce%b7 %ce%b1%cf%80%cf%8c %cf%84%ce%b1 %cf%80%

REPORT CRPL-5-5 ISSUED OCTOBER 7,1948
cf Standards
Librsry., N. W.
NOV 1 6 1949 U. S. DEPARTMENT OF COMMERCE
NATIONAL BUREAU OF STANDARDS CENTRAL RADIO PROPAGATION LABORATORY
WASHINGTON, D. C.
BACK-SCATTER OBSERVATIONS BY THE
CENTRAL RADIO PROPAGATION LABORATORY
AUGUST 1947-MARCH 1948
BY W.L.HARTSFIELD, S.M.OSTROW AND R.SILBERSTEIN


Report No
CBPL-5-5
NATIONAL BUREAU OF STANDARDS
CENTRAL RADIO PROPAGATION LABORATORY
WASHINGTON 25, D. C.
BACK*.SCATTER OBSERVATIONS
BY
THE CENTRAL RADIO PROPAGATION LABORATORY
AUGUST 19U7 - MARCH 19^8
By
W. L. Eartsfield, S. M. Ostrow and R. Silberstein
CONTENTS
Page t Introduction ............. . 1
II The Equipment .. ^
III Miscellaneous Experimental Observations . 7
IV Comparison of Results with Other Concurrent Observar-
tions; Sources of Scatter .............. 12
V Conclusions » ...17
VI Bibliography .... 19
This report is issued for information purposes
only. Publication or reprinting of its contents
either in full or in part is not authorized
without express permission.

l
:• . : . ' ; ;
• . ' • - .
.

BACK SCATTER OBSERVATIONS BY THE CENTRAL RADIO PROPAGATION LABORATORY
August 1947 - March 1948
1. INTRODUCTION
13 5 Following the original work of T.L. Eckersley ’9 and others
on energy received both remotely from a transmitter and back at the transmitter location when regular geometric propagation by the iono¬ sphere was not possible, i.e., under conditions of skip, the Bureau contemplated conducting experiments of its own to obtain more infor¬ mation on the basic mechanism of this phenomenon, known as "scatter”.
In the original scatter theory, energy is re-transmitted in all directions from certain types of ionized patches in the E region when these regions are excited by high-frequency radio waves passing through them. Since the retransmitted energy is very weak, resembling diffuse reflection of light from a rough surface, the phenomenon is manifest mostly on high-powered emissions from beamed antennas. Energy returned from the scatter sources toward the transmitter was called "back-scatter".
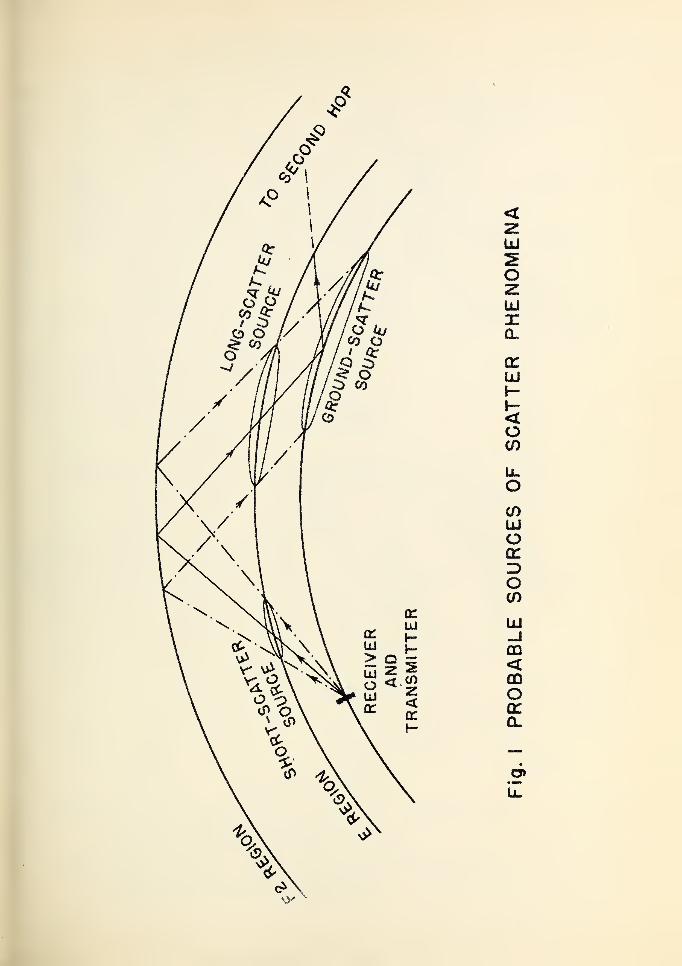
The early back-scatter experiments with pulsed transmissions revealed frequent irregular echoes at short distances on an oblique transmitting beam. These echoes appeared to come approximately from the point in the E layer where the beam first entered. Other echoes of a much steadier type came from a much greater distance and appeared to return from a point in the E layer which the beam penetrated after reflection from the F2 layer on the way back to earth. It was reasoned that both were manifestations of the same phenomenon; the short-distance phenomenon was called "short scatter" and the long-distance phenomenon "long- scatter" .
Fig. 1 illustrates probable sourees of scatter phenomena including the ground as mentioned below, and illustrates the reason why long scatter from the E region is sometimes called "F2 = E scatter", and short scatter, just "E scatter".
It was believed that the reason for the long scatter returns being fairly steady whereas the short scatter returns were intermittent was that although there was only one type of scatter source, whose ioniza¬ tion was intermittent, in the ease of long scatter the beam had spread out sufficiently at the longer distances that there was at least one active scatter patch illuminated at any time. The source of intermittent ionization was not known but was assumed by some investigators to be meteoric in origin.
As a result of the work done by Eckersley and by K.W. Tremellen, a hypothesis of radio transmission known as the two-control-point theory was evolved by the latter in which the limiting conditions for which transmission over any path could exist was that for which transmission

- 2 -
was just possible by the F2 layer at close to grazing incidence on the earth. It was reasoned that so long as a wave could take off and arrive by an initial hop at the lowest possible angle, affording the highest possible maximum usable frequency (muf), it would somehow be propa¬ gated over the intervening distance wholly or partially by long-scatter sources.
The first reason for the Bureau to desire an experimental inves¬ tigation of scatter was to check the two-control-point theory. During World War II it was not possible for the Bureau’s Interservice Radio Propagation Laboratory to engage in basic research of this nature; however a brief report was written at IRPL in which it was proposed that a powerful beamed transmitter be used as a skip-distance indicator by rotating the beam and registering the long-scatter returns on a radar plan-position-indicator tube.4
After World War II interest in the subject was greatly stimulated by a visit to this country by Dr. W.R. Piggott of the Department of Scientific and Industrial Research in England. Piggott claimed that Eckersley’s theory was not correct and that long scatter really came from the ground where the wave reflected after striking the ionosphere and returning to earth at a distance. He showed results of preliminary experiments which gave indications that appeared to substantiate his contentions and spoke of plans for more refined experiments. The idea that back-scatter came from the ground was a momentous one since if this were true a skip-distance indicator could be made which would show true skip in any direction over regions where ionosphere stations did not exist, as for instance over inaccessable land or ocean areas.
At about the same time interest was manifest by Air Forces personnel in the possibility of activating a radio beacon in the V2 rocket at great heights. This possibility was viewed by members of CRPL as an opportunity to study modes of propagation existing at great heights which might differ markedly from modes existing for ground-to-ground propagation and would have an important bearing on problems of telemetering and control of missiles. Experiments along these lines were planned by the Cambridge Field Station of the Watson Laboratories. The development and eventual experimental work in connection with the rocket aloft and with ground reception at White Sands was turned over to a Boston University group.
A related project was begun at the U.S. Navy Electronics Laboratory, this work being a study of the components of arriving radio waves. This project required a source of high-powered radio-frequency pulses.
For the purpose of assisting in some of this work and in order to carry on its own basic research in scatter the CRPL constructed a high- powered pulsing transmitter and erected directive antennas at the Sterling, Va„ Laboratory pointed in the direction of White Sands Proving Ground, A receiver was modified to receive the back-scatter pulses and a Loran indicator installed for viewing. A war-surplus cw and radio¬ telephone transmitter type BC 610 was installed for communications with

- 3 -
White Sands and authorization was obtained for the use of frequencies for this work.
The first preliminary pulsing transmitter was installed during 1946. Pulses from this transmitter were observed at Alamogordo, New Mexico in November 1946. Then construction was started on a higher-powered unit, which began functioning in the summer of 194V. This unit is described on succeeding pages. The first operating frequency chosen was 13660 kc/s which was in a so-called "diathermy” band.
The balance of this report deals mainly with the present equip¬ ment and the results of the back*-scatter experiments. It is ex¬ pected that the results of other work will appear in reports of the agencies conducting that work.

II THE EQUIPMENT
1. The Transmitter
Circuit diagrams of the high-power pulse transmitter and its modulator are shown in Fig. 1. The heart of the pulse transmitter is a part of 527 triodes operated in push-pull in a self-controlled oscillator. Rated plate dissipation for the 527 is only 250 watts but the 625-watt thoriated filament furnishes sufficient emission for peak plate currents of nearly 50 amperes per tube. Reliable continuous operation at 13660 kc/s is obtained with a plate supply of 11 kv and an average plate current of 7D raa at a 0.1 percent duty factor, represent¬ ing a peak power input of 770 kw. Peak inputs as high as 1.2 megawatts have been achieved for short operating schedules.
During the development period several modulation methods were con¬ sidered. Plate modulation seemed a straightforward scheme, but it became obvious after considerable experimentation with bootstrap circuits that an effective vacuum keyer tube would be a considerably larger type than the 527 itself. No thyratron was available with a hig)i enough voltage rating to plate-modulate directly, and the construction of a high- voltage, 40-microsecond pulse transformer appeared too difficult. The grid modulation method shown is simple and effective. While its adjust¬ ment is more critically dependent upon oscillator loading than would be the case for plate modulation, operation has proven reliable over long periods once proper adjustment has been made.
The 4C35 is a high-voltage, high-current hydrogen thyratron used in this case to discharge a 40-microsecond artificial line through a resistance equal to the line's 100-ohra characteristic impedance. The 900-volt bias supply furnishes blocking bias for the oscillator. With the artificial line charged to approximately 1800 volts by its own line-charging supply, the pulse appearing across the 100-ohm resistance is sufficient to neutralize the blocking bias, and the 527's oscillate. At the end of the pulse, current through the 4035 ceases, the 900-volt bias is restored, and the 527's are cut off. The small 2050 thyratron is keyed by the output from a loran timer and generates the ignition pulse for the 4035. Use of the 2050 results in an ignition pulse whose characteristics are independent of amplitude variation in the timer output.
Several particulars of the oscillator design deserve mention. Reference to the diagram Fig. 2 reveals a push-pull Hartley oscillator with a capacitance-loaded tuned line as the tank circuit. The tubes, as well as +he antenna transmission line, are tapped down on the tank. This procedure presents a larger tank susceptance at the tube plates (equivalent to a high-C circuit) than would be obtained by connecting the tubes at the end of the line and materially assists in suppression of multiple oscillation modes and frequency "drag loop" effects during tune-up. Adjusting and maintaining the desired operating frequency is

- -
still a critical metter with this type of circuit, especially with a trans¬ mission line many wavelengths long since small changes of frequency cause large changes of load reactance.
The 4-mfd capacitor whose value was determined by trial, in shunt with the grid leak, ensures restriction of the oscillator pulse length to 40 microseconds. Without this capacitance the oscillator operated with several times normal pulse length unless excessively loaded.
The pulse repetition rate of the loran timer output used to key the transmitter is derived from a 50-kc crystal oscillator. The oscillator, which is temperature and amplitude-stabilized, feeds a chain of five frequency dividers, the last of which generates a 25-cps pulse. Insta¬ bility of timer operation resulted from the very large radio-frequency field immediately surrounding the transmitter. Difficulty from the field was reduced considerably by placing the timer about thirty feet from the oscillator in a shielded enclosure of wire screening,
2, The Receiver
Transmitted and returned pulses are observed on a loran indicator. Pulse delays may be recorded photographically gr by direct scaling from the cathode-ray tube, the regular loran marker pulses being used. The receiver feeding the loran indicator is a commercial receiver, which was modified for pulse reception by removing high-impedance grid returns and disabling the AVC, installing screen-voltage gain control and cathode bias, damping the i-f transformers and changing the detector and audio circuits suitably for video purposes.
3• The Indicator and Camera
The Indicator was a Model DAS-1 loran indicator used without modifi¬ cation on the video output of the receiver. The double sweep gave an available 40-millisecond scale with calibration marks every half milli¬ second on the slow-sweep position. The initial transmitter pulse was located at a convenient position and readings taken from it as a reference. The movable pedestal was used to locate pulses for detailed observation on "fast sweep".
The camera was an Air Forces Type 0-15 recording camera which operated in conjunction with a periscope and a relay shutter control. The film size was 35 mm.
4. The Antenna
The transmitting antenna is a terminated, horizontal rhombic, 75 feet above ground, 262.5 feet on a leg, with a tilt angle of 67 degrees. The calculated gain of the antenna at 13660 kc/s, taking ground constants into account, is shown in Fig. 3. A 600-ohm line is used to couple the rhombic to the transmitter. Measurements of the line input impedance

- 6 -
indicate that the match is far from perfect, since the impedance varies cyclically between about 300 and 800 ohms over the range from 1 to 20 Mc/s. In recent tests, the receiving antenna has been an inclined, terminated-V beam, co-directional with the rhombic, the azimuth being 263° from true North. The pole is 70 feet high and each wire is 493 feet long terminating on short poles 10 feet above the ground. The angle between the wires is 44 degrees.
Side lobes in the antfnna patterns may at times have been respon¬ sible for ambiguities in the interpretation of observed data, as will be seen later in this paper.
- 7 -
HI MISCELLANEOUS EXPERIMENTAL OBSERVATIONS
1, General
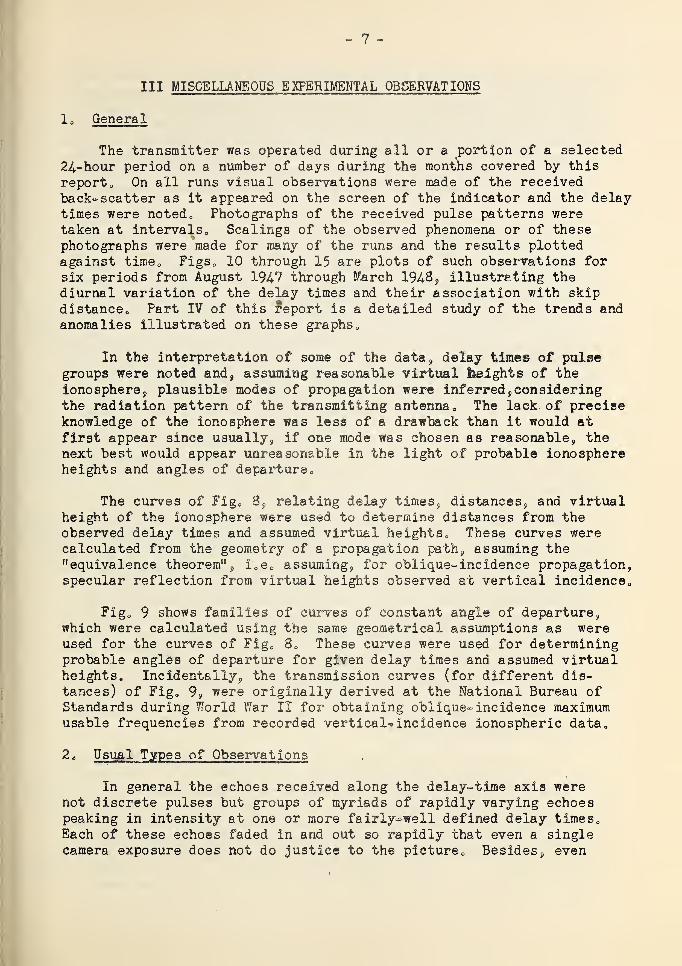
The transmitter was operated during all or a portion of a selected 24-hour period on a number of days during the months covered by this report, On all runs visual observations were made of the received back-scatter as it appeared on the screen of the indicator and the delay times were noted, Photographs of the received pulse patterns were taken at intervals,, Scalings of the observed phenomena or of these photographs were made for many of the runs and the results plotted against time0 Figs, 10 through 15 are plots of such observations for six periods from August 1947 through March 1948, illustrating the diurnal variation of the delay times and their association with skip distance, Part IV of this report is a detailed study of the trends and anomalies illustrated on these graphs0
In the interpretation of some of the data, delay times of pulse groups were noted and, assuming reasonable virtual freights of the ionosphere, plausible modes of propagation were inferred,considering the radiation pattern of the transmitting antenna. The lack of precise knowledge of the ionosphere was less of a drawback than it would at first appear since usually, if one mode was chosen as reasonable, the next best would appear unreasonable in the light of probable ionosphere heights and angles of departure.
The curves of Fig, 8, relating delay times, distances, and virtual height of the ionosphere were used to determine distances from the observed delay times and assumed virtual heights. These curves were calculated from the geometry of a propagation path, assuming the "equivalence theorem", i,e0 assuming, for oblique-incidence propagation, specular reflection from virtual heights observed at vertical incidence.
Fig, 9 shows families of curves of constant angle of departure, which were calculated using the same geometrical assumptions as were used for the curves of Fig, 8, These curves were used for determining probable angles of departure for given delay times and assumed virtual heights. Incidentally, the transmission curves (for different dis¬ tances) of Fig, 9, were originally derived at the National Bureau of Standards during World War II for obtaining oblique-incidence maximum usable frequencies from recorded vertical-incidence ionospheric data,
2* Usual Types of Observations
In general the echoes received along the delay-time axis were not discrete pulses but groups of myriads of rapidly varying echoes peaking in intensity at one or more fairly-well defined delay times. Each of these echoes faded in and out so rapidly that even a single camera exposure does not do justice to the picture. Besides, even

- 8 -
the major peaks shifted in amplitude and delay. Fig„ 4 shows how a return group with a delay time from 8-g- to about 16 milliseconds changed its configuration in as little as 45 seconds, the six photo¬ graphs having been made between the time of 0010 * 58" and 0011 ^ 43" GOT on November 21, 1947. Fig0 5 shows such a back-scatter echo seen on August 27, 1947, with the fine-grain structure changes which occur in as little as 2 seconds, made evident by displaying an echo group on the 2500-microsecond sweep of the Loran indicator at 2=second
intervalSo
Recording of pulses was beset with great difficulties caused by interference from stations on channels near or directly on the trans¬ mitter frequency,, Fig0 A9 mentioned above, also shows the change of interference conditions in the 45-second intervale Since the trans¬ mitted wave was fairly broad, it was usually possible to tune the receiver to points of minimum interference, but at best it was impossible to obtain readable patterns a large proportion of the time. During the day when ionospheric absorption made the return echoes weak, the great¬ est difficulty of this sort was encountered, considerable advantage being obtained in running the experiments on Sundays. One bad feature of the interference problem was that it made it necessary to adjust the receiver gain control very frequently.
In addition to interference, reflections from airplanes and meteors were often noted. These were in the form of discrete pulses, to the extent of the resolution of the "slow sweep", in contrast to the scatter returns.
Often under night conditions over a path, pulse return groups corres¬ ponding to as many as four long hops were noted, assuming that the delay time is a measure of the skip distance to a scatter source. This would mean that back-scatter was being received at times from as far as the middle of the Pacific Ocean. It was often noted in the evening at Sterling that the delay between a second echo and a first echo was shorter than that between the transmitted pulse and the first echo. These observations may be explained by the fact that at these times the second hop was in daylight, as well as farther to the south, both conditions contributing to a shorter skip distance. Fig. 6 for Feb. 16, 1948 at 0252 GOT shows three separate back-scatter groups. These echoes appear as plots in Fig. L4 at the appropriate time.
3. Direct F2 Reflections
One phenomenon worthy of note is the type of reflection observed when the ordinary-wave critical frequency overhead is greater than the operating frequency, as occasionally happens during Winter daylight hours. Fig. 12 at 1536 GOT shows such a case for Nov. 26, 1947. The ordinary- wave return shows as a single intense clean pulse at 2.4-milliseconds delay. Another weaker pulse at 3 <>4 milliseconds corresponds to the extraordinary wave. The 2.4-millisecond delay corresponds to a virtual height of 370 km. It was actually noted that the virtual heights observed in this manner were of the order of 20 km higher than those noted

- 9 -
simultaneously for the same frequency on the vertical-incidence ionosphere recorder operating in the same building. This seemed to indicate the fact that the highest lobe on the rhombic transmitting antenna,peaked at an angle less than 90°, caused the reflections to be observed from an angle slightly off the vertical. Two groups of pulses beginning at 4o6 and 8.2 milliseconds were examined for the delay times of 5.2 and 9.0 milliseconds at about the center of each group. The 502- millisecond delay may correspond to scatter from the ground 475 km away propagated via the F2 layer at a reasonable assumed virtual height of 300 km. The angle of departure for this would be 50°, corresponding to the middle of the second lobe of the rhombic antenna. The 9»0-millisecond delay may correspond to scatter from the ground 1250 km away propagated via the F2 layer at a virtual height of 220 km. The angle of departure for this would be 16°, near the peak of the lowest lobe. The virtual height of 220 km is reasonable for this case since at oblique incidence, with frequency constant, the virtual height decreases as the distance increases and approaches the minimum virtual height, which was of that order of magnitude in this case. Calculations of the distances corresponding to various delay times and virtual heights were made from the curves of Fig. 8. Angles of departure were obtained from Fig. 9 at the intersections of the constant~sngle curves with the transmission curves for given dis¬ tances at the desired virtual heights.
4. Persistent "Short Scatter"
An odd type of phenomenon, rather difficult to explain, was noted on the night of Jan. 21 - Jan. 22, between 0500 and 0700 GCT. Very strong and persistent echoes were received at delays of the order of 2.6 milliseconds along with longer-delayed echoes of much lower intensity as shown in the photograph Fig. 7 and in the plots of Fig.13. From the delay time the only reasonable source of these echoes would be short scatter directly from the E layer at an angle of departure of 14 degrees, right on the main lobe of the transmitting antenna, yet a more intermittent and weaker type of echo would have been expected for this case. The alternate solution would be ground scatter propagated via E layer from a source 310 km away, but not only did the angle of departure for this case fall in an antenna null but, in addition, E-layer ionization would probably not have been great enough to sustain a reflection at 13,660 kc/s. It is possible that the intense short distance reflections, because they were seldom seen, were associated with the sporadic-E type of ionization.
5. Sudden Increase of Skip
It was observed that at times of "fadeouts" of the scatter echoes, when the skip suddenly increased, observable in several of the plots, as in Fig. 14 at 0645 GCT, echo groups always became indistinguishable long before the delay time, about 27.1 milli¬ seconds, for the theoretical 4000-km limit of one-hop F2 was reached.

- 10 -
It may be concluded that the echoes became weaker than the noise and interference at the longer distances because the angles of departure were far below the maximum of the first lobe of the transmitting antenna„
A point of Interest is the great speed with which the observed echoes change their delay times before and after the "fadeouts" just mentioned, Fig, 15 for Mar, 14, 1948, between 0530 GOT and 0645 GCT illustrates the point„ The first echo visible after the "fadeout” was at 0610 GCT and the first pulse peak of the group came at 2203 milliseconds delay0 The delay time decreased almost uniformly to 0645 GCT when it became 15o5 milliseconds0 The rate at which the delay time decreased was then 1107 milliseconds per hour, making the energy peak appear to approach the receiver at a speed of 1750 kra/hr if the velocity of propagation were assumed to remain constant at 3 x 10⁵ km per second„
60 Sunrise Effects
Effects around sunrise over the path are rather complex and data are very scarce because of interference and also because of a number of equipment failures which occurred around this time.
Referring to Fig, 11 for 0cto 2, 1947, subsequent study of the films indicated that all of the returns between 0845 and 1015 GCT shown at a delay of less than 12 milliseconds were really distant multihop echoes seen the second time around on the 40-millisecond sweep, since they were all weaker than the large groups plotted in the region of 22 msQ However, later close-in groups after 1100 were strong enough to be considered as reflections from close-in sources,, It is to be noted that these groups appear during the period when groups just beyond are moving in closer and that they subsequently disappear, Similar effects are seen in Figc 10 for Aug0 27, 19470 The close-in groups at 1042 and 1103 appear to be from a short distance and the single group at 1130 is ambiguous in appearance but may be a distant group moving in„
One possible source of the close-in scatter noted in the above two cases is the regular E or the Eg layers in the process of forma¬ tion, If this scatter is weak it may soon be attenuated as the sun riseso Another possible source of close-in echoes at sunrise would be specular reflections caused by a tilted layer or a combination of a tilted Fg layer and the start of the E layer, forming a duct with an oblique top into which waves may go and be returned specularly. Reference 2 treats of this type of mechanism, which may be responsible for certain types of echoes,, It also gives a plausible explanation for the variation of the relative intensities of multiple echoes at near vertical incidence on the basis of specular reflections from irregularities in the ionosphere which have a focusing and defocusing effect as they drift by„ This mechanism may apply to some of the

11 -
close-in echoes.
At times visual observations of the indicator have been made around sunrise which would indicate that, for a time, groups may be received corresponding to daytime skip, with long-distance echoes from the night-time regions seen simultaneously. This condition could prevail when the pre-sunrise minimum of F2-layer ionization was some distance to the west of Sterling.

IV COMPARISON OF RESULTS WITH OTHER CONCURRENT OBSERVATIONS: SOURCES OF SCATTER
Other concurrent observations with which test data were compared were:
\
a - Vertical-incidence ionosphere observations b - Arrival time of transponder pulses from Alamogordo,
New Mexico c - Recording of pulses from Sterling, Va. made by U.S. Navy
Electronics Laboratory at San Diego, California,
The variation of the delay times of CRPL back-scatter observations were compared with simultaneous vertical-incidence ionospheric obser¬ vations at several stations in the United States. Regular ionospheric measurements are made by CRPL at both Washington and White Sands.
Since only a very small percentage of the radiated energy is scattered backward from either the assumed ground or the E-region scatter source, back-scatter on 13660 kc/s, even with the power and beaming used, is not easily detected except for scattering areas at approximately the skip distance from the transmitter. At or near the skip distance "high" and "low" waves traversing the ionosphere converge, forming a caustic, at which the transmitted energy is concentrated and, similarly, energy scattered at different angles of elevation from a scattering area is made to converge by the ionosphere, concentrating the reflected energy so that it is sufficient for detection.6 Consequently, if back-scatter is from the ground, the delay time observed between the transmitted and back-scattered pulses should correspond roughly to the skip distance for that frequency at the point of reflection. If back scatter is from the E layer the delay time is less by the travel time along the oblique path between the E-layer scatter source and the ground scatter source in Fig. 1.
In order to test these assumptions, F2~layer skip-distance maps of the United States, for the frequency 13,660 kc/s were prepared from ionospheric data observed at Washington, White Sands, Baton Rouge, San Francisco, Boston, and Ottawa, for a number of hours during each day on which the pulse experiments were conducted. Such skip-distance contour maps were necessarily rather rough, since the observations at these six location must be extrapolated to cover the entire country. The F2-layer skip distance was derived by standard methods from the observed values of f°F2 and F2-3000-muf reported by the ionosphere stations, and the map construction involved longitude extrapolation. Fig. 16 for August 27, 1947, at 1100 GOT is typical of the F2-layer skip-distance maps. The values of the contours are the skip distances in kilometers, for 13,660 kc/s, for one-hop transmission reflected at points on the contours.

- 13 -
It was assumed that the transmitting antenna beam width was 30°, centered on the direction of orientation, and that, in this sector, back-scatter is observable for a given path length wherever the mid¬ point of path coincides with the skip-distance contour for that dis¬ tance. Assuming the velocity of propagation to be 300 km per milli¬ second, and arbitrarily adopting an ionospheric reflection height of 300 km, the expected range of time delay between transmitted and back- scattered sign&l over the sector was derived from the range of values of skip distance for which back scatter was expected,, The ground- scatter delay-time values derived from the skip-distance maps are plotted on Fig. 10 through 14, for comparison with the observed back-scatter delay-time values, solid circles being used to designate the shortest and longest delay time expected. For the shortest delay time the corresponding delay times for E-layer scatter from an assumed 110-km height were obtained from Fig. 17 and plotted as open circles. Arrows pointed vertically upward indicate skip greater than 4000 km.
Each of the figures was examined to decide from the relative positions of the plotted returns whether or not scatter was from the ground or the E-layer. Echoes from the ground over a range of skip distances would give a line of pulses and the same would be true for the E-layer but with the returns displaced by a time difference of the order of that between curves B & C of Fig. 17; it is obvious that if both types were present ambiguity would exist where the two lines of pulses over-lapped. However, if only one or a few closely-grouped peaks of ground scatter exist in a given case an analogous group for E-layer back scatter may also exist separately at the distance determined roughly by Fig. 17.
The strongest supporting evidence indicating that the observed returns may often be ground scatter is presented in Fig. 12 for the run of Nov. 25 - 26, 1948. In that experiment a transponder operated by the Boston University personnel on the ground at Alamogordo, N.M., was synchronized on the strongest pulse of a group received from Sterling. It is seen on the plot between 0430 and 0607 GOT. As the skip moved out in that period the transponder arrival time changed relatively little because it was dependent only upon the virtual height of the ionosphere. At 0445 the transponder return is seen split, apparently because of Pedersen ray effects (actually at some intervals more than two echoes were visible because of extraordinary wave). At 0607 it is last seen at a delay time of 18.9 milliseconds (Figs. 12, 19). Actually it is almost on top of the nearest back-scatter energy peak, so that the conclusion is reached that that peak repre¬ sented ground scatter from the equivalent distance, for which a single F2 hop from a reasonable virtual height would give the same delay time. The transponder was turned off at that time because the pulses from Sterling were too weak for synchronizing. Since the transponder was adjusted manually to emit within less than 50 microseconds after

- 14 -
reception of the Sterling pulse at Alamogordo and since E-layer scatter would have appeared on the sweep about 4.6 milliseconds earlier, the assumption that the back scatter in this case was from the ground seemed justified.
The results were not as completely conclusive, however, as might first be thought from an examination of Fig. 12. Although the plotted solid dots for 0600 indicating the range of skip distances calculated from vertical-incidence data agreed roughly with the range of back- scatter echoes, inspection of the map for that hour revealed that the skip distance corresponding to the distance to Alamogordo was shown for an azimuth considerably to the north of the path and that the skip distance directly over the path was shown to be over the 4000-km limit of one hop. However, considering the limited number of points from which ionospheric data were obtained these maps could easily be in error.
Another disturbing fact is that the transponder signal of only a few hundred watts peak power, was still fairly strong at Sterling, as shown by Fig. 19 when the Sterling pulses were reported as too weak for synchronizing at Alamogordo. This fact points to possibil¬ ities of difference of antenna patterns of both transmitter and receiver at both ends, non-reciprocity in the ionosphere and lateral deviation, all of which should be investigated further. The antennas at TThite Sands, were not sharply beamed, making it possible for transponder returns to come in over a devious route after path failure. It still seems to be true, however, that the peaks of the returned pulse groups, particularly the one corresponding to the transponder position in Fig. 19 are ground scatter because of the fact that no peaks were seen at the delay time which would be required for E-scatter for this path, which would be of the order of 4 or 5 milliseconds ahead of the transponder.
A subsequent transponder experiment conducted in June 1948 was not completely successful because of technical difficulties but appeared to confirm the above conclusions since as the nearest pulse peaks moved out to the critical distance for the path, around 19 ms, the transponder took on double and triple splits, as if approaching the edge of skip.
Generalizing from the transponder results it was assumed that returns showing only a few closely-spaced pulse peaks were probably of the ground-scatter type. Similar groups with single peaks or small groups of pulse peaks falling the right amount earlier, as determined from Fig. 17, were judged to be ground scatter with E-region scatter ahead of them. This assumption was supported by the fact that occasionally very strong, discrete pulses of a few seconds duration, which appeared to be meteors came from about the

- 15 -
expected E-scatter region. These echoes seem to appear usually when there is no persistent energy peak at the point in question, suggesting that possibly the back scatter from the E-region is not always present. Sometimes, however, they appear in other places, suggesting the de¬ sirability of an investigation of the possible overlap of delay times of E and ground-scatter returns because of finite beam width.
The type of echo pattern for which earlier separated echo groups appear is noted in Fig. 11, for Get. 2, 1947, an ionospherically dis¬ turbed day, between 0845 and 1015, the separate returns falling be¬ tween 16 and 20 milliseconds delay. It will be noted that most of these fall about 4 milliseconds ahead of the first energy peak in the succeeding groups. The independently-calculated F2 return points (solid circles), end corresponding E points (open circles) fall a few milliseconds earlier but the agreement is not bad.
The earlier separated echo groups, assumed to be E scatter, were quite variable in amplitude with a tendency to disappear alto¬ gether, leaving a line of low-intensity returns out of which would appear the major peaks. Fig. 18 illustrates this point when viewed in conjunc¬ tion with the plotted returns in Fig. 11 for the period 0845 to 1015. The points concerned are on the upper trace in each frame of Fig. IS. The initial pulse is on the lower pedestal and the little pip on the lower trace is probably 2-hop F2. On the upper trace is seen a strong return preceded by a weaker pip which disappears into a line of very weak return pulses after a few seconds. Several returns at other hours on Fig. 11 seem to exhibit similar characteristics, notably those at 0545 and 0807.
neak fleeting pulses at about the E-layer distance ahead of second multiple F2 were sometimes noted on winter days when the ionosphere could sustain vertical-incidence F2 reflections, suggesting the weak pips shown by Eckersley in Fig. 21 of reference 3.
Referring again to the October 2 observations, at 0530 on this day the Sterling emissions under observation at 'San Diego failed for several minutes. Reception then recovered and failed again at 0548, being intermittent to 0558. During this period Fig. 11 shows a pulse peak in the neighborhood of 25.0 milliseconds, which is the delay time for the 3650-km path for ground scatter propagated via the F2 layer at a height of 300 km. At 0545 there appears to be an F2 return after an E-return group. At 0530 there is a first strong peak with echoes coming in for about 5 milliseconds ahead. At this time the return is shown as one group, but the peaks at 22.3 and 22.9 ms. could be associated with E-layer back scatter by comparison with the 0545 return. In fact the pictures taken in this period resemble those of Fig. 18 and the peaks at 22.3 and 22.9 milliseconds are weak compared to the return at 25.0 milliseconds. The calculated skip-distance chart for 0600 for the azimuth of San Diego was in exact agreement with the results at San Diego. This chart was one with regular contour lines, which seem
to be more accurate than those for an irregular distribution of ionization where interpolation is difficult.
Evidence of the type just mentioned would make it appear that it may often be the case that the strongest peaks may be due to back scatter from the ground but that a continuous group of weak returns preceding it in time may come from the E layer. In fact, the whole problem of just what the individual peaks are due to may be ambiguous in almost all cases where no concurrent support¬ ing data are available, and in many cases where such data are obtainable. Among the many things which may cause these peaks are E-layer back scatter, ground back-scatter, and large irregular¬ ities in the terrain. For a single hop in one direction, the low ray, ordinary wave, will always appear. There is also the possibility of ordinary-wave high ray (Pedersen ray), and low and high wave extraordinary. All four modes for one hop could conceivably, in the limiting case, become 4^n modes for n hops of back scatter although in practice conditions would never arise whereby all control points would propagate all modes. Besides, echoes returned by more than one hop become weaker as the number of reflections increases, so that many modes might not he visible.
Another source of ambiguity is the antenna radiation pattern. The transmitter beam width is only approximately allowed for in the analysis, and minor lobes may cause reception of scattered energy from other sectors.
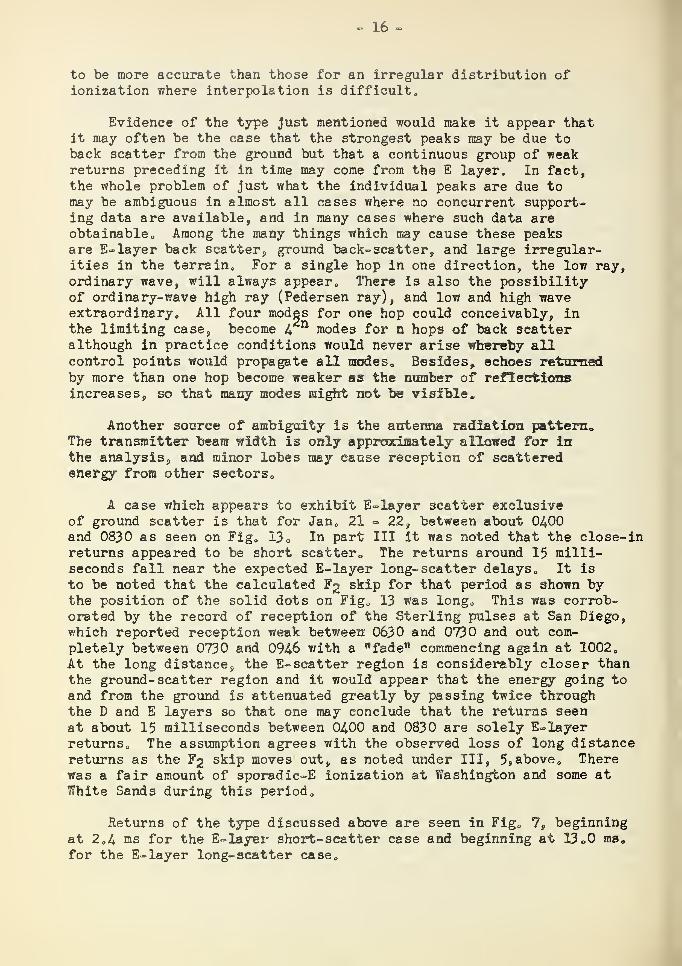
A case which appears to exhibit E-layer scatter exclusive of ground scatter is that for Jan. 21 = 22, between about 0400 and 0830 as seen on Fig. 13. In part III it was noted that the close-in returns appeared to be short scatter. The returns around 15 milli¬ seconds fall near the expected E-layer long-scatter delays. It is to be noted that the calculated F2 skip for that period as shown by the position of the solid dots on Fig. 13 was long. This was corrob¬ orated by the record of reception of the Sterling pulses at San Diego, which reported reception weak between 0630 and 0730 and out com¬ pletely between 0730 and 0946 with a mfade” commencing again at 1002. At the long distance, the E-scatter region is considerably closer than the ground-scatter region and it would appear that the energy going to and from the ground is attenuated greatly by passing twice through the D and E layers so that one may conclude that the returns seen at about 15 milliseconds between 0400 and 0830 are solely E-layer returns. The assumption agrees with the observed loss of long distance returns as the F2 skip moves out, as noted under III, 5*above. There was a fair amount of sporadic-E ionization at Washington and some at White Sands during this period.
Returns of the type discussed above are seen in Fig. 7, beginning at 2.4 ms for the E-layer short-scatter case and beginning at 13.0 ms. for the E-layer long-scatter case.

- 17 -
V Conclusions
As a result of the study of back-scatter echoes from a high-power pulse transmitter on a westward path from Sterling, Va. on a frequency of 13660 kc/s between August 1947 and March 1948, certain conclusions were reached, at least for the case being studied.
Echo groups may at times be seen containing peaks of energy scattered from the ground which are stronger than peaks due to other sources. Returns also appear however, which are identifiable with E-layer long scatter. These are sometimes seen as weak, inter¬ mittent pips ahead of what appear to be ground-scatter pips and sometimes as a continuous line of weak pulses ahead of the main ground-scatter pulse. On occasions of long-distance F2 skip it may appear without the ground scatter being visible above the interference.
What is usually termed E-layer short scatter can be said with some certainty, to be due very largely to meteor reflections. However, on rare occasions very strong clean and steady echoes have appeared at night at a distance which would engender a belief that they were direct reflections from intense clouds of sporadic E.
At sunrise, peculiar conditions arise which may in part be ex¬ plained by the presence of long and short distance echoes when the pre- sunrise minimum of F2- layer ionization is over the path and in part by back-scatter from regular E or the E2 region just as it is forming and before ionospheric absorption becomes large. Another possibility is a specular type of reflection from tilted layers'.
Many ambiguous echoes are to be seen whose interpretation will require further study and experiment in the light of ionospheric phenomena as well as of antenna patterns. For the correlation of the received data with vertical-incidence ionospheric data the present locations and number of ionosphere stations are insufficient. Since both ionosphere stations and transponders offer valuable concurrent data it is believed that more of them should be installed over paths to be studied and, at least, arrangements should be made for obtain¬ ing logs and photographs of reception at points along the path for correlation of skip and back scatter. Direction finders should be used to seek lateral deviation of transponder pulses and back scatter, especially at times when the skip distance is just going out or coming in with relation to the transponder location.
So as to increase the scope and volume of available information at any one time continuous recording at various azimuths, in different locations, and on several frequencies should be undertaken; frequency sweeping should be used for some of the studies.

- 18 -
Much remains to be done in the way of increasing the probability of obtaining the desired information, as distinguished from spurious effects, and in concentrating it for analysis. The effects of inter¬ ference should be reduced by using sharper antenna beams, higher power and anti-jam receiving techniques. Antennas should have minor- lobe response reduced so as to minimize ambiguous responses.
Whereas it is believed that automatic methods of taking data will be necessary because of the large volume of material to be recorded and studied, there is still a great need for observations of a subjective nature made with a view to noting the characteristics of instantaneous or rarely-occurring phenomena, and for the purpose of planning experiments of an objective nature.
An investigation should be conducted along the lines of correl¬ ating assumed short-and long- E-layer scatter with sporadic E, meteors, ionospheric, solar and geomagnetic disturbances and with received field intensities at the transmitter and at remote points.
Finally, the question of reciprocity in the ionosphere should be studied further and experiments devised to check the theory.

- 19 -
VI BIBLIOGRAPHY
1„ Scattering of radio waves in the ionosphere, Eckersley, T.L.,
Nature, 143. 33-34, January 1939.
2. Reception of radio echoes from distant ionospheric irregular¬ ities, Pierce, J.A. and Mirano, H.R., Phys. Rev. 57, 95-105, January 1940.
3. Analysis of the effect of scattering in radio transmission, Eckersley, T.L., J.I.E.E., 86, 548, disc p. 563, 1940.
4. An automatic instantaneous indicator of skip distances and muf, Report IRPL-R9, Interservice Radio Propagation Laboratory, National Bureau of Standards, Washington, D.O., February 1945.
5. Short-period fluctuations in characteristics of wireless echoes from the ionosphere, Eckersley, T.L. and Farmer, F.T., Proc. Royal Soc. A, 184 196, August 21, 1945.
6. The application of ionospheric data to radio communication problems, Pert II, Appleton, Sir. E., and Beynon, W.J.G., Proc. Phys. Soc., £2 58, 1947.
7. Instructions for use of basic radio propagation predictions, Circular 4^5 of the National Bureau of Standards. (Available from the Superintendent of Documents, U.S. Government Printing Office, Washington 25, D.C. price 25 cents).


NATIONAL BUREAU OF STANDARDS
CENTRAL RADIO PROPAGATION LABORATORY
WASHINGTON 25, O.C.
MARCH 8,1948
900 V.
BIAS
—o+ SUPPLY
From Timer B. GRID MODULATOR
NOTES! (I) Bias-supply and line charging-supply voltages are varied for proper operating conditions.
(2) Line has 100-ohm characteristic impedance.
Fig. 2. HIGH POWER PULSE TRANSMITTER USED FOR BACK-SCATTER EXPERIMENTS.

.
'
-

RA
DIA
TE
D
PO
WE
R
IN
KIL
OW
AT
TS
100
0.05
0.01 20 30 4 0 50 60 70
WAVE ANGLE A IN DEGREES
Fig. 3. CALCULATED VERTICAL RADIATION PATTERN OF RHOMBIC ANTENNA USED IN BACK-SCATTER EXPERIMENTS AT ZERO AZIMUTH,


I
Si3E ^transmitter PULSE /
FIRST ECHO GROUP
4 7 0 9 4 7 0 »
4700 4701
FIG. 4 BACK-SCATTER ECHOES NOVEMBER 21, 1947 AT 001'> OCT SHOWING CHANGES OVER A 45-SECOND INTERVAL.
Frames 4700 through 4705 in time sequence.
Initial Pulse starts on pedestal on lower left. Time proceeds to extreme right, then to upper left and across to right, then down to lower left, total sweep being 40 milliseconds. Each marker represents -g- millisecond and every fifth marker is shorter than
the rest.


TRANSMITTER PULSE
FIRST ECHO .GROUP
4 7 0 4
TRANSMITTER PULSE
FIRST ECHO GROUP
4704 4705
FIG. 4 CONTINUED.


TRANSMITTER PULSE
FIRST ECHO GROUP
'10 -9 .8
&
09 f 6 FIRST ECHO GROUP
096G
0575 0566
FIRST ECHO GROUT 0 6C7
FIRST ECHO GROUP_ 0568
0567 0568
PIG. 5 BACK SCATTER ECHOES AUGUST 27, 1947, SLOW SWEEF FOLLOWED BY 3 FRAMES TAKEN A FEW MINUTES EARLIER AT INTERVALS OF 2 SECONDS ON 2500-MICROSECOND SWEEP.


FIRST ECHO GROUF
F.IG. 6 BACK SCATTER ECHOES FEBRUARY 16, 1943, 0252 GCT, DEMONSTRATING PRESENCE OF AT LEAST 3 ECHO GROUPS.
.Initial Fulse starts at lower right at break in ba.se line. Time proceeds to extreme right, then to upper left and across to right, then down to lower left. First group is large double group on upper trace, second is partially on top of lower pedestal, third is just ahead of initial pulse. Tip to right of main pulse is probably a meteor.
, '2 , ,
LONG DISTANCE ECHO GROUP
FIG. 7 RETURNS ON JANUARY 22, 1948 AT 0617 GCT SHOEING CLOSE-IN STRONG REFLECTIONS BEGINNING AT 2.4 MS IN ADDITION TO NEARER LONG-DISTANCE REFLECTIONS BEGINNING AT 13.0 MS.


II
10
9
8
7
6
5
4
3
2
I
1000 1500
3500 4000
d/n KILOMETERS
2000
4500
2500
5000
Fig. 8. SKY-WAVE TRANSMISSION DELAYS
(GEOMETRICALLY CALCULATED)

. .

SE
CA
NT
$
(CO
RR
EC
TE
D)
2.0
AN
GL
E
OF
DE
PA
RT
UR
E,
DE
GR
EE
S
Fig
. 9.
TR
AN
SM
ISS
ION
CU
RV
ES
SHO
WIN
G
VE
RT
ICA
L
AN
GL
ES
.


SQN003SmiW Nl 3WI1 AV13Q
FIG
. 10.
BA
CK
SC
AT
TE
R
OB
SE
RV
AT
ION
S
ON
13660
KC
AT
ST
ER
LIN
G,
VA
. 0200
GC
T
AU
G.
27,
19
47
TO
1200
GC
T
AU
G.
27,
1947


SQN003SIT1IW Nl 3WI1 AV13Q
FIG
. II
. B
AC
K
SC
AT
TE
R
OB
SE
RV
AT
ION
S
ON
13
66
0
KC
AT
ST
ER
LIN
G,
VA
. 0
10
0-2
40
0
GC
T,
OC
T.
2,1
947

*

SQN003SITUW Nl 3WI1 AVISO FIG
. 12
. B
AC
K
SC
AT
TE
R
OB
SE
RV
AT
ION
S
ON
13
66
0
KC
AT
ST
ER
LIN
G,
VA
.,IN
CL
UD
ING
RE
CE
PT
ION
OF
TR
AN
SP
ON
DE
R
LO
CA
TE
D
AT
AL
AM
OG
OR
DO
, N
. M
.
22
00
GC
T
NO
V.
25
, 1947
TO
15
00
GC
T
NO
V.
26
, 1947


FIG
. 13
. B
AC
K
SC
AT
TE
R
OB
SE
RV
AT
ION
S
ON
13
66
0
KC
AT
ST
ER
LIN
G,
VA
. 2200
GO
T
JAN
. 2
1,
1948
TO
18
30
GO
T
JAN
. 22,
19
48
.

■ .
■

ffilONOJNCJN-
saNOoasmiw ni awn aviso
*
FIG
. 14
. B
AC
K
SC
AT
TE
R
OB
SE
RV
AT
ION
S
ON
13660
KC
AT
ST
ER
LIN
G,
VA
. 2000
GO
T
FE
B.
15,
19
48
TO
1900
6G
• r,
-B.
16,
1946


SQNOOaSmiW Nl 3WI1 AV13Q
FIG
. 15
. B
AC
K-S
CA
TT
ER
OB
SE
RV
AT
ION
S
ON
13660
KC
AT
ST
ER
LIN
G,
VA
. 0
00
0
GO
T
MA
RC
H
14,
19
48
TO
1900
GC
T
MA
RC
H
14,1
948

I

10
0
K
0>
CO
to z> to
<
t— O O
O O
6 *
o to
to
(T
o
CL < s
IT
O I- z o o
LtJ o
CO Q
I Cl
* to to
d


o
s
UJ o
< H crt
Q
CO OJ
SQN003Smm 3WI1 AV130 Fig
. 17
. C
AL
CU
LA
TE
D
EC
HO
DE
LA
YS
AS
SU
MIN
G
GR
OU
ND
SC
AT
TE
R
AN
D
E-L
AY
ER
BA
CK
SC
AT
TE
R.


TRANSMITTER PULSE 3 4 0 9
3443 ”E-layer long scatter” weak, ahead of assumed first-hop ground scatter at 0923 *» 17” GOT.
3405 "E-layer long scatter” ahead of assumed first- hop ground scatter at
0355 -» 35" GOT.
* 1
TRANSMITTER PULSE 3 4 4 ^
■3444 ”E-layer long scatter” almost disappearing 2
seconds later.
TRANSMITTER PULSE 3444
PIG. 13 RETURNS ON OCTOBER 2, 1947 APPARENTLY SHOWING E-LAYER BACK SCATTER AHEAD OF GROUND SCATTER.
Pulse and time sequence as in Fig. 4. Echoes under discussion are on upper trace. Small pip to right of lower trace is 2-hop.
>-JV

. ■ ■■
Bt
.

TRANSPONDER ■<
mTTmnTTTFTi
TRANSMITTER' PULSE 5 I 8 5
5183
Position of transponder last time definitely seen 0607 GOT (back scatter detuned).
5187
.Position of scatter group a-s. seen two minutes later,
FIG. 19 RELATIVE POSITIONS OF TRANSPONDER AND BACK SCATTER THEN STERLING, VA. SIGNAL FAILED AT ALAMOGORDO.
Initial pulse starts in middle of lower pedestal. Time proceeds as in Fig. 4. Point where initial pulse crosses top trace is approximately 20 milli¬ seconds.