CEZ Virtual Power Plant Auction 2006 · cez´s virtual power plant auction within ... blok 1 blok 2...
21
CEZ´S VIRTUAL POWER PLANT AUCTION WITHIN THE FRAMEWORK OF REGIONAL POWER MARKET DEVELOPMENT Press conference ČEZ, a. s. Hotel Palace, 25.7.2006 Alan Svoboda, Managing Director Sales and Trading Michal Skalka, Director Trading
Transcript of CEZ Virtual Power Plant Auction 2006 · cez´s virtual power plant auction within ... blok 1 blok 2...

CEZ´S VIRTUAL POWER PLANT AUCTION WITHIN THE FRAMEWORK OF REGIONAL POWER MARKET
DEVELOPMENT
Press conference ČEZ, a. s.Hotel Palace, 25.7.2006
Alan Svoboda, Managing Director Sales and TradingMichal Skalka, Director Trading

1
AGENDA
Regional power markets development Alan Svoboda
Regional power balance development
Price signal from surrounding countries
Virtual Power Plant auction Michal Skalka
Auctions in surrounding countries
Virtual Power Plant auction procedure

2
GERMAN POWER PRICES AS BENCHMARK FOR THE REGION CONTINUE INCREASING
EEX Forward 2007 (baseload)EUR/MWh
20
30
40
50
60
1/2004 5/2004 9/2004 1/2005 6/2005 10/2005 2/2006 6/2006
1 year forward
2 years forward
Source: EEX
Forward 2007
58.75 EUR/MWh
(17/7/2006)

3
0
10
20
30
40
1/2005 5/2005 9/2005 1/2006 5/2006
GERMAN PRICES ARE DRIVEN BY GROWING OIL PRICES, CO2
ALLOWANCES AND SUPPLY DEMAND SQUEEZE
30
40
50
60
70
80
1/2005 5/2005 9/2005 1/2006 6/2006
Brent oilUSD / bl
CO2 allowancesEUR/t
Source: Bloomberg, ECX
Growing supply / demand squeeze
Summer power blackouts in Europe happen regularly for several years … Reserves (of power supply) are low. (HN – Czech Business Daily)
Shutdowns of power plants in Germany and France enforced by current high temperatures reached several thousands megawatts installed capacity. (Platts)
Solution to the lack of supply is often import (France – the biggest power exporter – imported approx. 1,000 MW) or initiation of expensive backup units. (Platts,HN)

4
LACK OF POWER IMPACTS THE WHOLE REGION AND SPOT PRICES IN CRITICAL MOMENTS GROW SKY HIGH
Source:OTE, EEX, Platts
0
50
100
150
200
250
300
01.07
.2006
02.07
.2006
03.07
.2006
04.07
.2006
05.07
.2006
06.07
.2006
07.07
.2006
08.07
.2006
09.07
.2006
10.07
.2006
11.07
.2006
12.07
.2006
13.07
.2006
14.07
.2006
15.07
.2006
16.07
.2006
17.07
.2006
18.07
.2006
19.07
.2006
20.07
.2006
21.07
.2006
22.07
.2006
€/M
Wh
EEX and OKO* prices in July 2006(EUR/MWh, spot)
OKO
EEX
50 %840 MWNeckar -1
5 %1,440 MWBrokdorf
20 %806 MWBrunsbuttel
25 %1,316 MWKrummel
30-70 %1,310 MWUnterweser
Capacity reduce by CapacityPlant
Shutdowns in the region
* OKO = Czech Spot Market, organized by OTE

5
0
50
100
150
200
250
300
9.1.200
6 po
10.1.20
06 út
11.1.20
06 st
12.1 .20
06 čt
13.1.20
06 pá
14.1.20
06 so
15.1.20
06 ne
16.1 .20
06 po
17.1 .20
06 út
18.1.20
06 st
19.1.20
06 čt
20.1 .20
06 pá
21.1.20
06 so
22.1.20
06 ne
23.1.20
06 po
24.1.20
06 út
25.1 .20
06 st
26.1 .20
06 čt
27.1 .20
06 pá
28.1 .20
06 so
29.1 .20
06 ne
30.1.20
06 po
31.1 .20
06 út
Source:OTE, EEX
ČEPS´s actions are required more frequently to maintain stability of suppliesTowards that it must secure enough system tools (reserve capacity)Imports at 5,000 to 10 000 CZK/MWh
OKO
EEXEEX and OKO prices in January 2006(EUR/MWh, spot)
ALSO THE REQUIREMENTS OF GRID STABILITY MANAGEMENT GROW REGARDLESS THE COSTS
6
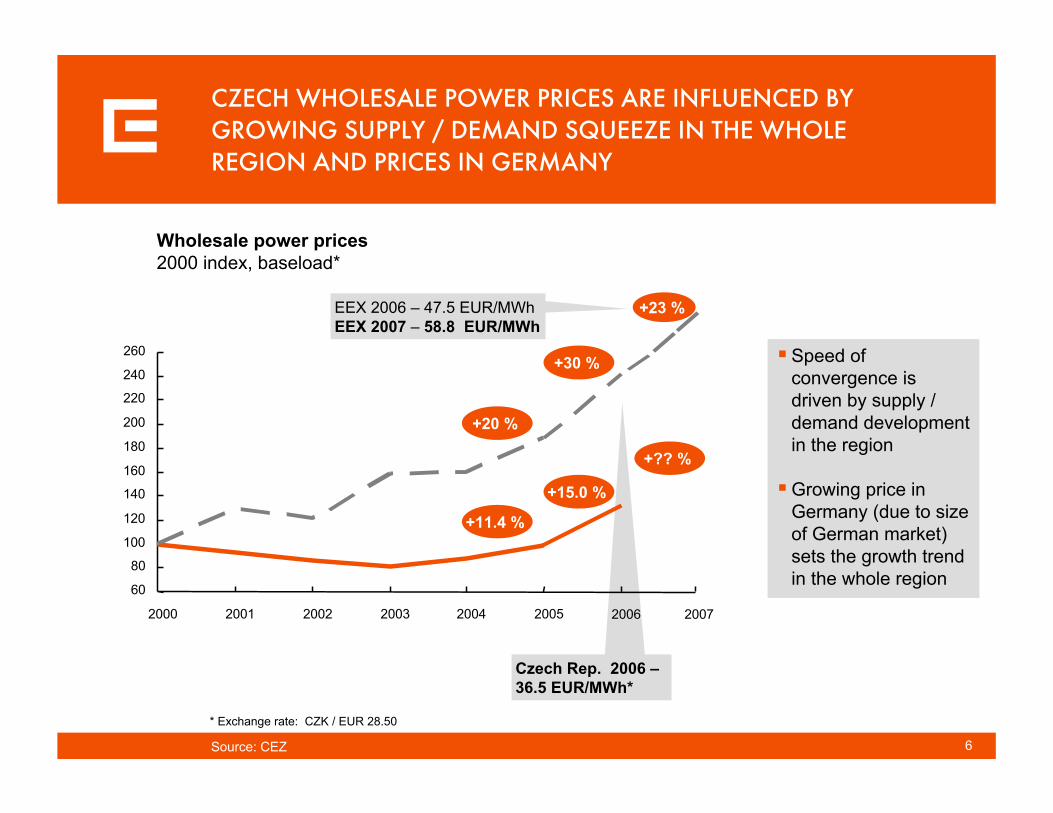
Wholesale power prices2000 index, baseload*
EEX 2006 – 47.5 EUR/MWhEEX 2007 – 58.8 EUR/MWh
Czech Rep. 2006 –36.5 EUR/MWh*
Speed of convergence is driven by supply / demand development in the region
Growing price in Germany (due to size of German market) sets the growth trend in the whole region
60
80
100
120
140
160
180
200
220
240
260
2000 2001 2002 2003 2004 2005 2006
+11.4 %
+15.0 %
+30 %
+20 %
2007
+23 %
+?? %
Source: CEZ
* Exchange rate: CZK / EUR 28.50
CZECH WHOLESALE POWER PRICES ARE INFLUENCED BY GROWING SUPPLY / DEMAND SQUEEZE IN THE WHOLE REGION AND PRICES IN GERMANY

7
36.5
47.5 47.5
62.0
74.0
~ 41.0~ 36.5
WHOLESALE PRICES IN THE CZECH REPUBLIC ARE STILL AMONGTHE LOWEST IN THE REGION THANKS TO UNRESERVED CAPACITY
Centrel
EEX
Czech Republic
Slovakia Hungary Germany Austria UK Italy
Wholesale power price*2006, baseload, EUR/MWh
Source:CEZ, Eurostat
* Comparing 2006 forward price as of 2005, assuming CZK/EUR 28.50
Rest of Europe
Prices in individual regions will converge over time driven by actions of tradersand increasing interconnectivity

8
5860626466
68707274
2002 2003 2004 2005 2006 2007 2008 2009 2010 2011 2012
THANKS TO GROWTH OF ECONOMY POWER DEMAND IN THE CZECH AND SLOVAK REPUBLICS WILL INCREASE BY 10 TWH
25
26
27
28
29
30
31
2002 2003 2004 2005 2006 2007 2008 2009 2010 2011 2012
CR
SR
Consumption in TWh
Source: CR: ERÚ,CEZ; SR: UCTE
By 2012 Czech consumption will increase by 7 TWh and Slovak by 3 TWh
Significant demand growth is driven by economy growth and FDI (TPCA and Hyundai in CR, PSA in SR)
Based on H1 2006 development Czech consumption is likely to grow even faster
Yoy change in 2007 in Czech and Slovak Republics to reach approx. 2 TWh
yoy change 2.0%
yoy change 1.3%
Growth in 1 - 5/2006 4.0%resp. 3.3 % ( normalized temperature)
Actual data 2002 - 2005
Actual data 2002 - 2005
Industrial production growth 1 - 5/2006
12.3 %
GDP growth Q1 2006
7.4%
Consumption in TWh

9
BY 2020 20 GW INSTALLED CAPACITY WILL REACH END OF ITS LIFETIME
Supply / Demand development in CENTREL(CR, SR, Hungary, Poland), GW*
0
10
20
30
40
50
20 GW CENTREL´s reserve capacity on fast decline
Significant investments in power generation will be needed to secure self-sufficiency in power
Mere capacity renewal will not be enough to meet growing demand
Also availability of Polish coal power is already uncertain
High demand
Medium demand
Low demand
* peak demand vs. net installed capacity
Nuclear
Lignite
Hardcoal
Oil/gas
Hydro
Source: CEZ
~

10
0
1 000
2 000
3 000
4 000
5 000
2006 2007 2008 2009 2010 2011
SLOVAKIA ALONE WILL LOSE 25% OF POWER IN THE NEXT THREE YEARS WITHOUT REPLACEMENT AND WILL CEASE TO BE SELF-SUFFICIENT IN POWER PRODUCTION
Starting 2007 Slovakia will cease to be self-sufficient in power generation
Source: Platts, CEZ, SE
gas
hydro
nuclear
coal
- 24%
Available capacity in SlovakiaMW
Nováky A
Nováky B
Vojany 1
Vojany 2
J. Bohunice
J. Bohunice
IPP
Total 2006
Total 2008
Totalcumulative
TG 2 a TG
blok 3 a 4
blok 3 a 4
blok 25 a 26
blok 1
blok 2
2006
2008
2006-2010
2006-2010
54
220
220
220
440
440
200
1,154
440
1,794
Plant UnitCapacity
(MW)Shutdown
year
Yoy capacitydecline 14%

11
CEZ WILL MOVE MOST OF ITS EXPORTS TO SLOVAKIA AND HUNGARY
0%10%20%30%40%50%60%70%80%90%
2004 2005 2006 2007
GermanySlovakia
Source:CEZ
Germany60 / 40
Austria7 / 5
Slovakia30 / 55
EUR 0.13**
EUR 12.5**
Poland3 / 0
Germany
AustriaSlovakia
Hungary
Poland CEZ´s power export structure in %
Export TWh
2.7 2.3-2.2
Czech – SlovakPower import / export balance
2005 2006 2007
20 16 14 14

12
FAST DEMAND GROWTH ALONG WITH SIGNIFICANT POWER CAPACITY DECOMISSIONING AT THE END OF THIS YEAR WILL RESULTY IN 8 TWH DEFICIT
0.4
2.7
1.4
1.4
2.2
8.1
Demandgrowth
J.Bohuniceshutdown
Vojany andNováky
shutdown
Demandgrowth
Tušimiceshutdown
Yoy balancechange in CR
and SR
Elimination of deficit of >8 TWh (approx. 11% CR demand) possible only via
imports orinitiation of expansive units (till now reserved)
Both will have a strong impacton regional wholesale price development
Yoy change of power balance in CR and SRTWh
Source:Slovak balance change – Platts, Energy in East Europe Issue 82 (decreased by 10% to reflect own consumption); CEZ
Temporaryduring retrofit
SR ČR

13
ERA OF RESERVE CAPACITY SURPLUS USED FOR EXPORTS OUTSIDE OF CZECH AND SLOVAK REPUBLICS WILL BE OVER IN THREE YEARS
Source: CEZ
105
110
115
120
125
2006 2007 2008 2009 2010 2011
Czech and Slovak power market supply and demand development TWh
supply in CR+SR, incl. imports from Poland and Ukraine
demand in CR+SR, incl. possible export to Germany, Austria and Hungary Need to operate
more expansive and less reliable capacity More frequent price spikes and crisis situations including risk of black-outsNeed for fast new capacity construction
8.1 2.9 5.9 2.8 4.6Annual change

14
DEFICIT CAN BE COVERED BY IMPORTS FROM MORE EXPANSIVE MARKETS OF GERMANY AND AUSTRIA RESP. BY LOWERING EXPORTS TO THESE COUNTRIES
Poland
Hungary
Ukraine
Source: UCTE, CEPS
First case: due to problems in Polish grid CEPS provided 400MW emergency support; Second case: due to cumulative 200MW generation fallout
Breach of confirmed contracts should happen only in exceptional cases
Poland is likely to lower exports in the next year; in July 2006 PSE twice canceled contracted cross border supplies due to lack of generation outputIn 2008 – 2015 complete decommissioning of up to ~5000 MW is expected due to environmental concerns
Already in deficit (2005 imports of 16% total consumption, prices at German levels)
Limited export possibilities of Burstyn island of 550 MW exhausted (UCTE technical limits), additionally used for supplies to Hungary

15
EU ETS INCENTIVISED CEZ TO ACCELERATE AND INCREASE ITS INVESTMENTS IN GENERATION
EU ETS driven plan**
Original plan
2005 07 10 12 15 2020
€ 700 M
€ 350 M
30 Mton
34 Mton
38 Mton
INVE
STM
ENTS
*EM
ISSI
ON
S
NAP
Source:CEZ
* CO2 directly related projects
ILUSTRATIVE SCENARIO

16
AGENDA
Regional power markets development Alan Svoboda
Regional power balance development
Price signal from surrounding countries
Virtual Power Plant auction Michal Skalka
Auctions in surrounding countries
Virtual Power Plant auction procedure

17
2006
Commodityexchange
Tradingtransac.
Bilateraltransac.
36.5
42.0
43.2 – 44.0
First indicators of 2007 wholesale prices in the regionEUR/MWh*
2007
2006
SEauction
Discotenders
36.5
42.8 – 44.6
~ 42.5
2007
2006
Tradingtransac.
40.0
47.52007
PRICE LEVEL OF ALREADY SIGNED CONTRACTS IN THE REGION CONFIRMS THAT THERE IS AN INCREASING MARKET DEMAND FOR ELECTRICITY CONTRACTED 1 YEAR AHEAD
Source:CEZ, SE, MVM, TFS, Press clippings, KBK; transactions executed in 2006
Note: CZK/EUR 28.50, SKK/EUR 38.6, HUF/EUR 280.0
CR66
SR29
Hungary39
5
15
10
In the map volume traded in TWh (est.) vs. respective country's consumption

18
CEZ WILL OFFER THE VIRTUAL POWER PLANT ON EQUAL TERMS (SET BY THE ANTITRUST OFFICE) THIS YEAR AS LAST YEAR
Basic facts
Requirement to offer VPP in public auction set by the Antitrust Office as one of the conditions for integration of CEZ + 5 DISCOS
VPP guarantees third parties access to CEZ generation capacity, including the possibility to place an exact shape of generation diagram
Total supply 400 MW (with decrease to 240 MW in summer months) divided into 8 blockswith 50 MW
Minimum output represents minimum electricity off-take in corresponding season so that the real power plants wouldn’t fall under the technical operation minimum
Available capacity of virtual power plant blockMW
0
10
20
30
40
50 maximum output
minimum output
1 2 3 4 5 6 7 8 9 10 11 12 months
zdroj: ÚOHS; ČEZ, a. s.

19
VIRTUAL POWER PLANT IS AGAIN OF A HIGH INTEREST
Auction participants can be energy traders financially and personally independent on CEZ, a. s.
Auction is set up by independent auction office Fin-servis, a.s.www.fsk.cz
Number of registered participants
zdroj: ČEZ, a. s.
31.5.2006auction
announcement
3.7.2006start of the
registration round
26.7.2006 at 15.00 hodin
end of the registration round
2.8.2006 start of the 1st
auction round
0
5
10
15
20
25
2005 2006
reguests 44 ?
Already confirmed17
20?16

20
EVALUATION AND PUBLICATION OF AUCTION RESULTS WILL TAKE PLACE IMMEDIATELY AFTER IT’S TERMINATION ON 2.8.
Virtual power plant auction takes place on 2.8.2006 at the premises of Ceskomoravska komoditní burza Kladno, nam. Sitna 3105 organized by independent auction office Fin-servis, a.s.
CEZ expects further electricity sales until the complete sources exhaustion by auctions
CEZ will inform about all sales auctions without delay