Ceylon Investment PLC - 2013/2014
88
Transcript of Ceylon Investment PLC - 2013/2014


Ceylon Investment PLC | Annual Report 2013/14 | 1
For the year ended/as at 31st March 2014 2013 Change (%)
Revenue 496,779 445,977 11
Profitfromoperations 457,551 472,042 (3)
Shareofprofitofequityaccountedinvesteesnetoftax 726,501 728,539 -
Profitbeforetaxation 1,182,416 1,200,571 (2)
Profitfortheyear 1,152,357 1,181,968 (3)
Totalothercomprehensiveexpensefortheyear (1,032,086) (101,844) 913
Totalcomprehensiveincomefortheyear 120,271 1,080,124 (89)
Netcashgeneratedfromoperatingactivities 16,037 492,886 (97)
Totalequity 8,425,372 8,723,789 (3)
Returnonordinaryshareholders'funds(%) 13.68 13.55 1
Earningspershare(Rs) 11.70 12.00 (3)
Dividendpershare(Rs)* 2.50 1.75 43
Netassetspershare-Bookvalue 85.52 88.55 (3)
Netassetspershare-Marketvalue 117.55 130.74 (10)
CeylonInvestmentPLC-Fundvalue** 11,865,565 12,855,629 (8)
Stock market data Allsharepriceindex 5,968 5,736 4
S&PSL20Index(points) 3,280 3,294 -
Marketcapitalisation(000') 7,339,358 7,881,190 (7)
Shareprice(Rs.)
Yearend 74.50 80.00 (7)
High 102.00 115.00 (11)
Low 73.10 58.10 26
*Basedonproposed/Interimdividends.
**Basedonfairvalueofportfolioafteradjustingforcashandcashequivalents
Financial HighlightsInRupeesthousands

2 Ceylon Investment PLC | Annual Report 2013/14
Chairman’s Statement
Chairman’s StatementIwelcomeyoutothe68thAnnualGeneralMeetingoftheCompanyandonbehalfoftheBoardofDirectorstakepleasureinpresentingtheAnnualReportandAuditedAccountsoftheCompanyfortheyearended31stMarch2014.
TheyearunderreviewhasbeenaquietonewiththeColombostockmarketrecordingmarginalpositivegrowthduringtheperiodunderreview.GlobalequitymarketshavebeenchallengedwiththeannouncementofthequantitativeeasingtaperingandtheuncertaintiestherebywereimpactingemergingmarketsliketheColomboBourse.Howeveronthedomesticfront,wesawanidealenvironmentbeingmappedforabuoyantequitymarketwithinterestratessteadilycomingdown,withtheCentralBanksettingthedirectionwithpolicyrates.Economicfundamentalsalsoimprovedsettingthefoundationforsolideconomicgrowth,withasteadyinterestandexchangerateregime.Howeverinvestorconfidenceremainedcautiousandwesawlocalparticipationatalow,preferringawaitandseeapproachandoptingforfixedincomeinstrumentssuchasdebenturesthatofferedattractivelowerriskreturns.Howeverforeignfundswerenetbuyersduringtheperiodofreviewandwereseencollectingfundamentalstocksatlowvaluations.WeatCeylonInvestmentbeinglongterminvestorsembracedthisopportunitytogrowtheportfoliobytransformingfromfullyvaluedtoundervaluedenterprises.Marketvolatilityduringtheyearunderreviewincreasedthuspresentingopportunitiesforbothbuyingandsellingofsecurities.TheColombobourseflaggedapositivereturnof4.06%fortheperiodMarch2013/14.
Despitethevolatileeffectsofbothlocalandoverseasmacrofactors,atCeylonInvestmentwestillremainconfidentofthelongtermpotentialofSriLankanequitiesandthesustainabilityoftheeconomicdevelopmentplanssetinplace.WebelievethatthelongtermdevelopmentpotentialofSriLankawillflowthroughtoits
equitymarketsandindicatorssuchasmarketcapitalisationtoGDP(currently29%)willimproveovertime.Forthistohappen,weneedagreaterdepthofcompaniestoinvestin,growthingoodqualitycorporateearningsandstrongforeigninflows.Needlesstosayseriousinvestorconfidencewillimprovewhenpolicymakersaswellascorporatestakeactiontodemonstratesustainablegrowthintheeconomyandbusinessenvironment.Atnationallevel,wereckonthiswouldenvisagestablemacro-economicindicatorsandconsistentpolicyframeworkgoverningprivatesectorinvestments.Atcorporatelevel,aggressivegrowthstrategies,investmentintoprofitableexpansionandgoodgovernanceandmanagementstructureswouldwarrantseriouslongterminvestorconsiderationandcommitment.
Weareencouragedbytherapiddevelopmentsincapitalmarketswiththeinfluxoflisteddebentureissueswhichwillhelpopenupanactivedebtmarket;aswellastheconceptofunittrustinvestinggainingpopularityandmomentum.Furthermore,theentryofnewinstitutionalprivateequityinvestorstotheunlistedmarketisanencouragingsignthatthisspacetoowouldimproveindisciplineandprofessionalismovertime.Werecognisetheeffortsthatpolicymakersandregulatorshavemadetospurcapitalmarketdevelopmentovertimeandhopethatfutureenactmentswouldfurtherstrengthenthestepsalreadytaken.
TheCompanyrecordedaprofitaftertaxofRs.1.2bndespitevolatileconditions.Amarginalupsideof4.06%wasrecordedforthebenchmarkAllSharePriceIndexandthemoreselectStandard&PoorSL20recordedanegative0.41%.OurportfoliovaluedecreasedtoRs.11.86bn,fromRs.12.86bnayearearlier;recordingadepreciationof7.70%vis-à-vistheindexgrowthgivenabove.Theactivelymanagedportfoliosgrew8.05%vis-à-visthemarketperformanceof4.06%ontheASPI.Ourperformancewasattributedtobookingofprofitsonselectedovervaluedstocks,capturingmarket
anomalyandbookingsubstantialcapitalgainsdespitesubduedmarketconditions.
Onevaluatingthemediumtermperformance,fiveyearcompoundedportfoliogrowthratewas31.1%p.a.onmarketvaluebasisand49.2%p.a.onmarketcapitalization,vis-à-visanAllShareIndexgrowthof29.5%p.aforthesameperiod.ThishighlightsthelongtermtrackrecordofCeylonInvestments.Thebuildupofcashbytheportfolioisnowevidentwiththeintentionofinvestingonlywhenfundamentalsjustifyacquisition.SizeablecashyieldsareturntotheinvestorsbywayofinterestincomeaddingtothetotalreturnofCeylonInvestment.
ThemanagementoftheactiveportfolioofthecompanyhasbeenentrustedtoGuardianFundManagementLimited,theassetmanagementcompanyoftheCarsonCumberbatchGroup.ItisregisteredwithandregulatedbytheSecuritiesandExchangeCommissionofSriLanka.Guardian’spositioningasafullyfledgedinvestmentcompanyintheSriLankanmarketsupportedbyitsowncapital,willbereinforcedwiththekeyfocusareasbeingidentifiedascustomisedinstitutionalportfoliomanagement,unittrustmanagementandprivateequitymanagement.Corecompetenciesineachareahavebeenstrengthenedthroughcoreteamswhohavechoseneachaspectofthebusinessastheirdesiredcareerpath.
Onthecountryperspective,visibleinfrastructuredevelopmentistakingplaceintermsofroadnetwork,portsandairports,whichhavebeenfundedbythepublicsector.Thisnodoubtwouldaddtoeconomicgrowthintheyearsahead.AlsomanystrategicprojectshavebeenapprovedbytheGovernmentshowingitscommitmentinattractingforeigndirectinvestmentsbyofferingmanyconcessionstoattracttheseinvestors.Thelargescaledevelopmentprojectswilladdtotheimpetusofthecountry’sgrowthgoingforward.WeremainexcitedaboutSriLanka’sgrowthprospects.Wewilllooktoembracethisopportunitybybuyingintoattractivelyvalued

Ceylon Investment PLC | Annual Report 2013/14 | 3
companiesatopportunetimesexploitingthevagariesofthemarkets.Intheglobalcontext,SriLankaisnolongershieldedfrominternationalupheavalsandhencenewriskshavebeenaddedtothelocalinvestor.
ThecurrentchallengesfacedbySriLankaonitsinternationalstandingwillhavetobemanagedtoattractglobalcompaniestosetupoperationsandcommitdirectinvestments.Ontheaspectofregainingconfidence,thecountrycouldofferabetterbusinessfriendlyandtransparentenvironmentbypositivereinforcementofprivatesectorenterprise,aspeedyandefficientlegalprocessandessentiallygaininghigherrankingintermsoftheeaseofdoingbusiness.TheimportanceofsupportingforeignexchangeearningindustriescannotbeoveremphasisedgivenSriLanka’scurrentstateofdependenceonimportstofuelitsdrivetowardsgrowth.
Inconclusion,Iwouldliketothanktheshareholdersfortheconfidenceplacedinthemanagementovertheyearsandtotheregulatorsforsupportingourbusinesses.Iwouldalsoliketothankthemembersofourstafffortheiruntiringcontribution;theAuditCommittee,theRemunerationCommitteeandtheNominationCommitteefortheirguidanceandlastlymycolleaguesontheBoardfortheirvaluedinput.WebelievethatallourstakeholderswouldbenefitandbeapartoftheidentifiedgrowthpathoftheCompanyandurgetheinvestorstohaveconfidencegoingforward.
(Sgd.)Israel PaulrajChairman
25thJune2014Colombo

4 Ceylon Investment PLC | Annual Report 2013/14
Managers’ Commentary
Economy in PerspectiveTheSriLankaneconomyrecordedaGDPgrowthof7.3%in2013,upfrom6.3%recordedinyear2012.GDPgrowthwasdrivenbytheindustryandservicesectors.Theeconomyreboundedinthesecondhalfoftheyearwiththeagriculturesectorcomingonstreamwithfavourableweatherconditions.Theindustriessectorwhichaccountsfor31%ofGDPcontributed9.9%toGDPgrowthduringtheyear.Theservicessector,whichaccountsfor58%contributed6.4%andagriculturesectorwhichaccountsfor11%contributed4.7%.
Thecountry’sGDPpercapitaatmarketpricesimprovedtoUS$3,280in2013fromUS$2,922in2012ontrackinachievingthelongtermgoalofUS$4,000percapitaby2016.TotalGrossDomesticProduct(GDP)ofthecountrynowisatUS$67bnatcurrentmarketprices.FortheyearJan–Dec2013,SriLankapostedaBalanceofTradedeficitofUS$7,609mn,areductionfromUS$9,417mnrecordedlastyear.Thecontractioninthetradeaccountwasduetothepickupinexportstogetherwiththecontinueddeclineinimports.Alsohighergrossearningsonaccountofexportofservicesandremittancesfromworkerscontributedtonarrowingtheexternalcurrentaccountdeficitsignificantlyduring2013.Theservicesaccount
-5
-1
3
7
11
15
Agriculture Industry Services GDP
4Q 0
9
3Q 0
9
2Q 0
9
1Q 0
9
1Q 1
0
2Q 1
0
3Q 1
0
4Q 1
0
1Q 1
1
2Q 1
1
3Q 1
1
4Q 1
1
1Q 1
2
2Q 1
2
3Q 1
2
4Q 1
2
1Q 1
3
2Q 1
3
3Q 1
3
4Q 1
3
%
GDP & Sector Growth Rates
-5
-1
3
7
11
15
1.5% 2.1%
4.2%
6.2% 7.1%8.6% 8.0%
7.9%8.2%
8.4% 8.3% 6.3%7.9%
6.4%4.8%
7.8%6.8%
6.0%6.3%
8.2%
(DFCC)raisedUS$1,350mnandfinancialinflowsintheformofforeignloanswerealsosignificanttotallingUS$2,900mnwhichresultedintheBOPrecordingasurplusofUS$985mn.Duringthesameperiod,grossofficialreservesbyendDecember2013amountedtoUS$7,495mn,whereastotalinternationalreserves(grossofficialreservesandforeignassetsofcommercialbanks)amountedtoUS$8,574mnequivalentto5.0monthsand5.7monthsofimportsrespectively.
Inflation,asmeasuredbytheCCPI,easedto4.7%onayearonyearbasisforDecember2013fromayeartodatehighof9.9%inFebruary2013.Apositivetrendisdemonstratedwithconsumerpriceinflation(year-on-year)beingatsingledigitlevelsforthefifthconsecutiveyear,continuingthedecliningtrendin2013.
Inlinewiththeeasingofmonetarypolicy,liquidityinthedomesticmoneymarketrosesignificantlyandremainedinexcessthroughout2013withexcessrupeeliquidityaveragingaroundRs.23bn.AlsoadditionalliquiditywasreleasedtothemarketwiththereductionofStatutoryReserveRatio(SRR)inJuly2013.
TheCentralBankreducedpolicyratesthroughout2013resultinginsignificantdeclinesintheoverallinterestratestructure.TheStandingDepositFacilityRateandStandingLendingFacilityRatewerereducedby1.0%and1.5%respectivelyto6.5%and8.0%withannouncementsinMay13,Oct13andJan14.TheStatutoryReserveRatiowasreducedby2.0%inJuly13toincreaseliquidityinthefinancialsystem.Thebenchmark364dayT-billand91dayT-billfellby340basispointsand246basispointsrespectivelyreactingaggressivelytopolicyratereductions.FixeddepositrateswhicharealsoanchoredtotheT-billratesfellsharplywithbankfixeddepositratesprovidingnetreturnssimilartoT-billafterdeductingwithholdingtaxtowardsthestartof2014.
continuedtorecordasurplusasaresultofbuoyancyintourism,transportandinformationservices.Fortheyear,earningsfromtourism(up35%yoy)andworkersremittances(up13%yoy)cushionedthecurrentaccountoftheBalanceofPayments.
Exportsfor2013grewby6.3%toreachUS$10.39bn.Rapidgrowthwasexperiencedtowardstheendof2013inapparelexportstoSriLanka’skeymarketsofUSAandEU.Importsdeclinedin2013by6%toUS$18.0bnonaccountofadeclineinintermediategoodsandinvestmentgoodsby8.9%and7.3%respectively.Theoveralltradedeficit
narrowedbyUS$1.8bnwhichisadeclineof19.2%comparedtothedeficitin2012.Thustheexternalcurrentaccountdeficitnarrowedto3.9%ofGDPin2013from6.7%inthepreviousyearasaresultofimprovedearningsfrommerchandiseexports,serviceexportsandworkerremittances.
Inflowsintheformofforeigndirectinvestment(FDI)amountedtoUS$1,421mnwiththeinfrastructureandmanufacturingsectorsattractingthehighestinflows.ForeigninvestmentsingovernmentsecuritiesviaissuancefromstateinstitutionssuchasNationalSavingsBank(NSB),BankofCeylon(BOC)andDevelopmentFinanceCorporationofCeylon

Ceylon Investment PLC | Annual Report 2013/14 | 5
Dec Mar Jun Sept Dec Mar
12 13 13 13 13 14
TreasuryBill3M(%) 10.00 9.26 8.66 8.60 7.54 6.65
12M(%) 11.69 11.35 10.66 10.57 8.29 7.05
CallMoney(%) 9.85 9.49 8.55 8.43 7.73 6.94
PrimeLending(%) 14.40 13.77 12.09 11.94 9.88 8.57
Netcredittoprivatesectorhassloweddowntosingledigitlevelsof7.3%asatNovember2013comparedto31.6%inJuly13.Despitelowrates,sluggishlendingbybankshasalsoresultedinincreasingliquiditylevelsinthebankingsystemfurtherdepressingdepositrates.Theyieldcurvewhichhadaflat
0
5
10
15
20
Inflation-CCPI Core
Year on Year 12 Month Moving Average
Mar
-10
Nov
-09
Jul-
09
Mar
-09
Jul-
10
Nov
-10
Nov
-11
Jul-
11
Nov
-11
Mar
-12
Jul-
12
Nov
-12
Mar
-13
Jul-
13
Nov
-13
Mar
-14
%
4
7
10
13
16
Money Market Rates
Standing DepositFacility Rate
Standing LendingFacility Rate
AWDR AWPR91 Days T-bill
Jan-
11
Mar
-11
May
-11
Jul-
11
Sep-
11
Nov
-11
Jan
-12
Mar
-12
May
-12
Jul-
12
Sep-
12
Nov
-12
Jan-
13
Mar
-13
May
-13
Jul
-13
Sep
-13
Nov
-13
Jan
-14
Mar
-14
%
structureatthestartof2013sawadeclineofapproximately340basispointsintheshortertenorsand225basispointsonthelonger5yeartenors.Thishasresultedinamorenormalisedupwardslopingcurveasatyearend.TheannouncementsoftaperingquantitativeeasingintheUSAmaybringaboutupwardpressurein
governmentsecurityyieldsdependingonhowforeigninvestorsreact.Thusfarthereactionofforeigngovernmentsecurityholdershasbeenmild.However,significantsellingofgovernmentsecuritiesbyforeignholdersandremittingsuchproceedsbacktotheirrespectivecountriescancausesharpmovementsininterestratesandtheexchangerate.
Additionally,acriticalfactortowatchintermsofmaintainingstrongeconomicfundamentalswouldbethesustainabilityofexportgrowthandtheabilitytocontrolthetradedeficit,ifimportsdopickup.Thiswouldhaveatrickledownimpactonthecurrencyaswellasinterestratesandinflation.SriLanka’sdebttoGDPrationowstandsat78.3%anddebtservicingcostswouldimpactthefiscalpositionsignificantlyifthecurrencyweretodepreciate.Thefiscaldeficitat5.9%ofGDPisvulnerabletobothrecurrentandcapitalexpenditureanddebtservicingcosts.
Ascapitalmarketparticipants,weareencouragedbythepositiveeffectthatcurrencystability,lowinterestratesandbenigninflationwouldhaveoncorporates.Apickupincreditgrowthwouldbeessentialtobringaboutthenextwaveofeconomicactivitybuttheresultingimpactoninterestratesandimportsneedtobewatched.
Webelievethattheeconomicfundamentalsareconducivetopositivecapitalmarketperformance.Thekeyindicatorsareimprovingandlikelytoaddtotheimpetusofthecountry'sgrowthmomentum.Howeverintheshorttermglobalshockscouldadverselyimpactusandchallengethestatusquo.Butinthelongtermwecountonalltheimportantindicatorstrendingpositivelytowardsgreaterinvestment,growthandstability.Policymakers’proactivestanceonsomeoftheseissuesisevidentwiththeCentralBankunveilingtheMasterPlanforconsolidationinthefinancialsector,withtheaimofbuildingastrong,dynamicandinternationallycompetitivefinancialsector.

6 Ceylon Investment PLC | Annual Report 2013/14
Managers’ Commentary
Equity MarketsTheAllSharePriceIndex(ASPI)increasedmarginallyby4.78%forthecalendaryear2013.ForthefinancialyearApril2013toMarch2014theASPIincreasedby4.06%.Themarketwasbuoyantinthefirsthalfof2013whereitreachedahighof15%inMay2013.However,afterAugustthemarketweakenedsignificantlyonaccountofvolatilityinlargecapitalisedcounterssuchasJohnKeellsHoldingsandCeylonTobaccocausedbyforeigninvestorsreactingtointernationaldevelopmentsonQEtapering.However,tradingpickedupintheNewYearof2014withinvestorsrefocusingonequities.NetforeigninflowstotheColomboStockExchangeamountedtoRs.22.7bnandwerefocusedmostlyonbanks,conglomeratesandmultinationals.ThepositivemoodhoweverwasshortlivedwithmarketenthusiasmtaperingoffduringmonthsofFebruaryandMarchtoclosetheAllShareIndexat5968levels.During
SLRs.Per
unit as at 31/12/12
SLRs.Per
unit as at 31/12/13
SLRs.Per
unit as at 31/03/14
App./(Dep) for calendar
year2013
App. /(Dep.) for calendar
year 2014 to date
US$ 127.16 130.75 130.67 -2.75% 0.06%
STG 205.47 215.58 217.12 -4.69% -0.71%
Euro 168.13 180.45 179.50 -6.83% 0.53%
Yen 1.48 1.25 1.28 18.78% -2.4%
6
8
10
12
Treasury Yield Curve
26-Dec-12 27-Mar-13 28-Jun-13 25-Sep-13 31-Dec-13 31-Mar-14
%
3 M
onth
6 M
onth
1 Ye
ar
2 Ye
ar
3 Ye
ar
4 ye
ar
5 ye
ar
yearinthefirstmonth(Jan2014)recordinganappreciationof5.67%andmarginallyappreciating0.94%forthethreemonthperiod(JantoMarch2014).
Dailyaverageturnoverlevelsforthefirsthalfof2013wasahealthyRs.1.02bn,however,thesecondhalfoftheyearsawadeclinetoRs.646mnindicatinglowerparticipationinthelatterhalfoftheyear.AlsodailyaverageturnoverrangingfromRs.500mntoRs.1,000mnwasevidentinthefirstquarterof2014.
Takingintoaccountamorelongertermperspective,themarkethasgivenacompoundannualnegativegrowth(CAGR)of6.18%p.ainthelastthreeyearsandapositive29.51%p.atakingafiveyearperiod,demonstratingthatmarketcyclesandvolatilitydopersistforalongtime,andinthisinstancetheprolongedcorrectionmaybearesponsetotheexuberanthighsthatwererecordedafterthewarended.Howeverwhatisobservedisthatonlongcycles,equitymarketscontinuetoofferaboveaveragereturnsincomparisontofixedincomeyieldsandisabetterhedgeforinflation.
Muchofthemarketactivityhasbeenfromtheforeignside.AnetforeignoutflowofapproximatelyoverRs.6,848mnhasbeenrecordedintheNewYear(fortheperiodJantoMar2014).Thisisagainstatotalnetinflowof
theperiodofreview,markettradedbetweenalowofASPI5800indexlevelandhighofASPI6400indexlevel,givingatradingbandof600basispoints.Sincethen,aresurgenceofactivityhasbeenrecordedinthenewfinancial
0
1,000
2,000
3,000
4,000
5,000
6,000
7,000
ASPI and S&P SL20 1 Year Movement
ASPI S&P SL20
Jun-
13
May
-13
Apr-
13
Mar
-13
Jul-
13
Aug-
13
Sep-
13
Oct-
13
Nov
-13
Dce
-13
Jan-
14
Feb-
14
Mar
-14
Inde
x
4.1%
-0.4%

Ceylon Investment PLC | Annual Report 2013/14 | 7
Rs.22.7bnrecordedin2013.ForeigninterestoractivitywasevidentoncounterssuchasCommercialBank,JohnKeellsHoldings,HattonNationalBank,AitkenSpence,CeylonTobaccoandChevronLubricants.Howevermixedsentimentwasevidentonthecounterswithbothsellingandbuyingfromforeignfundmanagers.Theoutflowinthecurrentcalendaryearisduetoflightofcapitalfromemergingmarketswithfundssellingoutduetoredemptionsandtransformingtodevelopedmarkets.Alsoforeigninvestorsinsuchfundshavebeenshiftingfromequitiestofixedincomeassetclassputtingpressureonovervaluedorfairlyvaluedmarkets.Ontheotherhandfrontiermarketshavebeenspared.Thepositivefactorwasonthedomesticparticipationincreasingwithbothinstitutionalandretailactivitybeingevident,posingahealthyoutlooktothemarketinthefuture.
31st Dec 12
31st Mar 13
31st Dec 13
31st Mar 14
Movement for 2013
Movement for 2014
to date
Movement for F/Y
2013/14
ASPI 5,643.0 5,735.6 5,912.7 5,968.3 4.7% 0.9% 4.1%
Avg.T/ORs.mn
649 909 641 594 -1.2% -7.3% -34.6%
MktCapRs.bn
2,167.5 2,205.0 2,459.9 2,498.0 13.4% 1.5% 13.2%
MktP/Eratio
15.9 15.5 15.9 15.9 -0.1% 0.1% 2.7%
1,000
2,000
3,000
4,000
5,000
Value of Rs. 1,000 Invested in Equity vs. Fixed Income against Inflation - 5 Year
Fixed Income Equity Inflation
Rs.
Dec
- 0
8
Dec
- 0
9
Dec
- 1
0
Dec
- 1
1
Dec
- 1
2
Dec
- 1
3
CAGR 31.5%Rs. 3,934
Rs. 1,710
Rs. 1,344
CAGR 11.3%
CAGR 6.1%
MarketcapitalisationoftheCSEremainedabovetheRs.2tnmarkatRs.2.48tn,withdomesticparticipationat63%andforeignparticipationat37%asatendMarch2014incomparisontodomesticmixof64%andforeignparticipation
at36%endMarch2013.Retailinterestwaslimitedduetolowinvestorconfidence.Howeverinstitutionalactivityhasbeenencouraging.Alsoduringtheperiodofreview,investorswereseenshiftingfundstolisteddebenturesatattractiveyields,raisingfundstothevalueofRs.68.2bnin2013.Demandbybothcorporateandretailinvestorcategorywasevidentduetotaxadvantageandinthebackdropofdeclininginterestratescenario.ThuscapitalraisingviatheIPOroutewasminimalwithlimitedpublicofferingsraisingRs.2bninvalue.RightsissuesraisedRs.25.6bnduringthecalendaryear2013incontrasttoRs.13.3bnraisedthroughin2012.Dividendyieldofthemarketincreasedto2.9%in2013from2.4%in2012.
TheCSEiscurrentlytradingata15.93timesPEratiobasedonlastyear’searnings,downfromaalltimehighof25timesrecordedinFeb2011.TheaveragePEbandwehavewitnessedattheColomboStockmarkethasbeen14timestakingalongcycle.Ona1yearforwardearnings2014/15themarketistradingat11.5timesand2yearforwardearnings2015/16themarketcomesdownto10.2times.HowevertheCSEremainsfairlyvaluedvis-àvisotherregionalmarkets.TheperformanceoftheSriLankanstockmarketinrelationtootherregionalpeershasbeenpoor.Thedevelopedmarketshavebeenshowingattractivegainsduetotheturnaroundoftheireconomies.TheUShasshownimprovementsintheireconomic
0% 20% 30% 50% 70% 90%10% 40% 60% 80% 100%
Turnover - Domestic vs Foreign
T/O -Domestic T/O-Foreign
63% 37%64% 36%66% 34%
69% 31%
68% 32%
74% 26%
62% 38%
59% 41%
68% 32%
58% 42%
77% 23%
68% 32%
64% 36%Mar-13
Apr-13
May-13
Jun-13
Jul-13
Aug-13
Sep-13
Oct-13
Nov-13
Des-13
Jan-14
Feb-14
Mar-14
5,132
3,869
4,878
1,514
1,061
2,237
1,404
3,160
-516
323
1,035
-5,075
-2,808
Net Foreign inflow (Rs. Mn)Rs.19,000 mn outflow (YE 2011), Rs. 38,681 mn Inflow (YE 2012), Rs. 22,733 mn Inflow (YE 2013)

8 Ceylon Investment PLC | Annual Report 2013/14
Managers’ Commentary
indicatorssuchasunemployment,housingandconfidencelevels.AlsotheEurozonehasshownaturnaroundfromthebrinkofcollapseandmuchisexpectedintheyearahead.Takingacuefromthesefactors,marketsintheseregionshavedonespectacularlywell.ThusmarketsliketheColomboBoursehasunderperformed.Duringtheperiodofreview,themarketcaptoGDPdeclinedmarginallyto29%withthecountry’sGDPgrowingatafasterpacethanthemarketcapitalisation.
0
500
1,000
1,500
2,000
2,500
3,000
Local Foreign Mkt Cap of Equity held by Foreign Investors (%)
Sep-
09
Jul-
09
May
-09
Mar
-09
Nov
-09
Jan-
10
Mar
-10
May
-10
Jul-
10
Sep-
10
Nov
-10
Jan-
11
Mar
-11
May
-11
Jul-
11
Sep-
11
Nov
-11
Jan-
12
Mar
-12
May
-13
Jul-
13
sep-
13
Nov
-13
Jan-
14
Mar
-14
Rs. b
n.
Foreign Exposure to Equity Holdings at CSE
30
35
40
%
0
500
1,000
1,500
2,000
2,500
3,000
3,500
4,000
4,500
5,000
Daily T/O Avg Market PER
Dec
-09
Sep-
09
Jun-
09
Mar
-09
Dec
-10
Sep-
10
Jun-
10
Mar
-10
Dec
-11
Sep-
11
Jun-
11
Mar
-11
Dec
-12
Sep-
12
Jun-
12
Mar
-12
Dec
-13
Sep-
13
Jun-
13
Mar
-13
Mar
-14
Inde
x
P/E
Daily Average Turnover Vs Market PE
5
10
15
20
25
30
-10 -5 0 5 10 15 20
International Market Performance 2014 (Jan-Mar)
MSCI Emerging IndexMSCI Frontier Index
VN Index - Ho Chi MinhThai Index
KLCI MalaysiaJKSE CompositeSSE Composite
NikkeiFTSE
Dow JonesASPI
Karachi IndexStraits Times
BSE SensexHang Seng
-0.8%5.4%
16.7%5.9%
-0.9%11.5%
-3.8%
-2.2%-0.7%0.9%
7.5%1.0%
-4.9%5.7%
-8.9%
%
-10 0 10 20 30 40 50 100
International Market Performance 2013
37%
36%
34%
31%
32%
26%
38%
41%
32%
42%
23%
32%
36%
MSCI Emerging IndexMSCI Frontier Index
VN Index - Ho Chi MinhThai Index
KLCI MalaysiaJKSE CompositeSSE Composite
NikkeiFTSE
Dow JonesASPI
Karachi IndexStraits Times
BSE SensexHang Seng
-4.9%21.3%
21.9%-6.7%
10.5%-0.9%-6.7%
14.4%26.5%
4.7%49.4%
0.01%
2.8%
8.9%
56.7%
%
Sector Mar-14 Mar-13 Performance
Bankfinance 13,288.16 13,227.3 0.5%
Bevfoodtobacco 19,273.09 16,057.6 20.0%
Chemicals 5,900.70 6,667.4 -11.5%
Construction 2,734.1 2,695.8 1.4%
Diversified 1,780.1 1,888.9 -5.8%
Footweartextile 728.8 780.4 -6.6%
Healthcare 820.9 581.6 41.1%
Hotelstravels 3,152.0 3,306.2 -4.7%
Investmenttrust 17,039.2 17,569.6 -3.0%
IT 81.0 80.1 1.2%
Landproperty 578.5 476.1 21.5%
Manufacturing 2,843.4 2,590.0 9.8%
Motors 14,898.2 14,584.6 2.2%
Oilpalms 96,882.1 97,201.2 -0.3%
Plantations 717.1 788.7 -9.1%
Power&energy 139.6 102.3 36.5%
Services 21,209.6 20,229.7 4.8%
Storessupplies 18,600.8 21,584.4 -13.8%
Telecom 175.0 169.7 3.1%
Trading 13,664.4 15,891.2 -14.0%
ASPI 4.1%

Ceylon Investment PLC | Annual Report 2013/14 | 9
Comparative Price Earnings RatiosINDEX MARKET CURRENT YR 1 YR
FORWARD EST.
ASPI Colombo 12.39 10.82
Sensex Bombay 16.61 14.19
DowJonesIndustrials NewYork 14.84 13.60
FTSE100 London 13.34 12.29
HangSeng HongKong 10.25 9.43
JCIComposite Jakarta 15.20 12.92
Nikkei225 Tokyo 19.22 16.41
SSEComposite Shanghai 7.87 6.86
STTimes Singapore 14.32 12.96
BursaMalay Malaysia 16.33 14.91
Set Thailand 13.13 11.6
Karachi100 Pakistan 8.02 7.13
IBOV Brazil 10.17 9.00
IPSA Chile 15.32 13.22
RTSI$ Russia 5.07 5.00
MSCIFrontiermkts(MXFM) 11.93 10.57
MSCIEmergingIndex(MXEF) 10.35 9.35
Financial Review and Shareholder ReturnsCeylonInvestmentPLCreportedaprofitaftertaxofRs.1,152.3mnfortheyearended31stMarch2014,onarevenueofRs.496.8mn.Theprofitaftertaxrecordedadecreaseof3%andrevenuerecordedanincreaseof11%.AlsoanannualportfoliodepreciationofRs.990.1mnwasrecordedfortheperiodunderreview(2013depreciationofRs.841.7mn)
TheCompany’sEPSdecreasedtoRs.11.70fromRs.12.00,adecreaseof3%.ThevaluepershareoftheCompanyamountstoRs.117.55onamarketpricebasednetassetvaluation.HoweverthemarketpriceoftheCompanyistradingatadiscountof36.7%asat31stMarch2014.
TheCompanypaidaninterimdividendofRs.2.50pershare,animprovementonthedividendofRs.1.75paidin2012/13.TheCompanyhasbeenmaintainingaconsistentdividendpolicytomatchshareholderexpectationsdespitethevagariesofthestockmarket.ThedividendyieldoftheCompanyhasincreasedto3.36%,Shareholderwealthgainduringtheyearwas-3.75%.
Value of Rs. 1000/- Invested in CSE& Ceylon Investment
0
3,000
6,000
9,000
12,000
15,000
Mar
9
Mar
10
Mar
11
Mar
12
Mar
13
Mar
14
Ceylon Investment CSE-ASPI
Rs. 8,950
Rs. 3,644
CAGR 46.5%
CAGR 29.5%
Rs.
NAV Per Share vs. Market Price - 5 Years Quarterly
0
300
600
900
1,200
1,500
Mar
-09
Jun-
09Se
p-09
Dec
-09
Mar
-10
Jun-
10Se
p-10
Dec
-10
Mar
-11
Jun-
11Se
p-11
Dec
-11
Mar
-12
Jun-
12Se
p-12
Dec
-12
Mar
-13
Jun-
13Se
p-13
Dec
-13
Mar
-14
NAV per share at Market Value Price per share
Rs.
CICL Mkt Cap Growth vsAll Share Index Growth
0
100
200
300
400
500
600
700
800
CICL Mkt Cap Indexed ASI Indexed
2009
2010
2011
2012
2013
2014
Com
posi
te CAGR 49.2%
CAGR 29.5%

10 Ceylon Investment PLC | Annual Report 2013/14
CashgeneratedfromoperationsamountedtoRs.16.0mnasatendMarch2014,thusstrengtheningthecashpositiontoRs.806.5mn.ThisisadecreaseofRs.155.5mnfromlastfinancialyearofRs.961.9mn.
Totalshareholderreturnfortheyear2013/14hasbeen-3.75%takingintoaccountbothsharepriceappreciationandcashdividendreceivedfortheyear.Takingamorelongtermhorizon,theshareholdersofCeylonInvestmentgotareturnof46.52%asdepictedintable'ShareholderReturns'givenabove.Incomparisontomarketbenchmarkperformanceyourinvestmenthasgrownabovethemarket
average.
Investment Performance and StrategyCeylonInvestmentportfolioissegmentedintodiscretionaryandnon-discretionarycomponentsbasedonabilitytoinfluencedecisionmakingonpurchasesanddisposals.Thediscretionarycomponentoftheportfolioisfurthermadeupofthetradingportfolioandlongtermportfolio
Managers’ Commentary
toreflectdifferentapproachestomanagement.ThetotalportfolioonmarketvaluebasisisvaluedatRs.11.86bnattheyearendfromRs.12.86bnasat31stMarch2013,adepreciationof7.70%againstthebenchmarkAllShareIndexappreciationof4.06%andStandard&PoorSL20Indexdepreciationof0.41%forthesameperiodThecompositeperformanceisdetailedbelow.
Ourinvestmentstrategyisbasedonafundamentalbottomupapproachtoinvestingwhichisverymuchresearchbased.Ourresearchmodelsplaceanintrinsicvalueoncompanieswetrackandourdecisionstobuy/sellwouldbebasedonwhethersharepriceisunder/overvaluedtothedeterminedintrinsicvalue.Ourdecisionsaredrivenbyaqualitativeevaluationoftheinvestee’sbusinessmodel,competitivepositioning,financialstrength,managementcapabilityandexpansionpossibilities.However,wheninvesting,wetend
As at 31st March 2014 2013 Change %
Discretionaryportfolio(‘000) 3,971,624 3,675,880 8.0
Totalportfolio(‘000) 11,865,565 12,855,629 (7.7)
Benchmark–ASPI(Points) 5,968.3 5,735.7 4.1
Shareholder Returns 31-3-2009 31-3-2010 31-3-2011 31-3-2012 31-3-2013 31-3-2014
ASPI 1,638 3,725 7,226 5,420 5,736 5,968ASPIgain -35.8% 127.4% 94.0% -25.0% 5.8% 4.1%Startoftheyear -Quantity 1,000 1,000 801 4,085 4,085 4,085 -MPS 78.00 58.00 271.00 151.00 78.30 80.00 -Wealth 78,000 58,000 217,071 616,835 319,856 326,800Dividend -DPS 7.00 6.70 1.00 1.25 1.75 2.50 -Value 7,000 42,978 801 5,106 7,149 10,213Endoftheyear -Quantity 1,000 801 4,085 4,085 4,085 4,085 -MPS 58.00 271.00 151.00 78.30 80.00 74.50 -Wealth 65,000 260,049 617,636 324,962 333,949 314,545AnnualShareholderwealthgain% -16.7% 348.4% 184.5% -47.3% 4.4% -3.75%Totalreturntoshareholders-5Y 46.52%
Profit to Shareholders vs Cashflows Generated (Rs.000')
-300000
0
300,000
600,000
900,000
1,200,000
1,500,000
2010
2011
2012
2013
2014
Profit attributable to shareholderCashflow from operating activities
Rs.
NAV Per Share (Market valueBasis) vs Price Per Share (Rs.)
0
50
100
150
200
250
300
350
400
2010
2011
2012
2013
2014
NAV per share at Market ValuePrice per share
Rs.
EPS vs Dividends (Rs.)
0
3
6
9
12
15
2010
2011
2012
2013
2014
EPSDPS
Rs.

Ceylon Investment PLC | Annual Report 2013/14 | 11
tolookatthemacrolevelpictureaswellastodeterminetheattractivenessoftheenvironmentwhenmakinginvestmentdecisions.Thisismoreasaguidetodeterminingtheenvironmentofinvestingthanforminganopiniononinvestmentfinds.Weregularlybalanceourexistingportfolioandtransformfromovervaluedtoundervaluedstocks.Similarly,wemakecallswhenwetotallygetoutofstockandremainincashuntilsuchtimeaswediscoverapotentialundervaluedcompanythatfitsourinvestmentprofile.
Ourportfoliocontinuestoleanheavilyonthediversifiedsector,whichisaproxyfortourism,bank&finance,food&beveragesandthepalmoilsectors.Thissectorcoversabroadspectrumofbusinessesfromwhichwegetindirectexposurebeinginthissector.WebuiltexposuretoAitkenSpencePLCbutwerelimitedinaccumulatingHemasHoldingbeforetheshareovershotourbuypricerange.WecontinuetoholdareducedexposuretoJohnKeellsHoldingsthemostliquidforeigndrivenstockontheCSE.Wealsoarebullishonthebanking&financesector,whichwebelievewillyieldgoodmediumtolongtermreturnswiththeannouncementofproposedconsolidationandresultingsynergies,thusholdinganover–weighttothesector,whichmainlyconstitutesSampathBank,NationsTrustBankandCommercialBankofCeylon.Themixofbanksinourportfoliorangesfromhigherriskbalancesheetstoconservativeones,andfromlargesizetomediumsizecommandingvaryingmarketshares.Allarecurrentlyundervaluedintermsofforecastvaluations.Weremainunderweighttobeverages,food&tobaccosectorwhichisthelargestsector
attheCSEduetoourportfolio’sstanceonthemultinationalcompaniesrepresentedinthesector,whichwereperceivedtobeovervalued.Theminimalexposureinthesectorhasnegativelyimpactedtheportfoliointheyearunderreview.Alsoourunderweightcontinuesonhealthcareandtelecommunicationsectors,duetosellingofourholdinginAsiriHospitals.Howeveronthereversal,weaccumulatedDialogouronlyexposuretothetelcosectoratgoodprices.Ourportfolioconcentrationonafewsectorssupportsourphilosophyofstockpickingandwearenotoverlyworriedofthemismatchesbetweenourselvesandtheindex.However,ourconvictionininvestinginwhatweknowintermsofindustrypotential,growth,riskfactorsandcompetitionwoulddeterminefutureselectionofpotentialstocks.
Company Market value(000')
% of total portfolio MV
CommercialBankofCeylonPlc 617,643 19.52
JohnKeellsHoldingsPlc 375,258 11.86
DialogAxiataPlc 292,766 9.25
SampathBankPlc 269,211 8.51
AitkenSpencePlc 213,814 6.76
Duringtheyearended31stMarch2014,CeylonInvestmentmadeRs.1,508.7mnofnewinvestmentsandRs.1,096.3mnofdivestments.Hence,CeylonInvestmenthasbeenanetbuyerinthemarket,wherebyacumulativecashpositionofRs.809.2bnwasbuiltinkeepingwithourstrategyofdivestingwheninvesteecompaniessharepricesgobeyondintrinsicprices.Tillsuchtimeofidentifyingundervaluedstockswewouldlooktoearninterestincomeonexcesscash.
Thetaskofidentifyinggoodinvestmentsatundervaluedpriceshasbeenachallengeintheyearunderreview.Ourresearchteamhaslookedatsomeinterestingcompanieswithuniquebusinessmodels,wherewehavemetwithmanagementandformedourviews.Ithasbeenaninterestingjourneyevaluatingprospectiveandcurrentinvesteecompaniesandmeetingwiththemanagementtobaseouropinions.Ourquantitativeresearchfindingshavebeenenhancedwiththequalitativefindingsoncorporategovernance,complianceandhumanresourcemanagement.Ourlearninghasbeenextensivefromexperiencesfromthecompanieswehaveinvestedinandwillcontinueourbestpracticeoflookingforthebestmatchthatfitourcriteria.
Ceylon Investment - Sector Allocation
6.8%29.5%
3.6%
4.4%
2.1%
12.4%
5.9%
9.3%6.3%
23.6%19.6%
0 10 20 30 40 50%
46.5%19.6%
Other
Hotels and Travels
Health Care
Unit Trust
Telecommunication
Banks, Finance and Insurance
Divesified Holdings
21.5%
ASPI S&P SL20
Ceylon Investment Asset Mix
0.02%
79.6%
20.3%
Listed equity
Fixed income
Private equity
Top 5 Holdings

12 Ceylon Investment PLC | Annual Report 2013/14
Manager's Commentry
Profile of the Fund ManagersCeylonInvestmentfundsaremanagedbyGuardianFundManagementLtd(GFM),whichisafullyownedsubsidiaryoftheCompanyand
isregisteredwiththeSecuritiesandExchangeCommissionofSriLanka.ItmanagesthelargestlistedequityfundinSriLankaandhasbuiltupitscompetenciesinthefieldofportfolio
management,researchandsupportservices.TheCompanyhasextendeditsbusinessmodeltocaptureretailfundsbymanagingunittrustfundsviaajointventurepartnershipwithAcuityPartners(Private)Limited.Ourcompetenciesonfixedincome(FI)assetclassarebeingbuiltwiththeincreaseinassetsundermanagement(AUM)underthisassetclass.
Thefundmanagementcompanyisaprofessionaloutfitsetupwitheffectivecomplianceprocess,codeofethics&standardsofprofessionalconductforemployees.GuardianFundManagementhasexpandeditsoperationbyextendingitsfundmanagementcapabilitiestocompaniesoutsidethegroupfundsbuiltaportfolioofexternalclientbaseconsistingofprovidentfund,pensionfunds,corporateclientsandacountryfund.Toenablethemanagementofexternalclientfundsithasanindependentcomplianceofficertomonitorclientinterestandensureobjectivesarebeingmetwiththeriskprofileoftheclient.TheAUMunderthiscategoryhasgrowntoasizeableamount.
Our Future View Goingforward,theequitymarketisexpectedtoperformwellinthemediumtolongtermasSriLankadeliversonitsgrowthpotentialwhilealsobenefitingfromtherapiddevelopmentofcapitalmarkets.InvestorconcernswithregardtotheimpactoftheUSFederalReservetaperinganditsimpactonemergingmarketsmayresultinsignificantmarketandcurrencyvolatilitydependingonhowforeigninvestorsreact.Othershorterterminfluencessuchaselectionsandinternationaldevelopmentsmayresultinsignificantmarketvolatility.
Inourview,investorsentimentattheColombobourseshouldbecomebuoyantwithinterestratesatanalltimelow.Wefeelthatinvestorsshouldconvergetoequityassetclassmatchingriskreturnwithexpectedreturns.Thediscoveryofsuchopportunitymighttaketimebutasinstitutionalinvestorswebelievethatmuchopportunityawaitsontheequityfrontand
100
200
300
400
500
Discretionary Portfolio Performance 5 Year CAGR
GUAR - Discretionary ASPI S&P20
Mar
ch
2008/09 2009/10 2010/11 2011/12 2012/13 2013/14
June Sep
Dec
Mar
ch
June Sep
Dec
Mar
ch
June Sep
Dec
Mar
ch
June Sep
Dec
Mar
ch
June Sep
Dec
Mar
ch
CAGR 31.1%
CAGR 29.5%
CAGR 29.2%
Inde
xed
Com
posi
te
100
200
300
400
500
600
Total Portfolio Performance 5 Year CAGR
GUAR - Total ASPI S&P20
Mar
ch
2008/09 2009/10 2010/11 2011/12 2012/13 2013/14
June Sep
Dec
Mar
ch
June Sep
Dec
Mar
ch
June Sep
Dec
Mar
ch
June Sep
Dec
Mar
ch
June Sep
Dec
Mar
ch
CAGR 30.4%
CAGR 29.5%
CAGR 29.2%
Inde
xed
Com
posi
te
Performance 1 Year 3 Year 5 Year
DiscretionaryPortfolio 8.0% -0.3% 31.1%
ASPI 4.1% -6.2% 29.5%
S&PSL20 -0.4% -5.5% 29.2%
Performance 1 Year 3 Year 5 Year
TotalPortfolio -7.7% -12.5% 30.4%
ASPI 4.1% -6.2% 29.5%
S&PSL20 -0.4% -5.5% 29.2%

Ceylon Investment PLC | Annual Report 2013/14 | 13
wewouldnothesitatetobuildpositionsinidentifiedcompaniesatourpricetargets.Thelongtermsustainabilityofinterestratesislikelytohaveanimpactontransformingthemindsetofinvestors.Webelieveitwoulddosointhefuture.
Contrarytotheabove,inthecurrentyearwehaveseennetforeignsellingattheCSEduetoglobalpulloutoffundsfromemergingandfrontiermarketsimpactingtheColomboBourse.Thereforewearehopefulofseeingportfolioinvestmentsinthesecondhalfoftheyeartoselectheavyweightliquidcounters.Further,retailinterestislikelytobedrawntothesecondtierormidcapstocksthusinvigoratingtheColomboBourseacrosstheboard.Thusweforeseebothlocalandforeignbuyingtomaintainthestockmarketinthecomingyearandamomentumdrivenrallyislikelyinthenewfinancialyear.
Webelievethecatalysttomarketperformancewouldbetheunderlyingcorporateearningsofthecompanies.Unlesscorporateearningsdeliveronexpectedgrowththesustainabilityofthemarketwebelieveisshortlived.Weremainconfidentthatitcoulddosogivencountry'sGDPgrowthtargetsandlistedcompaniesbeingtheproxytothegrowthenvisaged.CorporatesalsowouldbenefitwiththelowinterestratescenariowhereprojectIRRwouldbeattainablegivenloweringofratesacrosstheboard.Thiswouldmakeleveragedcompaniessaveinterestcosts.
DespiteuncertaintiescloudingtheColomboBourse,weremainconfidentinthelongtermonthepotentialofequities.WeatCeylonInvestmentdobelievethatequitiesofferaboveaveragereturnsinlongcyclesandhencearenotafraidtocommitlongtermcapitaltogoodcompaniesatattractivepricelevels.Atpresent,theCSEistradingat14.4times,relativelyvaluedincomparisontootherAsianmarketsandfrontiermarkets.However,ona1yearforward
earnings,themarketisatPEratioof11.5timesand2yearforwardearningsataPEof10.2times.Hence,wefeelthatthemarketoffersvalueinthemediumterm.
Guardian Fund Management LimitedInvestmentManagers
Colombo25thJune2014

14 Ceylon Investment PLC | Annual Report 2013/14
Risk Management
Riskmanagementisanintegralpartofourbusiness,particularlysincebalancingrisksagainstreturnsisacriticaltradeoffdecisionwehavetomakeeverydaywhenitcomestomakinginvestmentdecisions.Werecognisetheimportanceofriskmanagementandhavebuiltacomprehensiveriskmanagementstructurethatfocusesoncontinuousidentificationandmanagementofbusinessrisks.Wehaveinplaceseveralmeasurestostrengthenourriskmanagementprocesseswhicharelinkedtoourdailyinvestmentdecisions.Theseincludepoliciestomitigatebusinessrisksalongwiththeupgradingofthesupportsystemsthatenableeasymonitoringandmanagementofrisks.
WebelievethatriskmanagementisofparamountimportanceinsafeguardingtheinterestofallstakeholdersandhaveundertakenacomprehensivereviewtoenhancetheriskmitigatingprocessessetinplacebyGuardianFundManagementLimited,theinvestmentmanagersoftheCompany.
Weseeriskmanagementnotasanefforttoeliminaterisk,butasmanagingriskwithincertainrisktolerancelevelssetbytheCompany.Risksappropriateforaparticularportfoliowillbeassessedagainsttheriskpreferencesoftheinvestorandoverallportfoliostrategy.ThusdifferentportfolioswithinCeylonInvestmentwouldhavedifferingriskprofiles.
The Risk Management Structure in PlaceGuardianFundManagement(GFM)hasbeensetupasanindependentfundmanagementcompanyandthemanagementoftheportfoliosofCeylonInvestmenthasbeendelegatedtothiscompany.TheBoardofDirectorshasformulatedandapprovedaninvestmentframeworkandcontrollimitsforGFM’sfundmanagementoperation.GFM’smanagementteamisresponsiblefortherecommendationandexecutionofinvestmentdecisions,duringthe
courseofwhichoversightandmanagementofthebusiness,financialandoperationalrisksoftheCompanycomeintoplay.Acomprehensiveriskidentificationandmanagementframeworkisinplaceandismonitoredconsistently.
GFMhasbeenregisteredasanInvestmentManagerwiththeSecuritiesandExchangeCommissionofSriLankasince2006whileCeylonGuardianInvestmentTrustPLCanditssubsidiaryCeylonInvestmentPLChavebeenregisteredasunderwriterssince2009.GFMaswellastheCompanytherefore,comeunderthepurviewofthecapitalmarketregulatorandhenceinternalmonitoringisdoneonaquarterlybasistoensurethatthesetregulationsareadheredto.AuditsbytheSecuritiesandExchangeCommission(SEC)iscarriedoutasrequired.Furthermore,asalistedcompanyCeylonInvestmentPLCconformtothelistingrulesandguidelinesoftheColomboStockExchange.
TheBoardofDirectorsoftheaboveCompanyhaveultimateresponsibilityforriskmanagement.HencetheBoardissupportedbyanorganisationstructurethatcoverstheentireriskmanagementframeworkthroughanindependentComplianceOfficerdrawnfromgrouplevelaswellastheinternalauditfunctionoftheCarsonCumberbatchGrouptowhichtheCeylonInvestmentCompanybelongs.TheAuditCommitteeoftheCompanyhasoversightoverthefinancialreportingfunctionoftheCompany,thesystemofinternalcontrolsaswellastheaudit,complianceandriskmanagementprocesses.Further,anInvestmentCommitteedrawnfromacrosstheCarsonsGroupdirectorateprovideadviceandinsightstothefundmanagementteamtofurthersharpenandrefinetheirdecisionmakingprocess.Thisorganisationstructuredeterminestheobjectivesandpoliciesofourriskmanagementframeworkandpromotesacultureofriskawarenessandbalancedrisk-takingwithintheCompany.
Risk CategoriesCeylonInvestmenthasidentifiedandcategoriseditsrisksintofourcategoriesmarked,namelymacroenvironmentalrisks,portfoliorisks,compliancerisksandoperationalrisks.
Givenbelowisitsapproachinmanagingthesekeyriskareas.
Macro Environmental RisksCountry RisksCountryriskisapplicableforinvestmentsmadeinasecurityissuedbyanentitysubjecttoforeignlawsoriftransactionsareenteredintoinmarketsinotherjurisdictions.Thesumsinvestedandprofitsorreturnsaccruingaresubjecttoexchangecontrolregulations,currencyfluctuations,transactioncosts&taxesandotheractionsthatmaybeimposedbythegovernmentorpolicymakingbodiesofthesaidcountries.Sincethecapitalaccounthasnowbeenliberalisedtotheextentofpermittingapprovedoverseasinvestmentsuptoacertainvaluebylistedcompanies,thisisanewriskareathatwearelookingtobuildaframeworkasCeylonInvestmentintendstoexploitnewmarketsinthefuture.
Currency RiskWhereinvestmentsaredenominatedincurrenciesotherthanourprimaryreferencecurrencywhichistheSriLankaRupee,andwheretheCompanyisrequiredtoconvertfundsfromonecurrencytoanotheruponmakinginvestments,aswellasinreceivingthereturnsfromthoseinvestments,theCompanyisexposedtotheriskoftheforeignexchangeparitiesmovingagainstone’sinvestment.
ThisriskisnotcurrentlyapplicabletotheCeylonInvestmentasthecurrentexposureoftheCompanytoinvestmentsdenominatedinforeigncurrenciesisnil.Lookingaheadwewouldaddresscurrencyrisksinourinvestmentsonaglobalcontext,whenweinvestoverseas

Ceylon Investment PLC | Annual Report 2013/14 | 15
TheriskexposureexistswithmanagingtheSriLankaFundandportfoliosofforeigninvestors.Herewetakecaretoensurethatbenchmarkreturnsonsuchforeigncurrencydependentportfoliosaremetaftercurrencyconversionsareexecuted.Oureconomicresearchgivesusanunderstandingoftheexpectationsonfuturecurrencymovementsforbettermanagement.
Market Risk - DomesticThebroaddefinitionofmarketriskisexposuretoadversemovementsinthesecuritiesmarketsforbothequityandfixedincomeinvestments,whichcanresultinvaluelossaswellasvariationsintheanticipatedreturnsfromthosesecurities.Allfinancialinstitutionsfacemarketrisks,createdbychangesinthemacroenvironmentrelatedtopoliticalfactors,nationalsecurity,economicmanagementandglobalisationinfluenceswhichhaveanimpactonsystematicriskfactorssuchasinterestrates,currencyparity,inflation,andavailabilityofcredit.Therefore,understandingmarketrisksrequiresconsideringmultipledimensionsandcomplexityinthemacroenvironment.
Marketrisksareinherentineverysecurityandarethuscollectivelyconsideredattheportfolioleveltotakeintoaccounttheassetallocationdecisionsoftheportfolio.Thusmarketrisksaffectingaparticularclassofsecurityaremitigatedbyswitchingtoassetclassesthatareassessedtobelessriskyinaparticularscenario.
AllmarketparticipantssuchasCeylonInvestment,developtheirbusinessmodel,takingintoaccountexposurelimitsandparameterstosustainitselfwhenfacedwithmarketrisksthatcanaffectportfoliovalues.Themitigatingprocesshasbeentodevelopasoundresearchbasetodeterminechangingeconomicfundamentalsofthecountry,determinetheimpactonequityvsfixedincomeinvestmentsandthepromptshiftingoffundsbetweenassetclasses.Thisisofvitalimportanceintradingportfoliodecisionswherequickencashmentof
equitiesiscarriedoutifmacroindicatorsmoveadverselyleadingtoaslowdowninstockmarketactivity.
Theprocessofassessingmarketrisksoninvesteecompaniesalsoformsavitalpartofourresearchprocess,wheresensitivityofstockvaluationstochangesineconomicindicatorsarecontinuouslymonitored.
Market Risk - International and ExternalTheseriskscannotbediversifiedormitigatedbytheCompany.Thereisanindirectimpactofrisksofothermarketstoourdomesticmarketasclearlyseeninthepast.Intheglobalworldofcrossbordertradeandcrossborderinvestmentflows,theimpactofchangingeconomicindicatorsandpolicyishighforthedomesticeconomy,especiallyinacountrysuchasourswhichisimportdependentforvitalcommodities.
Henceindeterminingfundstrategywemonitorkeyeconomicindicatorssuchasinterestrates,exchangerates,inflation,budgetdeficits,aswellasglobalcommoditypricessinceSriLankaisanetimporterofessentialcommodities.Thisenablesthefundteamtogetafeelofchanginginternationalmarketdynamicsandinturnrelatethattolocaldevelopments.Theentryandexitofforeigninvestorinterestinthelocalmarketisalsodeterminedbythemacroeconomictrendsprevailinginforeignmarketsandrelativevaluationsofourmarketvis-à-visdevelopedandothercomparativeAsianmarkets.Informationtomonitorandinterpretglobaldevelopmentsincapitalmarketsisvitaltoassessandmitigatethisrisk.
Wewouldbuildexpertiseinforeignmarketsgoingforward,aswewouldlooktoinvestoverseasgradually.Inmitigatingtheriskwewouldtieuporcollaboratewithforeignentitiesthathaveexpertiseinsuchmarketsinordertogainknowledge
Portfolio RisksGeneral Securities RiskAnytradinginsecuritiescarriesinherentinvestmentrisksassociatedwiththeentityissuingthosesecurities.Inparticularthepriceorvalueofanysecuritycananddoesfluctuateandmayevenbecomevalueless,resultinginpossiblelossnotonlyofreturnsandprofits,butevenallorpartoftheprincipalsumsinvestedinthecaseofafixedincomeinstrument.Theserisksariseasaresultoftheoverallrisksfacedbytheissuingentitywhichaffectsitsabilitytoprovideareturntotheinvestorsholdingthesecuritiesissuedbyit.Particularlyinthecaseofequities,pastperformanceofanyinvestmentisnotnecessarilyindicativeoffutureperformance.Ourapproachfocusesonthefactthatthereisnosubstituteforfundamentalsecurityassessment.Ourportfoliomanagementandinvestmentselectionprocessisdesignedtomaximisetherisk/returntradeofftoourshareholdersandweemployabottomupinvestmentselectionprocess.
Ourriskmitigatingmethodologyisbasedonourinternalresearchprocessthathasaddedvalueovertimetoourchoiceofinvestments.Prospectiveinvestmentsareselectedfromfundamentalanalysisandcontactwithcorporatemanagementoftheissuingcompanythroughcompanyvisits.Onceaninvestmentismade,acontinuousprocessofmonitoringtheperformanceofthatinvestmentisadopted.
Wemanagetheconcentrationriskarisingfromoverexposuretoonesecuritybymonitoringsectorexposureandsinglecompanyexposureasmitigationstrategies.Further,equityexposurelimitsatcompanyandgrouplevelaremonitoredasanothermeasureofmanagingrisk.Losslimitsaresettomonitorstocksperformingbelowtheircostofacquisitiontodeterminewhethertemporarycapitalerosionisaconcern.Thishelpsusmitigatethedownsideriskofanysecurityintheportfolio.

16 Ceylon Investment PLC | Annual Report 2013/14
Risk Management
Inthecaseofprivateequity,Boardrepresentationinproportiontotheinvestmentforstakesover10%isconsiderednecessarywhileforsmallerstakes,monitoringmechanismstofacilitateconstantevaluationoftheinvestmentarebuiltintotheshareholderagreements.
Liquidity RiskUndercertainmarketconditions,aninvestormayfinditdifficultorimpossibletoliquidateaposition.Thiscanoccurwhentradingissuspendedbytheexchangeonwhichasecurityislistedorwhenpoormarketsentimentdriesupinvestorinterestinasecurity.Inaddition,theremaynotbeareadymarketforcertaininvestmentsduetolowlevelsofpubliclytradedquantities.Someinvestmentswillhavetobeheldtomaturity.Properinformationfordeterminingthevalueofcertaininvestmentsmayalsonotbeavailableundersuchcircumstancesoflowliquidity.Howeverthestrategyofholdingbigstakesmightbealimitingfactorwhenselling,ifthestockisilliquidorinthecaseofachangeinfundamentals.
Wemitigatethisriskbyinvestingincompanieswithareasonablefreefloatandwheresecuritiesareheavilytraded.Alsobylimitingtheportfolio’sbuylisttohighlytradedstocks,theriskofilliquidityismitigated.Goodresearchenablethefundteamtoidentifychangesinfundamentalsandbeproactiveininvestmentdecisionmaking.
Ininstanceswherewearepresentedwithapromisinginvestmentopportunity,beingshortoffundstopursuethatopportunityisalsoanextensionofliquidityrisk.Toguardagainstthisrisk,wehavearrangedseveraloverdraftfacilitiestodrawintoifandwhenopportunitiesarise.
Performance Volatility RisksThecompositionoftheportfoliowilldeterminetheportfolio’sabilitytooutperformthemarket.Ifmorevolatilestocksthatrespondmorethanproportionatelytomarketmovementsareselected,thereisalikelihoodthatthe
portfoliowilloutperformthebenchmarkAllSharePriceIndexinagrowingmarket,whileinadownturnitcanunder-performthemarket.Itisonceagainanattemptatbalancinggoodperformancewithacertainrisktoleranceinavolatileenvironment.
Measuringportfoliovolatilitythroughcalculationofaportfoliobetaisonemethodofkeepingourselvesawareofthesensitivitiesoftheportfolio.Inthecaseofthelongtermportfolio,wewouldnotattempttohandlemarketvolatilitybyencashingstocks,butwouldratherattempttoholdontofundamentallystrongstocksandrideoutlowperformingcycles.Forthis,weensureadequatecashgenerationbywayofdividendandotherincomeflowstokeepourdailyoperationsrunningsmoothlywhilewerideoutlowmarketperiods.Ontheotherhand,inthecaseofthetradingportfolio,itisnecessarytokeepanevenclosertabonmarketvolatility,sinceitneedstoregularlyencashitsprofitablepositionstoremainahighperformingportfolio.
Investment Performance RiskThisistheriskthattheportfoliowillnotmeettheinvestmentobjectivesbyover-performingthebenchmarkindices.ThiscanadverselyaffectthereputationoftheCompanyandhaveimpactinthefutureintermsofproventrackrecordandconfidencewhenraisingmoneyonfuturecapitalcalls.
Wemitigatethisriskbysettingaprocesswhichseekstomeetinvestmenttargetswithinstatedriskparameters.Portfolioperformance,valuationsandrisksaremonitoredbyfundmanagersandmanagedonaregularbasis.Regularmeetingsamongstthefundmanagementteamaswellasregularreviewoftheportfolioatboardmeetingsarepartofthisprocess.
Compliance RisksThelegalsupportservicestoGuardianFundManagementcomesthroughthemanagementservicescompanyoftheCarsonCumberbatchGroup,whichensuresthattheGuardianGroupcompaniescomplywithalllegalandregulatory
provisionsapplicabletoit.ThelegalfunctionproactivelyidentifiesandadvicesGFMtosetupappropriatesystemsandprocessesforlegalandregulatorycomplianceinrespectofallourinvestmentsandregulatedactivities.Wealsoensurelegalandregulatorycomplianceinanyforeigncountrythatweoperateinandinsuchinstancesthroughlegalcounselretainedinthosejurisdictions.
ProactivemonitoringofthecomplianceprocessisfollowedandweseethatourinvestmentsaremadeandtradesareexecutedinkeepingwiththeCompaniesAct,SECregulations,taxregulations,exchangecontrolregulationsandotherapplicableguidelines.ThelegaladvisorsoftheCompanyalsocarryoutperiodicawarenessprogrammestoeducateallstaffmembersonaregularbasis.
TheoperationsofCeylonInvestmentcomewithintherulesandregulationsapplicabletoallmarketparticipantsoperatingintheequity(listedandunlisted)anddebtmarketsofSriLanka,aswellastheregulatoryprovisionsapplicabletocompanieslistedontheCSEandregulationsapplicabletosecuritiestradingsetbytheSecuritiesandExchangeCommissionofSriLanka.
Oursystemsandprocessesarestructuredtosatisfythecriteriasetbytheseregulations,andstaffisconstantlykeptawareofthecomplianceneedsimposedbytheseregulations.AnindependentcomplianceofficerundertakesresponsibilityformaintainingacheckontheoverallcomplianceprocessandissupportedbytheinternalauditfunctionoftheCarsonsGroup.GFM,asanInvestmentManagerregisteredwiththeSEC,isalsosubjecttofurtherregulationbythecapitalmarketsregulator.
Operational RisksProfessionalism in Operational DealingsThefundmanagementteamatGFMhassignedaCodeofEthicswhichlaysdownprofessionalstandardsofconductanddealingthatisexpectedofstaff.Structurestoavoidconflictsofinterestandcompromisingofbestpractices

Ceylon Investment PLC | Annual Report 2013/14 | 17
aresetupaspartofourprocess.Staffeducationcoversareasofsuchpracticeanddeclarationsbythestaffmembersoncomplianceinpersonalequitytradingaremandatory.
CompliancewithSECtradingrulesoninsidertrading,frontrunning,marketmanipulationetcarecheckedbycomparingtradingstatisticsbetweenportfoliosandpreapprovedpersonaltransactionofemployees,bytheComplianceOfficer.
ThecompliancewiththeCodeofEthicsensuresthattheconductoffundmanagersandotherstaffmembersdonotviolatethecodeofethicstowhichemployeesaresignatories.Someofthepertinentareascoveredincludeconflictofinterestbetweenportfolios,coordinationoftradesbetweenportfoliomanagerswithintheCompany,levelsofauthoritywhenapprovingtradesetc.Internalcontrolsandauditsarealsodonetoensuremonitoringandcompliance.
Systems and Process RisksWemanageoperationalrisksbyidentifyingrisksandformulatingplansfortheirmanagement,promotingbestpractices,implementinginternalcontrolsandsystemsandmonitoringcompliancewiththeseinternalguidelinesformanagingoperationalrisks.Operationalrisksmainlycovertheareasofsystemfailuretoensurecontinuityofdecisionmakingtodealwithcontingencies,ensuringefficiencyinoperationsandcorrectapplicationofrecommendedmanagementpractices,wherebackupproceduresarefollowedonaroutinebasis.Ouraccountingsystems,portfoliomanagementsystemsareregularlybackeduptopreventlossofdata.
Systemssupportfortheportfoliomanagementsoftwareismadeavailablethroughanannualmaintenanceagreementwiththesoftwarevendorwhichensuresonlinesupportforsystemissuesandqueries.AtthesametimethefinancialtransactionprocessingandreportingsystemarebasedonanERPsysteminuseatCarsonsGrouplevelandassuchbackupsupportservicesforthissystemareavailablethroughtheparentcompany’smanagementservicescompany.
Alsoinordertodealwithunexpectedcontingencies,wehavedevelopedandimplementedabusinesscontinuityplan,whichlooksafteraspectssuchasstaffdeploymentandsystemsbackupincaseofanunexpecteddisruptiontothebusiness.
ThisbusinesscontinuityplanformsapartoftheCarsonsGroup’sbusinesscontinuityplan,whichisregularlytestedandupgradedtomeetchangingneeds.
TheinternalauditfunctionoftheCarsonsGroup,ensuresthesafeguardingofCompanyassetsandrecommendsprocessimprovementsinareaswhereprocesscontrolfailuresarenoted.Compliancewiththeinvestmentobjectivesofeachportfolioinvolvescheckingwhetherfundmanagershaveadheredtotheinvestmentguidelinesforeachportfoliooperatingwithinsetlimitsandnotfallingtoprohibitedinvestments;aswellasmonitoringportfolioperformanceagainstthebenchmarksset.Furthercompliancewiththeoperatingprocessmanualinvolvescheckingtheapplicationofproperinternalcontrolssuchassegregationofduties,authoritylimits,approvalsandthatcashmanagementprocessesareinorder.
Staff RisksAfundmanagementoperationalunitrequiresqualifiedprofessionalswithexperienceinthefundmanagementindustry.Knowledgeoftheoperatingmechanismofthemarketaswellasitsnormsandethicsisofimportance.Weattempttopassonthisvaluablelocalknowledgetoourstaffatalllevels.Havingdiversityintheteam,developingastrongsecondlevel,traininganddevelopmentopportunities,arestandardpracticesoftheindustry,whichwebenchmarkourselveswith.Aperformancerelatedincentiveschemeforthestaffisinplaceandisbeingreviewed.Thenetworkingabilityofkeystafftosourcedealsisimportantinrunningasuccessfulfundmanagementoperationbybeingshownbothimportantbuysideandsellsidedealsbybrokers.
ThestaffofGFMareallprofessionallyqualifiedwithatrackrecordofexperienceintheindustry.
Astrongresearchteamhasbeendevelopedtocomplementthefundmanagementoperationandraisethestandardoftheinvestmentdecisionmakingprocess.Stafftraininganddevelopmentisidentifiedasanimportantareaofconcern,whileretentionismanagedthroughacomprehensiverewardstructureandincentivescheme,opportunitiesforcareerprogressionandacultureofbeingHRoriented.Collectivelythesestepshelpustoworktowardshavinganeffectivesuccessionplaninplace.
Reputation RiskAsaCompanythatcarriesoutaroleoftrustbetweenitselfandaclient,itisvitaltosafeguardthegoodnameandreputationofthebusiness.Further,nowbeinginthepublicdomainthroughunittrusts,safeguardingreputationriskisofutmostimportance.
Employeesarecommunicatedtherightvaluesfromtheinceptionbothbyformalcommunicationandbyexample.Ourscreeningprocessatinterviews,attemptstoselectpeopleoftherightcaliber,whiletrainingthemforhigherresponsibilityisongoing.TheextensivecomplianceprocessalsoensuresthattheCompanydoesnottaketheriskofprocessfailurethatwillleadtoreputationrisk.Maintaininggoodrelationshipswithallindustryandgovernmentstakeholdersfurtherhelpsmanageanycrisissituationsthatcandamagereputation.
Guardian Fund Management LimitedInvestmentManagers
Colombo25thJune2014

18 Ceylon Investment PLC | Annual Report 2013/14
TheBoardofDirectorsofCeylonInvestmentPLChavepleasureinpresentingtotheshareholderstheirReport,togetherwiththeAuditedFinancialStatementsfortheyearended31stMarch2014.
ThedetailssetouthereinprovidethepertinentinformationrequiredbytheCompaniesActNo.07of2007,ListingRulesoftheColomboStockExchangeandrecommendedbestAccountingPractices.
TheAnnualReportwasapprovedbytheBoardofDirectorson25thJune2014.
1. GENERALCeylonInvestmentPLC(the"Company")isapubliclimitedliabilityCompanyincorporatedinSriLankain1919.
2. PRINCIPAL ACTIVITY OF THE COMPANY
TheprincipalactivitiesoftheCompanyanditsassociatecompanyaretoactasspecializedinvestmentvehiclesfocusingonlistedequityinvestments.
TherewerenosignificantchangesinthenatureoftheprincipalactivitiesoftheCompanyduringthefinancialyearunderreview.
3. REVIEW OF OPERATIONS AND FUTURE DEVELOPMENTS
TheChairman’sStatementandtheManagers’Commentaryonpages2to13provideanoverallassessmentofthebusinessperformanceoftheCompanyanditsfuturedevelopments.ThesereportstogetherwiththeauditedfinancialstatementsreflectthestateofaffairsoftheCompany.
4. FINANCIAL STATEMENTSTheFinancialStatementswhichincludetheStatementofComprehensiveIncome,StatementofFinancialPosition,StatementofCashFlow,StatementofChangesinEquityandnotesto
4.4. Investment in Financial Instruments – Available for Sale Financial Assets
InvestmentsinfinancialinstrumentsoftheCompanyrepresentsinvestmentsinavailableforsalefinancialassets,categorizedinto,
FairvaluehierarchyLevel1-quotedsecurities
FairvaluehierarchyLevel2andLevel3–unquotedandprivateequity(unlistedequityinvestments).
InvestmentsplacedatfairvaluehierarchyLevel1–quotedsecurities,asatthereportingdate,carriedafairvalueofRs.2,519.4mn(2013–Rs.2,018.7mn)inCompanyasdisclosedinnotes19.1and19.4.InvestmentsplacedatfairvaluehierarchyLevel2and3–unquoted/privateequity(unlisted)investments,asatthereportingdate,carriedafairvalueofRs.0.9mn(2013–Rs.191.5Mn)asdisclosedinnote19.2,19.3and19.5.
4.5. ReservesAsat31stMarch2014,thetotalreservesoftheCompanystoodatRs.7,751.8mn(2013-Rs.8,050.3mn).
ThemovementsaresetoutintheStatementofChangesinEquityandinnote24tothefinancialstatements.
4.6. Fair value through profit or loss financial assets reserve
Anygainsarisingfromfairvalueadjustmentwillbetransferredfromretainedearningsto“Fairvaluethroughprofitorlossfinancialassetsreserve”atreportingdateandanyrealizedlossesarisingwillbetransferredfrom“Fairvaluethroughprofitorlossfinancialassetsreserve”toretainedearningstotheextentthatthelossdoesnotexceedthebalanceheldinthesaidreserveasatthereportingdate.
Accordingly,duringtheyearanamountofRs.28.9mnwastransferredto(2013-43.4mnwastransferredfrom)“Fairvaluethroughprofit
Annual Report of the Board of Directors on the Affairs of the Company
theFinancialStatementsoftheCompanyfortheyearended31stMarch2014aresetoutonpages32to65ofthisReport.TheseFinancialStatementsdocomplywiththerequirementsoftheCompaniesActNo.07of2007.
4.1. RevenueTheCompanygeneratedarevenueofRs.496.8mn(2013–Rs.445.9mn).Adetailedanalysisoftherevenuefortheperiodisgiveninnote11tothefinancialstatements.
4.2. Financial results and appropriationsAnabridgementofthefinancialperformanceoftheCompanyispresentedinthetablebelow:
(In Rupees Thousands) For the year ended 31st March
2014
2013
ProfitfortheyearRetainedearningsbroughtforwardfrompreviousyearTransfers
1,152,357
4,615,99428,910
1,181,968
3,600,606(43,436)
Profitavailableforappropriationsfromwhichthefollowingappropriations/distributionshavebeenmade:Dividendspaid
5,797,261(418,688)
4,739,138(123,144)
Retainedearningscarriedforward 5,378,573 4,615,994
4.3. Significant accounting policiesTheaccountingpoliciesadoptedinthepreparationofthesefinancialstatementsaregivenonpages36to42.
Asexplainedinnote10tothefinancialstatements,themanagementisintheprocessofassessingtheimpact,ifany,onadoptionofthenewstandardswhichhavebecomeeffectivefrom1stApril2014.

Ceylon Investment PLC | Annual Report 2013/14 | 19
orlossfinancialassetsreserve”resultingfromthemovementsinfairvalueasshownintheStatementofChangesinEquity.
4.7. Available for sales financial assets reserve
Duringtheyear,themovementfrom‘Availableforsalefinancialassetsreserve’amountedtoRs.215.3mn(2013–movementtoavailableforsalefinancialassetsreserveamountedtoRs.60.9mn)arisingoutofrealizedgainsandadjustmentonfairvaluationofinvestmentsinAvailableforsalefinancialassets.
5. STATEMENT OF DIRECTORS RESPONSIBILITIES
TheresponsibilitiesoftheDirectorsinrelationtotheFinancialStatementsaredetailedinthefollowingparagraphs,whilsttheresponsibilitiesoftheAuditorsaresetoutintheIndependentAuditors’Report.
AccordingtotheCompaniesActNo.07of2007andtheSriLankaAccountingandAuditingStandardsActNo.15of1995,theDirectorsarerequiredtoprepareFinancialStatementsforeachfinancialyear,givingatrueandfairviewofthestateofaffairsoftheCompanyasattheendofthefinancialyearandoftheperformanceforthesaidperiod.
TheFinancialStatementscompriseofinteralia:
• aStatementofFinancialPosition,whichpresentsatrueandfairviewofthestateofaffairsoftheCompanyanditsassociatecompanyasattheendofthefinancialyear:
• aStatementofcomprehensiveincomeoftheCompanyanditsassociatecompany,whichpresentsatrueandfairviewoftheprofitandlossoftheCompanyanditsassociatecompanyforthefinancialyear.
Inpreparingthesefinancialstatements,theDirectorsarerequiredtoensurethat:
> appropriateaccountingpolicieshavebeenselectedandappliedconsistently,whilematerialdepartures,ifany,havebeendisclosedandexplained;
> allapplicableAccountingStandardshavebeencompliedwith;
> reasonableandprudentjudgmentsandestimateshavebeenmade;and
> providestheinformationrequiredbyandotherwisecomplywiththeCompaniesActNo.07of2007andtheListingRulesoftheColomboStockExchange.
TheDirectorsareresponsibleforensuringthattheCompanymaintainssufficientaccountingrecordstodisclosewithreasonableaccuracy,thefinancialpositionoftheCompany,inordertoensurethatitsFinancialStatementshavebeenpreparedandpresentedinaccordancewiththeSriLankaAccountingandAuditingStandardsActNo.15of1995andmeetwiththerequirementsoftheCompaniesActNo.07of2007.
TheyarealsoresponsiblefortakingreasonablemeasurestosafeguardtheassetsoftheCompanyandinthisregardtogiveproperconsiderationtotheestablishmentandeffectiveoperationofappropriatesystemsofinternalcontrolwithaviewtoprevent,detectandrectifyfraudandotherirregularities.
TheseFinancialStatementshavebeenpreparedonagoingconcernbasis,sincetheDirectorsareoftheviewthattheCompanyhasadequateresourcestocontinueinoperation,fortheforeseeablefuturefromthedateofsigningthesefinancialstatements.
TheDirectorsarealsooftheviewthattheyhavedischargedtheirresponsibilitiesassetoutinthisstatement.
6. OUTSTANDING LITIGATIONTherearenolitigationscurrentlypendingagainsttheCompany.
7. INDEPENDENT AUDITORS’ REPORT
TheIndependentAuditors’Reportonthefinancialstatementsisgivenonpage31oftheAnnualReport.
8. INTERESTS REGISTERTheCompanymaintainsanInterestsRegisterconformingtotheprovisionsoftheCompaniesAct,No.07of2007.AllDirectorshavemadedeclarationsasprovidedforinSection192(2)oftheCompaniesActaforesaid.
TherelevantdetailsasrequiredbytheCompaniesAct,No.07of2007havebeenenteredintheInterestsRegisterduringtheyearunderreview.
TheInterestsRegisterisavailableforinspectionasrequiredundertheCompaniesAct.
8.1. Remuneration of DirectorsDirectors’remunerationforthefinancialyearended31stMarch2014isgiveninnote12tothefinancialstatementsonpage43oftheAnnualReport.
8.2. Directors’ Interest in contracts and shares
TheRelatedPartyTransactionsoftheCompanyasrequiredbytheSriLankaAccountingStandardsLKAS24RelatedPartyDisclosuresaredisclosedinnote28totheFinancialStatementsandhavebeendeclaredatMeetingsoftheBoardofDirectors.TheDirectorshavehadnodirect

20 Ceylon Investment PLC | Annual Report 2013/14
Annual Report of the Board of Directors on the Affairs of the Company
orindirectinterestinanyothercontractsorproposedcontractsinrelationtothebusinessoftheCompany,whiletheyhadthefollowinginterestsintheordinarysharesoftheCompany,asshowninthetablebelow:
Directors No.of shares as at
31st March 2014
1st April 2013
Mr.I.Paulraj(Chairman) 255 255Mr.D.C.R.Gunawardena 255 255Mr.A.P.Weeratunge - -Mrs.M.A.R.C.Cooray - -Mr.A.deZ.Gunasekera - -Mr.V.M.Fernando - -Mr.K.Selvanathan - -
9. DIRECTORSThenamesoftheDirectorswhoservedduringtheyeararegivenunderCorporateInformationprovidedintheinnerbackcoveroftheAnnualReport.
9.1. Directors to retire by rotationIntermsofArticles89,90and91oftheArticlesofAssociationoftheCompany,Mrs.M.A.R.C.CoorayandMr.A.P.Weeratungeretirebyrotationandbeingeligibleofferthemselvesforre-election.
9.2. Appointment of Directors who are over 70 years of age
UpontherecommendationoftheNominationCommitteeandtheBoard,itisrecommendedthatMessrs.I.PaulrajandA.deZ.Gunasekerawhoareover70yearsofagebere-appointedasDirectorsoftheCompanyforafurtherperiodofoneyearfromtheconclusionoftheAnnualGeneralMeetingandthattheagelimitstipulatedinSection210oftheCompaniesAct,No.07of2007shallnotbeapplicable.
10. AUDITORSCompany’sAuditorsduringtheyearunderreviewwereMessrs.KPMG,CharteredAccountants.
AsumofRs.307,000/-waspaidtothembytheCompanyasauditfeesfortheyearended31stMarch2014(2013-Rs.275,000/-).Inadditiontotheabove,theAuditorswerepaidRs.65,000/-(2013-Rs.63,000/-)asprofessionalfeesforauditrelatedservices.
TheretiringAuditorshaveexpressedtheirwillingnesstocontinueinoffice.Aresolutiontore-appointthemasAuditorsoftheCompanyandauthorizingtheDirectorstofixtheirremunerationwillbeproposedattheforthcomingAnnualGeneralMeeting.
TheAuditCommitteereviewedtheappointmentoftheAuditors,itseffectivenessandtheirrelationshipwiththeCompany,includingthelevelofauditandnon-auditfeespaidtotheAuditors.
10.1. Auditors’ Relationship or any interest with the Company
TheDirectorsaresatisfiedthat,basedonwrittenrepresentationsmadebytheindependentAuditorstotheBoard,theAuditorsdonothaveanyinterestwiththeCompanythatwouldimpairtheirindependence.
11. SIGNIFICANT EVENTS DURING THE YEAR
Therewerenosignificanteventsduringtheyear.
12. RELATED PARTY TRANSACTIONS EXCEEDING 10% OF THE EQUITY OR 5% OF THE TOTAL ASSETS OF THE COMPANY
TherewerenotransactionsenteredintobytheCompanyintheirordinarycourseofbusiness,thevalueofwhichexceeded10%oftheshareholders’equityor5%ofthetotalassetsoftheCompanyduringtheyear.
Thedetailsoftherelatedpartytransactionsaregiveninnote28onpages56to57ofthefinancialstatements.
13. CORPORATE GOVERNANCETheBoardhasensuredthattheCompanyhascompliedwiththeCorporateGovernancerulesaspertheListingRulesoftheColomboStockExchange.
13.1. Board of DirectorsThefollowingDirectorsheldofficeasatthereportingdateandtheirbriefprofilesaregivenonpages25and26oftheAnnualReport.
Directors Executive/ Non-Executive/ Independent
Mr.I.Paulraj(Chairman) Non-Executive/Independent*
Mr.D.C.R.Gunawardena Non-Executive
Mr.A.P.Weeratunge Executive
Mrs.M.A.R.C.Cooray Non-Executive/Independent**
Mr.A.deZ.Gunasekera Non-Executive/Independent***
Mr.V.M.Fernando Non-Executive/Independent****
Mr.K.Selvanathan Executive
EachoftheNon-ExecutiveDirectorsoftheCompanyhavesubmittedasigneddeclarationonIndependence/Non-IndependenceasperRule7.10.2(b)oftheListingRulesoftheColomboStockExchange(CSE).ThesaiddeclarationsweretabledattheBoardMeetingheldon25thJune2014,inordertoenabletheBoardofDirectorstodeterminetheIndependence/Non-IndependenceofeachoftheNon-ExecutiveDirectors,intermsofrule7.10.3(a)oftheListingRulesoftheCSE.

Ceylon Investment PLC | Annual Report 2013/14 | 21
*TheBoardhasdeterminedthatMr.I.PaulrajisanIndependentDirectorinspiteofbeingontheBoardformorethan9yearsandbeingaDirectorofCeylonGuardianInvestmentTrustPLC,inwhichamajorityoftheotherDirectorsoftheBoardarealsoDirectorsandwhichhasasubstantialshareholdingintheCompany,sinceheisnotdirectlyinvolvedinthemanagementoftheCompany.
**TheBoardhasdeterminedthatMrs.M.A.R.C.CoorayisanIndependentDirectorinspiteofbeingaDirectorofCeylonGuardianInvestmentTrustPLC,inwhichamajorityoftheotherDirectorsoftheBoardarealsoDirectorsandwhichhasasubstantialshareholdingintheCompany,sincesheisnotdirectlyinvolvedinthemanagementoftheCompany.
***TheBoardhasdeterminedthatMr.A.deZ.GunasekeraisanIndependentDirectorinspiteofbeingaDirectorofCeylonGuardianInvestmentTrustPLC,inwhichamajorityoftheotherDirectorsoftheBoardarealsoDirectorsandwhichhasasubstantialshareholdingintheCompany,sinceheisnotdirectlyinvolvedinthemanagementoftheCompany.
****TheBoardhasdeterminedthatMr.V.M.FernandoisanIndependentDirectorinspiteofbeingaDirectorofCeylonGuardianInvestmentTrustPLC,inwhichamajorityoftheotherDirectorsoftheBoardarealsoDirectorsandwhichhasasubstantialshareholdingintheCompany,sinceheisnotdirectlyinvolvedinthemanagementoftheCompany.
13.2 Remuneration CommitteeIntermsofRule7.10.5oftheListingRulesoftheColomboStockExchange,theRemunerationCommitteeofCarsonCumberbatchPLC(CCPLC),theultimateParentCompany,functionsastheRemunerationCommitteeoftheCompanyandcomprisesofthefollowingmembers:
RemunerationCommitteemeetingswhendeterminationsaremadeinrelationtotheremunerationoftherespectiveDirectors.
TheCommitteeisauthorisedbytheBoardtoseekappropriateprofessionaladviceinternallyandexternallyasandwhenitconsidersnecessary.
TheRemunerationCommitteemeetsatleasttwiceayear.
DuringtheperiodunderreviewtheCommitteehadtwomeetingsandtheattendanceoftheMembersoftheRemunerationCommitteewasasfollows:
Remuneration Committee Members
Meetings attended (out of two)
Mr.I.Paulraj(Chairman) 02
Mr.M.Moonesinghe* -
Mr.D.C.R.Gunawardena 02
Mr.R.Theagarajah** -
*ResignedfromtheCCPLCBoardwitheffectfrom31stMarch2014andaccordinglyfromtheRemunerationCommitteewitheffectfrom31stMarch2014
**AppointedtotheRemunerationCommitteewitheffectfrom1stApril2014
ReportingandResponsibilities:TheCommitteeChairmanreportsformallytotheBoardonitsproceedingsonallmatterswithinitsdutiesandresponsibilities.TheCommitteemakesrecommendationstotheBoardasdeemedappropriateonanyareawithinitslimitwhereactionorimprovementsareneeded.
AggregatedremunerationpaidtotheNon-ExecutiveDirectorsoftheCompanyisdisclosedundernote12onpage43oftheAnnualReport.ExecutiveDirectorsarenotcompensatedfortheirroleontheBoard.
Remuneration Committee Members
Executive/Non-Executive/Independent
Mr.I.Paulraj(Chairman)
Non-Executive/IndependentDirectorofCCPLC
Mr.M.Moonesinghe*
Non-Executive/IndependentDirectorofCCPLC
Mr.D.C.R.Gunawardena
Non-ExecutiveDirectorofCCPLC
Mr.R.Theagarajah**
Non-Executive/IndependentDirectorofCCPLC
*ResignedfromtheCCPLCBoardwitheffectfrom31stMarch2014andaccordinglyfromtheRemunerationCommitteewitheffectfrom31stMarch2014
**AppointedtotheRemunerationCommitteewitheffectfrom1stApril2014
ScopeandObjective:TheprimaryobjectiveoftheRemunerationCommitteeistoleadtoestablishaformalandtransparentprocedureforthedevelopmentofaremunerationpolicyandtheestablishmentofaremunerationstructure.
AremunerationpolicyhasbeenformulatedbasedonmarketandindustryfactorsandindividualperformanceforallgroupCompanies.
FunctionsandProceedings:TheRemunerationCommitteerecommendstotheBoardtheremunerationtobepaidtotheChiefExecutiveOfficer,ExecutiveDirectorsandNon-ExecutiveDirectors.BasedontherecommendationoftheRemunerationCommittee,theBoardapprovesremunerationtotherespectiveDirectors.
TheChiefExecutiveOfficer,Director-in-chargeandothermembersoftheseniormanagementmaybeinvitedtoattendmeetingstodiscusstheperformanceoftheExecutiveDirectorsandmakeproposalsasnecessary.NeitherExecutivenorNon-ExecutiveDirectorsareinvolvedin

22 Ceylon Investment PLC | Annual Report 2013/14
13.3. Audit CommitteeIntermsofRule7.10.6oftheListingRulesoftheColomboStockExchange,theAuditCommitteeofCarsonCumberbatchPLC(CCPLC),theultimateParentCompany,functionsastheAuditCommitteeoftheCompanyandcomprisesofthefollowingmembers:
Audit Committee Members
Executive/Non-Executive/Independent
Mr.V.P.Malalasekera(Chairman)
Non-Executive/IndependentDirectorofCCPLC
Mr.D.C.R.Gunawardena
Non-ExecutiveDirectorofCCPLC
Mr.F.Mohideen Non-ExecutiveDirectorofCCPLC
TheAuditCommitteeReportisgivenonpages28to29ofthisAnnualReport.
13.4. Directors Meetings Attendance DuringthefinancialyeartheBoardofDirectorshad04BoardMeetingsandtheattendanceoftheDirectorswasasfollows:
Directors Meetings attended (out of 04)
Mr.I.Paulraj(Chairman) 04
Mr.D.C.R.Gunawardena 03
Mr.A.P.Weeratunge 04
Mrs.M.A.R.C.Cooray 03
Mr.A.deZ.Gunasekera 04
Mr.V.M.Fernando 03
Mr.K.Selvanathan 04
14. NOMINATION COMMITTEETheNominationCommitteeofCeylonGuardianInvestmentTrustPLC(GUAR),theParentCompany’sNominationCommitteefunctionsastheCompany’sNominationCommittee.
DuringtheperiodunderreviewtheCommitteehadtwomeetingsandtheattendanceoftheMembersoftheNominationCommitteewasasfollows:
Nomination Committee Members
Meetings attended (out of two)
Mr.I.Paulraj(Chairman) 02
Mrs.M.A.R.C.Cooray 01
Mr.D.C.R.Gunawardena 02
15. INTERNAL CONTROL AND RISK MANAGEMENT
Theultimateresponsibilitytoestablish,monitorandreviewacompany-wideinternalcontrolsystemrestswiththeBoardofDirectors.Theintensity,depthandthetolerancelimitsforeachcomponentoftheinternalcontrolsystemwouldbebasedontheweightoftheelementofriskimposedonthesustenanceofthebusinessbytherespectiveareaofoperation.Whilstastronginternalcontrolsystemwouldmitigatethecrystallizationofriskelementstoagreaterextent,employmentofexternalsupportstructureswouldalsobenecessarybasedontheriskassessmentsmadethereon.
Effectivemaintenanceofinternalcontrols,riskidentificationandmitigationishandeddowntotherespectivemembersofseniormanagementwithintheguidelinesofbenchmarkpolicies,proceduresandauthoritylimitsclearlylaiddown.
GroupInternalAudit,whosescopeofscrutinyisentirelydrivenbythegradingoftheriskinvolvedwillbemonitoringandprovidingthefeedbacktothemanagementandtherespectiveAuditCommittee.RegularsubmissionofcomplianceandinternalsolvencycertificatesvouchedbytheheadsoftherespectivedivisionsasamandatoryagendaitemkeepstheDirectorsabreastofthehealthoftheCompany’sresourcebaseandgovernancerequirements.
TheNominationCommitteeofGUARcomprisesofthefollowingmembers:
Nomination Committee Members
Executive/Non-Executive/Independent
Mr.I.Paulraj(Chairman)
Non-Executive/IndependentDirectorofGUAR
Mrs.M.A.R.C.Cooray Non-Executive/IndependentDirectorofGUAR
Mr.D.C.R.Gunawardena
Non-ExecutiveDirectorofGUAR
ScopeandObjective:
TheprimaryobjectiveoftheNominationCommitteeistoleadtheprocessforBoardappointmentsofnewDirectorswithinthegroupcompaniesandthenominationsofmemberstorepresenttheCompanyingroupcompanies/investeecompanies.
FunctionsandProceedings:
TheNominationCommitteerecommendsnewappointmentstotheBoard.BasedontherecommendationoftheNominationCommittee,theBoardapprovesthenewappointmentsofExecutiveandNon-ExecutiveDirectorstotheBoard.
AnyDirectoroftheBoardandtheChiefExecutiveOfficer/Director-in-ChargeandothermembersofseniormanagementmaybeinvitedtoattendMeetingsoftheNominationCommittee.TheCommitteemayalsoinviteappointedexternalconsultantstoaidtheCommitteeinthedischargeofitsduties.
TheCommitteeisauthorisedbytheBoardtoseekappropriateprofessionaladviceinternallyandexternallyasandwhenconsiderednecessary.
TheNominationCommitteemeetsatleasttwiceayear.
Annual Report of the Board of Directors on the Affairs of the Company

Ceylon Investment PLC | Annual Report 2013/14 | 23
ThisallowstheBoardtohavetotalcontrolofthefulfillmentofgovernancerequirementsbyprovidingopportunitytotaketimelypreventiveactionincaseofpotentialdeteriorationofstatusquo.MoredetaileddescriptionoftheriskmanagementstrategiesoftheCompanyisgivenonpages14to17.
16. HUMAN RESOURCES ThemanagementoftheCompany’sinvestmentsisundertakenbyGuardianFundManagementLimited(GFM)andmanagementsupportservicesareprovidedbyCarsonsManagementServices(Private)Limited.
GFMcontinuedtoinvestinhumancapitaldevelopmentandimplementeffectivehumanresourcepracticesandpoliciestodevelopandbuildanefficientandeffectiveworkforcealignedaroundnewbusinessprioritiesoftheCompanyandtoensurethatitsemployeesaredevelopingtheskillsandknowledgerequiredforthefuturesuccessoftheCompany,centeredaroundthecorecompetenciesrequiredbyaninvestmenthouse.
17. EQUITABLE TREATMENT TO SHAREHOLDERS
TheCompanyendeavoursatalltimestoensureequitabletreatmenttoallshareholders.
18. DIVIDENDSTheCompanypaida1stinterimdividendofRs.2/50pershareresultinginatotaloutflowofRs.246,287,185/-duringtheyear.
TheDirectorsdonotrecommendafinaldividendforthefinancialyearended31stMarch2014.
Thedetailsofthedividendspaidduringtheyeararesetoutinnote17tothefinancialstatements.
22. CAPITAL EXPENDITURE TheCompanyhasnotincurredanycapitalnatureexpenditureduringtheyearunderreview(2013-Nil).
23. STATUTORY PAYMENTSTheDirectorstothebestoftheirknowledgeandbeliefweresatisfiedthatallstatutorydueshavebeenpaiduptodateorhavebeenprovidedforinthefinancialstatements.
24. GOING CONCERNTheBoardofDirectorsissatisfiedthattheCompanyhasadequateresourcestocontinueitsoperationsintheforeseeablefuture.Accordingly,thefinancialstatementsarepreparedbasedonthegoingconcernconcept.
25. EVENTS AFTER THE REPORTING PERIOD
Subsequenttothereportingdate,nocircumstanceshavearisen,whichwouldrequireadjustmentstoordisclosuresinthefinancialstatements,otherthanthosedisclosedinnote26tothefinancialstatementsifany.
26. CONTINGENT LIABILITIES AND CAPITAL COMMITMENTS
Contingentliabilitiesandcommitmentsmadeonaccountofcapitalexpenditureasat31stMarch2014aregiveninnote27tothefinancialstatementsifany.
27. CORPORATE DONATIONSTherewerenodonationsgrantedduringtheyear.
28. SHARE INFORMATIONThedetailsrelatingtoearnings,netassets,marketvaluepershareandinformationonsharetradingisgivenonpages66to67andpages74to75oftheAnnualReport.
19. SOLVENCY TESTTheDirectorsweresatisfiedwiththeSolvencyTestrequirementunderSection56(2)oftheCompaniesAct,No.07of2007immediatelyafterthedistributionofthe1stinterimdividenddeclaredinMarch2014.TheCompany'sAuditors,Messrs.KPMG,CharteredAccountantsissuedtheCertificateofSolvencyconfirmingsame.
20. STATED CAPITALTheStatedCapitaloftheCompanyasat31stMarch2014wasRs.673,529,144/-comprisingof98,514,874ordinaryshares.ThemovementinStatedCapitaloftheCompanyisgiveninnote23tothefinancialstatements.TherewasnochangeintheStatedCapitaloftheCompanyduringtheyear.
21. INVESTMENTS Investmentsrepresent,investmentsinassociates,investmentsinavailableforsalefinancialassetsandinvestmentsinfairvaluethroughprofitorlossfinancialassets.
• Detailsoninvestmentinassociatecompanyisgiveninnote18inpage46.
• Detailsonavailableforsalefinancialassetsatfairvaluearedisclosedinnote19inpages47to50,comprisingthoseinvestmentswhichareheldforalongertenure,usuallyover3-5years.ThefairvalueofthesaidinvestmentportfoliostoodatRs.2,520.3mn(2013-2,210.3mn)attheendofthefinancialyear.
• ThefairvaluethroughprofitorlossportfolioengagedinactivetradingtorealizethebenefitsofthemovementsinthestockmarketandiscarriedintheStatementoffinancialpositionatfairvalueasgiveninnote21inpages51to53.ThecarryingvalueofthefairvaluethroughprofitorlossfinancialassetsoftheCompanyasat31stMarch2014wasRs.644.8mn(2013-Rs.503.6mn).

24 Ceylon Investment PLC | Annual Report 2013/14
Annual Report of the Board of Directors on the Affairs of the Company
29. TWENTY MAJOR SHAREHOLDERSTheParentCompany,CeylonGuardianInvestmentTrustPLCholds64.36%ofthetotalordinarysharesinissueoftheCompany.
Twentymajorshareholderswithcomparatives:
As at 31st March
Name of Shareholder 2014 2013No. of shares % No. of shares %
CeylonGuardianInvestmentTrustPLC-A/cNo.3 63,407,518 64.36 63,407,518 64.36
ThurstonInvestmentsLimited 1,924,006 1.95 1,924,006 1.95
EmployeesTrustFundBoard 1,757,925 1.78 1,757,925 1.78
Mrs.M.L.deSilva 1,305,380 1.33 1,305,380 1.33
Miss.G.I.A.deSilva 1,277,422 1.30 1,277,422 1.30
Mr.K.C.Vignarajah 1,244,769 1.26 1,244,769 1.26
WaldockMackenzieLtd/Mr.H.M.S.Abdulhussein 997,944 1.01 1,191,756 1.21
Mr.G.J.W.deSilva 854,000 0.87 854,000 0.87
OakleyInvestmentsLimited 795,600 0.81 795,600 0.81
J.B.Cocoshell(Pvt)Ltd. 790,808 0.80 773,142 0.78
DFCCBankA/c1 765,000 0.78 735,000 0.75
Mr.Y.H.Abdulhussein 752,110 0.76 658,410 0.67
Miss.R.E.W.Jayasuriya 748,912 0.76 675,733 0.69
Mrs.S.E.Lokhandwalla 569,176 0.58 - -
CommercialBankofCeylonLtd./Mr.K.C.Vignarajah
496,122 0.50 496,122 0.50
CocoshellActivatedCarbonCompanyLimited 466,315 0.47 456,915 0.46
WaldockMackenzieLtd./Mr.M.A.N.Yoosufali 443,760 0.45 441,920 0.45
BankofCeylonNo.1Account 442,000 0.45 442,000 0.45
AitkenSpencePLC–A/cNo.2 440,339 0.45 440,339 0.45
MercantileBank(Agency)PrivateLimited 409,045 0.42 409,045 0.42
30. ANNUAL REPORTTheBoardofDirectorson25thJune2014approvedtheFinancialStatementsoftheCompany,togetherwiththeReviewswhichformpartoftheAnnualReport.TheappropriatenumberofcopiesoftheAnnualReportwillbesubmittedtotheColomboStockExchange,theSriLankaAccountingandAuditingStandardsMonitoringBoardandtheRegistrarGeneralofCompanies,withintheapplicabletimeframes.
31. ANNUAL GENERAL MEETINGThe68thAnnualGeneralMeetingoftheCompanywillbeheldonWednesday,the30thdayofJuly2014at9.30a.m.atHiltonColombo,“GrandBallroom”,No.2,SirChittampalamA.GardinerMawatha,Colombo2,SriLanka.
TheNoticeoftheAnnualGeneralMeetingsettingoutthebusinesswhichwillbetransactedthereatisonpage76oftheAnnualReport.
SignedonbehalfoftheBoard,
(Sgd.) (Sgd.) I. Paulraj D.C.R. GunawardenaChairman Director
(Sgd.) K.D. De Silva (Mrs.) Director Carsons Management Services (Private) Limited Secretaries
Colombo25thJune2014

Ceylon Investment PLC | Annual Report 2013/14 | 25
Profiles of the Directors
ISRAEL PAULRAJ IsraelPaulrajistheChairmanofCeylonGuardianInvestmentTrustPLC,GuardianCapitalPartnersPLCandRubberInvestmentTrustLimited.HeservesasaDirectorofCarsonCumberbatchPLCandofseveralofthesubsidiarycompanieswithintheCarsonsGroup.
HeservedasPastChairmanoftheFederationofExportersAssociationsofSriLankaandTheCoconutProductsTradersAssociation.HewasamemberoftheExecutiveCommitteeoftheCeylonChamberofCommerce,NationalChamberofCommerceofSriLankaandShippersCouncil.HeservedontheBoardofArbitratorsoftheCeylonChamberofCommerce.HehasservedasHony.GeneralSecretaryoftheCentralCouncilofSocialServices,Hony.TreasurerofTheChristianConferenceinAsia,PresidentoftheChurchofCeylonYouthMovementandHony.TreasureroftheNationalChristianCouncilofSriLanka.HehasalsoservedasChairmanoftheIncorporatedTrusteesoftheChurchofCeylon.
HealsoservedonthePresidentialTaskForceonNon-TraditionalExportandImportCompetitiveAgriculturesetupbyPresidentR.Premadasa.HeservedasChairmanoftheEcumenicalLoanFundofSriLankaandonitsInternationalBoardinGeneva.HewasamemberoftheCommercialLawReformCommissionandhasservedontheParliamentaryConsultativeCommitteeonInternalandInternationalTrade.
HeholdsaBachelorofLawDegreeandanExecutiveDiplomainBusinessAdministration.
CHANDIMA GUNAWARDENAChandimaGunawardenaservesasaNon-Independent,Non-ExecutiveDirectorofCarsonCumberbatchPLCandinmostoftheCarsonsGroupCompaniesinSriLankaandoverseas.HeisalsoaDirectorofBukitDarahPLC.SinceassumingNon-ExecutivestatusintheGroup,heservesasanadvisortotheGroup’sStrategicPlanningandManagementforumsinSriLankaandservesonBoardCommitteesincludingtheAuditCommitteesoftheGroupinSriLankaandoverseascoveringalloperatingsectorsoftheGroup.
Mr.GunawardenahasoverfourdecadesofexperienceinvariedfieldsofbusinessandcommercialactivitiesandhasheldseniorpositionsinCorporate,MercantileandStateInstitutions.HewasappointedtotheCarsonsGroupDirectoratein1990.
HehasservedintheManagementCommitteeofTheCeylonChamberofCommerceforover10yearsandwasaFounderCouncilmemberoftheSriLankaInstituteofDirectors(SLID)andcontinuedtoserveinthecouncilforover10years.
HeisaFellowoftheCharteredInstituteofManagementAccountants,UK.
AJITH WEERATUNGE AjithWeeratungeisaDirectoroftheCarsonCumberbatchGroup’sManagementCompany,CarsonsManagementServices(Private)LimitedandholdsthepositionofHeadofFinance.HeisalsoaDirectorofEquityOnePLCandEquityTwoPLC,aswellastheGroup’sInvestmentHoldingSector-RubberInvestmentTrustLimitedandGuardianFundManagementLimited.Accountsformorethan30yearsoffinancerelatedexperienceinthemercantilesectorandhasheldpositionsinLankaWalltileLtd.,UnionApparels(Pvt)Ltd.,JohnKeellsHoldingsPLC,PhoenixIndustries(Pvt)LtdandCeylonBeverageHoldingsPLC.
HeisaFellowmemberoftheCharteredInstituteofManagementAccountantsofUK.
ROSE COORAYRoseCoorayisaDirectorofCeylonGuardianInvestmentTrustPLCandHattonNationalBankPLC.ShefunctionsasthechairpersonoftheBoardIntegratedRiskCommitteeandasamemberoftheBoardAuditCommitteeoftheHattonNationalBankPLC.SheisaretiredDeputyGovernoroftheCentralBankofSriLankawheresheservedforover35years.
OnreleasefromtheCentralBank,shehadservedtheMinistryofFinanceinthecapacityofDirectorGeneralFiscalPolicyandEconomicAffairsDepartmentfornearly6years,representedtheGovernmentontheBoardsofDFCCBank,SriLankaInstituteofInformationTechnology,SriLankaTelecom,CeylonElectricityBoard,DeLaRueCurrencyandSecurityPrint(Pvt)Ltd,ExportDevelopmentBoard,NationalHousingandDevelopmentAuthorityandrepresentedtheMonetaryBoardonWestCoastPower(Pvt)Ltd.
ShehasfunctionedastheViceChairpersonoftheInstituteofBankersofSriLankafor5yearsandhasservedonanumberofCommitteesatnationallevelcoveringavarietyofsubjectsrepresentingtheMinistryofFinanceandtheCentralBank.ShehasalsorepresentedtheCentralBankandtheMinistryofFinanceatvariousinternationalmeetings/seminars.
Mrs.Coorayhasbeeninvolvedextensivelyinpolicymakingandimplementingprojectsandprogrammes,especiallyintheareaofregionaldevelopmentandmicrofinance.ShehaswideexperienceinnegotiatingloanswithmultilateralandotherdonorsaswellasbilateraltradeagreementsonbehalfoftheGovernment.Herarticles/papershavebeenpublishedinprofessionaljournals.

26 Ceylon Investment PLC | Annual Report 2013/14
ASOKA DE. Z. GUNASEKERAAsokaGunasekeraisaDirectorofCeylonGuardianInvestmentTrustPLC.AlsoservesasAlternateDirectortoMr.I.WSenanayake(Chairman)ofIWSHoldings(Pvt)Ltd.andinmostGroupcompanies.PastChairmanoftheNationalChamberofCommerceofSriLankaandPastPresidentoftheCeylonNationalChamberofIndustries.HeisaPastInternationalDirectorandaBoardAppointeeofLionsClubsInternationalandwasalsoaMemberoftheNationalPoliceCommissionofSriLanka.HeservedasLegalAdvisorandSecretarytotheMinistryofPostsandTelecommunications;Co-ordinatingSecretarytotheMinistryofPowerandEnergyandMinistryofHighwaysandwastheActingSecretarytotheMinistryofPolicyPlanning.
HeisanAttorney-at-Law&NotaryPublic.
MANILAL FERNANDOManilalFernandoisaDirectorofCeylonGuardianInvestmentTrustPLCandiscurrentlytheChairmanofShippingCargoLogistics(Pvt)Ltd.,HyundaiLanka(Pvt)Ltd.andDynamicAVTechnologies(Pvt)Ltd.DirectorofPirarus(Pvt)Ltd.,AitkenSpence&Co.PLC,SriLankanAirlinesLimited,StallionPlantations(Pvt)Ltd.andEcoCorpAsiaPrivateLimited.HeisalsoaTrusteeofJosephFraserMemorialHospital.
HehasbeenthePastPresidentoftheFootballFederationofSriLankafrom1979to1999,aswellastheVicePresidentoftheNationalOlympicCommitteeofSriLankafrom1990todate.
HeisanAttorney-at-Law&NotaryPublic.
Profiles of the Directors
KRISHNA SELVANATHANKrishnaSelvanathanisaDirectorofCarsonsManagementServices(Private)Limited,LionBrewery(Ceylon)PLCandtheInvestmentSectorCompaniesoftheCarsonsGroup.HeisalsoaDirectorofCarlsbergIndia(Pvt)Ltd.
HeholdsaBADegreeinAccounting&FinanceandBusinessAdministrationfromtheUniversityofKent,U.K.

Ceylon Investment PLC | Annual Report 2013/14 | 27
RUVINI FERNANDO RuviniFernandoistheDirectorandCEOofGuardianFundManagementLimited,theinvestmentmanagementcompanyoftheCarsonsGroupandaDirectorofGuardianAcuityAssetManagementLimited,ajointventurecompanyoftheGuardianGroup,responsibleforoperatingandmanaginglicensedunittrusts.DirectoroftheSriLankaFund-aforeignincorporatedcountryfundmanagedbyGuardianFundManagementLimited.
Countsover24yearsworkexperienceinthefieldsofManagementAccounting,Finance,ResearchAnalysis,StrategicPlanningandInvestments,withintheHayleysGroupandCarsonCumberbatchGroup.MemberoftheFinance,BankingandCapitalMarketsCommitteeoftheCeylonChamberofCommerce.
WasaformervisitingfacultymemberofthePostgraduateInstituteofManagementintheMBAprogramme.MemberoftheRegainingSriLankaTourismSteeringCommittee,akeypolicymakingforumofthegovernmentfromJanuary2002toJanuary2004.FellowoftheCharteredInstituteofManagementAccountants,UKandtheAssociationofCharteredCertifiedAccountants,UK.HasaMastersDegreeinBusinessAdministrationfromthePostgraduateInstituteofManagement(PIM),UniversityofSriJayewardenepura,SriLanka.
NILOO JAYATILAKENilooJayatilakeisaDirectorofGuardianFundManagementLimitedandheadstheportfoliomanagementdivisionofthemanagementcompany.AlternateDirectorofGuardianAcuityAssetManagementLimitedandrepresentsthecompanyontheUnitTrustAssociationofSriLanka.Counts20yearsofexperienceintheinvestmentsandportfoliomanagementfield.PriortojoiningtheCarsonsGroupworkedasFundManageratTheUnitTrustManagementCompanyLimited,managersofCeybankUnitTrustFundsinSriLanka.FellowMemberofthe
CharteredInstituteofManagementAccountants,UKandAssociateMemberoftheInstituteofCharteredSecretariesandAdministrators,UK.
THARINDA JAYAWARDANAHeadofResearchofGuardianFundManagementLtd.Hehasover6yearsexperienceininvestmentresearch.PriortojoiningtheCarsonCumberbatchGroupheworkedasafinancialanalystatJBSecuritiesLtd.HeisaCFACharterHolderandanAssociateMemberoftheCharteredInstituteofManagementAccountants(UK).HealsohasafirstclassB.Sc(Hons)inFinancefromtheUniversityofSriJayewardenepura.
SUMITH PERERAFundManager,GuardianFundManagementLtd.Hasover7yearsofexperienceinthefieldofAssetManagementworkingasaFundManagerforCAAMSaudiFransiLLC(KingdomofSaudiArabia),InvestmentAnalystforEagleNDBFundManagement(SriLanka)andasaFinancialAnalystforJohnKeellsStockbrokers(SriLanka).HeholdsaBsc(Hons)inEconomicsandBusinessFinancefromBrunelUniversity,UKandisanAssociateMemberoftheCharteredInstituteofManagementAccountants.
VIBATH WIJESINGHEFinancialControllerofCarsonsManagementServices(Private)LimitedthemanagementsupportserviceprovidertotheCarsonCumberbatchGroup.HebeganhiscareeratM/s.KPMG,SriLankaandhasovertenyearsofexperienceinthefieldsoffinance,corporatefinanceandauditing.HejoinedCarsonCumberbatchGroupin2004.HeisanAssociateMemberoftheInstituteofCharteredAccountantsofSriLanka,CharteredInstituteofManagementAccountants(UK)andoftheSocietyofCertifiedManagementAccountantsofSriLanka.HealsoholdsaMastersdegreeinBusinessAdministrationfromPostgraduateInstituteofManagement–UniversityofSriJayewardenepura.
Management Team Profile
SISIRA WICKRAMASINGHESectorAccountantfortheInvestment,RealEstateandLeisuresectors.CommencedcareeratKPMG,CharteredAccountants,priortojoiningCarsonsGroup.Countsoversevenyearsofexperienceinauditing,accountingandfinancialreporting.HeisanAssociateMemberoftheInstituteofCharteredAccountantsofSriLanka.HealsoholdsaB.Sc.Accounting(Special)degreefromtheUniversityofSriJayewardenepura,SriLanka.
ASANKA JAYASEKERAManagerResearch,GuardianFundManagementLtd.Hehasover6yearsofexperienceininvestmentresearch.PriortojoiningtheCarsonCumberbatchGroup,heworkedasafinancialanalystatJBSecuritiesLtd.HeisanassociatememberoftheCharteredInstituteofManagementAccountants(UK)andholdsaB.ScdegreefromtheUniversityofSriJayewardenepuraspecializinginFinance.
LAKMAL WICKRAMAARACHCHIAccountant,GuardianFundManagementLimited.CommencedcareeratKPMG,CharteredAccountants,priortojoiningtheCarsonsGroup.Countsoversixyearsofexperienceinauditingandaccounting.AssociateMemberoftheInstituteofCharteredAccountantsofSriLanka.HoldsaB.Sc.Finance(Special)DegreefromtheUniversityofSriJayewardenepura,SriLanka.

28 Ceylon Investment PLC | Annual Report 2013/14
Audit Committee Report
AsprovidedbytheColomboStockExchangeListingRules,theAuditCommitteeofCarsonCumberbatchPLC(CCPLC)-theultimateParentCompanyistheAuditCommitteeoftheCompany.
TheMembersoftheAuditCommitteeareasfollows:
Audit Committee Members
Executive/Non-Executive/Independent
Mr.VijayaMalalasekera(Chairman)
Non-Executive,Independent(CCPLC)
Mr.ChandimaGunawardena
Non-Executive(CCPLC)
Mr.FaizMohideen Non-Executive,Independent(CCPLC)
Mr.VijayaMalalasekeraisaNon-Executive,IndependentDirectorofCCPLCandaformerDirectorofCeylonTobaccoCompanyPLC.
Mr.ChandimaGunawardenaisaNon-ExecutiveDirectorofCCPLCandinmostofitsGroupCompanies.HeisaFellowoftheCharteredInstituteofManagementAccountants,U.K.
Mr.FaizMohideen,aNon-Executive,IndependentDirectorofCCPLC,wastheformerDeputySecretarytotheTreasuryandaformerDirectorofBankofCeylonandSecuritiesandExchangeCommissionofSriLanka.
ThepurposeoftheAuditCommitteeofCCPLCisasfollows:
ToassisttheBoardofDirectorsinfulfillingitsoversightresponsibilitiesforthefinancialreportingprocess,thesystemofinternalcontroloverfinancialreporting,theauditprocessandtheCompany’sprocessformonitoringcompliancewithlawsandregulations,Companypoliciesandproceduresandthecodeofconduct.
Toensurethattheinternalauditactivityiswellmanaged,sothatitaddsvaluetotheorganizationbybeingobjectiveinprovidingrelevantassurance,contributingtotheeffectivenessandefficiencyofgovernance,riskmanagementandcontrolprocesses.
TheauditaspectsofCeylonInvestmentPLCareconductedwithintheAgendaofCCPLC-AuditCommittee.
CCPLC-AuditCommitteeheld05MeetingsduringthefinancialyeartodiscussmattersrelatingtotheCompanyandtheattendanceoftheMembersoftheAuditCommitteewasasfollows:
Meetings attended (out of five)
Mr.VijayaMalalasekera(Chairman) 05
Mr.ChandimaGunawardena 05
Mr.FaizMohideen 05
TheChiefExecutiveOfficer-InvestmentSector,FinancialController-CarsonsManagementServices(Private)Limited-Managers,internalauditorsandseniormanagementstaffmembersalsoattendedtheAuditCommitteeMeetingsbyinvitation.
TheCommitteemettheExternalAuditors,Messrs.KPMGtwiceduringtheyear,i.e.todiscusstheauditscopeandtodeliberatethedraftFinancialReportandAccounts.TheAuditCommitteealsomettheExternalAuditorsanddiscussedthedraftFinancialReportandAccounts,withoutthemanagementbeingpresent.
TheAuditCommitteeapprovedtheauditplanforthefinancialyear2013/2014andtheGroupInternalAudit(GIA)carriedout06detailedauditsontheInvestmentSectorcompanies.
ThefindingsandcontentsoftheGroupInternalAuditreportshavebeendiscussedwiththemanagementandsubsequentlytheauditreportswerecirculatedtotheAuditCommitteeandtothemanagement.
TheobjectivesoftheGIAworkwastohaveanindependentreviewofthesystemofinternalcontrolsasestablishedbythemanagement,itsadequacyandintegrityvis-à-visobjectivesservedandtodeterminetheextentofadherencetothecontrolsbystaffresponsibleforthefunctionandtotakecorrective/preventiveactionwherenecessary.
TheinterimfinancialstatementsofCeylonInvestmentPLChavebeenreviewedbytheAuditCommitteeMembersatAuditCommitteeMeetings.
ThedraftfinancialstatementsofCeylonInvestmentPLCfortheyearended31stMarch2014werereviewedataMeetingoftheAuditCommittee,togetherwiththeExternalAuditors,Messrs.KPMG,priortoreleaseofsametotheRegulatoryAuthoritiesandtotheshareholders.TheAuditCommitteewasprovidedwithconfirmationsanddeclarationsasrequired,bytheManagers,CarsonsManagementServices(Private)LimitedthatthesaidfinancialstatementswerepreparedinaccordancewiththeSriLankaAccountingStandardsandtheinformationrequiredbytheCompaniesActNo.07of2007thereinandpresentedatrueandfairviewoftheCompany’sstateofaffairsasatthatdateandtheCompany’sactivitiesduringtheyearunderreview.
TheInstituteofCharteredAccountantsofSriLankahasissuedthefollowingnewSriLankaAccountingStandardswhichhavebecomeapplicableforthefinancialperiodbeginningonorafter1stJanuary2014/2015.

Ceylon Investment PLC | Annual Report 2013/14 | 29
However,thesestandardshavenotbeenappliedwhenpreparingthecurrentyearfinancialstatements.
• SriLankaAccountingStandards-SLFRS10"Consolidatedfinancialstatements"
• SriLankaAccountingStandards-SLFRS11"JointArrangements"
• SriLankaAccountingStandards-SLFRS12"DisclosureofInterestinOtherEntities"
• SriLankaAccountingStandards-SLFRS13"FairValueMeasurement"
Asexplainedinnote10tothefinancialstatements,themanagementisintheprocessofassessingtheimpact,ifany,onadoptionofthenewstandardswhichhavebecomeeffectivefrom1stApril2014.
TheAuditCommitteehasdeterminedthatMessrs.KPMG,CharteredAccountants,AuditorswereindependentonthebasisthattheydidnotcarryoutanymanagementrelatedfunctionsoftheCompany.
TheAuditCommitteehasconcurredtorecommendtotheBoardofDirectorsthere-appointmentofMessrs.KPMG,CharteredAccountants,asAuditorsforthefinancialyearending31stMarch2015,subjecttotheapprovaloftheshareholdersofCeylonInvestmentPLCattheAnnualGeneralMeeting.
(Sgd.)V.P. MalalasekeraChairman–AuditCommitteeCarson Cumberbatch PLC
Colombo25thJune2014

30 Ceylon Investment PLC | Annual Report 2013/14
IndependentAuditors’Report 31
StatementofComprehensiveIncome 32
StatementofFinancialPosition 33
StatementofChangesinEquity 34
StatementofCashFlow 35
NotestotheFinancialStatements 36
FiveYearSummary 66
InformationtoShareholdersandInvestors 74
NoticeofMeeting 76
FormofProxy 77
Financial Information
FINANCIAL CALENDAR
Financialyearend 31stMarch201468thAnnualGeneralMeetingtobeheldon 30thJuly2014
ANNOUNCEMENT OF RESULTSInterimFinancialStatementspublishedintermsoftheListingRulesoftheColomboStockExchange
1stQuarterended30thJune2013 13thAugust2013
2ndQuarterended30thSeptember2013 14thNovember2013
3rdQuarterended31stDecember2013 13thFebruary2014
4thQuarterended31stMarch2014 30thMay2014

Ceylon Investment PLC | Annual Report 2013/14 | 31
TO THE SHAREHOLDERS OF CEYLON INVESTMENT PLC Report on the Financial StatementsWehaveauditedtheaccompanyingfinancialstatementsofCeylonInvestmentPLC(the“Company”),whichcomprisethestatementoffinancialpositionasatMarch31,2014,andthestatementsofcomprehensiveincome,changesinequityandcashflowfortheyearthenended,andasummaryofsignificantaccountingpoliciesandotherexplanatorynotesassetoutonpages32to65oftheAnnualReport.
Management’s Responsibility for the Financial Statements ManagementisresponsibleforthepreparationandfairpresentationofthesefinancialstatementsinaccordancewithSriLankaAccountingStandards.Thisresponsibilityincludes:designing,implementingandmaintaininginternalcontrolrelevanttothepreparationandfairpresentationoffinancialstatementsthatarefreefrommaterialmisstatement,whetherduetofraudorerror;selectingandapplyingappropriateaccountingpolicies;andmakingaccountingestimatesthatarereasonableinthecircumstances.
Scope of Audit and Basis of OpinionOurresponsibilityistoexpressanopiniononthesefinancialstatementsbasedonouraudit.WeconductedourauditinaccordancewithSriLankaAuditingStandards.Thosestandardsrequirethatweplanandperformtheaudittoobtainreasonableassurancewhetherthefinancialstatementsarefreefrommaterialmisstatement.
Anauditincludesexamining,onatestbasis,evidencesupportingtheamountsanddisclosuresinthefinancialstatements.Anauditalsoincludesassessingtheaccountingpoliciesusedandsignificantestimatesmadebymanagement,aswellasevaluatingtheoverallfinancialstatementpresentation.
Wehaveobtainedalltheinformationandexplanationswhichtothebestofourknowledgeandbeliefwerenecessaryforthepurposesofouraudit.Wethereforebelievethatourauditprovidesareasonablebasisforouropinion.
OpinionInouropinion,sofarasappearsfromourexamination,theCompanymaintainedproperaccountingrecordsfortheyearendedMarch31,2014andthefinancialstatementsgiveatrueandfairviewofthefinancialpositionoftheCompanyasatMarch31,2014andofitsfinancialperformanceanditscashflowsfortheyearthenendedinaccordancewithSriLankaAccountingStandards.
Report on Other Legal and Regulatory RequirementsThesefinancialstatementsalsocomplywiththerequirementsofSection151(2)oftheCompaniesActNo.07of2007.
Chartered Accountants
Colombo
25thJune2014
Independent Auditors’ Report

32 Ceylon Investment PLC | Annual Report 2013/14
Statement of Comprehensive IncomeInRupeesThousands
For the year ended 31st March Note 2014 2013 (Restated)
Revenue 11 496,779 445,977
Netchangeinfairvalueoffairvaluethroughprofitorlossfinancialassets 303 52,667
Profit on investment activities 497,082 498,644
Administrativeandotheroperatingexpenses (39,531) (26,602)
Profit from operations 12 457,551 472,042
Netfinanceexpense 13 (1,636) (10)
Profit from operations after net finance expenses 455,915 472,032
Shareofprofitofequityaccountedinvesteesnetoftax 14 726,501 728,539
Profit before taxation 1,182,416 1,200,571
Incometaxexpenses 15 (30,059) (18,603)
Profit for the year 1,152,357 1,181,968
Other comprehensive income Shareofothercomprehensiveexpensesofequityaccountedinvesteesnetoftax (816,768) (162,790)
Netchangeinfairvalueofavailableforsalefinancialassets 32,955 273,247
Transferofrealizedgainsonavailableforsalefinancialassets (253,761) (209,511)
Foreigncurrencydifferencesarisingontranslationofavailableforsalefinancialassets 5,488 (2,790)
Total other comprehensive expense for the year (1,032,086) (101,844)
Total comprehensive income for the year 120,271 1,080,124
Earnings per share (Rs.) 16 11.70 12.00
Dividend per share (Rs.)* 17 2.50 1.75
Thenotesfrompages36to65formanintegralpartofthesefinancialstatements.
*Dividendspershareiscalculatedbasedontheproposeddividend/interimdividend.
Figures in brackets indicate deductions.

Ceylon Investment PLC | Annual Report 2013/14 | 33
InRupeesThousands
As at 31st March Note 2014 2013 (Restated)
ASSETS Non-current assets Investmentinequityaccountedinvestees 18 4,738,898 5,024,093 Availableforsalefinancialassets 19 2,520,325 2,210,275 Total non-current assets 7,259,223 7,234,368 Current Assets Tradeandotherreceivables 20 7,027 48,969 Fairvaluethroughprofitorlossfinancialassets 21 644,802 503,630 Cashandcashequivalents 22 809,194 962,421 Total current assets 1,461,023 1,515,020 Total assets 8,720,246 8,749,388
EQUITY AND LIABILITIES Equity Statedcapital 23 673,530 673,530 Capitalreserves 24.1 1,709,133 2,525,901 Revenuereserves 24.2 6,042,709 5,524,358 Total equity 8,425,372 8,723,789 Current Liabilities Tradeandotherpayables 25 276,382 18,437 Currenttaxliabilities 15,795 6,716 Bankoverdraft 2,697 446 Totalcurrentliabilities 294,874 25,599 Total liabilities 294,874 25,599 Total equity and liabilities 8,720,246 8,749,388 Net assets per share - Book value (Rs.) 85.52 88.55 Net assets per share - Market value (Rs.) 117.55 130.74
Thenotesfrompages36to65formanintegralpartofthesefinancialstatements. IcertifythatthesefinancialstatementshavebeenpreparedincompliancewiththerequirementoftheCompaniesAct,No.07of2007.
(Sgd.) V.R.Wijesinghe FinancialController Carsons Management Services (Private) Limited
TheBoardofDirectorsisresponsibleforthepreparationandpresentationofthesefinancialstatements. ApprovedandsignedonbehalfoftheInvestmentManagers, ApprovedandsignedonbehalfoftheBoard,
(Sgd.) (Sgd.) (Sgd.) W. Y. R. Fernando I. Paulraj D.C.R. Gunawardena Director Chairman Director Guardian Fund Management Limited. Colombo 25thJune2014
Statement of Financial Position

34 Ceylon Investment PLC | Annual Report 2013/14
Statement of Changes in Equity InRupeesThousands
Stat
ed
capi
tal
Capi
tal r
eser
ves
Reve
nue
rese
rves
Tota
l equ
ity
Inve
stm
ent
rese
rve
Othe
r ca
pita
l re
serv
e
Asso
ciat
e co
mpa
ny’s
capi
tal
rese
rve
Fair
val
ue
thro
ugh
profi
t or l
oss
finan
cial
as
sets
re
serv
e
Avai
labl
e fo
r Sa
le
finan
cial
as
set
rese
rve
Gene
ral
rese
rve
Reta
ined
ea
rnin
gs
(Res
tate
d)(R
esta
ted)
(Res
tate
d)
Balanceasat1
stApril2012
673,530
8,401
178,740
2,501,550
- 7
76,7
65
27,217
3,600,606
7,766,809
Profitfortheyear*
--
--
--
-1,181,968
1,181,968
Othercom
prehensiveincome/
(expense)fortheyear
(162,790)
-60,946
--
(101,844)
Totalcom
prehensiveincome/
(expense)fortheyear
--
-(162,790)
-60,946
-1,181,968
1,080,124
Dividendpaidfor2
011/12
--
--
--
-(123,144)
(123,144)
Transfers
--
--
43,436
--
(43,436)
-
Balanceasat3
1stM
arch2013
673,530
8,401
178,740
2,338,760
43,436
837,711
27,217
4,6
15,9
94
8,723,789
Bala
nce
as a
t 1s
t Ap
ril 2
013
673
,530
8
,401
1
78,7
40
2,3
38,7
60
43,
436
837
,711
2
7,21
7 4
,615
,994
8
,723
,789
Profi
t fo
r th
e ye
ar *
--
--
--
- 1
,152
,357
1
,152
,357
Othe
r co
mpr
ehen
sive
exp
ense
for
the
year
--
- (
816,
768)
- (
215,
318)
--
(1,
032,
086)
Tota
l com
preh
ensi
ve in
com
e/(e
xpen
se)
for
the
year
--
- (
816,
768)
- (
215,
318)
- 1
,152
,357
1
20,2
71
Divi
dend
pai
d fo
r 20
12/1
3-
--
(41
8,68
8) (
418,
688)
Tran
sfer
s-
--
- (
28,9
10)
28,
910
-
Bala
nce
as a
t 31
st M
arch
201
4 6
73,5
30
8,4
01
178
,740
1
,521
,992
1
4,52
6 6
22,3
93
27,
217
5,3
78,5
73
8,4
25,3
72
*Profitfortheyearincludesshareofprofitoftheassociatecom
panywhichcannotbedistributed.
Thenotesfrom
pages36to65formanintegralpartofthesefinancialstatements.
Rest
atem
ent
of c
ompa
rati
ve fi
gure
sInformationonrestatem
entofcom
parativefiguresisgiveninnote31tothefinancialstatements.
Figu
res
in b
rack
ets
indi
cate
ded
uctio
ns.

Ceylon Investment PLC | Annual Report 2013/14 | 35
InRupeesThousands
Statement of Cash Flow
For the year ended 31st March Note 2014 2013 (Restated)
Cash flows from operating activities Profitbeforetaxation 1,182,416 1,200,571
Adjustments for:
Netchangeinfairvalueoffairvaluethroughprofitorlossfinancialassets (303) (52,667)
Netfinanceexpense 1,636 10
Shareofprofitofequityaccountedinvesteesnetoftax (726,501) (728,539)
Dividendreceivedfromequityaccountedinvestees 18.b 194,928 43,433
Operating profit before working capital changes 652,176 462,808
(Increase)/decreaseintradeandotherreceivables 41,942 (36,380)
Net(increase)/decreaseininvestments (666,237) 73,645
Increase/(decrease)intradeandotherpayables 9,136 (63)
Cash generated from operations 37,017 500,010
Incometaxpaid (20,980) (7,124)
Net cash generated from operating activities 16,037 492,886
Cash flows from financing activities
Financecostpaid (1,636) (10)
Dividendpaid (169,879) (122,295)
Net cash used in financing activities (171,515) (122,305)
Net increase/(decrease) in cash and cash equivalents (155,478) 370,581
Cash and cash equivalents at the beginning of the year 961,975 591,394
Cash and cash equivalents at the end of the year 22 806,497 961,975
Thenotesfrompages36to65formanintegralpartofthesefinancialstatements.
Figures in brackets indicate deductions.

36 Ceylon Investment PLC | Annual Report 2013/14
Notes to the Financial Statements
1. Reporting Entity CeylonInvestmentPLCisalimitedliability
companywhichisincorporatedinSriLanka.ThesharesoftheCompanyhaveaprimarylistingontheColomboStockExchange.
TheregisteredofficeandprincipalplaceofbusinessofthecompanyislocatedatNo61JanadhipathiMawatha,Colombo1.
ThefinancialstatementsoftheCompanyasatandfortheyearended31March2014comprisethefinancialinformationofCompanyandthecompany’sinterestinassociatecompany.
TheprincipalactivitiesoftheCompanyistoactasspecialisedinvestmentvehiclestoundertakelistedequityandfixedincomeinvestmentsandtoengageinfundmanagementactivities.
TherewerenosignificantchangesinthenatureoftheprincipalactivitiesoftheCompanyduringthefinancialyearunderreview.
TheCompanyhadnoemployeesasatthereportingdate(2013-Nil).
2. Basis of Preparation Statement of compliance
ThefinancialstatementsoftheCompanycomprisethestatementoffinancialposition,statementofcomprehensiveincome,statementofchangesinequityandcashflowstogetherwiththenotestothefinancialstatements.
ThefinancialstatementshavebeenpreparedinaccordancewithSriLankaAccountingStandards(LKAS/SLFRS)laiddownbytheInstituteofCharteredAccountantsofSriLankaandtherequirementsofCompaniesAct,No.7of2007.
ThefinancialstatementswereauthorisedforissuebytheBoardofDirectorson25thJune2014.
(b) Basis of measurement
Thefinancialstatementshavebeenpreparedonthehistoricalcostbasisandappliedconsistentlywithnoadjustmentsbeingmadeforinflationaryfactorsaffectingthefinancialstatements,exceptforthefollowingmaterialitemsinthestatementoffinancialposition;
• Non-derivativefinancialinstrumentsclassifiedfairvaluethroughprofitorlossaremeasuredatfairvalue;
• Available-for-salefinancialassetsaremeasuredatfairvalue;
ThesefinancialstatementshavebeenpreparedonthebasisthattheCompanywouldcontinueasagoingconcernfortheforeseeablefuture.
(c) Functional and Presentation Currency
Itemsincludedinthefinancialstatementsaremeasuredusingthecurrencyoftheprimaryeconomicenvironmentinwhichtheentityoperates(‘thefunctionalcurrency’).ThefinancialstatementsarepresentedinSriLankanRupees,whichistheCompany’sfunctionalandpresentationcurrency.
(d) Use of estimates and judgments
ThepreparationofthefinancialstatementsinconformitywithLKAS/SLFRSrequiresmanagementtomakejudgments,estimatesandassumptionsthataffecttheapplicationofaccountingpoliciesandthereportedamountsofassets,liabilities,incomeandexpenses.Actualresultsmaydifferfromtheseestimates.
Estimatesandunderlyingassumptionsarereviewedonanongoingbasis.Revisionstoaccountingestimatesarerecognisedintheperiodinwhichtheestimatesarerevisedandinanyfutureperiodsaffected.
Informationaboutassumptionsandestimationuncertaintiesthathaveasignificantriskofresultinginamaterialadjustmentwithinthenextfinancialyearareincludedinthefollowingnotes:
Assumptionsandestimationuncertainties:
i. Assessment of Impairment - Key assumptions used in discounted cash flow projections.
TheCompanyassessesateachreportingdatewhetherthereisobjectiveevidencethatanassetorportfolioofassetsisimpaired.Therecoverableamountofanassetisthegreaterofitsvalueinuseanditsfairvaluelesscoststosell.Inassessingvalueinuse,theestimatedfuturecashflowsarediscountedtopresentvalueusingappropriatediscountratesthatreflectsthecurrentmarketassessmentsofthetimevalueofmoneyandrisksspecifictotheasset.
ii. Current taxation
CurrenttaxliabilitiesarisetotheCompanyinvariousjurisdictions.Theseliabilitiesareprovidedforinthefinancialstatementsapplyingtherelevanttaxstatutesandregulationswhichthemanagementbelievesreflecttheactualliability.TherecanbeinstanceswherethestandtakenbytheCompanyontransactionsiscontestedbyrevenueauthorities.Anyadditionalcostsonaccountoftheseissuesareaccountedforasataxexpenseatthepointtheliabilityisconfirmedontheentity.

Ceylon Investment PLC | Annual Report 2013/14 | 37
Materiality and aggregation
EachmaterialclassofsimilaritemsispresentedinaggregateintheFinancialStatements.Itemsofdissimilarnatureorfunctionarepresentedseparatelyunlesstheyareimmaterial.
3. Significant Accounting Policies
TheAccountingPoliciessetoutbelowhavebeenappliedconsistentlytoallperiodspresentedintheFinancialStatementsoftheCompanyunlessotherwiseindicated.
(i) Investments in associates (equity-accounted investees)
AssociatesarethoseentitiesinwhichtheCompanyhassignificantinfluence,butnotcontrolorjointcontrol,overthefinancialandoperatingpolicies.SignificantinfluenceispresumedtoexistwhentheCompanyholdsbetween20percentand50percentofthevotingpowerofanotherentity.
Investmentsinassociatesareaccountedforundertheequitymethodandarerecognisedinitiallyatcost.Thecostoftheinvestmentincludestransactioncosts.
ThefinancialstatementsincludetheCompany’sshareoftheprofitorlossandothercomprehensiveincomeofequity-accountedinvestees,afteradjustmentstoaligntheaccountingpolicieswiththoseoftheCompany,fromthedatethatsignificantinfluencecommencesuntilthedatethatsignificantinfluenceceases.
WhentheCompany’sshareoflossesexceedsitsinterestinanequity-accountedinvestee,thecarryingamountoftheinvestment,includinganylong-termintereststhatformpartthereof,isreducedtozero,andtherecognition
offurtherlossesisdiscontinuedexcepttotheextentthattheCompanyhasanobligationorhasmadepaymentsonbehalfoftheinvestee.
(a) Foreign currency
(i) Foreign currency transactions
Transactionsinforeigncurrenciesaretranslatedtotherespectivefunctionalcurrenciesofentityatexchangeratesasatthedatesofthetransactions.Monetaryassetsandliabilitiesdenominatedinforeigncurrenciesatthereportingdateareretranslatedtothefunctionalcurrencyattheexchangerateasatthatdate.
Theforeigncurrencygainorlossonmonetaryitemsisthedifferencebetweenamortisedcostinthefunctionalcurrencyatthebeginningoftheyear,adjustedforeffectiveinterestandpaymentsduringtheyear,andtheamortisedcostinforeigncurrencytranslatedattheexchangerateattheendoftheyear.
Non-monetaryassetsandliabilitiesthataremeasuredatfairvalueinaforeigncurrencyareretranslatedtothefunctionalcurrencyattheexchangerateatthedatethatthefairvaluewasdetermined.Non-monetaryitemsthataremeasuredbasedonhistoricalcostinaforeigncurrencyaretranslatedusingtheexchangerateatthedateofthetransaction.
Foreigncurrencydifferencesarisingonretranslationaregenerallyrecognisedinprofitorloss.However,foreigncurrencydifferencesarisingfromtheretranslationofthefollowingitemsarerecognisedinothercomprehensiveincome:
• available-for-saleequityinvestments(exceptonimpairmentinwhichcaseforeigncurrencydifferencesthathavebeenrecognisedinothercomprehensiveincomearereclassifiedtoprofitorloss);
(b) Financial instruments
(i) Non-derivative financial assets
TheCompanyinitiallyrecognisesloansandreceivablesonthedatethattheyareoriginated.Allotherfinancialassets(includingassetsdesignatedasatfairvaluethroughprofitorloss)arerecognisedinitiallyonthetradedate,whichisthedatethattheCompanybecomesapartytothecontractualprovisionsoftheinstrument.
TheCompanyderecognisesafinancialassetwhenthecontractualrightstothecashflowsfromtheassetexpire,orittransferstherightstoreceivethecontractualcashflowsinatransactioninwhichsubstantiallyalltherisksandrewardsofownershipofthefinancialassetaretransferred.AnyinterestinsuchtransferredfinancialassetsthatiscreatedorretainedbytheCompanyisrecognisedasaseparateassetorliability.
Financialassetsandliabilitiesareoffsetandthenetamountpresentedinthestatementoffinancialpositionwhen,andonlywhen,theCompanyhasalegalrighttooffsettheamountsandintendseithertosettlethemonanetbasisortorealizetheassetandsettletheliabilitysimultaneously.
TheCompanyclassifiesnon-derivativefinancialassetsintothefollowingcategories;financialassetsatfairvaluethroughprofitorloss,loansandreceivablesandavailable-for-salefinancialassets.
Financial assets at fair value through profit or loss
Afinancialassetisclassifiedasatfairvaluethroughprofitorloss(FVTPL)orisdesignatedassuchoninitialrecognition.Financialassetsaredesignatedasatfairvaluethroughprofitorlossifthe

38 Ceylon Investment PLC | Annual Report 2013/14
CompanymanagessuchinvestmentsandmakespurchaseandsaledecisionsbasedontheirfairvalueinaccordancewiththeCompany’sdocumentedriskmanagementorinvestmentstrategy.Attributabletransactioncostsarerecognisedinprofitorlossasincurred.Financialassetsatfairvaluethroughprofitorlossaremeasuredatfairvalueandchangestherein,whichtakesintoaccountanydividendincome,arerecognisedinprofitorloss.
FinancialassetsclassifiedasFVTPLcompriseshort-termsovereigndebtsecuritiesactivelymanagedbytheCompany’streasurydepartmenttoaddressshort-termliquidityneeds.
Financialassetsdesignatedasfairvaluesthroughprofitorlosscompriseequitysecuritiesthatotherwisewouldhavebeenclassifiedasavailable-for-sale.
Loans and receivables
Loansandreceivablesarefinancialassetswithfixedordeterminablepaymentsthatarenotquotedinanactivemarket.Suchassetsarerecognisedinitiallyatfairvalueplusanydirectlyattributabletransactioncosts.Subsequenttoinitialrecognition,loansandreceivablesaremeasuredatamortisedcostusingtheeffectiveinterestmethod,lessanyimpairmentlosses.
Loansandreceivablescomprisecashandcashequivalents,andtradeandotherreceivables.
Specific instruments
Cash and cash equivalents
Cashandcashequivalentscomprisecashbalancesandcalldepositswithmaturitiesofthreemonthsorlessfromtheacquisitiondatethataresubjecttoaninsignificantriskofchangesintheirfairvalue,andareusedbytheCompany
inthemanagementofitsshort-termcommitments.
Investment in reverse repurchase agreement
Thecompanypurchasesafinancialassetandsimultaneouslyenterintoanagreementtoresellthesameorasubstantiallysimilarassetatafixedpriceonafuturedate.Thearrangementisaccountedforasaloanandreceivables.
Available-for-sale financial assets
Available-for-salefinancialassetsarenon-derivativefinancialassetsthataredesignatedasavailable-for-saleorarenotclassifiedinanyoftheabovecategoriesoffinancialassets.Available-for-salefinancialassetsarerecognisedinitiallyatfairvalueplusanydirectlyattributabletransactioncosts.
Subsequenttoinitialrecognition,theyaremeasuredatfairvalueandchangestherein,otherthanimpairmentlossesandforeigncurrencydifferencesonavailable-for-saledebtinstruments,arerecognisedinothercomprehensiveincomeandpresentedinthefairvaluereserveinequity.Whenaninvestmentisderecognised,thegainorlossaccumulatedinequityisreclassifiedtoprofitorloss.
Available-for-salefinancialassetscompriseequitysecuritiesanddebtsecurities.
(ii) Non-derivative financial liabilities
TheCompanyinitiallyrecognisesdebtsecuritiesissuedandsubordinatedliabilitiesonthedatethattheyareoriginated.Allotherfinancialliabilitiesarerecognisedinitiallyonthetradedate,whichisthedatethattheCompanybecomesapartytothecontractualprovisionsoftheinstrument.
TheCompanyderecognisesafinancialliabilitywhenitscontractualobligationsaredischarged,cancelledorexpire.
TheCompanyclassifiesnon-derivativefinancialliabilitiesintotheotherfinancialliabilitiescategory.Suchfinancialliabilitiesarerecognisedinitiallyatfairvaluelessanydirectlyattributabletransactioncosts.Subsequenttoinitialrecognition,thesefinancialliabilitiesaremeasuredatamortisedcostusingtheeffectiveinterestmethod.
Otherfinancialliabilitiescompriseoverdraftsandtradeandotherpayables.
BankoverdraftsthatarerepayableondemandandformanintegralpartoftheCompany’scashmanagementareincludedasacomponentofcashandcashequivalentsforthestatementofcashflows.
(iii) Stated capital
Ordinary shares
Ordinarysharesareclassifiedasequity.Costsattributabletotheissueofordinarysharesarerecognisedasanexpense.
(c) Impairment
(i) Non derivative financial assets
Afinancialassetnotclassifiedasatfairvaluethroughprofitorloss,includinganinterestinanequity-accountedinvestee,isassessedateachreportingdatetodeterminewhetherthereisobjectiveevidencethatitisimpaired.Afinancialassetisimpairedifthereisobjectiveevidenceofimpairmentasaresultofoneormoreeventsthatoccurredaftertheinitialrecognitionoftheasset,andthatlossevent(s)hadanimpactontheestimatedfuturecashflowsofthatassetthatcanbeestimatedreliably.
Notes to the Financial Statements

Ceylon Investment PLC | Annual Report 2013/14 | 39
Objectiveevidencethatfinancialassetsareimpairedincludesdefaultordelinquencybyadebtor,restructuringofanamountduetotheCompanyontermsthattheCompanywouldnotconsiderotherwise,indicationsthatadebtororissuerwillenterbankruptcy,adversechangesinthepaymentstatusofborrowersorissuers,economicconditionsthatcorrelatewithdefaultsorthedisappearanceofanactivemarketforasecurity.Inaddition,foraninvestmentinanequitysecurity,asignificantorprolongeddeclineinitsfairvaluebelowitscostisobjectiveevidenceofimpairment.TheCompanyconsidersadeclineof20percenttobesignificantandaperiodof9monthstobeprolonged.
Financial assets measured at amortised cost
TheCompanyconsidersevidenceofimpairmentforfinancialassetsmeasuredatamortisedcost(loansandreceivablesandheld-to-maturityfinancialassets)atbothaspecificassetandcollectivelevel.Allindividuallysignificantassetsareassessedforspecificimpairment.Thosefoundnottobespecificallyimpairedarethencollectivelyassessedforanyimpairmentthathasbeenincurredbutnotyetidentified.Assetsthatarenotindividuallysignificantarecollectivelyassessedforimpairmentbygroupingtogetherassetswithsimilarriskcharacteristics.
Inassessingcollectiveimpairment,theCompanyuseshistoricaltrendsoftheprobabilityofdefault,thetimingofrecoveriesandtheamountoflossincurred,adjustedformanagement’sjudgementastowhethercurrenteconomicandcreditconditionsaresuchthattheactuallossesarelikelytobegreaterorlesserthansuggestedbyhistoricaltrends.
Animpairmentlossinrespectofafinancialassetmeasuredatamortisedcostiscalculatedasthedifferencebetweenitscarryingamountandthepresentvalueoftheestimatedfuturecashflowsdiscountedattheasset’soriginaleffectiveinterestrate.Lossesarerecognisedinprofitorlossandreflectedinanallowanceaccountagainstloansandreceivables.Interestontheimpairedassetcontinuestoberecognised.Whenaneventoccurringaftertheimpairmentwasrecognisedcausestheamountofimpairmentlosstodecrease,thedecreaseinimpairmentlossisreversedthroughprofitorloss.
Available-for-sale financial assets
Impairmentlossesonavailable-for-salefinancialassetsarerecognisedbyreclassifyingthelossesaccumulatedinthefairvaluereserveinequitytoprofitorloss.Thecumulativelossthatisreclassifiedfromequitytoprofitorlossisthedifferencebetweentheacquisitioncost,netofanyprincipalrepaymentandamortisation,andthecurrentfairvalue,lessanyimpairmentlossrecognisedpreviouslyinprofitorloss.Changesincumulativeimpairmentlossesattributabletoapplicationoftheeffectiveinterestmethodarereflectedasacomponentofinterestincome.
If,inasubsequentperiod,thefairvalueofanimpairedavailable-for-saledebtsecurityincreasesandtheincreasecanberelatedobjectivelytoaneventoccurringaftertheimpairmentlosswasrecognised,thentheimpairmentlossisreversed,withtheamountofthereversalrecognisedinprofitorloss.However,anysubsequentrecoveryinthefairvalueofanimpairedavailable-for-saleequitysecurityisrecognisedinothercomprehensiveincome.
Animpairmentlossinrespectofanequity-accountedinvesteeismeasuredbycomparingtherecoverableamountoftheinvestmentwithitscarryingamount.
Animpairmentlossisrecognisedinprofitorloss.Animpairmentlossisreversediftherehasbeenafavourablechangeintheestimatesusedtodeterminetherecoverableamount.
(ii) Non-financial assets
ThecarryingamountsoftheCompany’snon-financialassetsarereviewedateachreportingdatetodeterminewhetherthereisanyindicationofimpairment.Ifanysuchindicationexists,thentheasset’srecoverableamountisestimated
Impairmentlossesarerecognisedinprofitorloss.
Animpairmentlossisreversedonlytotheextentthattheasset’scarryingamountdoesnotexceedthecarryingamountthatwouldhavebeendetermined,netofdepreciationoramortisation,ifnoimpairmentlosshadbeenrecognised.
(d) Provisions
Aprovisionisrecognisedif,asaresultofapastevent,theCompanyhasapresentlegalorconstructiveobligationthatcanbeestimatedreliably,anditisprobablethatanoutflowofeconomicbenefitswillberequiredtosettletheobligation.Provisionsaredeterminedbydiscountingtheexpectedfuturecashflowsatapre-taxratethatreflectscurrentmarketassessmentsofthetimevalueofmoneyandtherisksspecifictotheliability.Theunwindingofthediscountisrecognisedasfinancecost.
40 Ceylon Investment PLC | Annual Report 2013/14
(i) Contingent liabilities and contingent assets
Acontingentliabilityisapossibleobligationthatarisesfrompasteventswhoseexistencewillbeconfirmedbytheoccurrenceornon-occurrenceofoneormoreuncertainfutureeventsbeyondthecontroloftheCompanyorapresentobligationthatisnotrecognizedbecauseitisnotprobablethatanoutflowofresourceswillberequiredtosettletheobligation.
Acontingentliabilityalsoarisesinextremelyrarecaseswherethereisaliabilitythatcannotberecognizedbecauseitcannotbemeasuredreliably.TheCompanydoesnotrecognizeacontingentliabilitybutdisclosesitsexistenceinthefinancialstatements.
Acontingentassetisapossibleassetthatarisesfrompasteventswhoseexistencewillbeconfirmedbytheoccurrenceornon-occurrenceofoneormoreuncertainfutureeventsbeyondthecontroloftheCompany.TheCompanydoesnotrecognizecontingentassetsbutdisclosesitsexistencewhereinflowsofeconomicbenefitsareprobable,butnotvirtuallycertain.
(e) Revenue
RevenueisrecognizedtotheextentthatitisprobablethattheeconomicbenefitswillflowtotheCompany,andtherevenueandassociatedcostsincurredortobeincurredcanbereliablymeasured.Revenueismeasuredatthefairvalueoftheconsiderationreceivedorreceivable,netoftradediscountsandsalestaxes.
Thefollowingspecificcriteriaareusedforthepurposeofrecognitionofrevenue;
(i) Dividend Income
DividendincomeisrecognisedinprofitorlossonthedatethattheCompany’srighttoreceivepaymentisestablished,whichinthecaseofquotedsecuritiesisnormallytheex-dividenddate.
(ii) Gain on disposal of financial assets (categorized as available for sale / fair value through profit or loss)
ProfitsorlossesondisposalofinvestmentsareaccountedforintheStatementofIncomeonthebasisofrealizednetprofit.
(iii) Interest income
Interestincomecomprisestheamountsearnedonfundsinvested(includingavailable-for-salefinancialassets),andisrecognisedasitaccruesinprofitorloss,usingtheeffectiveinterestmethod.
(iv) Other income
Onaccrualbasis.
(f) Expenditure Recognition
(i) Operating Expenses
Allexpensesincurredinday-to-dayoperationsofthebusinessandinmaintainingtheproperty,plant&equipmentinastateofefficiencyhasbeenchargedtorevenueinarrivingattheprofitorlossfortheyear.Provisionhasalsobeenmadeforbadanddoubtfuldebts,allknownliabilitiesanddepreciationonproperty,plant&equipment.
(ii) Finance income and finance costs
Financecostscompriseinterestexpenseonborrowings,unwindingofthediscountonprovisionsanddeferredconsideration,dividendsonpreferencesharesclassifiedasliabilities,contingentconsideration,lossesonhedginginstrumentsthat
arerecognisedinprofitorlossandreclassificationsofnetlossespreviouslyrecognisedinothercomprehensiveincome.
Borrowingcoststhatarenotdirectlyattributabletotheacquisition,constructionorproductionofaqualifyingassetarerecognisedinprofitorlossusingtheeffectiveinterestmethod.
Foreigncurrencygainsandlossesonfinancialassetsandfinancialliabilitiesarereportedonanetbasisaseitherfinanceincomeorfinancecostdependingonwhetherforeigncurrencymovementsareinanetgainornetlossposition.
(g) Fee and commission expenses
Feeandcommissionexpensesarerecognizedinprofitorlosswhentherelatedservicesareperformed.
(h) Income tax expense
IncomeTaxexpensecomprisescurrenttaxanddefferedtax.Currenttaxisrecognisedinprofitorothercomprehensiveincome.
(i) Current taxation
Currenttaxistheexpectedtaxpayableorreceivableonthetaxableincomeorlossfortheyear,usingtaxratesenactedorsubstantivelyenactedatthereportingdate,andanyadjustmenttotaxpayableinrespectofpreviousyears.Currenttaxpayablealsoincludesanytaxliabilityarisingfromthedeclarationofdividends.
(ii) Tax exposures
Indeterminingtheamountofcurrentanddeferredtax,theCompanytakesintoaccounttheimpactofuncertaintaxpositionsandwhetheradditionaltaxesandinterestmaybedue.Thisassessmentreliesonestimatesandassumptions
Notes to the Financial Statements

Ceylon Investment PLC | Annual Report 2013/14 | 41
andmayinvolveaseriesofjudgementsaboutfutureevents.NewinformationmaybecomeavailablethatcausestheCompanytochangeitsjudgementregardingtheadequacyofexistingtaxliabilities;suchchangestotaxliabilitieswillimpacttaxexpenseintheperiodthatsuchadeterminationismade.
(iii) Economic Service Charge (ESC)
AspertheprovisionsofEconomicServiceChargeActNo.13of2006andamendmentsthereto,ispayableon“LiableTurnover”andisdeductiblefromtheincometaxpayments.AnyunclaimedESCcanbecarriedforwardandsettledagainsttheincometaxpayableinthefoursubsequentyears.
4. Earnings per share TheCompanypresentsbasicearningsper
share(EPS)dataforitsordinaryshares.BasicEPSiscalculatedbydividingtheprofitorlossattributabletoordinaryshareholdersoftheCompanybytheweightedaveragenumberofordinarysharesoutstandingduringtheperiod.
5. Related party transactions Disclosurehasbeenmadeinrespect
ofthetransactionsinwhichonepartyhastheabilitytocontrolorexercisesignificantinfluenceoverthefinancialandoperatingpoliciesdecisionsoftheother,irrespectiveofwhetherapriceischarged.
6. Events after the Reporting Period
AllmaterialandimportanteventswhichoccurafterthereportingdatehavebeenconsideredanddisclosedinNote26.
7. Dividends on ordinary Shares Dividendsonordinarysharesare
recognizedasaliabilityanddeducted
fromequitywhentheyareapprovedbytheCompany’sshareholders.InterimdividendsaredeductedfromequitywhentheyaredeclaredandarenolongeratthediscretionoftheCompany.
8. Presentation Assetsandliabilitiesaregroupedby
natureandlistedinanorderthatreflectstheirrelativeliquidityandmaturitypattern.
Whereappropriate,thesignificantaccountingpoliciesaredisclosedinthesucceedingNotes.
(i) Off setting Income and Expenses
Incomeandexpensesarenotoffsetunlessrequiredorpermittedbyaccountingstandards.
(ii) Off setting Assets and Liabilities
Assetsandliabilitiesareoffsetandthenetamountreportedinthestatementoffinancialpositiononlywherethereis;
• acurrentenforceablelegalrighttooffsettheassetandtheliability;and
• anintentiontosettletheliabilitysimultaneously
9. Determination of Fair Values Anumberofthecompany’saccounting
policiesanddisclosuresrequirethedeterminationoffairvalue,forbothfinancialandnon-financialassetsandliabilities.Fairvalueshavebeendeterminedformeasurementand/ordisclosurepurposesbasedonthefollowingmethods.Whereapplicable,furtherinformationabouttheassumptionsmadeindeterminingfairvaluesisdisclosedinthenotesspecifictothatassetorliability.
Whenmeasuringthefairvalueofanassetoraliability,theCompanyusesmarketobservabledataasfaraspossible.Fairvaluesarecategorizedintodifferentlevelsinafairvaluehierarchybasedontheinputsusedinthevaluationtechniquesasfollows;
• Level1-Inputthatarequotedmarketprices(unadjusted)inactivemarketsforidentifiableassetsandliabilities
• Level2-InputsotherthanquotedpricesincludedinLevel1thatareobservablefromtheassetorliabilityeitherdirectly(asprices)orindirectly(derivedprices)
• Level3–Inputsfromtheassetorliabilitythatarenotbasedonobservablemarketdata(unobservableinputs)Thiscategoryincludesallfinancialinstrumentsforwhichthevaluationtechniquesincludeinputsnotbasedonobservabledataandunobservableinputshavesignificanteffectontheinstrument’svaluation.
Iftheinputsusedtomeasurethefairvalueofanassetoraliabilitymightbecategorizedindifferentlevelsofthefairvaluehierarchy,thenthefairvaluemeasurementiscategorizedinitsentiretyinthesamelevelofthefairvaluehierarchyasthelowestlevelinputthatissignificanttotheentiremeasurement.
(a) Equity and debt securities
Thefairvaluesofinvestmentsinequityanddebtsecuritiesaredeterminedwithreferencetotheirquotedclosingbidpriceatthemeasurementdate,orifunquoted,determinedusingavaluationtechnique.Valuationtechniquesemployedincludemarketmultiplesanddiscountedcashflowanalysisusingexpectedfuturecashflowsandamarket-relateddiscountrate.

42 Ceylon Investment PLC | Annual Report 2013/14
Subsequenttoinitialrecognition,thefairvaluesofheld-to-maturityinvestmentsaredeterminedfordisclosurepurposesonly.
(b) Trade and other receivables
Thefairvaluesoftradeandotherreceivablesareestimatedatthepresentvalueoffuturecashflows,discountedatthemarketrateofinterestatthemeasurementdate.Short-termreceivableswithnostatedinterestratearemeasuredattheoriginalinvoiceamountiftheeffectofdiscountingisimmaterial.Fairvalueisdeterminedatinitialrecognitionand,fordisclosurepurposes,ateachannualreportingdate.
(c) Other non-derivative financial liabilities
Othernon-derivativefinancialliabilitiesaremeasuredatfairvalue,atinitialrecognitionandfordisclosurepurposes,ateachannualreportingdate.
Directors’ responsibility
TheBoardofDirectorsisresponsibleforthepreparationandpresentationoftheFinancialStatements.ThisismorefullydescribedundertherelevantclauseintheDirectors’Report.
10. New Accounting Standards issued but not effective as at reporting date
TheInstituteofCharteredAccountantsofSriLankahasissuedthefollowingnewSriLankaAccountingStandardswhichhavebecomeapplicableforfinancialperiodsbeginningonorafter1stJanuary2014.
Accordingly,theseStandardshavenotbeenappliedinpreparingthesefinancialstatements.
• SriLankaAccountingStandards–SLFRS10“Consolidatedfinancialstatements”
TheobjectiveofthisSLFRSistoestablishprinciplesforthepresentationandpreparationofconsolidatedfinancialstatementswhenanentitycontrolsoneormoreotherentities.
Aninvestorisexpectedtocontrolaninvesteeifandonlyiftheinvestorhasallthefollowing;
(a)powerovertheinvestee;
(b)exposure,orrights,tovariablereturnsfromitsinvolvementwiththeinvestee;and
(c) Theabilitytouseitspowerovertheinvesteetoaffecttheamountoftheinvestor’sreturns
AdoptionofthisstandardsisnotexpectedtohaveanydirectimpactontheCompany.however,theremaybeanindirectimpactviaparentcompaniesgroupstructure.
TheCompanyisintheprocessofassessingtheindirectimpact.
SLFRS10hasbecomeeffectivefrom1April2014
• SriLankaAccountingStandards–SLFRS11“JointArrangements”
TheobjectiveofthisSLFRSistoestablishprinciplesforfinancialreportingbyentitiesthathaveaninterestinarrangementsthatarecontrolledjointly(iejointarrangements).
SLFRS11hasbecomeeffectivefrom1April2014.However,thisstandardwillnotbeapplicabletotheCompany,unlessthereisachangetothestructure.
Notes to the Financial Statements
• SriLankaAccountingStandard-SLFRS12”DisclosureofInterestsinOtherEntities”
TheobjectiveofthisSLFRSistorequireanentitytodiscloseinformationthatenablesusersofitsFinancialStatementstoevaluatethenatureof,andrisksassociatedwithitsinterestsinotherentitiesofthoseinterestsinotherentities;andtheeffectofthoseinterestsonitsfinancialposition,financialperformanceandcashflows.
SLFRS12hasbecomeeffectivefrom1April2014.
• SriLankaAccountingStandard-SLFRS13,“FairValueMeasurement”
ThisSLFRSdefinesfairvalue,setsoutinasingleSLFRSaframeworkformeasuringfairvalue;andrequiresdisclosuresaboutfairvaluemeasurements.
ThisSLFRShasbecomeeffectivefortheGroupfrom1April2014.
• SriLankaAccountingStandard–SLFRS9“FinancialInstruments”
TheobjectiveofthisSLFRSistoestablishprinciplesforthefinancialreportingoffinancialassetsandfinancialliabilitiesthatwillpresentrelevantandusefulinformationtousersoffinancialstatementsfortheirassessmentoftheamounts,timinganduncertaintyofanentity’sfuturecashflows.
AnentityshallapplythisSLFRStoallitemswithinthescopeofLKAS39FinancialInstruments:RecognitionandMeasurement.
Theeffectivedateofthisstandardhasbeendeferred.

Ceylon Investment PLC | Annual Report 2013/14 | 43
11. Revenue For the year ended 31st March 2014 2013 Netgainfromdisposaloffairvaluethroughprofitorlossfinancialassets 19,603 10,661
Netgainfromdisposalofavailableforsalefinancialassets(note11.1) 304,297 271,978
Dividendincome 252,761 134,591
Interestincome 115,046 72,180
691,707 489,410
Dividendreceivedfromequityaccountedinvestees (194,928) (43,433)
496,779 445,977
11.1. Net gain from disposal of available for sale financial assets Proceedsfromdisposalofavailableforsalefinancialassets 661,555 615,431
Carryingvalueofavailableforsalefinancialassetsdisposed (611,019) (552,964)
Transferofrealizedgainsonavailableforsalefinancialassets 253,761 209,511
304,297 271,978
12. Profit from operations Profitfromoperationsisstatedafterchargingallexpensesincludingthefollowingexpenses:
Directors’fees 2,100 2,100
Supportservicefees 9,341 5,387
Auditors’remunerationandexpenses
-Auditfees 307 275
-Auditrelatedfees 65 63
-Non-auditfees - 187
13. Net finance expense Interestondebtsandborrowings 1,629 -
Exchangelosses 7 10
Net finance expense 1,636 10

44 Ceylon Investment PLC | Annual Report 2013/14
Notes to the Financial Statements
14. Share of profit of equity accounted investees net of tax Revenue Net profit for the year Company share of profit net of tax
For the year ended 31st March 2014 2013 2014 2013 2014 2013
RubberInvestmentTrustLimited 925,618 663,376 1,471,848 1,477,853 726,501 728,539
925,618 663,376 1,471,848 1,477,853 726,501 728,539
15. Income tax expense For the year ended 31st March 2014 2013
Provisionfortheyear(note15.1) 30,098 18,606
Overprovisionforpreviousyears (39) (3)
30,059 18,603
15.1. Reconciliation of accounting profit and taxable profits For the year ended 31st March 2014 2013
Profitbeforetaxation 1,182,416 1,200,571
Less:shareofprofitofequityaccountedinvestees (726,501) (728,539)
Dividendincome(excludingdividendreceivedfromassociatecompany) (57,833) (91,158)
Exemptnetprofitonsaleofquotedpublicshares (323,900) (282,639)
Netchangeinfairvalueoffairvaluethroughprofitorlossfinancialassets(note21B) (303) (52,667)
Disallowableexpenses 2,945 650
Expensesattributabletoexemptprofits 30,671 20,233
Adjusted profit for tax purposes 107,495 66,451
Less:Utilizationofbroughtforwardtaxlosses(Note15.2(iii)) - -
Taxable income 107,495 66,451
Income tax charged thereon
Incometaxexpensefortheyear(Note15.2(i)) 30,098 18,606
InRupeesThousands

Ceylon Investment PLC | Annual Report 2013/14 | 45
15.2. Current taxation on profitsi) InaccordancewiththeprovisionsoftheInlandRevenueAct,No.10of2006andamendmentsthereto,theCompanyisliabletoincometaxat28%
(2013-28%).
ii) IntermsofSection13(t)ofInlandRevenueAct,No.10of2006andamendmentsthereto,profitsderivedonthesaleofsharesonwhichShareTransactionLevy(STL)hasbeenpaidisexemptfromincometax.
iii) Utilizationofbroughtforwardtaxlossesisrestrictedto35%ofcurrentyear’sStatutoryIncome.Unabsorbedtaxlossescanbecarriedforwardindefinitely.
16. Earnings per share TheCompany'sbasicearningspershareiscalculatedontheprofitattributabletotheshareholdersofCeylonInvestmentPLCovertheweighted
averagenumberofordinarysharesoutstandingduringtheyear,asrequiredbySriLankaAccountingStandard(LKAS33)-"Earningspershare".
Thefollowingreflectstheearningandsharedatausedforthecomputationofearningspershare:
For the year ended 31st March 2014 2013
Amount used as the numerator Profitfortheyear 1,152,357 1,181,968 Amount used as denominator Weightedaveragenumberofordinarysharesoutstandingduringtheyear 98,514,874 98,514,874 Earnings per share ( Rs.) 11.70 12.00
17. Dividend For the year ended 31st March 2014 2013
Dividend paid Firstandfinaldividend 172,401 123,144
Proposed/interim dividend
Interim/finaldividend 246,287 172,401
Dividendpershare 2.50 1.75

46 Ceylon Investment PLC | Annual Report 2013/14
Notes to the Financial Statements
18. Investment in equity accounted investees18.a. Investment in equity accounted investees (unquoted) No. of Cost Fair value No. of Cost Fair value shares as at as at shares as at as at 31st March 31st March 31st March 31st March 2014 2014 2013 2013
RubberInvestmentTrustLimited 3,948,445 296 7,893,941 3,948,445 296 9,179,749
Total Investment in equity accounted investees 3,948,445 296 7,893,941 3,948,445 296 9,179,749
18.b. Movements in investment in equity accounted investees Holding Carrying Value Fair value Holding Carrying value Fair value % as at as at % as at as at 31st March 31st March 31st March 31st March 2014 2014 2013 2013
Investors’ share of net assets Atthebeginningoftheyear 49.95 5,023,797 - 49.95 4,501,481 -
Shareofprofitofequityaccountedinvesteesnetoftax 726,501 - 728,539 -
Shareofothercomprehensiveexpensesofequity accountedinvesteesnetoftax (816,768) - (162,790) -
Dividendincome (194,928) - (43,433) -
At the end of the year 4,738,602 - 5,023,797 -
Total investment in equity accounted investees on equity method (18.a and 18.b) 4,738,898 7,893,941 5,024,093 9,179,749
ThefairvaluationofRubberInvestmentTrustLimited(RITL)isbasedonthenetassetvalueofRITLafteradjustingforthefairvalueofitsinvestmentportfolio.
18.c. Summarized financial information of associate Total assets Total liabilities As at 31st March 2014 2013 2014 2013
RubberInvestmentTrustLimited 9,669,427 10,204,781 40,978 4,817
9,669,427 10,204,781 40,978 4,817
InRupeesThousands

Ceylon Investment PLC | Annual Report 2013/14 | 47
19. Available for sale financial assets19.a. Summary Note Cost Fair value Cost Fair value as at as at as at as at 31st March 31st March 31st March 31st March 2014 2014 2013 2013
Investments in equity securities Quoted 19.1 1,862,382 2,333,412 1,213,614 1,834,874
Unquoted 19.2 973 973 543 543
Privateequity 19.3 - - 133,877 191,031
Totalinvestmentsinequitysecurities 1,863,355 2,334,385 1,348,034 2,026,448
Investments in unit trusts Unlisted 19.4 162,280 185,939 162,280 183,826
Totalinvestmentsinunittrusts 162,280 185,939 162,280 183,826
Investments in debentures Unquoted 19.5 1 1 1 1
Totalinvestmentsindebentures 1 1 1 1
Total investment in available for sale financial assets 2,025,636 2,520,325 1,510,315 2,210,275
Note - ThefairvalueoftheCompany’slistedequityportfolioisbasedonthevolumeweightedaveragepriceasat31stMarch,publishedbytheColombo
StockExchange.
- Thefairvalueofinvestmentinunittrustsarebasedon"netassetsvalues"publishedbythecustodianbankandthemanagementcompanyasat31stMarch.
- Thefairvalueofinvestmentinprivateequityarearrivedatbasedonvaluationtechniquessuchasforecastedcashflowprojections,netassetvaluation,earningsbasedvaluationorexpectedrealizablevaluesinanarm’slengthtransactionasappropriate.

48 Ceylon Investment PLC | Annual Report 2013/14
19.b. Movement in available for sale financial Assets As at Additions Disposals Change in As at 1st April fair value 31st March 2013 2014
Investments in equity securities 2,026,448 882,626 (611,019) 36,330 2,334,385
Investments in unit trusts 183,826 - - 2,113 185,939
Investments in debentures 1 - - - 1
2,210,275 882,626 (611,019) 38,443 2,520,325
As at Additions Disposals Change in As at 1st April fair value 31st March 2012 2013
Investmentsinequitysecurities 2,053,416 275,240 (552,964) 250,756 2,026,448
Investmentsinunittrusts 164,125 - - 19,701 183,826
Investmentsindebentures 1 - - - 1
2,217,542 275,240 (552,964) 270,457 2,210,275
Thechangeinfairvaluerepresentsthenetunrealizedgains/(losses)onfairvalueadjustmentofinvestmentportfoliosincludinganyadjustmentonimpairmentlosses.
Sincethereisnosignificant/prolongeddeclineinfairvalueofinvestmentinequitysecuritiesbelowitscost,noimpairmentlosshasbeenrecognisedinthestatementofcomprehensiveincomefortheyear(2013–Nil)asrequiredbyLKAS–39“FinancialInstruments;recognitionandmeasurement”.LKAS–39alsorequirestorecognisefairvaluegainsandlossesarisingfromassetsclassifiedasavailableforsale,otherthanimpairmentlosses,inothercomprehensiveincome.Accordingly,gainsofRs.32.9mnandRs.273.2mnhavebeenrecognisedinfinancialyears2014and2013respectively.
Notes to the Financial Statements
InRupeesThousands

Ceylon Investment PLC | Annual Report 2013/14 | 49
19.1. Investments in equity securities - quoted No. of Cost Fair value No. of Cost Fair value shares as at as at shares as at as at 31st March 31st March 31st March 31st March 2014 2014 2013 2013
Banks, Finance & Insurance CentralFinanceCompanyPLC 915,969 162,580 165,790 668,698 116,679 120,366
CommercialBankofCeylonPLC 4,751,486 314,705 584,432 6,682,396 442,595 755,111
SampathBankPLC 1,478,367 342,450 269,211 707,023 210,325 159,009
NationsTrustBankPLC 2,542,368 155,330 165,000 - - -
Peoples’Leasing&FinancePLC 7,902,045 138,946 112,999 6,954,891 125,188 91,109
1,114,011 1,297,432 894,787 1,125,595
Diversified AitkenSpencePLC 1,674,000 168,425 163,885 - - -
JohnKeellsHoldingsPLC 1,366,896 82,277 310,285 1,610,641 68,500 397,828
JohnKeellsHoldingsPLC-Warrants2015 82,600 - 5,666 - - -
JohnKeellsHoldingsPLC-Warrants2016 82,600 - 5,939 - - -
HemasHoldingsPLC 802,116 27,069 30,240 - - -
277,771 516,015 68,500 397,828
Health Care AsiriSurgicalHospitalsPLC - - - 7,465,290 75,951 85,104
CeylonHospitalsPLC 813,378 45,742 93,538 813,378 45,742 81,338
45,742 93,538 121,693 166,442
Hotels & Travels AitkenSpenceHotelHoldingsPLC 1,959,575 128,634 137,170 1,959,575 128,634 145,009
128,634 137,170 128,634 145,009
Telecommunication DialogAxiataPLC 28,629,514 264,781 257,666 - - -
264,781 257,666 - -
Motors Diesel&MotorEngineeringPLC 62,556 31,443 31,591 - - -
31,443 31,591 - -
Totalinvestmentsinequitysecurities-Quoted 1,862,382 2,333,412 1,213,614 1,834,874
ThefairvalueoftheCompany’sinvestmentportfolioisbasedonVolumeWeightedAveragepriceasat31stMarch,publishedbytheColomboStockExchange.

50 Ceylon Investment PLC | Annual Report 2013/14
19. Available for sale financial assets (contd.)19.2. Investments in equity securities - unquoted No. of Cost Fair value No. of Cost Fair value shares as at as at shares as at as at 31st March 31st March 31st March 31st March 2014 2014 2013 2013
GuardianFundManagementLimited 7 - - 7 - -
KandyPrivateHospitalsLimited 600 10 10 600 10 10
DFCCVardhanaBank 55,253 963 963 42,975 533 533
Totalinvestmentsinequitysecurities-Unquoted 973 973 543 543
19.3. Investments in equity securities - Private equity (unlisted) No. of Cost Fair value No. of Cost Fair value shares as at as at shares as at as at 31st March 31st March 31st March 31st March 2014 2014 2013 2013
DurdansMedical&SurgicalHospital
(Private)Limited - - - 10,612,858 133,877 191,031
Totalinvestmentsinequitysecurities-
Privateequity(unlisted) - - - 133,877 191,031
Total investment in equity securities 1,863,355 2,334,385 1,348,034 2,026,448
19.4. Investments in unit trusts - unlisted No. of Cost Fair value No. of Cost Fair value units as at as at units as at as at 31st March 31st March 31st March 31st March 2014 2014 2013 2013
TheSriLankaFund 1,265,823 112,280 125,688 1,265,823 112,280 126,876
GuardianAcuityEquityFund 1,250,000 12,500 15,438 1,250,000 12,500 14,350
GuardianAcuityFixedIncomeFund 3,750,000 37,500 44,813 3,750,000 37,500 42,600
162,280 185,939 162,280 183,826
19.5. Investments in debentures - unlisted No. of Cost Fair value No. of Cost Fair value debentures as at as at debentures as at as at 31st March 31st March 31st March 31st March 2014 2014 2013 2013
Redeemable unsecured debentures OceanViewLimited-6% 120 1 1 120 1 1
Totalinvestmentsindebentures-unquoted 1 1 1 1
Notes to the Financial Statements
InRupeesThousands

Ceylon Investment PLC | Annual Report 2013/14 | 51
20. Trade and other receivables As at 31st March 2014 2013
Financial Tradereceivable 4,555 28,052
Dividendreceivable 2,422 20,703
6,977 48,755
Non financial Prepaidexpenses 50 214
50 214
7,027 48,969
21. Fair value through profit or loss financial assets21.a. Summary Note Fair value Fair value as at as at 31st March 31st March 2014 2013
Investment in equity securities Quoted 21.1 644,802 503,630
TotalInvestmentinequitysecurities 644,802 503,630
ThefairvalueoftheCompany’slistedequityportfolioisbasedonthevolumeweightedaveragepriceasat31stMarch,publishedbytheColomboStockExchange.
21.b. Movement in fair value through profit or loss financial assets Fair value Additions Disposals Change in Fair value as at fair value as at 1st April 31st March 2013 2014
Investmentinequitysecurities 503,630 626,147 (485,278) 303 644,802
503,630 626,147 (485,278) 303 644,802
Fair value Additions Disposals Change in Fair value as at fair value as at 1st April 31st March 2012 2013
Investmentinequitysecurities 456,395 369,493 (374,925) 52,667 503,630
456,395 369,493 (374,925) 52,667 503,630
Thechangeinfairvaluerepresentunrealizedgains/(losses)onfairvalueadjustmentofinvestmentportfolio.

52 Ceylon Investment PLC | Annual Report 2013/14
21.1. Investments in equity securities - Quoted No. of Fair value No. of Fair value shares as at shares as at 31st March 31st March 2014 2013 Banks, Finance and Insurance CommercialBankofCeylonPLC 270,000 33,210 706,284 79,810
DevelopmentFinanceCorporationofCeylonPLC 100,200 14,419 - -
HattonNationalBankPLC 265,000 39,750 - -
HattonNationalBankPLC-NonVoting 100,000 12,000 - -
NationalDevelopmentBankPLC 395,078 70,561 350,000 58,555
169,940 138,365
Beverage, Food and Tobacco CeylonTobaccoCompanyPLC 22,827 24,105 24,827 19,382
DistilleriesCompanyofSriLankaPLC 277,896 56,413 1,026,002 170,831
80,518 190,213
Construction and Engineering AccessEngineeringPLC 350,000 7,875 - -
7,875 -
Diversified AitkenSpencePLC 510,000 49,929 - -
ExpolankaHoldingsPLC 1,772,669 15,422 - -
HemasHoldingsPLC 633,600 23,887 - -
JohnKeellsHoldingsPLC 286,221 64,972 - -
JohnKeellsHoldingsPLC-Warrants2015 333,300 22,864 - -
JohnKeellsWarrantsHoldingsPLC-2016 755,000 54,285 - -
TradeFinanceandInvestmentsPLC 136,600 2,554 594,188 146,764
233,913 146,764
Health Care TheLankaHospitalCorporationPLC 473,000 19,677 - -
19,677 -
Hotels and Travels SerendibHotelsPLC-NonVoting 66,296 1,240 - -
1,240 -
Land and Property OverseasRealty(Ceylon)PLC 600,000 12,300 291,423 8,888
12,300 8,888
Notes to the Financial Statements
InRupeesThousands

Ceylon Investment PLC | Annual Report 2013/14 | 53
21.1. Investments in equity securities - quoted No. of Fair value No. of Fair value shares As at shares As at 31st March 31st March 2014 2013 Manufacturing KelaniTyresPLC 300,000 15,660 - -
PiramalLankaGlassCompanyPLC - - - -
RoyalCeramicsLankaPLC 250,000 19,825 2,000,000 12,200
35,485 12,200
Power and Energy LankaIOCPLC 1,110,000 42,735 - -
LaugfsGASPLC 185,200 6,019 - -
48,754 -
Telecommunications
DialogAxiataPLC 3,900,000 35,100 800,000 7,200
35,100 7,200
Total Fair value through profit or loss financial assets- Quoted 644,802 503,630
22. Cash and cash equivalents As at 31st March 2014 2013
Cashatbank 2,009 14,952
Placementswithbankinginstitutions 599,052 759,042
Investmentsunderrepurchaseagreements 208,133 188,427
Totalcashandcashequivalents 809,194 962,421
Bankoverdraft (2,697) (446)
(2,697) (446)
Net cash and cash equivalents for the purpose of cash flow statement 806,497 961,975

54 Ceylon Investment PLC | Annual Report 2013/14
23. Stated capital As at 31st March 2014 2013 No. of Value No. of Value of shares shares
Ordinary shares Issuedandfullypaid 98,514,874 673,530 98,514,874 673,530
673,530 673,530
24. Capital and revenue reserve24.1. Capital reserves As at 31st March Note 2014 2013
Investmentreserve 24.1.1 8,401 8,401
Othercapitalreserve 24.1.1 178,740 178,740
Associatecompany’scapitalreserve 24.1.3 1,521,992 2,338,760
1,709,133 2,525,901
24.1.1.Investment reserve and other capital reserve TheseamountshavebeenreservedforuseinfuturedevelopmentoftheCompany.
24.1.2.Associate company’s capital reserve Shareofassociatecompany’scapitalreserveincludestheinvestor’sshareofothercomprehensiveincomeoftheassociatecompanyafterthedateof
acquisition.
24.2. Revenue reserves As at 31st March Note 2014 2013
Fairvaluethroughprofitorlossfinancialassetsreserve 24.2.1 14,526 43,436
Availableforsalefinancialassetsreserve 24.2.2 622,393 837,711
Generalreserve 24.2.3 27,217 27,217
Retainedearnings 5,378,573 4,615,994
6,042,709 5,524,358
24.2.1.Fair value through profit or loss financial assets reserve Anygainsarisingfromfairvalueadjustmentwillbetransferredfromretainedearningsto"Fairvaluethroughprofitorlossfinancialassetsreserve"
atthereportingdateandanyunrealisedgains/lossesarisingwillbetransferredfrom"Fairvaluethroughprofitorlossfinancialassetsreserve"toretainedearningstotheextentthatlossdoesnotexceedthebalanceheldinthesaidreserveasatthedate.
AnamountofRs.28.9mnwastransferredfrom(2013-Rs.43.4mnwastransferredto)"Fairvaluethroughprofitorlossfinancialassetsreserve"resultingfromthechangeinfairvalueofFairvaluethroughprofitorlossfinancialassetasshownintheStatementofChangesinEquity.
Notes to the Financial Statements
InRupeesThousands

Ceylon Investment PLC | Annual Report 2013/14 | 55
24.2.2.Available for sale financial assets reserve Thisconsistsofnetunrealisedgains/(losses)arisingfromchangeinthefairvalueofavailableforsalefinancialassetsexcludingcumulative
impairmentslossesincurredasatthereportingdate,ifany.
24.2.3. General reserve TheserepresentstheamountssetasidebytheDirectorstomeetanycontingencies.
25. Trade and other payables As at 31st March 2014 2013
Financial Tradepayables 9,000 -
Dividendpayable(note25.1) 246,286 -
Otherpayables 19,203 16,681
274,489 16,681
Non Financial Provisionsandaccruals 1,893 1,756
1,893 1,756
276,382 18,437
25.1. Amounts due to related entities
DividendpayableincludesdividendpayabletorelatedentityCeylonGuardianInvestmentTrustPLC,amountingtoRs.158.5mn(2013-Nil).
26. Events after the reporting date Subsequenttothereportingperiod,nocircumstanceshavearisenwhichwouldrequireadjustmentstoordisclosureinthefinancialstatements.
27. Commitments and contingencies27.1. Capital expenditure commitments Therewerenomaterialcapitalcommitmentsasatthereportingdate.
27.2. Contingencies Therewerenomaterialcontingentliabilitiesasatthereportingdate.

56 Ceylon Investment PLC | Annual Report 2013/14
28. Related party transactions TheCompanycarriedouttransactionsintheordinarycourseofitsbusinesswithpartieswhoaredefinedasrelatedpartiesinSriLankaAccounting
Standard(LKAS24)-“RelatedPartyDisclosures”,thedetailsofwhicharereportedbelow.
28.1. Parent and ultimate controlling party CeylonGuardianInvestmentTrustPLCistheparentcompanyofCeylonInvestmentPLC.IntheopinionoftheDirectors,CarsonCumberbatchPLCis
theultimateparentcompanyofCeylonInvestmentPLC.
28.2. Transactions with Key Management Personnel (KMP) AccordingtoSriLankaAccountingStandard(LKAS24)-“RelatedPartyDisclosures”,KeyManagementPersonnel(KMP)arethosehavingauthority
andresponsibilityforplanningandcontrollingtheactivitiesoftheentity.Accordingly,theDirectorsoftheCompanyanditsparentcompany(includingexecutiveandnon-executivedirectors)andtheirimmediatefamilymembershavebeenclassifiedasKeyManagementPersonneloftheCompany.
NotransactionhavetakenplacebetweentheCompanyanditsKMPduringtheyear,exceptasdisclosedbelow.
28.3. Key management personnel compensation comprised the following; For the Year ended 31 st March 2014 2013
Short-termemployeebenefits 2,100 2,100
Post-employmentbenefits - -
Terminationbenefits - -
Otherlong-termbenefits - -
Noncashbenefits - -
2,100 2,100
28.4. Transactions with Related Companies
Name of the related company Name/s of the common Director/s
Nature of transactions Value of the transaction
2014 2013
Parent company
CeylonGuardianInvestmentTrustPLC I.Paulraj Dividendpaid 267,474 79,259
D.C.R.Gunawardena
Mrs.M.A.R.C.Cooray
A.deZ.Gunasekera
V.M.Fernando
K.Selvanathan
InRupeesThousands
Notes to the Financial Statements

Ceylon Investment PLC | Annual Report 2013/14 | 57
Name of the related company Name/s of the common Director/s
Nature of transactions Value of the transaction
2014 2013
Associate
RubberInvestmentTrustLimited I.Paulraj Dividendsreceived 194,926 43,433
D.C.R.Gunawardena
A.P.Weeratunge
Fellow subsidiaries
GuardianFundManagementLimited(GFM)
K.Selvanathan Portfoliomanagementfeespaid 16,501 11,619
A.P.Weeratunge
"CarsonsManagementServices(Private)Limited
A.P.Weeratunge Supportservicefeespaid 9,341 5,387
K.Selvanathan Computerfeespaid 420 420
Secretarialfeespaid 300 300
Other entities
HattonNationalBankPLC Mrs.M.A.R.C.Cooray Interestincomereceived - 21,096
R.Theagarajah* Placementindemanddeposits 831 831
TheCompanyasatthereportingdatecarriesanapprovedinter-changeableshort-termborrowingfacilitywithCeylonGuardianInvestmentTrustPLC,theparentcompany,tothevalueofRs.300/-mn(2013-Rs.300mn)
*Mr.R.TheagarajahisaDirectorofCarsonCumberbatchPLC,theultimateentityofCeylonInvestmentPLC,andwastheCEO/MDofHattonNationalBankPLCduringthefinancialyear.
Amountsduetorelatedentitiesaredisclosedinnote25.1.
28.5. Significant Holdings Holding % 2014 2013
Associate
RubberInvestmentTrustLimited 49.95% 49.95%

58 Ceylon Investment PLC | Annual Report 2013/14
29. Financial instruments Financial risk management - overview TheCompanyhasexposuretothefollowingrisksarisingfromfinancialinstruments:
Creditrisk
Liquidityrisk
Marketrisk
ThisnotepresentsinformationabouttheCompany’sexposuretoeachoftheaboverisks,theCompany’sobjectives,policiesandprocessesformeasuringandmanagingrisk,andtheCompany’smanagementofcapital.Pages14to17alsoincludeareviewofrisksfacedbytheCompanyandtheapproachofmanagingsuchrisks.
Risk management framework TheCompany’sBoardofDirectorshasoverallresponsibilityfortheestablishmentandoversightoftheCompany’sriskmanagementframework.
TheBoardofDirectorshasdelegatedthisfunctiontotheChiefExecutiveOfficerofGuardianFundManagementLimited,theFundManagers,andCarsonsManagementServices(Private)Limited,theManagers;whoareresponsiblefordevelopingandmonitoringtheGroup’sriskmanagementpoliciesandreportsregularlytotheBoardofDirectorsonitsactivities.
TheCompany’sriskmanagementpoliciesareestablishedtoidentifyandanalysetherisksfacedbytheCompany,tosetappropriaterisklimitsandcontrols,andtomonitorrisksandadherencetolimits.Riskmanagementpolicies,andsystemsarereviewedregularlytoreflectchangesinmarketconditionsandtheCompany’sactivities.
Thecompany’sinvestmentportfoliocompriseslistedandunlistedequitysecurities.Thecompany’sinvestmentmanagerhasbeengivendiscretionaryauthoritytomanagetheassetinlinewiththecompany’sinvestmentobjectives.
Further,anInvestmentCommitteedrawnfromacrosstheCarsonsGroupdirectorateprovideadviceandinsightstothefundmanagementteamtofurthersharpenandrefinetheirdecisionmakingprocess.ThiscomprehensivemanagementstructuredeterminestheobjectivesandpoliciesoftheCompany’sriskmanagementframeworkandpromotesacultureofriskawarenessandbalancedrisk-takingwithintheCompany.
29.1. Credit risk CreditriskistheriskoffinanciallosstotheCompany,ifacustomeroracounterpartytoafinancialinstrumentoranobligedpartytoareceivable
failstomeetitscontractualobligationsandarisesprimarilyontheCompany’sinvestmentsinfixedincomeearningsecurities,placementswithbankinginstitutionsandreceivablesfrommarketintermediariesandothercounterparties,theCompanyhasdealingswith.
29.1.1. Credit risk exposure and managing the risk Thecarryingamountoffinancialassetsrepresentsthemaximumcreditexposure.Themaximumexposuretocreditriskattheendofthereporting
periodwasasfollows.
Carrying Amount As at 31st March Note 2014 2013
Availableforsalefinancialassets-debentures 19.5 1 1
Availableforsalefinancialassets-Investmentinunittrusts 19.4 185,939 183,826
Tradeandotherreceivables(financial) 20 6,977 48,755
Cashandcashequivalents-Cashatbank 22 2,009 14,952
Cashandcashequivalents-Placementswithbankinginstitutions 22 599,052 759,042
Cashandcashequivalents-Investmentsunderrepurchaseagreements 22 208,133 188,427
1,002,111 1,195,003
Notes to the Financial Statements
InRupeesThousands

Ceylon Investment PLC | Annual Report 2013/14 | 59
Available for sale financial assets Debentures Theserepresentsinvestmentindebentures,whichyieldsinterestincomeonacontinuingbasis.HowevertheCompany'sexposuretocreditrisk,
arisingfromtheseinvestmentsisinsignificant,consideringthenetinvestmentvalue.
Investment in unit trusts TheCompanyhasinvestedinthreeunittrusts;TheSriLankaFund,GuardianAcuityEquityFundandGuardianAcuityFixedIncomeFund.TheGroup
hasinfusedpromoterscapitaltoeachofthesefundsandthemanagementoftheunderlyingfundsrestswiththeGroup'sinvestmentmanagementarm;GuardianFundManagementLimited.
Eachoftheseinvestmentsarecarriedattheirfairvalues;beingthenetassetvalueofthefundateachreportingdate.Thefundscarryamixofequityandfixedincomeearninginstrumentsatagivenpointintime,withdueconsiderationonliquidity,whichwillenabletorealizeitscarryingvalueswithaminimumlossinvalue.Further,thesefundsareregulatedinsuchawaythatthefundcarryadequateassetsinhighlyliquidform,generally5%ofthenetassetsvalue,whichwillensurecustomerwithdrawalsaresettledpromptly.
AdueevaluationprocesshasbeencarriedoutbytheCompanypriortotheseinvestments,whichincludedanassessmentintotheirabilitytorepay,intheeventtheCompanywishestowithdraw.
Trade and other receivables Asignificantportionofthetradeandotherreceivablecompriseofproceedsreceivableondisposalofquotedsecuritiesanddividendsreceivable.
Settlementproceduressurroundingtheequitymarketsarehighlystructuredandregulated.AT+3settlementcycleisinplacewiththeinvolvementofacustodianbank,whichisbeingdulymonitoredbytheregulator,henceprovidesassuranceontherealizationofthebalances.Further,adueevaluationprocess,includingacontinuousassessmentmechanismisinplaceinselectingthemarketintermediariesthattheCompanytransactswith,whichinvolvespriorapprovalfromtheBoardofDirectors.
Dividendreceivableisaccountedforwhentherighttoreceivethedividendisestablished.Thebalancesaresettledwithinamaximumperiodof4-6weeksandnoriskofdefault,basedonpastexperienceintheindustry.
Age profile of trade and other receivables Theagingoftradeandotherreceivablesattheendofthereportingperiodthatwerenotimpairedwasasfollows
As at 31st March 2014 2013
Lessthan30days 6,977 48,755
6,977 48,755
TheCompanyhasneitherrecognizedanimpairmentlossnoraallowanceforimpairmentofitstradeandotherreceivablesoverthepast5yearsperiod.
Cash and cash equivalents TheCompanyheldcashandequivalentsintheformofshorttermfixeddeposits,Repoinvestmentsanddemanddepositswithbanks/financials
institutioncounterparties.HencetheCompanyisexposedtotheriskthatsuchcounterpartiesfailingmeettothecontractualobligation.

60 Ceylon Investment PLC | Annual Report 2013/14
TheCompanyminimizethecreditriskbymonitoringthecreditworthinessofthecounterpartiesperiodically.
Ananalysisofbanking/financialinstitutionalcounterpartieswithwhomthebalanceswereheldateachreportingperiodendispresentedbelow.
As at 31st March 2014 2013
Creditrating
AAA 240 240
AA+ 238,205 947,470
AA 208,133 831
AA- 361,679 -
Unrated 937 13,880
809,194 962,421
29.2. Liquidity risk LiquidityriskistheriskthattheCompanyencountersdifficultyinmeetingtheobligationsassociatedwithitsfinancialliabilitiesthatarerequiredto
besettledbydeliveringcashand/oranotherfinancialasset.
29.2.1.Exposure to liquidity risk Thefollowingarethecontractualmaturitiesattheendofthereportingperiodarisingonfinancialliabilities.
Contractual cash flows As at 31st March 2014 Carrying up to 3 3-12 More than amount Total months months a year Non derivative financial liabilities
Tradeandotherpayables 274,489 274,489 274,489 - -
Bankoverdrafts 2,697 2,697 2,697 - -
277,186 277,186 277,186 - -
Contractual cash flows As at 31st March 2013 Carrying up to 3 3-12 More than amount Total months months a year Non derivative financial liabilities
Tradeandotherpayables 16,681 16,681 16,681 - -
Bankoverdrafts 446 446 446
17,127 17,127 17,127 - -
Theratioofnetassetswithaveryshorterexpectedliquidationperiod(liquidassets)tototalnetassetsissetoutbelow.
As at 31st March 2014 2013
Totalliquidassets 210,142 203,379
Liquidassetsasa%oftotalnetassets 2% 2%
Notes to the Financial Statements
InRupeesThousands

Ceylon Investment PLC | Annual Report 2013/14 | 61
29.2.2.Management of liquidity risk TheCompany’sapproachtomanagingliquidityistoensure,asfaraspossible,thatitwillalwayshavesufficientliquiditytomeetitsliabilitieswhen
due,underbothnormalandstressedconditions,withoutincurringunacceptablelossesorriskingdamagetotheCompany’sreputation.
TheCompanymaintainsaportionofitsassetsinhighlyliquidform;demanddepositsandplacementsinrepurchaseagreementsinordertocapitalizeontheopportunitiesarisinginvolatilemarketconditionsandtomeetitscontractualobligationsduringthenormalcourseofitsoperations.
AsignificantportionoftheCompany’sinvestmentportfoliocompriseslistedequityinvestmentswhichprovidestheCompanywithexposuretoadequateliquidity,giventheabilitytoconvertintocashandcashequivalentswithinaveryshortperiodoftime.
Inaddition,theCompanyhasaccesstoapprovedfinancingarrangementsintheformofaninter-changebleoverdraftfacilitywithCeylonGuardianInvestmentTrustPLC,theparentcompany,ananalysisofwhichasateachofthereportingdatesaregivenbelow.
As at 31st March 2014 2013
Unutilisedshorttermcreditfacilities 1,050,000 1,050,000
1,050,000 1,050,000
29.3. Market risk "Themarketriskisexposuretoadversemovementsinthesecuritymarketsforbothequityandfixedincomeinvestments,whichcanresult
variationsintheanticipatedreturnsfromthosesecurities.Allfinancialinstitutionsfacemarketrisks,createdbychangesinthemacroenvironmentrelatedtopoliticalfactors,nationalsecurity,economicmanagementandglobalizationinfluenceswhichhaveanimpactonsystematicrisk."
29.3.1.Interest rate risk TheCompanyisexposedtointerestraterisk,arisingfromitsplacementswithbankinginstitutions,investmentsunderrepurchaseagreementand
short-termfinancingfacilities,intheeventsuchhavebeenutilized.
Profile Attheendofthereportingperiod,theinterestrateprofileoftheCompany’sinterest-bearingfinancialinstrumentsareasfollows.
Carrying Amount As at 31st March 2014 2013
Financial assets Placementswithbankinginstitutions 599,052 759,042
Investmentsunderrepurchaseagreements 208,133 188,427
807,185 947,469
Financial liabilities
Bankoverdrafts 2,697 446
2,697 446

62 Ceylon Investment PLC | Annual Report 2013/14
Theaveragebaseinterestratesappliedfortheabovefinancialinstrumentsareasfollows;
Carrying Amount As at 31st March 2014 2013
CommercialBanksAveragedWeightedPrimeLendingRate(AWPLR)* 8.81% 13.86%
CommercialBanksAveragedWeightedFixedDepositRate(AWFDR)* 10.47% 13.94%
*Monthlyaveragerate
Sensitivity Analysis Achangeof1%ininterestratesattheendofthereportingperiodwouldhaveincreased/(decreased)profitorlossbytheamountsshownbelow.
Profit or loss Movement in interest rate Increase in 1% Decrease in 1%
As at 31 March 2014 -Oninterestearningassets 8,072 (8,072)
-Oninterestbearingliabilities (27) 27
8,045 (8,045)
As at 31 March 2013
-Oninterestearningassets 9,475 (9,475)
-Oninterestbearingliabilities (4) 4
9,471 (9,471)
29.3.2. Other market price risks Equity price risk TheCompanyitselfbeinganinvestmenthouse,wheretheprincipalactivitybeingtoactasspecializedinvestmentvehicletoundertake,among
others;listedandprivateequityinvestments,accordinglytheCompanyisexposedtoequitypricerisk,havingasubstantialportionof80%(2013–74%)ofitsdiscretionaryinvestmentportfoliodesignatedaslistedinvestmentsintheColomboStockExchangeandprivateequityinvestments,marketvolatilitiesbringinsubstantialvolatilitytotheCompany'searningsandvalueofitsassetbaseasatthereportingdate.
Listed equity investments ManagementoftheCompanymonitorsthemixofdebtandequitysecuritiesinitsinvestmentportfoliobasedonmarketindices,wheredecisions
concernedwiththetimingofbuy/selldecisionsarewellsupportedwithstructuredin-houseresearchrecommendations.TransactionsofamajormagnitudearesubjecttoreviewandapprovalbytheInvestmentCommittee.
Private equity investments Dueevaluationsarecarriedoutbefore-hand,extendingtobothfinancialandoperationalfeasibilityoftheprivateequityprojectsthattheCompany
venturesinto,withaviewtoascertaintheCompany’sinvestmentdecisionandtherisksinvolved.
"Continuousmonitoringoftheoperationsagainstthebudgetsandtheindustrystandardsensurethattheprojectsmeetthedesiredoutcome,andtherebythereturns.Further,theCompanygenerallycarriesinvestmentagreementswiththepartiesconcerned,whichcarryspecific‘exitclauses’toprivateequityprojects-typicallyan‘InitialPublicOffering’ora‘Buy-out’ataspecifiedpriceagreed,whichprovidescovertoacertainextentagainstmovementsinmarketconditions."
Notes to the Financial Statements
InRupeesThousands

Ceylon Investment PLC | Annual Report 2013/14 | 63
Carrying Amount As at 31st March 2014 2013
Availableforsalefinancialassets 19 2,520,325 2,210,275
Fairvaluethroughprofitorlossfinancialassets 21 644,802 503,630
3,165,127 2,713,905
AbroadanalysisoftheinvestmentsmadebytheCompany,basedontheindustry/sectorisgiveninnotes19.1and21.1.
29.3.3. Currency risk TheCompanyisexposedtocurrencyriskonitsinvestmentsmadethataredenominatedinacurrencyotherthantherespectivefunctionalcurrencies
oftheCompany,primarilytheSriLankaRupee.Accordingly,theCompanyisexposedtocurrencyriskprimarilyarisingfromitsinvestmentin‘TheSriLankaFund’–acountryfundincorporatedinCaymansIslands,towhichtheCompanyhasinfusedpromoterscapital.
Thenetexposuretocurrencyrisk,asatthereportingdateisasfollows.
Carrying Amount As at 31st March Currency 2014 2013
InvestmentsinUnitTrusts-TheSriLankaFund LKR(000') 125,688 126,876
InvestmentsinUnitTrusts-TheSriLankaFund USD 961,432 1,012,497
Exchangeratesappliedasatthereportingdates-USD/LKR 130.73 125.31
Sensitivity analysis Astrengthening/(weakening)oftheUSDagainsttheSriLankaRupeewouldhaveincreased/(decreased)theequityasattheendoftheperiod
bytheamountsshownbelow.Theanalysisassumesthatallothervariables,inparticularinterestrates,remainconstantandignoresanyimpactoffurtherinvestmentsorwithdrawals.
Noimpacttoprofitorlossarisesfromamovementintheforeignexchangerates,providedsuchmovementsinvalueof'Availableforsalefinancialassets'resultingfromamovementinforeignexchangerates.Suchmovementsarerequiredtoberecognisedinothercomprehensiveincome,asprovidedforinSriLankaAccountingStandard(LKAS-39-"FinancialInstruments;Recognitionandmeasurement".
Equity Movement in exchange rate Strengthening Weakening
As at 31 March 2014 -UnitedStateDollars(1%movement) (1,257) 1,257
(1,257) 1,257
As at 31 March 2013 -UnitedStateDollars(1%movement) (1,269) 1,269
(1,269) 1,269

64 Ceylon Investment PLC | Annual Report 2013/14
29.4. Accounting classification and fair values Thefairvaluesoffinancialassetsandliabilitiestogetherwiththerespectivecarryingamountsasshowninthestatementoffinancialpositionareas
follows.
As at 31st March 2014 Fair value Held to Loans and Available Other Total Fair through maturity receivables for sale financial carrying value profit or loss liabilities amount
Assets Availableforsalefinancialassets - - - 2,520,325 - 2,520,325 2,520,325
Tradeandotherreceivables - - 6,977 - - 6,977 6,977
Fairvaluethroughprofitorlossfinancialassets 644,802 - - - - 644,802 644,802
Cashandcashequivalents - - 809,194 - - 809,194 809,194
Totalfinancialassets 644,802 - 816,171 2,520,325 - 3,981,298 3,981,298
Liabilities Tradeandotherpayables - - - - 274,489 274,489 274,489
Bankoverdraft 2,697 2,697 2,697
Totalfinancialliabilities - - - - 277,186 277,186 277,186
As at 31st March 2013 Fair value Held to Loans and Available Other Total Fair through maturity receivables for sale financial carrying value profit or loss liabilities amount
Assets Available-for-salefinancialassets - - - 2,210,275 - 2,210,275 2,210,275
Tradeandotherreceivables - - 48,755 - - 48,755 48,755
Fairvaluethroughprofitorlossfinancialassets 503,630 - - - - 503,630 503,630
Cashandcashequivalents - - 962,421 - - 962,421 962,421
Totalfinancialassets 503,630 - 1,011,176 2,210,275 - 3,725,081 3,725,081
Liabilities
Tradeandotherpayables - - - - 16,681 16,681 16,681
Bankoverdraft 446 446 446
Totalfinancialliabilities - - - - 17,127 17,127 17,127
Fair value hierarchy Thetablebelowanalysesfinancialinstrumentscarriedatfairvalue,bythelevelsinthefairvaluehierarchy.Thedifferentlevelshavebeendefinedas
follows.
Level1:Availabilityofquotedprices(unadjusted)inactivemarketsforidenticalassetsorliabilities.
Level2:Useofinputsotherthanquotedpricesthatareobservablefortheassetorliability,eitherdirectly(i.e.asprices)orindirectly(i.e.derivedprices).
Level3:Useofinputsfortheassetorliabilitythatarenotbasedonobservablemarketdata(unobservableinputs).
Notes to the Financial Statements
InRupeesThousands
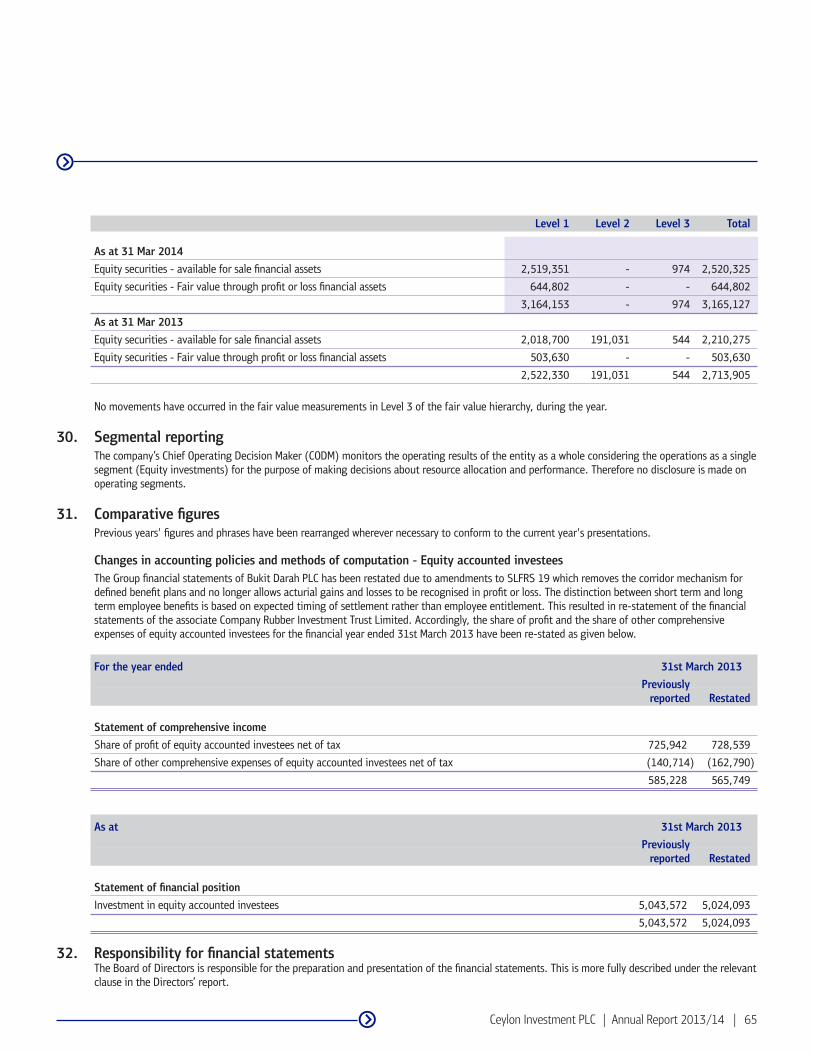
Ceylon Investment PLC | Annual Report 2013/14 | 65
Level 1 Level 2 Level 3 Total
As at 31 Mar 2014
Equitysecurities-availableforsalefinancialassets 2,519,351 - 974 2,520,325
Equitysecurities-Fairvaluethroughprofitorlossfinancialassets 644,802 - - 644,802
3,164,153 - 974 3,165,127
As at 31 Mar 2013 Equitysecurities-availableforsalefinancialassets 2,018,700 191,031 544 2,210,275
Equitysecurities-Fairvaluethroughprofitorlossfinancialassets 503,630 - - 503,630
2,522,330 191,031 544 2,713,905
NomovementshaveoccurredinthefairvaluemeasurementsinLevel3ofthefairvaluehierarchy,duringtheyear.
30. Segmental reporting Thecompany’sChiefOperatingDecisionMaker(CODM)monitorstheoperatingresultsoftheentityasawholeconsideringtheoperationsasasingle
segment(Equityinvestments)forthepurposeofmakingdecisionsaboutresourceallocationandperformance.Thereforenodisclosureismadeonoperatingsegments.
31. Comparative figures
Previousyears'figuresandphraseshavebeenrearrangedwherevernecessarytoconformtothecurrentyear'spresentations.
Changes in accounting policies and methods of computation - Equity accounted investees TheGroupfinancialstatementsofBukitDarahPLChasbeenrestatedduetoamendmentstoSLFRS19whichremovesthecorridormechanismfor
definedbenefitplansandnolongerallowsacturialgainsandlossestoberecognisedinprofitorloss.Thedistinctionbetweenshorttermandlongtermemployeebenefitsisbasedonexpectedtimingofsettlementratherthanemployeeentitlement.Thisresultedinre-statementofthefinancialstatementsoftheassociateCompanyRubberInvestmentTrustLimited.Accordingly,theshareofprofitandtheshareofothercomprehensiveexpensesofequityaccountedinvesteesforthefinancialyearended31stMarch2013havebeenre-statedasgivenbelow.
For the year ended 31st March 2013 Previously reported Restated
Statement of comprehensive income Shareofprofitofequityaccountedinvesteesnetoftax 725,942 728,539
Shareofothercomprehensiveexpensesofequityaccountedinvesteesnetoftax (140,714) (162,790)
585,228 565,749
As at 31st March 2013 Previously reported Restated
Statement of financial position Investmentinequityaccountedinvestees 5,043,572 5,024,093
5,043,572 5,024,093
32. Responsibility for financial statements TheBoardofDirectorsisresponsibleforthepreparationandpresentationofthefinancialstatements.Thisismorefullydescribedundertherelevant
clauseintheDirectors’report.

66 Ceylon Investment PLC | Annual Report 2013/14
SLFRS/LKAS SLAS For the year ended/ As at 31st March 2014 2013 2012 2011 2010
Financial highlights
Revenue
Netgainondisposalofinvestments 323,900 282,639 671,129 556,884 830,849
Dividendincome 252,761 134,591 129,763 80,394 129,052
Interestincome 115,046 72,180 36,126 11,303 61,403
691,707 489,410 837,018 648,581 1,021,304
Less:
Dividendreceivedfromassociatecompany (194,928) (43,433) (40,970) (25,193) (92,460)
Salesproceedonsalere-purchasebyassociatecompany - - - - (348,392)
496,779 445,977 796,048 623,388 580,452
Fairvalueadjustment-unrealized 303 52,667 (322,893) 112,410 84,788
Profit on investment activities 497,082 498,644 473,155 735,798 665,240
Profit before taxation 1,182,416 1,200,571 1,087,196 1,341,057 1,002,992
Incometaxexpenses (30,059) (18,603) (6,129) (434) (14,109)
Profit for the year 1,152,357 1,181,968 1,081,067 1,340,623 988,883
Dividendpaid 418,688 123,144 98,515 129,421 169,020
Statement of financial position
Capital employed
Statedcapital 673,530 673,530 673,530 673,530 506,074
Reserves 7,751,842 8,050,259 7,093,279 6,994,586 4,242,443
Total equity 8,425,372 8,723,789 7,766,809 7,668,116 4,748,517
Assets employed
Investments 7,259,223 7,234,368 6,719,319 7,169,723 4,366,021
Currentassets 1,461,023 1,515,020 1,065,141 713,597 424,201
8,720,246 8,749,388 7,784,460 7,883,320 4,790,222
Current liabilities (294,874) (25,599) (17,651) (215,204) (41,705)
Net assets 8,425,372 8,723,789 7,766,809 7,668,116 4,748,517
Statement of Cash Flow
Netcashgeneratedfrom/(usedin)operatingactivities 16,037 492,886 882,207 (86,241) 314,216
Netcashusedinfinancingactivities (171,515) (122,305) (96,272) (125,720) (1,078,203)
Net (decrease)/increase in cash & cash equivalents (155,478) 370,581 785,935 (211,961) (763,987)
Five year summaryInRupeesThousands

Ceylon Investment PLC | Annual Report 2013/14 | 67
SLFRS/LKAS SLAS For the year ended / As at 31st March 2014 2013 2012 2011 2010
Ratios & statistics
Operational ratio
Returnonordinaryshareholdersfunds(%) 13.47 13.55 13.91 17.48 20.83
Liquidity ratio
Currentratio(Times) 4.95 59.18 60.34 3.32 10.17
Investor ratio
Earningspershare(adjusted)(Rs.) 11.70 12.00 10.97 13.61 9.72
Dividendpershareproposed/Interim(Rs.)** 2.50 1.75 1.25 1.00 6.70
Dividendcover(times) 4.68 6.84 8.78 13.61 1.45
Dividendgrowth(%) 43 40 25 (85) (4)
Dividendyield(%) 3.36 2.19 1.60 0.66 2.47
Dividendpayoutratio(%) 21.37 14.62 11.39 7.35 68.90
Netassetspershare-bookvalue(Rs.) 85.52 88.55 78.84 77.84 245.83
Netassetspershare-marketvalue(Rs.) 117.55 130.74 139.03 180.61 340.86
Marketvaluepershare(Rs.)* 74.50 80.00 78.30 151.00 271.00
Priceearningratio(times) 6.37 6.67 7.14 11.10 27.88
Pricetobookvalueratio(times) 0.87 0.90 0.99 1.94 1.10
Fairvalueofinvestments(Rs.) 11,865,565 12,855,629 13,697,271 17,797,997 6,602,416
Marketcapitalisation(Rs.000') 7,339,358 7,881,190 7,713,715 14,875,746 5,234,810
AllSharePriceIndex(points) 5,968 5,736 5,420 7,226 3,725
S&PSL20Index(points) 3,280 3,294 2,986 3,893 2,142
*Asat31stMarch.
**Basedonproposed/interimdividends.

68 Ceylon Investment PLC | Annual Report 2013/14
For the year ended 31st March 2014 2013 Change (%)
Revenue 3,818,146 3,441,712 11
Profitfromoperations 3,516,647 3,642,862 (3)
Shareofprofitofequityaccountedinvesteesnetoftax 5,583,745 5,622,311 (1)
Profitbeforetaxation 9,087,818 9,265,096 (2)
Profitfortheyear 8,856,790 9,121,532 (3)
Totalothercomprehensiveexpensefortheyear (7,932,410) (785,955) 909
Totalcomprehensiveincomefortheyear 924,380 8,335,577 (89)
Netcashgeneratedfromoperatingactivities 123,259 3,803,708 (97)
Totalequity 64,448,649 68,772,479 (6)
Returnonordinaryshareholders'funds(%) 13.74 13.26 7
Earningspershare(USD) 0.09 0.09 -
Dividendpershare(USD)* 0.02 0.01 100
Netassetspershare-Bookvalue 0.65 0.70 (6)
Netassetspershare-Marketvalue 0.90 1.03 (13)
CeylonInvestmentPLC-Fundvalue** 90,763,902 101,345,124 (10)
Marketcapitalization(Company) 56,141,346 62,129,996 (10)
*Basedonproposed/interimdividends
**Basedonfairvalueofportfolioafteradjustingforcashandcashequivalents
Financial Highlights - US $ FinancialsInUnitedStateDollars

Ceylon Investment PLC | Annual Report 2013/14 | 69
Statement of Comprehensive IncomeInUnitedStateDollars
For the year ended 31st March 2014 2013
Revenue 3,818,146 3,441,712
Netchangeinfairvalueoffairvaluethroughprofitorlossfinancialassets 2,329 406,444
Profit on investment activities 3,820,475 3,848,156
Administrativeandotheroperatingexpenses (303,828) (205,294)
Profit from operations 3,516,647 3,642,862
Netfinanceincomeexpense (12,574) (77)
Profit from operations after net finance expenses 3,504,073 3,642,785
Shareofprofitofequityaccountedinvesteesnetoftax 5,583,745 5,622,311
Profit before taxation 9,087,818 9,265,096
Incometaxexpenses (231,028) (143,564)
Profit for the year 8,856,790 9,121,532
Other comprehensive income
Shareofothercomprehensiveexpensesofequityaccountedinvesteesnetoftax (6,277,519) (1,256,290)
Netchangeinfairvalueofavailableforsalefinancialassets 253,286 2,108,713
Transferofrealizedgainsonavailableforsalefinancialassets (1,950,357) (1,616,847)
Foreigncurrencydifferencesarisingontranslationofavailableforsalefinancialassets 42,180 (21,531)
Total other comprehensive expense for the year (7,932,410) (785,955)
Total comprehensive income for the year 924,380 8,335,577
Earnings per share (USD) 0.09 0.09
Dividend per share (USD)* 0.02 0.01
*Dividendpershareisbasedontheproposed/interimdividends.

70 Ceylon Investment PLC | Annual Report 2013/14
InUnitedStatesDollars
As at 31st March 2014 2013
ASSETS
Non-Current Assets
Investmentinequityaccountedinvestees 36,249,507 39,606,567
Availableforsalefinancialassets 19,278,857 17,424,320
Total non-current assets 55,528,364 57,030,887
Current Assets
Tradeandotherreceivables 53,752 386,039
Fairvaluethroughprofitorlossfinancialassets 4,932,319 3,970,280
Cashandcashequivalents 6,189,811 7,587,079
Total current assets 11,175,882 11,943,398
Total assets 66,704,246 68,974,285
EQUITY AND LIABILITIES
Equity
Statedcapital 5,868,428 5,868,428
Capitalreserves 16,828,339 23,105,935
Revenuereserves 41,751,882 39,798,116
Total equity 64,448,649 68,772,479
Current Liabilities
Trade&otherpayables 2,114,145 145,346
Currenttaxpayable 120,822 52,944
Bankoverdraft 20,630 3,516
Totalcurrentliabilities 2,255,597 201,806
Total liabilities 2,255,597 201,806
Total equity and liabilities 66,704,246 68,974,285
Net assets per share - Book value (USD) 0.65 0.70
Net assets per share - Market value (USD) 0.90 1.03
Statement of Financial Position

Ceylon Investment PLC | Annual Report 2013/14 | 71
SLFRS/LKAS SLAS For the year ended/ As at 31st March 2014 2013 2012 2011 2010
Financial highlights Revenue Netgainondisposalofinvestments 2,489,431 2,181,186 5,982,608 5,071,372 7,231,691 Dividendincome 1,942,672 1,038,668 1,156,739 699,748 1,123,266 Interestincome 884,221 557,029 322,036 98,381 534,450 5,316,324 3,776,883 7,461,383 5,869,501 8,889,407 Less: Dividendreceivedfromassociatecompany (1,498,178) (335,171) (365,216) (219,288) (804,770) Salesproceedonsalere-purchasebyassociatecompany - - - - (3,032,396) 3,818,146 3,441,712 7,096,167 5,650,213 5,052,241 Fairvalueadjustment-unrealized 2,329 406,444 (2,878,348) 1,018,853 737,993 Profit on investment activities 3,820,475 3,848,156 4,217,819 6,669,066 5,790,234 Profit before taxation 9,087,818 9,265,096 9,691,531 12,154,963 10,490,302 Incometaxexpenses (231,028) (143,564) (54,635) (3,934) (3,934) Profit for the year 8,856,790 9,121,532 9,636,896 12,151,029 10,486,368 Dividendpaid 1,892,915 1,330,460 961,308 892,911 1,126,482 Statement of financial position Capital employed Statedcapital 5,868,428 5,868,428 5,868,428 5,868,428 4,374,019 Reserves 58,580,221 62,904,051 54,762,399 63,589,144 37,250,429
Total equity 64,448,649 68,772,479 60,630,827 69,457,572 41,624,448 Assets employed Investments 55,528,364 57,030,887 52,453,701 64,943,134 38,271,573 CurrentAssets 11,175,882 11,943,398 8,314,918 6,463,741 3,749,790 66,704,246 68,974,285 60,768,619 71,406,875 42,021,363 Current liabilities (2,255,597) (201,806) (137,792) (1,949,303) (396,915) Net assets 64,448,649 68,772,479 60,630,827 69,457,572 41,624,448 Statement of cash flow Netcashgeneratedfrom/(usedin)fromoperatingactivities 123,259 3,803,708 7,822,376 (755,969) 2,734,929 Netcashusedinfinancingactivities (1,318,232) (943,854) (831,592) (1,102,034) (9,384,655) Net (decrease)/increase in cash & cash equivalents (1,194,973) 2,859,854 6,990,784 (1,858,003) (6,649,726)
Five year summaryInUnitedStateDollars

72 Ceylon Investment PLC | Annual Report 2013/14
RATIOS & STATISTICS For the year ended/As at 31st March 2014 2013 2012 2011 2010
Operating ratio Returnonordinaryshareholders'funds(%) 13.74 13.42 15.89 17.49 25.19 Liquidity ratio Currentratio(times) 4.95 59.18 60.34 3.32 9.45 Investor ratios Earningspershare 0.09 0.09 0.08 0.12 0.38 Netassetspershare-Bookvalue 0.65 0.70 0.62 0.71 2.15 Netassetspershare-Marketvalue 0.90 1.03 1.09 1.64 2.99 Marketcapitalization 56,141,346 62,129,996 60,216,354 134,744,076 45,887,184 Fairvalueofinvestments 90,763,902 101,345,124 106,926,394 162,975,888 57,876,275
Five year summary
InUnitedStateDollars

Ceylon Investment PLC | Annual Report 2013/14 | 73
1. Basis of conversion ThetranslationofSriLankanRupeeamountsintoUSDollaramountsissolelyfortheconvenienceoftheshareholders,investors,bankersandother
usersoffinancialstatements.
ThetranslationofthefinancialstatementsintoUSDollarwereeffectedbasedonthefollowingexchangerates.
2014 2013
Incomestatement-Averagerate 130.11 129.58
Monetaryassetsandliabilities-Closingrate 130.73 126.85
Non-monetaryassetsandliabilities-Closingrate 130.73 126.85
Ordinarysharecapital-Historicalrate
Gainsorlossesonconversionareaccountedforintherevenuereserve
2. Revenue reserve For the year ended 31st March 2014 2013 US $ US $
Beginningoftheyear 39,798,116 30,400,174
Netmovementduringtheyear 3,983,944 8,641,534
43,782,060 39,041,708
Currencyfluctuations (2,030,178) 756,408
Asattheendoftheyear 41,751,882 39,798,116
(AllfiguresareinUnitedstatesDollars)
Notes to the Financial Statements

74 Ceylon Investment PLC | Annual Report 2013/14
1. Stock Exchange Listing CeylonInvestmentPLCisapublicquotedcompany,theordinarysharesofwhicharelistedonthemainboardoftheColomboStockExchangeof
SriLanka.
StockExchangecodeforCeylonInvestmentPLCsharesis“CINV”.
2. Share valuation ThemarketpriceoftheCompany’ssharesasat31stMarch2014wasRs.74.50pershare(2013–Rs.80/-).
3. Ordinary shareholders As at 31st March 2014 2013
Numberofshareholders 2,338 2,442
Thenumberofsharesheldbynon-residentsasat31stMarch,2014was4,405,177whichamountsto4.47%(2013–4,060,531/4.12%).
Distribution of Shares
Residents Non-Residents Total
No. of share- holders
No. of Shares % No of share- holders
No. of Shares % No. of share- holders
No. of Shares
%
1 - 1,000 1,427 385,094 0.39 12 6,610 0.01 1,439 391,704 0.40
1001 - 10,000 613 2,142,496 2.17 23 112,299 0.11 636 2,254,795 2.28
10,001 - 100,000 170 5,260,500 5.34 28 844,567 0.86 198 6,105,067 6.20
100,001 - 1,000,000 52 17,328,593 17.59 07 1,517,695 1.54 59 18,846,288 19.13
Above1,000,000 05 68,993,014 70.04 01 1,924,006 1.95 06 70,917,020 71.99
Total 2,267 94,109,697 95.53 71 4,405,177 4.47 2,338 98,514,874 100.00
Categories of shareholders No. of shareholders No. of Shares %
Individuals 2,143 19,688,019 19.98
Institutions 195 78,826,855 80.02
Total 2,338 98,514,874 100.00
4. Market performance – ordinary shares For the year ended 31st March 2014 2013
Sharepriceasat31stMarch(Rs.) 74.50 80.00 Highest(Rs.) 102.00 115.00 Lowest(Rs.) 73.10 58.10 Valueofsharestraded(Rs.) 241,309,176 160,211,091 No.ofsharestraded 2,996,697 1,853,360 Volumeoftransactions(Nos.) 2,138 2,410 Marketcapitalization(Rs.’000) 7,339,358 7,881,190
Information to shareholders and investors

Ceylon Investment PLC | Annual Report 2013/14 | 75
5. Market capitalisation MarketcapitalisationoftheCompany,whichisthenumberofordinarysharesinissuemultipliedbythemarketvalueofanordinarysharewas
Rs.7,339,358,113/-asat31stMarch2014(asat31stMarch2013-Rs.7,881,189,920/-).
6. Record of Bonus Issues, Rights Issues, Repurchase and Subdivision of shares Theundermentionedshareissues/repurchasehavebeenmadebytheCompanytodate,inrelationtoitsordinaryshares:
Year ended 31st March
Month Issue Basis No. of Shares Cumulative No. of shares
1919 InitialCapital - 547,343 547,343
1954 Bonus 1:10 54,734 602,077
1956 Bonus 1:10 60,208 662,285
1988 Bonus 1:1 662,285 1,324,570
1991 Bonus 1:5 264,914 1,589,484
1999 Bonus 1:4 397,371 1,986,855
2000 Bonus 1:4 496,714 2,483,569
2002 April Rights 1:4 620,892 3,104,461
May Bonus 1:4 776,115 3,880,576
2003 June Rights 1:3 1,293,525 5,174,101
August Bonus 1:6 862,350 6,036,451
2004 July Rights 1:2 3,018,225 9,054,676
September Bonus 1:2 4,527,338 13,582,014
2005 March Rights 1:3 4,527,338 18,109,352
June Bonus 1:3 6,036,451 24,145,803
2009 October Repurchase 1:5 (4,829,161) 19,316,642
2010 October Subdivision 5:1 77,266,568 96,583,210
October Capitalizationofreserves 1:50 1,931,664 98,514,874
7. Dividends A1stInterimDividendofRs.2/50pershareforthefinancialyearended31stMarch2014,amountingtoRs.246,287,185/-wasdeclaredandpaid
on4thApril2014.
8. Public holding Thetotalpercentageofsharesheldbypublicasat31stMarch2014was35.19%(2013–35.64%).
9. Major Shareholders AlistofmajorshareholdersoftheCompanyasatthebalancesheetdateisprovidedintheAnnualReportoftheBoardofDirectorsonpage24.

76 Ceylon Investment PLC | Annual Report 2013/14
NOTICE IS HEREBY GIVENthattheSixtyEighthAnnualGeneralMeetingof CEYLON INVESTMENT PLCwillbeheldonWednesday,the30thdayofJuly2014at9.30a.m.atHiltonColombo,“GrandBallroom”,No.2,SirChittampalamA.GardinerMawatha,Colombo2forthefollowingpurposes:
1. ToreceiveandadopttheAnnualReportoftheBoardofDirectorsandtheFinancialStatementsfortheyearended31stMarch2014,togetherwiththeIndependentAuditors’Reportthereon.
2. Tore-electMrs.M.A.R.C.CooraywhoretiresbyrotationintermsofArticles89,90and91oftheArticlesofAssociationoftheCompany.
3. Tore-electMr.A.P.WeeratungewhoretiresbyrotationintermsofArticles89,90and91oftheArticlesofAssociationoftheCompany.
4. Tore-appointMr.I.PaulrajasaDirectoroftheCompanywhoisoverSeventyyearsofageandtoconsiderandifdeemedfittopassthefollowingresolution:
“ITISHEREBYRESOLVEDthattheagelimitstipulatedinSection210oftheCompaniesActNo.07of2007shallnotbeapplicabletoMr.I.Paulrajwhois77yearsofageandthathebere-appointedaDirectoroftheCompanyfromtheconclusionoftheAnnualGeneralMeetingforafurtherperiodofoneyear”.
5. Tore-appointMr.AdeZ.GunasekeraasaDirectoroftheCompanywhoisoverSeventyyearsofageandtoconsiderandifdeemedfittopassthefollowingresolution:
“ITISHEREBYRESOLVEDthattheagelimitstipulatedinSection210oftheCompaniesActNo.07of2007shallnotbeapplicabletoMr.A.deZ.Gunasekerawhois74yearsofageandthathebere-appointedaDirectoroftheCompanyfromtheconclusionoftheAnnualGeneralMeetingforafurtherperiodofoneyear”.
6. Tore-appointMessrs.KPMG,CharteredAccountantsasAuditorsoftheCompanyassetoutinSection154(1)oftheCompaniesActNo.07of2007andtoauthorizetheDirectorstodeterminetheirremuneration.
ByOrderoftheBoard
(Sgd.)K.D. De Silva (Mrs.)DirectorCARSONS MANAGEMENT SERVICES (PRIVATE) LIMITEDSecretaries
Colombo,25thJune2014
Notes:1. Amemberisentitledtoappointaproxytoattendandvoteinsteadofhim/herself.AproxyneednotbeamemberoftheCompany.AFormofProxy
accompaniesthisNotice.
2. ThecompletedFormofProxymustbedepositedattheRegisteredOffice,No.61,JanadhipathiMawatha,Colombo1,notlaterthan9.30a.m.on28thJuly2014.
3. ApersonrepresentingaCorporationisrequiredtocarryacertifiedcopyoftheresolutionauthorizinghim/hertoactastherepresentativeoftheCorporation.Arepresentativeneednotbeamember.
4. ThetransferbooksoftheCompanywillremainopen.
5. SecurityCheck- Weshallbeobligediftheshareholders/proxiesattendingtheAnnualGeneralMeeting,producetheirNationalIdentityCardtothesecuritypersonnel
stationedattheentrancelobby.
Notice of Meeting

Ceylon Investment PLC | Annual Report 2013/14 | 77
*I/We................................................................................................................................................................................................
of......................................................................................................................................................................................................
being*aMember/MembersofCeylonInvestmentPLCherebyappoint................................................................................................................
of.............................................................................................................................................................................................................
bearingNICNo./PassportNo.......................................................orfailinghim/her
IsraelPaulraj orfailinghim,DonChandimaRajakarunaGunawardena orfailinghim,AjithPrashanthaWeeratunge orfailinghim,MirihanaArachchigeRoseChandralathaCooray orfailingher,AsokadeZ.Gunasekera orfailinghim,VernonManilalFernando orfailinghim,KrishnaSelvanathan
as*my/ourproxytoattendatthe68thAnnualGeneralMeetingoftheCompanytobeheldonWednesday,the30thdayofJuly2014at9.30a.m.atHiltonColombo,“GrandBallroom”,No.2,SirChittampalamA.GardinerMawatha,Colombo2andatanyadjournmentthereofandateverypollwhichmaybetakeninconsequencethereof. For Against
(1)ToadopttheAnnualReportoftheBoardofDirectorsandtheFinancialStatementsfortheyearended31stMarch2014,togetherwiththeIndependentAuditors’Reportthereon.
(2)Tore-electMrs.M.A.R.C.CooraywhoretiresbyrotationintermsofArticles89,90and91oftheArticlesofAssociationoftheCompany.
(3)Tore-electMr.A.P.WeeratungewhoretiresbyrotationintermsofArticles89,90and91oftheArticlesofAssociationoftheCompany.
(4)Tore-appointMr.I.PaulrajwhoisoverSeventyyearsofageasaDirectoroftheCompany.
(5)Tore-appointMr.A.deZ.GunasekerawhoisoverSeventyyearsofageasaDirectoroftheCompany.
(6) Tore-appointMessrs.KPMG,CharteredAccountantsasAuditorsoftheCompanyassetoutinSection154(1)oftheCompaniesAct.No.07of2007andtoauthorizetheDirectorstodeterminetheirremuneration.
Signedthis...................................................dayof……………………TwoThousandandFourteen.
…………………………………. Signature/s
(a) *Pleasedeletetheinappropriatewords.(b) AshareholderentitledtoattendandvoteataGeneralMeetingoftheCompany,isentitledtoappointaproxytoattendandvoteinsteadofhim/her
andtheproxyneednotbeashareholderoftheCompany.AproxysoappointedshallhavetherighttovoteonashowofhandsoronapollandtospeakattheGeneralMeetingoftheshareholders.
(c) Ashareholderisnotentitledtoappointmorethanoneproxytoattendonthesameoccasion.(d) Instructionsarenotedonthereversehereof.
Form of Proxy

78 Ceylon Investment PLC | Annual Report 2013/14
Form of Proxy
INSTRUCTIONS AS TO COMPLETION1. Kindlyperfecttheformofproxyafterfillinginlegiblyyourfullnameandaddress,bysigninginthespaceprovided.Pleasefillinthedateofsignature.
2. IfyouwishtoappointapersonotherthantheDirectorsasyourproxy,pleaseinserttherelevantdetailsinthespaceprovidedoverleaf.
3. IntermsofArticle71oftheArticlesofAssociationoftheCompany:
Theinstrumentappointingaproxyshallbeinwritingand:
(i) inthecaseofanindividualshallbesignedbytheappointororbyhisattorney;and (ii) inthecaseofacorporationshallbeeitherunderitscommonsealorsignedbyitsattorneyorbyanofficeronbehalfofthecorporation.
TheCompanymay,butshallnotbeboundto,requireevidenceoftheauthorityofanysuchattorneyorofficer.AproxyneednotbeamemberoftheCompany.
4. IntermsofArticle66oftheArticlesofAssociationoftheCompany:
Inthecaseofjoint-holdersofashare,theseniorwhotendersavote,whetherinpersonorbyproxyorbyattorneyorbyrepresentative,shallbeacceptedtotheexclusionofthevotesoftheotherjoint-holdersandforthispurposeseniorityshallbedeterminedbytheorderinwhichthenamesstandsintheRegisterofmembersinrespectofthejointholding.
5. TobevalidthecompletedformofproxyshouldbedepositedattheRegisteredOfficeoftheCompanysituatedatNo.61,JanadhipathiMawatha,Colombo1notlaterthan9.30a.m.on28thJuly2014.
Pleasefillinthefollowingdetails:
Name : …………………………………………………………………………………………………………………………………………
Address : …………………………………………………………………………………………………………………………………………
…………………………………………………………………………………………………………………………………………
Jointlywith : …………………………………………………………………………………………………………………………………………
ShareFolioNo. : …………………………………………………………………………………………………………………………………………

Ceylon Investment PLC | Annual Report 2013/14 | 79
Note

80 Ceylon Investment PLC | Annual Report 2013/14


Ceylon Investment PLC | Annual Report 2013/14 | 1
Ceylon Investment PLC - PQ 68
ADDITIONAL INFORMATION TO SHAREHOLDERS
We are herewith circulating the portfolio of the company’s associate company, Rubber Investment Trust Limited. The investment in associate company is accounted in “Equity Method” of accounting in the company’s published financial statement as required by the Sri Lanka Accounting Standard - LKAS 28 “Investments in Associates”
INVESTMENT PORTFOLIO OF RUBBER INVESTMENT TRUST LIMITED
(Amounts expressed in Sri Lankan Rupee thousands)
2014 2013 Cost Fair Value Cost Fair Value as at as at as at as at Note Note 31st March 31st March 31st March
Investment in equity accounted investees 1 1,927 12,076,963 1,927 14,419,186
Available for sale financial assets 2 454,921 2,142,615 338,099 2,776,948
Fair value through profit or loss financial assets 3 - 404,923 - 296,136
456,848 14,624,501 340,026 17,492,270
1. Investment in equity accounted investees % Cost Fair value % Cost Fair value Holding as at as at Holding as at as at 31st March 31st March 31st March 31st March 2014 2014 2013 2013
Quoted Bukit Darah PLC 20.04% 1,927 12,076,963 20.04% 1,927 14,419,186
1,927 12,076,963 1,927 14,419,186
2. Availableforsalefinancialassets 2014 2013 No. of Cost Fair value No. of Cost Fair value Shares as at as at Shares as at as at 31st March 31st March 31st March 31st March
(A) Quoted Diversified John Keells Holdings PLC 9,122,814 453,955 2,070,879 11,240,529 337,563 2,776,412
John Keells Holdings Warrants - 2015 503,706 - 34,554 - - -
John Keells Holdings Warrants - 2016 503,706 - 36,216 - - -
453,955 2,141,649 337,563 2,776,412
Total investment in available for salefinancialassets-Quoted 453,955 2,141,649 337,563 2,776,412

2 | Ceylon Investment PLC | Annual Report 2013/14
2. Availableforsalefinancialassets(contd.) 2014 2013 No. of Cost Fair value No. of Cost Fair value Shares as at as at Shares as at as at 31st March 31st March 31st March 31st March
(B) Unquoted DFCC Vardhana Bank 55,253 963 963 42,975 533 533
963 963 533 533
Total investment in available forsalefinancialassets-Unquoted 963 963 533 533
(C)Investments in Debentures Redeemable unsecured Riverina Hotels Limited 56 1 1 56 1 1
Ocean View Limited - 6% 120 1 1 120 1 1
Total Investment in Debentures 2 2 2 2
(D) Preference Shares Bukit Darah PLC - 8% 31,875 1 1 31,875 1 1
Total Investment in Preference Shares 1 1 1 1
Total investment in available forsalefinancialassets 454,921 2,142,615 338,099 2,776,948

Ceylon Investment PLC | Annual Report 2013/14 | 3
3. Fairvaluethroughprofitorlossfinancialassets No.of Fairvalue No.of Fairvalue Shares as at Shares as at 31st March 31st March 2014 2013
Banks, Finance & Insurance Commercial Bank of Ceylon PLC 310,537 38,196 441,040 49,838
DFCC Bank PLC 113,124 16,278 - -
Hatton National Bank PLC 285,000 42,750 390,000 65,247
National Development Bank PLC 416,525 74,391 - -
Nations Trust Bank PLC 100,000 6,490 - -
People's Leasing & Finance PLC - - 180,688 2,367
178,105 117,452
Beverage, Food & Tobacco Ceylon Tobacco Company PLC 18,340 19,367 24,340 19,002
Distilleries Company of Sri Lanka PLC 121,278 24,619 393,644 65,542
43,986 84,544
Diversified Aitken Spence PLC 370,218 36,244 - -
Expolanka Holdings PLC 200,000 1,740 - -
Hemas Holdings PLC 634,488 23,920 - -
John Keells Holdings PLC 189,239 42,957 295,234 72,922
John Keells Holdings Warrants 2016 100,000 7,190 - -
112,051 72,922
Healthcare The Lanka Hospital Corporation PLC 60,000 2,496 - -
2,496 -
Hotels & Travels Aitken Spence Hotel Holdings PLC 200,577 14,040 200,577 14,843
Asian Hotels Botets & Travel Properties PLC 97,000 5,704 - -
19,744 14,843
Manufacturing Kelani Tyres PLC 179,849 9,388 - -
9,388 -

4 | Ceylon Investment PLC | Annual Report 2013/14
3 Fairvaluethroughprofitorlossfinancialassets(Contd.) No.of Fairvalue No.of Fairvalue Shares as at Shares as at 31st March 31st March 2014 2013
Power and Energy Lanka IOC PLC 600,000 23,100 - -
Laugfs Gas PLC 125,775 4,088 - -
27,188 -
Telecommunications Dialog Axiata PLC 1,329,448 11,965 750,000 6,375
11,965 6,375
Totalinvestmentinfairvaluethroughprofitorlossfinancialassets 404,923 296,136