CEYLO PETROLEUM CORPORATION - CEYPETCO –...
98
2014
Transcript of CEYLO PETROLEUM CORPORATION - CEYPETCO –...

2014


1
“ To be the premier customer driven, environmental friendly enterprise in the petroleum
and related industries in the region contributing towards the prosperity of our nation. ”
“ To achieve excellence in petroleum refining, sales and marketing of high quality
products through a loyal and efficient dealer network and by providing total solutions and
services exceeding customer expectations, while utilizing a high technology base for
growth and development of the enterprise by employee participation and innovation and
maintaining high ethical norms in all its activities with highest concern for health, safety
and environment and meet the expectations of the stakeholders. ”

2
1. Retain highest level of market share
2. Reach excellence in sales, marketing and operations to face a heavily
competitive environment
3. Maintain an economically viable refining sector
4. Improve and maintain high level of professionalism at all levels of employees
5. Institute structural changes to improve productivity and management
6. Institute health, safety and environmental friendly measures to exceed the
stipulated standards
7. Uphold the national and corporate social responsibilities for the betterment of
the community
8. Ensure financial viability of the Corporation
9. Retain Sri Lankan control in the petroleum downstream sector

3
NAME OF THE ENTITY
Ceylon Petroleum Corporation
LEGAL FORM
A Public Corporation incorporated under
Ceylon Petroleum Corporation Act No. 28 of 1961
BOARD OF DIRECTORS
CHAIRMAN
Mr. S. Amarasekara
MANAGING DIRECTOR
Mr. L.E. Susantha Silva
DIRECTORS
Mr. A H Sarath Wijesinghe
Dr. Hans Wijayasuriya
Ms. M T I Visakha Amarasekere
Mr. K H T Namal Sumanaratne
Mr. H D B Saman Kumara
AUDITORS
The Auditor General
REGISTERED OFFICE
609, Dr. Danister De Silva Mawatha, Colombo 9.
Telephone : +94 11 5455455
Telegrams : “LANKA OIL”
Cable : CEYPETCO
Telex : 21235 CEPETCO CE
Fax : +94 11 5455400
E-mail : [email protected]
Website : www.ceypetco.gov.lk
BANKERS
People’s Bank Commercial Bank
Bank of Ceylon Hatton National Bank Ltd.
Nations Trust Bank
CORPORATE INFORMATION

4
Mr. S. Amarasekara
Actg. Chairman
Mr. L E Susantha Silva
Managing Director
Mr. N R R Jayasekara
Refinery Manager
Mr. A R Abel
Dy. General Manager (Marketing)
Mr. S W Gamage
Dy. General Manager (HR & Admn.)
Mr. G A S P Gunawardena
Dy. General Manager
(Tec. Services & Corporate Affairs)
Mr. W Sarath Perera
Actg. Dy. General Manager (Finance)
Mr. L G M R Perera
Dy. Refinery Manager (Elec. & Instru.)
Mr. E A S Edirisinghe
Deputy Refinery Manager
(Manufacturing & Operations)
B H T Kulasekera
Deputy Refinery Manager
(Maintenance & Projects)
Ms. R T A Dabare
Finance Manager
Ms. R A K C Ariyaratne
Chief Legal Officer
Mr. A G D Bandara
Actg. Commercial Manager
Samantha Pushpalal
Human Resource Manager
Mr. S M C P Samarakoon
Marketing Manager
Mr. M KGarusinghe
Manager (Corp. Planning & Development)
Mrs. M S R Fernando
Manager (Information Technology)
Maj. M R S P Samarasinghe
Manager (Security)
Mr. S D S Rajapaksha
Manager (Procurement & Stores)
Mr. M A D Mallikarachchi
Operations Manager (Aviation)
Mr. G P K Wijekoon
Manager (Engineering & Premises)
Mr. W M K R B Wickramasinghe
Manager (Agro Chemicals)
Mr. N R Amarasinghe
Deputy Operations Manager
( Technical Services )
Mr. A D W K Abeysekera
Deputy Operations Manager
( Sapugaskanda Terminal )
Mr. Y M Thilakaratne
Manager (Internal Audit)
SENIOR MANAGEMENT

5
In accordance with Section 32(3) of the Ceylon Petroleum Corporation Act No. 28 of 1961, the Directors
of the Ceylon Petroleum Corporation (CPC) have pleasure in presenting the Annual Report together with
Audited Financial Statements for the year ended 31 December 2014.
Principal Activities
The principal activities of the Corporation are importing, refining, selling and distributing petroleum
products in Sri Lanka.
Subsidiary Company
The provision of fuel storage and distribution facilities and provision of information technology services
are principal activities of the subsidiary company – Ceylon Petroleum Storage Terminals Limited
(CPSTL). 2/3ds of the share capital of CPSTL is owned by CPC. The CPSTL Board of Directors consists
of 09 Directors, of which 03 Directors represent CPC.
Review of the Year’s Performance
The Chairman’s Review at pages 15 to 23 deals with the year’s performance of the Corporation.
Risks and Internal Controls
The Board of Directors assumes overall responsibility for managing risks. For this purpose, the Board of
Directors has instituted an effective and comprehensive system of Internal Controls in the Corporation.
Internal control systems have been reviewed and redesigned to mitigate the risks the Corporation is
exposed to, and to provide reasonable but not absolute assurance against material misplacement or loss.
The Corporation’s internal control systems provide Directors with reasonable assurance that assets are
safeguarded, transactions are authorized and properly recorded and material errors and irregularities are
either prevented or detected within a reasonable period of time to avoid recurrence. The Board of
Directors is satisfied that a strong control environment is prevalent within the Corporation and that
internal control systems are effective in safeguarding the assets of the Corporation.
Corporate Governance
The Board of Directors is committed to maintaining an effective Corporate Governance structure and
process. The financial, operational and compliance functions of the Corporation are directed and
controlled effectively within the Corporate Governance practices. The procedures and practices are in
REPORT OF THE DIRECTORS

6
conformity with the Corporate Governance rules and regulations and are described in the Corporate
Governance Report at page 29 to 34 of this report.
Human Resources
The Corporation has recognized the valuable role of Human Resources in transforming its business
mission and vision into reality. Accordingly several measures were taken to enhance its human resource
capital and to optimize their contribution towards the achievement of corporate goals and objectives. Our
Human Resources policy emphasizes on providing all categories of employees with adequate
opportunities for continuous upgrading of their knowledge and skills through local and overseas training.
Development of human capital to ensure availability of a high level technical and managerial capability
within its human resources has become a priority objective for the Corporation.
Audit Committee
Audit Committee consists of three members, all of whom are Non- Executive Independent Directors
including the Chairman of the Audit Committee. The Manager–Internal Audit acts as Secretary to the
Committee. The Committee operates within a clearly defined TOR (Terms of Reference) in terms of
Public Finance Circular No. PF/PE 7 dated 15 March 2000.
Sub Committees
Five sub Committees such as Senior Management Committee, Audit Committee, Technical Evaluation
Committee, Procurement Committee and Weekly Stock Review Committee have been established to
assist the Board of Directors to discharge its duties in an orderly manner. The details of the sub
committees are described in the Corporate Governance Report at page 29 to 34 of this report.
Accounting Policies
The Accounting Policies adopted in the preparation of Financial Statements are given at pages 40 to 56
of the financial report. There have been no changes in the Accounting Policies adopted by the Corporation
during the year under review.
Financial Performance
Financial Statements in this Annual Report represent the financial performance of Ceylon Petroleum
Corporation for the year ended 31 December 2014.

7
Revenue
Revenue generated from the sale of petroleum products such as Diesel, Petrol, Kerosene, Aviation Fuel
and fuels for power generation is the main source of income of the Corporation.
The sources of income of the subsidiary company are throughput charges and transport charges collected
for the supply of petroleum products.
The turnover for the year had increased to Rs.525,182 Mn. from Rs.490,380 Mn. in the year 2013. Sales
quantities had improved by 7% compared to the last year. This was mainly attributable to the increase
of fuel consumption in power generation sector (68%) and aviation sector (4%).
0
100,000
200,000
300,000
400,000
500,000
600,000
2014 2013 2012 2011 2010 2009
525,182490,380 512,910
356,750
256,650 237,660
Revenue in Rs. Mn
89%
10%
1%
Composition of Sales in Year 2014
Domestic Sales Indirect Exports Bunkering

8
Turnover for the year ended 31 December 2014 has been derived from Domestic Sales 89%, Indirect
Exports 10% and Bunkering 1%. Diesel, Petrol, Kerosene and Furnace Oil are the major components of
the domestic sales.
As a result of new vehicles imported, the demand for Petrol 95 Octane and Petrol 92 Octane was increased
by 6% and 28% respectively. The demand for Auto Diesel was reduced by 1.5% and it was evident that
many people had used modern vehicles which resulted in reduction for demand in Auto Diesel with the
introduction of Lanka Super Diesel which is sulphur free environmental friendly fuel. The demand for
Lanka Super Diesel compared with the year 2013 was increased by 28% and this was a positive
improvement in both environmentally as well as vehicle efficiency.
Gross Profit
Further strengthening previous year results, CPC has increased gross profit during the year by 7.5%.
Gross Profit for the year ended 31 December 2014 was Rs. 24,447.38 million compared to Gross Profit
of Rs. 22,743.56 million in the previous year, an increase of Rs. 1,703.82 million recorded against year
2013.
61%
21%
10%
3%
3%0.4%
0.03%
1%
1%
Segmental analysis of Revenue - 2014
Transport
Power
Aviation
Industries
Domestic
Lube
Agro
Bunkering
Export

9
The reduction of cost of sale in transportation sector contributed 59% to overall cost of sale, resulted
achieving significant improvement in gross profit. Reduction of fuel prices in international market
compared to year 2013 and the less & favourable exchange rate fluctuations caused jointly to improve
the cost of sales at a higher percentage.
The Corporation improved its capacity utilisation and increased the output during 2014 with the usage of
more suitable types of crude oil blends (Oman and Murban) at the refinery. Refinery yield of high end
products, such as gasoline and diesel, improved during the year under review, showing a significant
growth of 6.3% and 27.3%, respectively.
Other Operating Income
The Corporation’s other Operating Income represents dividend income, rent income, staff loan interest
and sundry income. Other operating income of the year was enhanced by 241% compared to the previous
year largely due to effective revenue administration and dividend received from subsidiary company.
Investment income
Investment income represents interest income received from treasury bills, treasury bonds, resident
foreign currency deposits, fixed deposits and interest received on overdue trade debtors. 18% growth was
achieved compared to previous year largely due to efficiency in fund management, recovery of trade
debts and effective administration of revenue and other funds.
2014
2013
2012
2011
2010
24,447.379
22,743.559
-60,781.737
-71,628.208
-9,274.607
Gross Profit / (Loss) in Rs. (Mn.)

10
Interest cost
There was a significant reduction in the Finance Charge during the year compared to last year. Finance
cost has decreased by 25%, amounting to Rs. 4,578.274 Mn. With the assistance of General Treasury and
the line Ministry, CPC was able to negotiate interest rate reduction on foreign currency loans with the
Bank of Ceylon and People’s Bank. This resulted in improvement of net profit of the year. CPC paid
interest cost of Rs.13,961 Mn to maintain foreign currency loans and made loan settlement of Rs.
440,378 Mn. This was a remarkable achievement compared with total revenue of Rs. 525,182 Mn. Nearly
84% of sales revenue was utilized for settlement of foreign currency loans in the year under review.
Profit / Loss
The Corporation reported a profit amounting to Rs. 1,741.16 Mn in 2014 reflecting an improvement of
122% compared to the loss of Rs. 7,926.323 Mn. recorded in the last year. However, due to the absence
of cost reflective domestic retail price mechanism in line with international oil price movement caused
to achieve a profit of Rs. 1,741.16 Mn in the year. Profit / Loss incurred in respect of the last five years
are shown below.
Domestic retail prices of petroleum products were revised in 2014 due to escalating price situation in the
international market. The domestic retail prices of Petrol, Auto Diesel, Super Diesel and domestic
Kerosene were decreased by Rs.12/-, Rs.10/-, Rs.12/- and Rs.25/- per litre, respectively, twice during
(100,000.00)
(90,000.00)
(80,000.00)
(70,000.00)
(60,000.00)
(50,000.00)
(40,000.00)
(30,000.00)
(20,000.00)
(10,000.00)
-
10,000.00
2014 2013 2012 2011 2010
1,741.16
(7,926.32)
(89,656.92)
(94,508.39)
(26,922.82)
Net profit /(loss) (Rs. Mn.)Rs. (Mn.)

11
2014. When compared with total segmental loss for the year 2014, heavy losses incurred by CPC were
due to sale of kerosene being sold at highly subsidized rates for domestic sector. In addition, export sector
also made a considerable impact on the loss of the Corporation.
Further, domestic retail prices of both categories of Furnace Oil (Low Sulphur & High Sulphur) remain
unchanged. However, use of petroleum products for power generation purposes was significantly
increased due to drought conditions that prevailed during the first half of the year along with increase in
demand for electricity in the country. Therefore, CPC could not generate excess production such as
Furnace Oil and Naphtha, unlike in previous year. This resulted 79% reduction in export sale during the
year of 2014.
Details of the segmental loss of the year 2014 is noted below:-
Segment 2014 2013
Loss – Rs. Mn.
Transport – Supply of Diesel at subsidized rate 5,759 6,235
Power Generation – Supply of Naphtha and Fuel oil at subsidized rates 1,377 2,321
Aviation – Supply of Jet A-1 at highly subsidized rate 1,387 1,251
Industries – Supply of Fuel Oil and Industrial Kerosene 140 476
Domestic – Supply of LPG & Kerosene at subsidized prices 3,146 2,885
Farmer Community – Supply of Agro Chemicals 57 70
Bunkering Sector-Diesel & Fuel Oil 1,632 -
Export Sector – Naphtha & Fuel Oil 3,426 -
Despite the heavy losses incurred due to above reasons, the sale of Petrol, Super Diesel, Fuel Oil (L/S),
Fuel Oil 3500,Jet A-1(Other than SL Airline & Mihin Lanka), Avgas, Bitumen and Solvents had
contributed positively with a profit contribution of Rs.11,233 Mn. This together with other income
received amounting to Rs.5,108 Mn. enabled the Corporation to earn overall marginal profit of Rs.
1,741 Mn. during the year.
The main contributory factor for the improvement in the financial position of CPC was the decline in
global fuel prices during the second half of the year without a full adjustment of domestic fuel prices,
resulting in a higher profit margin. Improved debt recovery also helped CPC to reduce outstanding trade
receivables from government entities to Rs. 37,059.95 Million at end 2014 from Rs. 53,189.68 Million
at end 2013. However, the reduction in the consumption of furnace oil by the Ceylon Electricity Board
(CEB) due to greater hydro and coal power generation towards end 2014 had a negative impact on the
profitability of CPC.

12
CPC refinery at Sapugaskanda contributes to approximately one third of petroleum oil requirement of the
country. Refinery operation suffered a minor setback in the second quarter of 2014 in which it was forced
to shut down for four weeks due to non-availability of crude oil as a result of the failure of the under buoy
hose on the crude oil buoy.
In contrast to the previous year, the supply to Power Plants has increased significantly even though
demand from transportation sector was stagnant during 2014, resulting overall increase of 7% in
petroleum supply.
Details of profits / (losses) before Tax are given below:
2014 2013(Revised)
Rs. Mn.
Revenue 558,324 518,152
Less : Sales Taxes (Excise duty & NBT) (33,142) (27,771)
Net sales Revenue 525,182 490,381
Cost of Sales excluding of CID & PAL (473,715) (441,345)
Less : Import Taxes(CID & PAL) (27,020) (26,293)
Gross Profit / (Loss) 24,447 22,743
Other Operating Income 1,151 374
Kerosene Subsidy 2,715 -
Selling & Distribution Expenses (11,533) (11,965)
Administrative Expenses (4,922) (3,765)
Financial Charges (13,962) (18,540)
Finance Income 3,957 3,263
Other Expenses (112) (37)
Profit / (Loss) before Tax 1,741 (7,926)
Operating Expenses
The total operating expenses decreased to Rs. 30,417 Mn. during the year under review, when compared
with the figure of Rs. 34,270 Mn. recorded during the previous year.
Significant drop in interest expense by Rs. 4,578 Mn was the prominent factor to reduce overall operating
expenses during the year.
Capital Expenditure
The total Capital Expenditure for the year was Rs. 1,116.716 Mn. as against Rs. 4,023.521 Mn. recorded
in the year 2013.

13
Property, Plant & Equipment
Movements in Capital Projects in Progress has contributed considerably to the increments in Property,
Plant & Equipment. The details of Property, Plant & Equipment of the Corporation and their movements
are given in Note 10 to the Financial Statements at page 58.
Reserves and Total Equity
The negative equity capital had reduced during the year to Rs.231,532.116 Mn. as at 31.12.2014. The
Cumulative losses since 2008 were the reason for negative equity position as at 31.12.2014. Movements
of the equity are given in the Statement of Changes in Equity at page 38.
Contributed Capital
The total Contributed Capital of the Corporation as at 31 December 2014 was Rs. 3,500 Mn. including
investment made in the subsidiary company of Rs.2,500 Mn.
Contribution to the Government
CPC is one of the largest tax contributors to the Government of Sri Lanka each year and the details of
the tax contribution for the year under review is given below.
020,000
40,00060,000
80,000
Excise duty
Port & airport development levy
Customs duty
Value added tax
Nation building tax
Others (Turnover Tax)
Total
in Rs. Mn
Exciseduty
Port &airport
development levy
Customsduty
Valueadded tax
Nationbuilding
tax
Others(Turnover
Tax)Total
2013 25,149 15,823 10,187 1,685 2,652 0 55,496
2014 30,205 15,289 11,730 2,741 2,652 447 63,064
Contribution to the Government-2014 Vs 2013

14
Board of Directors
The Board comprises of 07 Directors including the Chairman. The Directors of the Corporation during
the year under review were:
Mr. S Amarasekara (Actg. Chairman)
Mr. L E Susantha Silva (Managing Director)
Mr. A H Sarath Wijesinghe
Dr. S S Hans Wijayasuriya
Ms. M T I V Amarasekara
Mr. K H T Namal Sumanaratne
Mr. H. D. B. Saman Kumara
Directors’ Interest in Contracts & Related Party Transaction
The following Directors of the CPC continue to be the Directors of the Ceylon Petroleum Storage
Terminals Limited (CPSTL) due to equity ownership.
1. Mr. L.E. Susantha Silva
2. Mr. A H Sarath Wijesinghe
3. Mr. H. D. B. Saman Kumara
Compliance with Laws and Regulations
The Corporation has not engaged in any activities contravening the applicable laws and regulations.
Statutory Payments
The Directors, to the best of their knowledge and belief are satisfied that all statutory payments due to
the Government and to employees have been made on time.
Going Concern
The Board of Directors has prepared Corporate Business Plan with a view to improving the outlook of
the Corporation to ensure strengthened commercial viability for the future. Accordingly, the Financial
Statements are prepared based on a going concern basis.
Appointment of Auditors
The Auditor General is the Auditor of the Corporation. He has been appointed in terms of the provisions
in Article 154 of the Constitution of the Democratic Socialist Republic of Sri Lanka.
For and on behalf of the Board of Directors
S Amarasekara
ACTG. CHAIRMAN

15
Introduction
Overview of World Crude Oil Prices
During the year under review CPC imported two types of crude oil and processed in Sapugaskanda
Refinery. Out of 20 shipments imported in the year, Oman Export Blend crude accounted for 5 shipments
and balance 15 shipments were for Murban Crude oil. Out of total imported crude oil, Murban represented
for 10,370,111 BBLS (75%) whereas Oman Export Blend 3,387,767 BBLS (25%).
Official selling price of Adnoc (Murban Crude Oil) has steadily come down from January 2014 to
December 2014. Imported price based on DES per Barrel has come down from US$ 104.020 in the month
of January 2014 to US$ 60.245 per barrel in December 2014. However as per the behaviour of imported
price, it was noteworthy to mention that Murban crude oil prices from January 2014 to September 2014
had slightly come down where as significant decrease in prices started from September to December
2014. Total foreign currency spent on crude oil has amounted to US$ 1,442 Million in the year. Behaviour
of crude oil prices imported by CPC can be depicted as follows.
-
20.00
40.00
60.00
80.00
100.00
120.00
140.00
2008 2009 2010 2011 2012 2013 2014
Crude Oil Price Movement during last Seven Years
(US $ per Bbl)
CHAIRMAN’S REVIEW
CHAIRMAN’S REVIEW

16
Outlining the Sri Lankan Economy
In 2014, the Sri Lankan economy showed its resilience in the face of domestic as well as external
challenges. Real GDP grew by 7.4 per cent in 2014, in comparison to the growth of 7.2 per cent in 2013.
Accordingly, GDP per capita increased to US dollars 3,625 in 2014 from US dollars 3,280 in the previous
year. The economy was driven by domestic consumption expenditure that constitutes the largest share of
aggregate demand, while investments, particularly on construction, also provided an impetus to the
economic expansion during the year. On the production side, the Industry and Services sectors continued
to perform well, while adverse weather conditions dampened the performance of the Agriculture sector
during the year. Inflation remained at single digit levels for the sixth consecutive year, with year-on-year
and annual average inflation declining to 2.1 per cent and 3.3 per cent, respectively, by end 2014, from
4.7 per cent and 6.9 per cent, respectively, at end 2013. Prudent monetary policy as well as the
considerable decline in global commodity prices in the second half of the year enabled the deceleration
of inflation to low single digit levels during the year. (Source: CBSL Annual Report – 2014)
Petroleum Industry of Sri Lanka
As Sri Lanka does not produce petroleum, it has to import petroleum products which are required for the
various purposes of the nation. In the year of 2014, the total cost of importation of petroleum products
(Crude Oil and Refined products) amounted to Rs. 600 billion and it represented approximately 6.1 per
cent of the Gross Domestic Products (GDP) of Rs. 9,785 billion in the year 2014 valued at current market
prices. Further it was equal approximately to 24 per cent of the total imports of Rs. 2,535 billion in the
year 2014.
The Corporation
Following the international price trends, the average price of crude oil imported by Ceylon Petroleum
Corporation (CPC) also declined by 4.8 per cent to US dollars 104.825 per barrel in 2014 from US dollars
109.960 per barrel in 2013. In general, average crude oil import price is higher than the international
Brent crude price due to the necessity of importing two types of crude oil to blend, to suit the
specifications of the refinery that is designed to refine Iranian Light crude. Term contracts signed by CPC
to ensure regular supplies of petroleum are another reason for the difference in prices. CPC’s financial
position improved in 2014 recording a turnaround from the loss position in 2013 by reporting a profit of
Rs. 1.7 billion in 2014 compared to a loss of Rs. 7.9 billion in 2013.

17
The main contributory factors for the improvement in the financial position of CPC
Considerable cost reduction in importation of crude oil in the year 2014
Receipt of Rs. 96 Bn. from the institutional debtors which enabled to better management of
cashflow hence reduction in borrowing cost.
Renegotiation of bank interest from 7% to 5.5% from the two State Commercial Banks which
resulted in reduction in interest cost of Rs.4.5 Bn.
Entering into term contracts instead of spot purchases of petroleum products
Effective management of CPC cash flows (investment income was increased by Rs.800 Mn.)
Decision of the Government to grant subsidy for Kerosene for the year 2014 amounting to Rs.
2.7 Bn.
Action was taken to strengthen the Finance, Legal, Administration, and Retail Marketing
Departments by employing professionally capable managers to improve operational and financial
health of the Corporation.
During the year under review, the refinery has improved capacity utilization rate to 73%. In the
year 2014, actual crude oil processed amounted to 1,760,170 Metric Tons when compared to
1,643,218 Metric Tons in the year 2013
Major Projects Completed
Construction of Aviation Fuel Storage facility and Fuel Hydrant System (outside the Apron
Area) of the Hambantota International Airport Project at Mattala, Sri Lanka
Contract was awarded to Amana Pipeline Construction LLC [APC] to complete the project
consisting three (03) numbers of vertical steel fuel storage tanks, piping systems, mechanical
installations, electrical & instrument installation, civil works etc…..project cost amount to USD
31,251,584.02.
Installation of Sampling Pump and associated Piping system and Wagon side,
Bandaranayke International Airport
The project was for construction of one (01) pump, piping systems, mechanical installation,
electrical installation, etc…… The main objective of this project was to introduce close fuel
sampling system replacing former open sampling system converted to JIG compliant aviation fuel
industry standard system. Minimize product contamination, product wastage, reduction of man
hours in sampling process, reduction in health hazard and efficiency increase in product unloading
are the benefits derived from this project.

18
Summary of projects carried out by Engineering & Premises Function during the year
2014
No. Project Value Rs.
(Mn)
1 Improvements to Bowser Parking at Sapugaskanda Terminal 8.69
2 Balance work of Drum Yard for Lubricant at Muthurajawela 16.92
3 Construction of store Visitor’s Hut & Customer Service Hut at
Muthurajawela 2.01
4 Construction of store building at Muthurajawela 7.5
5 Excavation cable trench for Gasoline distribution at Sapugaskanda. 1.03
6 Construction of Locker Room at Sapugaskanda 6.33
7 Supply of Areal work platform for Head Office 2.45
8 Renovation to Office Building at Ratmalana 3.1
9 Internal decorations at Ministry Office 3.05
Total 51.08
Lubricants
Presently, CPC has the 2nd largest lubricant business market share estimated around 11% under
the trade name of “Hyrax-Ceypetco” and it has become a profitable business for CPC.
The performance of the lubricant business has increased continuously during the year and the
turnover for 2014 was Rs. 2,131 million compared to Rs. 1,872 million in previous year showing
an increase of 13.8% during the year. In order to increase lubricant sales, following steps were
taken to enhance Hyrax-Ceypetco brand.
I. Introduced new sales strategies & sales targets to the outlets, stockists, area supervisors
and area offices.
II. Appointed new stockists and re-arrange them to ensure product availability in the market.
III. Increase the storage facility at Muthurajawela Lubricant Sales and Storage complex.
IV. Conducted series of awareness programs for the outlet managers, pumpers, service station
owners, mechanics, boat owners, boat mechanics and general public to improve their
product knowledge.

19
V. Carried out mass media propaganda and series of road shows in Western & Southern
province to make aware lubricant products and boost brand image of Hyrax Ceypetco
Lubricants among current & potential customers.
Financial Performance
The Corporation took several initiatives to achieve significant improvement in financial and operational
performance during the year. CPC has continued the Gross Profit level during the current year after
operating at continued gross losses during the previous years.
The Corporation has achieved net profit during 2014 after six consecutive years. CPC was able to achieve
net profit of Rs. 1,741.16 Mn which was the remarkable achievement after six years continuous loss
making position.
The main contributory factors to the financial profit for the year were decrease in price of crude oil in
international market, decrease of finance cost by Rs.4,578 Million and improvement of efficiency in the
procurement process of petroleum products of the Corporation.
The loss incurred by selling products for domestic and industrial sector has been compensated by products
sold to power generation sector. Diesel consumption increased considerably during the first four months
of 2014 mainly due to increase of thermal power generation. Meanwhile, with the improved coverage of
rural electrification program, use of kerosene for the purpose of lighting as declined by 3.2% in the current
year compared with 11.9% in the previous year.
Corporate Governance
The Corporation ensures the practice of the principles of corporate governance to achieve transparency,
integrity and accountability in its functions which are vital for achieving core objectives of the
Corporation with a strong environment friendly process and playing a pivotal role in national economy.
Sub committees have been established by the Board of Directors to ensure the smooth functions of
strategic business units of the Corporation.
An Audit Committee, which consists of three Non-Executive Board Members, reviews independently all
strategic issues of the Corporation at regular meetings to achieve the objectives of bringing in par with
global standards. As a part of corporate governance process, the internal controls, financial and
operational transparency have been improved by strengthening Internal Audit Function of CPC. The
Audit Committee reviews financial and operational activities of CPC.

20
Corporate Social Responsibility
Corporate Social Responsibility (CSR) continues to be our main focus of attention and all attempts are
made to meet the needs of the entire country at the least possible cost to the consumer. We also guaranteed
uninterrupted fuel supplies to Government institutions at any cost.
CPC has contributed a massive amount of Rs. 63,064 Mn. to the Government coffers as duties and taxes
during the year 2014. CPC has supplied fuel for power generation purposes and Diesel for transportation
sector at a heavily subsidized price which enabled to mitigate the impact on all economic activities due
to external international oil price hikes.
During the year under review, very important change over to petroleum products which directly
contribute to the well-being of the people were made by the CPC and the CPSTL. Introduction of Petrol
of 92 Octane in place of Petrol of 90 Octane and Lanka Super Diesel Four Star (10ppm) in place of Lanka
Super Diesel of 500ppm took place with effect from 1st January 2014 and 22nd August 2014 respectively.
Also an alternative mix of crude oil appropriate for refinery operations was found through testing of
number of samples as a solution for the problems faced owing to sanctions of USA against Iran.
Refinery
The Refinery completed 45 years of successful operation on 7th August 2014. It had operated for 334.67
stream days and processed 1,760,170 metric tons of Crude Oil during the year. The crude oil throughput
has increased by 6.93% compared to year 2013. The consumption of fuel oil and gas has dropped by
0.8% in quantity wise and 3.46% in terms of value. Owned use, processing, storage and handling losses
were altogether 1.2% in year 2014 compared to 1.04% in year 2013. With all these facts, it proved that
the Refinery has increased operating time efficiency of 92% of Crude Distiller Unit compared to year
2013.
LPG2%
SBP0.15%
Naphtha7%
Petrol9%
Aviation Fuel10%
Kerosene4%
Diesel30%
Furnace Oil38%
Refinery Production in 2014 (Percentage)

21
Even though refinery reached to above performance level, CPC’s refinery has been undergoing immense
production constrains and technical difficulties due to non-availability of Iranian Light crude which is
the best suited for use in the refinery in terms of the yield and refinery margin obtained from the refining
process. As a result of ongoing US sanctions, the shift to other sources of crude oil such as Oman Export
Blend, Murban, and Arabian Light resulted in a substantial reduction in the refinery margin impacting
adversely on the profitability of locally refined products. Iranian sanctions have also led to the closure of
the refinery on several occasions as suitable supplier of crude oil could not import despite much efforts
being made by CPC/Ministry.
Import of Crude Oil and Refined Products
The Corporation has imported 1,824 Mn. metric tons of crude oil at a C&F cost of USD 1,442.169
Million. The average crude oil (C&F) cost is USD 105 per Bbl compared to USD 110 per Bbl. during the
previous year. The demurrage charges for importing crude oil and refined products have reduced
significantly compared to the last year.
Refined Bulk Products imports were metric tons of 2,073,865 and cost was USD 2,021 Mn.
Services by Ceylon Petroleum Storage Terminal Limited (CPSTL)
With the restructuring of CPC, the storage and operations of Kolonnawa and 12 regional bulk depots
located island wide, data processing and distribution activities were segregated and were brought under
the CPSTL.
CPSTL along with CPC hold regular stock review meetings with marketing companies, to monitor and
ensure product availability to meet the country’s demand. It recovers a Terminal Fee for the provision
of storage and operation services, and specific charges for distribution and data processing services
rendered to CPC.
Agrochemicals
CPC continues its pricing policy of maintaining reasonable prices for Agro Chemicals used by Cultivators
and Plantation Sector, thus making useful contribution towards lower production cost, thereby boosting
production of local agriculture sector.
The current “Ceypetco” agro chemical product range consists of 5 Weedicides, 4 Fungicides and 7
Insecticides. Ban imposed on 5 major products during 2013 continued during the year under review. To
mitigate the above situation, steps have been taken to introduce new insecticide “Diazinon” instead of
Carbofuran and a new fungicide of Captan 50% to our agrochemical product range. Disregarding all

22
these challenges, we were able to achieve a turnover of Rs. 179.76 Mn in 2014 compared to Rs. 177.6
Mn. in year 2013.
Management has implemented following key initiatives to face environmental challenges and capture the
market during the year 2014.
I. Disposal of expired agrochemical & contaminated packing waste such as cardboard Polythene
and cotton waste etc..
II. Initiate steps have been taken to automate the Agrochemical Plant with modern machineries.
III. Tender has been called for water treatment plant.
Human Resource Development and Welfare
The employee strength by the end of year 2014 was 2,668 (2,657 in 2013) in the permanent cadre and 80
(83 in 2012) in the casual cadre.
CPC has provided its employees and their families a Medical Assistance Scheme which is managed by
the Thrift Society of the Corporation. The Corporation employs two Medical Officers on fulltime basis
to serve employees. The hospitalization costs incurred for indoor treatments was Rs.27 Mn. during the
year under review. A monthly allowance of Rs. 250/= is also paid to all employees for outdoor medical
treatment.
A gratuity equivalent to ½ month pay for every year of service is paid under the Gratuity Act and
additional retirement and death benefits are paid out of Thrift Society funds. A Death Gratuity is also
paid for death of an employee. Corporation also provided financial assistance to the CPC Employees’
Sports Club with a view to encourage sports activities. It maintains four Holiday Homes outstation,
exclusively for the usage of employees and their families. There are several loan facilities granted at
concessionary interest rates to fulfil many necessities of the employees.
We have also allocated funds for training employees locally and abroad. Funds are also allocated for
improving the knowledge of languages and computer literacy of employees to upgrade their working
environment by sending them for post graduate Diplomas/Degrees and Rs.2,840,300/- was spent during
the year.
The practice of awarding employees who have satisfactorily completed their services is as follows:
20 years - Rs. 10,000/=
25 years - Gold Coin of 2.5 sovereign
30 years - Rs. 20,000/=
35 years - Rs. 25,000/=
40 years - Rs. 40,000/=

23
During the year 74 employees were awarded.
Employees’ children who are selected for government University education are awarded 17 scholarships
as a welfare activity by the Corporation.
Environment Safety
CPC being the market leader of petroleum products in the island and the owner of the only local
refinery in the country, is fully aware of its obligations to minimize environmental pollution, and
concerned about the environment safety in handling and usage of petroleum products.
Acknowledgement
On behalf of the Board of Directors of the Ceylon Petroleum Corporation, I would like to thank all
members of the CPC team, who whole heartedly supported in meeting the challenges faced by the
Corporation during this period. I also thank the Hon. Minister of Petroleum Industries and his Ministry
Officials, the Treasury, the Central Bank, our business partners and customers for their co-operation and
support.
S Amarasekera
ACTG. CHAIRMAN

24
Rupees Million 2014 2013(Restated)
Turnover 558,324 518,177
Bought in materials & services (475,195) (448,066)
Value Added 83,129 70,111
Applied the following way % %
To pay employees
Wages & fringe benefits 3,727 4.5% 3,572 5.1%
To pay providers of capital
Interest on loans 13,962 16.8% 18,540 26.4%
To provide maintenance and expansion of assets
Depreciation 635 0.8% 487 0.7%
Retained Profit 1,741 2.1% (7,984) (11.4%)
To pay Government
Taxes, Duties, Stamp duty and Contribution
to the General Treasury 63,064 75.9% 55,496 79.2%
Value Added 83,129 100.0% 70,111 100.0%
STATEMENT OF VALUE ADDED

25
FINANCIAL Unit 2014 2013 (Restated)
Gross Revenue Rs. Mn. 525,182.094 490,381.492
Gross Profit/(Loss) Rs. Mn. 24,447.379 22,743.559
Operational Profit /(Loss) Rs. Mn. 11,857.999 7,387.657
Finance Charges Rs. Mn. 13,961.574 18,539.848
Profit /(Loss) before Tax Rs. Mn. 1,853.658 (7,889.407)
Net Profit /(Loss) after Tax Rs. Mn. 1,741.160 (7,926.323)
Capital and Reserves Rs. Mn. (231,532.117) (236,466.744)
Long term Borrowings Rs. Mn. 703.481 1,350.850
Capital Expenditure Rs. Mn. 1,116.716 4,023.521
IMPORTS
Crude oil Imports MT ’000 1,824 1,743
Refined Bulk Product imports MT ’000 3,385 2,907
C&F Value Rs. Mn. 187,760 182,064
OPERATIONS
Sales Metric Tons 3,967,738 3,692,023
Refinery Throughputs Metric Tons 1,760,170 1,643,923
MARKETING
CPC owned Filling Stations Numbers 249 249
Dealer owned Filling Stations Numbers 874 844
Dealer controlled Filling Stations Numbers 44 44
EMPLOYEES
Number of employees at the year end Numbers 2,668 2,657
Total Emoluments for the Year Rs. Mn. 3,727.230 3,520.253
Value Added per Employee Rs. 1,397,102 1,324,897
HIGHLIGHTS

26
isk is an integral part of any business entity and any organization or industry is exposed to various
risks. Type of risk encountered may vary from industry to industry and from organization to organization.
Hence, it is a significant task to identify the Organization and Industry owned risk and their likelihood of
occurrence.
Internal controls of the Corporation covers all policies and procedures which enables to detect, manage
and prevent the relevant risks. Effective systems and procedures established by the Ceylon Petroleum
Corporation Act No. 28 of 1961, Finance Act and other regulatory proceedings have also been designed
to deal with operations and prevent irregularities and frauds.
Internal and External Audit
Internal and external audit functions are critical in the risk management process. Internal and External
Auditors examine financial systems and other operational segments as per the pre-determined policies &
procedures and recommend remedial actions to manage any risks that they identify. Audit Committee
established by the Board of Directors reviews the significant audit findings.
A brief sketch of the risks that the Corporation is exposed to and risk management measures taken in
place are given below.
Economic Risk
The economic conditions of the country are highly sensitive to the petroleum products. As a market leader
as well as a government owned institute, some of petroleum products are supplied with the highly
subsidized rate in order to meet social and economic circumstances rather than profitability. Small change
in the price level of the products will have a major impact on the entire economy immediately. In order
to mitigate adverse implications of economic risk, we are frequently deploying aggressive cost
management initiatives so that we will be able to sell petroleum products at competitive prices which will
enable to balance both profitability and other socio economic conditions.
Financial Risk
Financial risk relates to the availability of financial resources for the smooth functioning of the
Corporation. CPC ensures that cost-effective funding is available at all times while curtailing the negative
impact of market fluctuations on net profit. The main risk exposures are foreign exchange, liquidity and
interest rate.
R RISK MANAGEMENT REPORT

27
Foreign Exchange Risk Management
CPC currently purchases US$. 150-200 Mn. approximately monthly, mainly from the two State banks to
settle suppliers of crude and refined petroleum products. Its sales proceeds are mainly in Sri Lankan
Rupees. Therefore, the Corporation is exposed to foreign currency risks. To mitigate this risk, all banks
exchange rates quoted are monitored on a daily basis and Dollars were purchased not at the bankers
quoted rate but at the market rate by monitoring market behaviors. As a result of this, CPC had obtained
a substantial gain from this operation.
Liquidity Risk Management
Liquidity risk is defined as the risk that the Corporation will encounter in meeting obligations associated
with short term liabilities that are settled by delivering cash or another financial asset. Liquidity risk arises
when there is a possibility that the Corporation might not be able to meet its settlement obligations when
they are due.
Several actions have been taken to strengthen the liquidity position of the Corporation. Investing in
overnight repo, call deposits, term deposits, close dealing with dealers are main strategies of liquidity
management. The Company has excellent relationships with the two state banks it deals with and enjoys
substantial banking facilities.
Liquidity risk is further analysed based on maturity analysis. That comprises expected cash inflows and
outflows over a series of specified time period to determine the liquidity position of the Corporation and
through continuous forecasts, the future cash requirements are ascertained.
Interest Rate Risk Management
CPC is functioning with the short-term and long term borrowing facilities in order to meet liquidity and
gearing requirements. The Corporation incurred a significant amount as interest and other financial
charges. The Corporation is always investing in overnight repo, call deposits and term deposits to mitigate
the interest rate risk in order to minimize the negative impact on the net income. Successful discussions
have been done with the two state banks and the General Treasury to maintain constant effective interest
rate for all facilities offered.
Operational Risk
Operational risk is defined as the risk of loss resulting from inadequate or failed internal processes, people
and systems or from external events. Operational risk arises from inadequate or lack of control over
critical activities or the failure of systems and procedures of the Corporation. These risks are likely to
occur in all activities of our business and may lead to both financial and reputational losses.

28
Petroleum products are highly interrelated with the lives of the general public of Sri Lanka and the small
disoperation will result to a greater risk. CPC has recognized Operational Risk as a distinct and a
controllable risk and taken steps to manage it in a structured manner. A proper operational risk
management policy has been implemented in order to manage the operational risk. Some of the
committees such as Procurement Committee and Tender Evaluation Committee are in function to
mitigate the operational risk of the operation.
Supplier Risk
CPC procurements for all its petroleum products are from the international market and due to the possible
supply disruption, defectives and products without required technical standard create the supply risk to
the Corporation. The Corporation has established sub committees such as Stock Review Committee,
Procurement Committees and Tender Evaluation Committees to ensure the quality assurance and smooth
supply chain.
Labour Risk
Labour issues can affect quality of petroleum products and goodwill of the Corporation. Among other
issues are the likelihood of labour related litigation and investing in time and resources in recruitment
and training to build a competent workforce. Through Collective Agreements with the labour unions
representing its workers, the Corporation makes every effort to ensure a motivated workforce at all times.
These agreements sustain an equitable balance between the interests of employer and employee. Staff
welfare and other benefit schemes provided to our employees are the key to maintain enthusiastic and
energetic workforce.

29
orporate governance embodies the principles of honesty, objectivity, integrity, transparency and
ethics in caring out operational activities of an Organization. Board of Directors is committed to the
practice of strong corporate governance, revising governance practice to maintain the highest standards
in the operation in the Corporation. The Corporation ensures to practice the principles of corporate
governance to achieve transparency, integrity and accountability in its functions which are vital for
achieving core objectives of a sustainable energy Corporation with a strong environment friendly process
and playing pivotal role in national economy.
The Corporation adheres to the requirements of the Code of Best Practice on Corporate Governance
issued by the Institute of Chartered Accountants of Sri Lanka and Public Enterprises Guidelines for Good
Governance issued by Department of Public Enterprises – Ministry of Finance in 2003.
Board of Directors
The Board of Directors comprises seven members including Chairman and Managing Director. The
Chairman, Managing Director and other Directors are appointed by Hon. Minister of Petroleum and
Petroleum Development in accordance with the Ceylon Petroleum Corporation Act No. 28 of 1961 and
subsequent amendments. One such Director is a representative of the General Treasury (Ministry of
Finance & Planning). All Directors are Non-Executive Directors, except the Chairman and Managing
Director.
Subject to reappointment, the Directors have initial tenures not exceeding a period of three years on the
Board. In taking decisions, the Board obtains relevant information from corporate management and if
required, obtains information from external professionals.
Responsibilities of the Board
The Board’s main responsibility is creating and delivering sustainable stakeholder value, within a strong
corporate governance structure that maintains stakeholder confidence, business integrity and adhering to
the statutory requirements. The Board endeavours to exercise effective control over the Corporation by
formulating and implementing policies and ensuring their effective implementation. Directors dedicate
themselves to the affairs of the Corporation by attending Board and Board subcommittee meetings and
making decisions by circular resolutions. The Board makes every effort to ensure due compliance to good
governance practices and makes objective assessment of the Company’s performance and prospects.
C CORPORATE GOVERNANCE

30
Apart from the above, Board holds the responsibility for granting approval for Annual Financial
Statements, the Annual Budgets, Corporate Plan, Action Plan and reviewing financial performance on
regular basis. The Board oversees the granting of approvals relating to key appointments, staff
promotions, major capital expenditure investments and credit facilities to Corporate Customers.
Board Meetings
Regular Board meetings are held monthly, while special Board Meetings are convened as and when
required. Senior Managers also attend meetings on invitations.
The Board Meetings are conducted on a formal agenda and Directors are provided with relevant
comprehensive background information by Corporate Managements prior to meetings. Fourteen Board
meeting were held during the year under review.
Compliance and Transparency
The Ceylon Petroleum Corporation is committed to maintain transparency in all its dealings. The
Corporation complies with new Sri Lanka Accounting Standards (SLFRS/LKAS) and relevant
regulations to ensure accountability. The strong internal controls compliance, measures have been
integrated into the Corporation’s daily operations in accordance with Finance Act No. 38 of 1971,
financial statements are published annually and tabled in Parliament. Also in compliance with Finance
Act, the Auditor General carries out the External Audit of the Corporation.
Corporate Management
The Chairman/Managing Director manages the day-to-day affairs of the Corporation based on strategic
direction, Policy formation and Procedures approved by the Board of Directors from time to time.
Operations and main administration of CPC can be divided into two broader categories namely Refinery
operations and Head Office operations including Regional Offices.
Refinery operation is headed by Refinery Manager who is assisted by Deputy Refinery Managers in
different core technical areas such as Electrical, Chemical and Mechanical.
Each Function at Head Office level is headed by a Deputy General Manager or a Manager who assists
the Chairman/ Managing Director in day-to-day functioning of the Corporation. The Corporate Managers
are well qualified with academic degrees and relevant professional qualifications in their respective
functional areas.

31
The Audit Committee
Composition of the Audit Committee
During the year under review, Corporation has conducted four (04) Audit committee meetings for which
Non-Executive Directors were appointed by the Board of Directors as Committee members. At the 63rd
Audit Committee meeting, three Non-Executive Directors namely Dr. Hans Wijayasuriya (Chairman),
Mrs. Sandya Wijayabandara and Mr. A. H. S. Wijesinghe acted as Members of the Committee.
Commencing from 63rd to 66th of Audit Committee meetings, three Non-Executive Directors namely
Dr. Hans Wijayasuriya (Chairman), Ms. Sandya Wijayabandara and Ms. Visakha Amarasekere acted as
Members of the Committee. From 64th to 66th Audit Committee meetings, Mr.
K. H. T. N. Sumanaratne also joined as a Member of the Committee.
The Audit Charter of the Committee has been prepared covering scope of responsibilities, authorities and
specific duties stipulated in Treasury Circular issued in relation of conducting Audit Committees in
Public Commercial Enterprises.
Tasks of Audit Committee
The Committee reviews the adequacy, timing and existence of the internal control systems of the
Corporation and in compliance on business operations, adequacy of disclosures in financial reporting
system. It also ensures consistence of accounting policies adopted and compliance with the financial
reporting system including SLFRS/LKAS used for preparation of financial statements. Apart from above,
the Committee reviews the risks that the Corporation is exposed to and the actions taken to mitigate the
risk and their effectiveness.
Meetings
During the year under review, four (04) Audit Committee meetings have been conducted to discuss duties
entrusted to them as noted above.
The members who have taken part in Audit Committee Meetings during the year are noted below:-

32
Serial
No. Date
Strength of
Committee Names of Members
63 22.04.2014 03
Dr. Hans Wijayasuriya (Chairman)
Miss. Visakha Amarasekere
Mr. A. H. S. Wijesinghe
64 28.08.2014 04
Dr. Hans Wijayasuriya (Chairman)
Miss. Visakha Amarasekere
Mr. K. H. T. N. Sumanaratne
Mr. A. H. S. Wijesinghe
65 22.10.2014 04
Dr. Hans Wijayasuriya (Chairman)
Miss. Visakha Amarasekere
Mr. K. H. T. N. Sumanaratne
Mr. A. H. S. Wijesinghe
66 19.12.2014 04
Dr. Hans Wijayasuriya (Chairman)
Miss. Visakha Amarasekere
Mr. K. H. T. N. Sumanaratne
Mr. A. H. S. Wijesinghe
Work Performed by the Audit Committee
The Audit Committee has made number of discussions and made recommendations on key strategic
issues faced by CPC and submitted workable solution to the Board of Directors.
During the year internal audit programme focused on following broader areas and suggested an
improvement required.
Identification of lapses when granting loans to employees.
Duties and responsibilities of CPC in calibrating and stamping dispensing pumps.
Possibility of implementing flow meters for bowser loading disregarding the tongue level.
Losses incurred disregarding the volume variation due to temperature and compensation for
evaporation.
Vulnerability of the SAP system used and lack of security control at CPSTL.
Business Continuity Plans and Disaster Recovery Plans identified due to the failure of Under
Hose Buoy.
Lapses in fire & safety requirements at Sapugaskanda Terminal including the report on near miss
incident reported while maintenance work is being carried out.
Identified control lapses and action required at Sapugaskanda.
Non-compliance observed when granting loans to employees for purchasing vehicles.
Control lapses identified when carrying out year-end physical verifications.
Uncontrolled Bulk Stock returns identified at terminals and deports and raising the accountability
of CPSTL on permitting the loads to some other dealer as practice.

33
Management Committee
The Management Committee consists of two Non-Executive Directors and one of them is the Chairman
of the Management Committee. The Management Committee sits once a month prior to monthly Board
meeting to discuss all matters reported for Board of Directors. The Committee submits its report to the
Board meeting for final approval. All Senior Managers, Head of Functions take part in Management
Committee.
Stock Review Committee
These are held weekly with the participation of CPSTL staff and representatives of CEB and IOC. The
stock position is reviewed and the requirements for the three month future period is planned. Taking into
account, the country requirement as against the Refinery production, the quantity to be imported is
identified and shipments are planned taking into consideration of available tank storage capacity. Regular
close monitoring enables the Corporation to ensure uninterrupted supply of fuel in the country.
Procurement Committees (PC) and Technical Evaluation Committees (TEC)
The National Procurement Agency has issued a set of guidelines for the purchase of products, goods,
services and works. The relevant TEC and the PC function under the guidelines issued by the NPA to
ensure transparency, minimize delays and to obtain financially the most advantageous and qualitatively
best services and supplies to CPC.
Financial Disclosures
The Board of Directors is responsible presenting Financial Statements that provides a true and fair view
of the Corporation. These statements are prepared in accordance with the requirements of Sri Lanka
Financial Reporting Standards (LKAS/SLFRS), the Finance Act and the Corporation Act.
Internal Controls
The Corporation is responsible for maintaining a sound system of internal controls and reviewing its
effectiveness. The system is intended to safeguard the assets of the Corporation and to ensure that proper
records are maintained and reliable information is produced. This responsibility covers all types of
controls, including financial, operational and compliance controls as well as risk management. It is vital
to state, however, that any system of internal control can ensure only reasonable and not absolute
assurance that errors and irregularities will be presented or detected within a reasonable period of time.
The Internal Audit Department of the Corporation is entrusted to review all internal control procedures
and their adequacy and regular recommendation for improvements of internal controls.

34
Internal Audit
The Audit Committee reviews and decides the scope of internal audit process which is established to
assess the effectiveness of the financial and operational procedures and controls. The Internal Audit
Department is headed by a professionally qualified Chartered Accountant. Annual Audit Plans were
implemented to assess the internal controls, understanding risk areas of individual functions and
evaluating the management control functions using compliance and substantive tests.
In addition to the audit assignments during the year under review the Internal Audit has also focused on
the following areas :
Identification of risk related to the areas of product losses, revenue losses and continuation of
information system.
Analysis of resource utilization of the Corporation and identification of barriers to maximize the
efficiency of strategic business units.
Identification of weaknesses in the existing procedures and proposals of actions to overcome and
strengthen the control.
Reviewed and monitored the progress of Action Plan on major issues highlighted by the Internal
Audit.
Reviewed the information system mechanism used by CPC to assess the adequacy of policies and
procedures required to manage an Enterprise Resource Planning (ERP)
Identification and direction of training requirements on the Enterprise Resource Planning and the
level of management support.
Discussion of Auditor General’s Reports and replies to Audit Queries.
Periodic Review of Annual Audit Plan and the Performance of Internal Audit Function based on
actual works carried out.
Relationship with the General Treasury & Central Bank
The Corporation is closely associated with the Central Bank of Sri Lanka (CBSL) and the General
Treasury and obtains their activities when managing Corporation’s treasury operations. The Corporation
also seeks advice and guidance for major expansion programs and borrowings.

35
Statement of Comprehensive Income
Statement of Financial Position
Statement of Changes in Equity
Statement of Cash Flow
Notes to the Financial Statement
FINANCIAL STATEMENTS

36
2014 2013 2014 2013
Restated Restated
For the year ended 31st December Rs. Mn. Rs. Mn. Rs. Mn. Rs. Mn.
Revenue 1 525,182.094 490,381.492 527,168.712 490,966.235
Cost of Sales 2 (500,734.715) (467,637.933) (507,613.357) (474,080.094)
Gross Profit 24,447.379 22,743.559 19,555.355 16,886.141
Other Operating Income 3 1,098.797 321.978 1,556.261 452.324
Kerosene Subsidy 4 2,715.000 - 2,715.000 -
Income on Investment Property 5 51.823 52.015 51.823 52.015
Selling & Distribution Expenses 6 (11,532.812) (11,965.252) (1,760.156) (1,600.652)
Administrative Expenses 7 (4,922.187) (3,764.642) (8,100.510) (6,824.850)
Operating Profit 11,857.999 7,387.657 14,017.773 8,964.978
Finance Cost 8 (13,961.574) (18,539.848) (13,961.574) (18,539.848)
Finance Income 9 3,957.234 3,262.784 3,985.931 3,287.303
Loss before Income Tax 1,853.658 (7,889.407) 4,042.130 (6,287.567)
Income Tax /ESC expense - (275.168) (216.017)
Profit /(Loss) for the year 1,853.658 (7,889.407) 3,766.961 (6,503.584)
OTHER COMPREHENSIVE INCOME
Net Gain/(loss) on available -for- sale Financial assets - (14.500) - (14.500)
Re-measurement gain/(loss) on Retirement Benefit plan (112.498) (22.416) (152.495) (64.452)
Other comprehensive loss for the year (112.498) (36.916) (152.495) (78.952)
Total comprehensive loss for the year 1,741.160 (7,926.323) 3,614.466 (6,582.536)
Less : Non controlling interest (624.435) (447.929)
Profit/(Loss) for the year 1,741.160 (7,926.323) 2,990.032 (7,030.465)
CPC GROUP
Note
The Notes appearing on pages 57 to 69 form an integral part of the Financial Statement
STATEMENT OF COMPREHENSIVE INCOME

37
31.12.2014 31.12.2013 01.01.2013 31.12.2014 31.12.2013 01.01.2013
Restated Restated Restated Restated
As at 31st December 2014 Note Rs. Mn. Rs. Mn. Rs. Mn. Rs. Mn. Rs. Mn. Rs. Mn.
ASSETS
Non - Current Assets
Property, Plant & Equipment 10 13,591.468 13,110.644 9,572.201 30,879.893 31,083.696 28,627.947
Investment Property 10.3 25.362 26.166 26.970 25.362 26.166 26.970
Intangible Assets 10.5 - - - 47.358 139.293 229.429
Investment in Subsidiary 11 5,000.000 5,000.000 5,000.000 - - -
Non - Current Fiancial Assets 12 43.626 43.626 58.126 43.626 43.626 58.126
Trade and Other Receivables 13 3,406.923 4,365.812 6,884.044 2,549.808 4,365.812 14,682.463
22,067.379 22,546.248 21,541.341 33,546.046 35,658.593 43,624.935
Current Assets
Inventories 14 63,770.066 65,036.294 62,193.919 64,138.159 65,432.534 62,554.390
Trade & Other Receivables 13 62,354.116 86,029.691 110,629.953 63,695.436 87,778.309 104,489.763
Income Tax Recoverable 889.328 721.543 246.990 889.328 1,006.962 628.057
Short Term Investment 11,994.697 6,801.651 - 11,994.697 6,801.651 -
Cash and Cash Equivalents 15 21,474.788 6,134.526 11,623.634 23,380.517 11,388.052 12,085.561
160,482.994 164,723.705 184,694.496 164,098.137 172,407.508 179,757.771
Total Assets 182,550.373 187,269.953 206,235.837 197,644.184 208,066.101 223,382.706
EQUITY AND LIABILITIES
Capital and Reserves
Contributed Capital 16 3,500.000 3,500.000 3,500.000 3,500.000 3,500.000 3,500.000
Capital Reserve 17 4,992.686 4,992.686 4,992.686 4,992.686 4,992.686 4,992.686
Retained Earnings (240,024.803) (244,959.430) (237,033.107) (231,859.647) (238,043.145) (231,012.680)
Non controlling interest - - - 6,582.577 5,958.142 5,510.214
Total Equity (231,532.116) (236,466.744) (228,540.421) (216,784.384) (223,592.316) (217,009.780)
Non - Current Liabilities
Retirement Benefits Liability 663.950 538.109 546.935 2,006.254 1,755.131 1,652.777
Deferred tax 492.982 394.660 366.065
Loans & Borrowings 18 703.481 1,350.850 1,998.218 2,590.131 3,725.301 4,521.422
1,367.431 1,888.959 2,545.153 5,089.367 5,875.092 6,540.264
Current Liabilities
Trade and Other Payables 19 164,280.022 194,269.480 220,897.351 160,355.644 197,545.714 221,665.585
Current portion of Loans & Borrowings 18.1 647.369 647.369 647.369 1,135.168 1,135.169
Short Term Borrowings 20 247,787.669 226,760.199 210,515.694 247,787.669 226,931.750 212,015.945
Provision for Deemed Dividend 170.691 170.691 - 170.691 170.691
Income Tax Payable - - - 60.720 - -
412,715.059 421,847.739 432,231.105 409,339.201 425,783.325 433,852.222
Total Equity and Liabilities 182,550.373 187,269.953 206,235.837 197,644.184 208,066.101 223,382.706
GROUPCPC
The Notes appearing on pages 57 to 69 form an integral part of the Financial Statement.
These Financial Statement give a true and fair view of the state of affairs of Ceylon Petroleum Corporation and the Group as
at 31st December 2014 and its profit for the year then ended.
W Sarath perera M.C.D.Perera
ACTG. DY. GENERAL MANAGER (FINANCE) SENIOR DEPUTY FINANCE MANAGER
The Board of Directors is responsible for the preparation and presentation of these Financial Statements. Approved and
signed for and on behalf of the Board by,
STATEMENT OF FINANCIAL POSITION

38
The Notes appearing on pages 57 to 69 form an integral part of the Financial Statement
STATEMENT OF CHANGES IN EQUITY
Contributed Shares held Capital Reserve on Retained Shareholders Non controlling
Capital in Reserve Consolidation Earnings fund Interest Total Equity
Rs. Mn. CPSTL Rs. Mn. Rs. Mn. Rs. Mn. Rs. Mn. Rs. Mn. Rs. Mn.
As at 1st Jan 2013 1,000.000 2,500.000 4,992.686 2,485.643 (233,624.356) (222,646.027) 5,449.244 (217,196.783)
Adjustment for Prior period error corection-CPC 4.094 4.094 - 4.094
Adjustment for Prior period error corection-CPSTL 121.939 121.939 60.97 182.909
Gain on Consolidation (2,485.643) 2,485.643 - -
Re-stated balance as at 1st Jan 2013 1,000.000 2,500.000 4,992.686 0.000 (231,012.680) (222,519.994) 5,510.214 (217,009.780)
Re stated Loss for the year (7,030.465) (7,030.465) 447.929 (6,582.536)
Re-stated balance as at 31st December 2013 1,000.000 2,500.000 4,992.686 0.000 (238,043.145) (229,550.459) 5,958.142 (223,592.316)
Comprehensive income
Profit for the year 3,142.527 3,142.527 624.435 3,766.961
Other comprehensive income for the year (152.495) (152.495) (152.495)
Reversal of Deemed Dividend Provision 170.691 170.691 - 170.691
Kerosene Subsidy 3,022.775 3,022.775 - 3,022.775
Total comprehensive income for 2014 6,183.498 6,183.498 624.435 6,807.932
Balance as at 31st December 2014 1,000.000 2,500.000 4,992.686 0.000 (231,859.647) (223,366.961) 6,582.577 (216,784.384)

39
2014 2013 2014 2013
For the year ended 31st December Notes Rs. Mn. Rs. Mn. Rs. Mn. Rs. Mn.
CASH FLOWS FROM OPERATING ACTIVITIES
Cash generated from operations 21 12,449.312 5,152.809 10,875.649 11,611.005
Interest Paid (13,961.574) (18,539.848) (14,384.351) (19,195.078)
Retiring Gratuity Paid (64.187) (65.859) (143.028) (143.538)
Income Tax /WHT paid (167.784) (474.554) (167.784) (474.552)
Net Cash Generated from Operating activities (1,744.234) (13,919.549) (3,819.514) (8,202.163)
CASH FLOWS FROM INVESTING ACTIVITIES
Proceeds from Sale of Property, Plant & Equipment 16.216 23.728 21.006 36.589
Acquisition of Property, Plant & Equipment (1,116.716) (4,023.521) (1,325.867) (4,080.894)
Income from Investment 437.501 0.007 - 0.007
Interest Received 3,957.234 3,262.784 3,985.931 3,287.302
Short Term Investment (5,193.046) (6,801.651) (5,193.046) (6,801.651)
Net Cash Used in Investing Activities (1,898.811) (7,546.556) (2,511.976) (7,558.647)
CASH FLOWS FROM FINANCING ACTIVITIES
Loans obtained during the period - 339.047
New Loans obtained /Repayment of Loans 28,745.610 7,231.628 28,257.810 6,172.419
Net Cash From/(Used in) Financing Activities 28,745.610 7,231.628 28,257.810 6,511.465
Net Increase/(Decrease) in Cash & Cash Equivalents 25,102.565 (14,234.476) 21,926.319 (9,249.345)
Cash & Cash Equivalents at Beginning of the Year (7,299.390) 6,935.086 (2,217.415) 7,031.931
Cash & Cash Equivalents at End of the Year 15 17,803.175 (7,299.390) 19,708.905 (2,217.415)
GROUPCPC
The Notes appearing on pages 57 to 69 form an integral part of the Financial Statement
STATEMENT OF CASH FLOW

40
1. CORPORATE INFORMATION
1.1 General
Ceylon Petroleum Corporation is a Public Corporation incorporated under Ceylon Petroleum
Corporation Act No. 28 of 1961 and domiciled in Sri Lanka. The registered office of the
Corporation is located at No. 609, Dr. Danister De Silva Mawatha, Colombo 09.
1.2 Principal Activities and Nature of Operations
The principle activities of the Group are refining, selling & distributing, Import & Export of
Petroleum Products in Sri Lanka
1.3 Parent Entity and Ultimate Parent Entity & Subsidiary Company
The Corporation is under the purview of the Ministry of Petroleum Industries. In the opinion of
the Directors, the Corporation’s ultimate parent undertaking and controlling party is the
Government of Sri Lanka. 2/3 shares of Ceylon Petroleum Storage Terminals Ltd. (CPSTL) are
owned by CPC.
1.4 Date of Authorization for Issue
The Financial Statements of Ceylon Petroleum Corporation and its group for the year ended 31
December 2014 were authorized for issue in accordance with a Resolution of the Board of
Directors on 27th February 2015.
2. SUMMARY OF SIGNIFICANT ACCOUNTING POLICIES
2.1 Basis of Preparation
The Financial Statements are prepared under the historical cost basis (except revaluation) in
accordance with Sri Lanka Accounting Standards (SLFRSs / LKASs) introduced by the Institute
of Chartered Accountants of Sri Lanka with effect from 01 January and in accordance with the
provisions of the Finance Act No. 38 of 1971. These are the Corporation’s first annual financial
statements prepared in accordance with SLFRSs / LKASs.
The financial statements have been prepared in compliance with SLFRSs / LKASs. . The
Corporation has consistently applied the accounting policies used in the preparation of its opening
SLFRS statement of financial position.
The Financial Statements are presented in Sri Lankan Rupees and all values are rounded to the
nearest million except where otherwise indicated.
SIGNIFICANT ACCOUNTING POLICIES

41
2.1.1 Basis of Consolidation
The CPC’s Financial Statements comprise the consolidation of the financial statements of the
Ceylon Petroleum Storage Terminal Limited (CPSTL) which is an integral to the CPC as CPC
owns 2/3rd of shares of CPSTL. The group financial statements comprise consolidation of CPC’s
financial statements with that of CPSTL.
2.1.2 Accounting Standards issued but not adopted
(a) New Standards, amendments and interpretations issues but not effective for the financial year
beginning 1 January 2012 and not early adopted:
(i) SLFRS 13, ‘Fair Value Measurement’ aims to improve consistency and reduce
complexity by providing a precise definition of fair value and a single source of fair value
measurement and disclosure requirements for use across SLFRSs.
(ii) SLFRS 9, ‘Financial Instruments’ addresses the classification, measurement and
recognition of financial assets and financial liabilities. SLFRS 9 replaces the parts of
LKAS 39, that relate to the classification and measurement of financial instruments.
SLFRS 9 requires financial assets to be classified into two measurement categories; those
measured at fair value and those measured at amortized cost. The determination is made
at initial recognition and classification depends on the entity’s business model.
(iii) SLFRS 12, ‘Disclosures of interests in other entities” including the disclosure
requirements for all forms of interests in other entities, including joint arrangements,
associates etc.
There are no other SLFRSs that are not yet effective that would be expected to have a
material impact on the Corporation.
2.1.3 Statement of Compliance
The Financial Statements of Ceylon Petroleum Corporation have been prepared in accordance
with Sri Lanka Accounting Standards (SLFRSs / LKASs) issued by the Institute of Chartered
Accountants of Sri Lanka and the provisions of the Finance Act No. 38 of 1971 and subsequent
amendments thereto.

42
2.1.4 Going Concern
These financial statements are prepared on the assumption that the group is a going concern i.e.
as continuing in operation for the foreseeable future. It is therefore assumed that the group has
neither the intention nor the necessity of liquidating or of curtailing materially the scale of its
operation even though the group has made a Profit of Rs 2,990 Million and a negative equity
position of Rs 216,784Million as per the financial statements prepared for the year ended 31st
December ,2014.
2.1.5 Comparative Information
As discussed in 2.1, with the adoption of Sri Lanka Accounting Standards (SLFRs / LKASs).the
comparatives have been adjusted where necessary to conform with the change in the presentation
in the current year.
2.2 Summary of Significant Accounting Judgments, Estimates and Assumptions
The preparation of financial statements in conformity with Sri Lanka Accounting Standards
requires the use of certain critical accounting estimates. It also requires management to exercise
its judgment in the process of applying the Corporation’s accounting policies. The areas involving
a higher degree of judgment or complexity or areas where assumptions and estimates are
significant to the financial statements are disclosed below:
Pension obligation (gratuity)
The present value of the pension obligation depends on a number of factors that are determined
on an actuarial basis using a number of assumptions. These assumptions used in determining the
cost of pension including the discount rate. Any change in these assumptions will impact the
carrying amount of pension obligation.
The management determines the appropriate discount rate at the end of each year. This is the
interest rate that should be used in determining the present value of estimated future cash flows
expected to be required to settle the pension obligation. In determining the discount rate,
management considers the interest rates of government bonds in the absence of deep market for
corporate bonds in Sri Lanka. Other key assumptions for pension obligation are based on current
market conditions.

43
Impairment of available-for-sale equity instruments
The Corporation follows the guidance of LKAS 39 to determine when an available-for-sale equity
instrument is impaired. This determination requires significant judgment. In making this
judgment, the management evaluates among other factors, the duration and extent to which the
fair value of an investment is less than its cost and the financial health of and short term business
outlook for the investee, including factors such as industry and sector performance, changes in
technology and operational and financing cash flows.
2.3 Summary of Significant Accounting Policies
2.3.1 Foreign Currency Transactions
.
The Financial Statements are presented in Sri Lanka Rupees, which is the
Corporation’s functional and presentation currency
Transactions in foreign currencies are initially recorded at the functional currency rate
ruling at the date of the transaction. Monetary assets and liabilities denominated in foreign
currencies are re-translated at the functional currency rate of exchange ruling at the
balance sheet date. All differences are taken to Income Statement. Non-monetary items
that are measured in terms of historical cost in a foreign currency are translated using the
exchange rates as at the dates of the initial transactions. Non-monetary items measured at
fair value in foreign currency are translated using the exchange rates at the date when the
fair value is determined.
2.3.2 Taxation
Current Tax
Tax expenses for the period comprise the current and deferred tax. Current income tax
assets and liabilities for the current and prior periods are measured at the amount expected
to be recovered from or paid to the taxation authorities. The tax rates and tax laws used to
compute the amount are those that are enacted or substantively enacted by the balance
sheet date.
The provision for income tax is based on the elements of income and expenditure as
reported in the Financial Statements and computed in accordance with the provisions of
the Inland Revenue Act No. 10 of 2006 and the amendments thereto. However, during
the current year, no tax liability has arisen due to loss making position of the Corporation
and five year tax holiday granted with effect from year of assessment 2011/12.

44
Deferred Taxation
Deferred income tax is provided, using the liability method, on temporary differences at
the balance sheet date between the tax bases of assets and liabilities and their carrying
amounts for financial reporting purposes.
Deferred income tax liabilities are recognized for all taxable temporary differences except
where the deferred income tax liability arises from the initial recognition of an asset or
liability in a transaction that is not a business combination and, at the time of transaction,
affects neither the accounting profit nor taxable profit or loss.
Deferred income tax assets are recognized for all deductible temporary differences, carry-
forward of unused tax assets and unused tax losses, to the extent that it is probable that
taxable profit will be available against which the deductible temporary differences, and
the carry-forward of unused tax assets and unused tax losses can be utilized except where
the deferred income tax asset relating to the deductible temporary differences arises from
the initial recognition of an asset or liability in a transaction that is not a business
combination and, at the time of the transaction, affects neither the accounting profit nor
the taxable profit or loss.
The carrying amount of deferred income tax assets is reviewed at each balance sheet
date and reduced to the extent that it is no longer probable that sufficient taxable profit
will be available to allow all or part of the deferred income tax asset to be utilized.
Deferred income tax assets and liabilities are measured at the tax rates that are expected
to apply to the year when the asset is realized or the liability is settled, based on tax rates
(and tax laws) that have been enacted or substantively enacted at the balance sheet date.
Deferred income tax relating to items recognized directly in equity is recognized in equity
and not in the income statement.
Sales Tax
Revenues, expense and assets are recognized net of the amount of sales tax except where
the sales tax incurred on a purchase of assets or service is not recoverable from the taxation
authorities in which case the sales tax is recognized as a part of the cost of the asset or part
of the expense items as applicable and receivable and payable that are stated with the
amounts of sales tax included. The amount of Sales tax recoverable and payable in respect
of taxation authorities is included as a part of receivable and payables in the Balance Sheet.

45
2.3.3 Borrowing Costs
General and specific borrowing costs directly attributable to the acquisition, construction
or production of qualifying asset, which are assets that necessarily take a substantial period
of time to get ready for their intended use or sell, are added to the costs of those assets
until such time as the assets are substantially ready for their intended use or sale.
2.3.4. Inventories
Inventories are valued at the lower of cost and net realizable value, after making due
allowances for obsolete and slow moving items. Net realizable value is the price at which
inventories can be sold in the ordinary course of business less the estimated cost of
completion and the estimated cost necessary to make the sale.
The cost incurred in bringing inventories to its present location and conditions are
accounted using the following cost formulae:
Raw Materials - At purchase cost on first-in-first-out basis
Finished Goods
a) Refined Products
- At the cost of direct materials, direct labour and an
appropriate proportion of manufacturing overheads
based on normal operating capacity, but excluding
borrowing Costs.
b) Imports - At purchase cost on first-in-first-out basis
Work-in-progress
a) Refined Products - At the cost of direct materials, direct labour and an
appropriate proportion of manufacturing overheads
based on normal operating capacity, but excluding
borrowing costs.
b) Imports - At purchase cost on first-in-first-out basis
Other Finished Goods - At purchase cost on weighted average basis
Consumables & Spares - At purchase cost on weighted average basis

46
2.3.5 Trade and Other Receivables
Trade receivables are amounts due from customers for selling fuel. Trade receivable are
recognized initially at fair value and subsequently measured at amortized cost using
effective interest method. Other receivables and dues from Related Parties are recognized at
cost less provision for impairment.
2.3.6 Cash and Cash Equivalents
Cash and cash equivalents are cash in hand, demand deposits and short-term highly liquid
investments, readily convertible to known amounts of cash and subject to insignificant
risk of changes in value.
For the purpose of cash flow statement, cash and cash equivalents consist of cash in hand
and deposits in banks net of outstanding bank overdrafts.
Investment with short maturities i.e. three months or less from the date of acquisition is
also treated as cash equivalent.
2.3.7 Property, Plant & Equipment
Plant and equipment is stated at cost, excluding the costs of day to day servicing, less
accumulated depreciation and accumulated impairment in value. Such cost includes the
cost of replacing part of the plant and equipment when that cost is incurred, if the
recognition criteria are met.
Land and buildings are measured at cost less depreciation on buildings.
The asset’s residual values, useful lives and methods of depreciation are reviewed, and
adjusted if appropriate, at each financial year end.
2.3.8 Measurement
An item of property, plant & equipment that qualifies for recognition as an asset is initially
measured at its cost of purchase directly attributable to the acquisition of the asset or
construction or valuation together with any incidental expenses thereon.
The cost of self-constructed assets included the cost of materials and direct labour or any
other costs directly attributable to bringing the asset to a working condition for its intended
use and the costs of dismantling and removing the items and restoring the site on which
they are located.

47
2.3.9 Cost Model
CPC applies cost model to plant & equipment and records at cost of purchase or
construction together with any incidental expenses thereon, less accumulated depreciation
and any accumulated impairment losses.
2.3.10 Subsequent Costs
The cost of replacing part of an item of property, plant & equipment is recognized in the
carrying amount of the item if it is probable that the future economic benefits embodied
within that part will flow into the CPC and its cost can be reliably measured.
2.3.11 Restoration Costs
The cost incurred on repairs and maintenance of property, plant & equipment in order to
restore or maintain future economic benefits is charged to Income Statement as incurred.
2.3.12 De-recognition
The carrying amount of an item of property, plant & equipment is derecognized on
disposal or when no future economic benefits are expected from its use or disposal. The
gain or loss arising from the derecognition of an item of property, plant & equipment is
included in the Income Statement when the item is derecognized.
2.3.13 Depreciation
CPC provides depreciation on straight-line basis over the periods appropriate to the
estimated useful lives of the different types of assets.
Provisioning for depreciation of property, plant & equipment is made on pro-rata basis.
The depreciation is calculated on a straight-line basis over the useful life of the assets.

48
Depreciation rates are as follows :-
Category of Assets Percentage
Freehold Land Nil
Buildings 2.5
New Head Office Building 2
Refinery Tanks & Pipelines 2.5
Refinery Plant & Machinery 10
Other Location Tanks 2.5 or 5
Other Location Pipelines 10 or 20
Plant & Machinery 10 or 20
Bowsers & Tank Lorries 20
Vans & Coaches 25
Fur/Fittings & Office Equip Upto 31/12/98 100
Fur/Fittings & Office Equip wef 31/12/99 33 1/3
SPM Facility – Tank Farm 2.5
- Pipelines 5
- Buoy 10 Aviation Facilities at Mattala Airport
-Fuel hydrant System 2.5
-Tanks 20
Pipelines 5
Gantries & Pumps 10
2.3.14 Capital Work in Progress
Capital work-in-progress is stated at cost. These are expenses of a capital nature directly
incurred in the construction of buildings, major plant and machinery and system
development, awaiting capitalization.
2.3.15 Impairment of non-financial assets
Property, plant and equipment are reviewed for impairment whenever events or changes
in circumstances indicate that the carrying amount may not be recoverable. An impairment
loss is recognized for the amount by which the assets carrying amount exceeds its
recoverable amount. The recoverable amount is the higher of an asset’s fair value less cost
to sell and value in use.
For the purpose of assessing impairment, assets are grouped at the lowest levels for which
there are separately identifiable cash flows (cash generating units). Non financial assets
that suffered impairment are reviewed for possible reversal of the impairment at each
reporting date.

49
2.3.16 Borrowing Costs
Borrowings are recognized initially at fair value, (net of transaction cost incurred).
Borrowings are subsequently carried at amortized cost; any difference between the
proceeds (net of transaction costs) and the redemption value is recognized in the
comprehensive income statement over the period of borrowings using the effective
interest method.
Fees paid on the establishment of a loan facility are recognized as transaction costs of the
loan to the extent that it is probable that some or all of the facility will be drawn. In this
case, the fee is deferred until the draw down occurs. To the extent there is no evidence
that it is probable that some or all of the facility will be drawn down the fee is capitalized
as a prepayment for liquidity services and amortized over the period of the facility which
it relates.
2.3.17 INVESTMENTS
2.3.17.1 Investment in Subsidiaries
Investments in Subsidiaries are accounted under the cost method of accounting in CPC’s
Financial Statements in accordance with the Sri Lanka Accounting Standard No. 26
(Revised 2005) on Consolidated and Separate Financial Statements.
Accordingly, investments in Subsidiaries are stated in the CPC’s Balance Sheet at cost, less
impairment losses, if any.
2.3.18 Investment Properties
2.3.18.1 Basis of Recognition
Investment property is property that is held to earn rentals or for capital appreciation or
both and the future economic benefits that are associated with the investment property but
not for sale in the ordinary course of business.

50
2.3.18.2 Measurement
Investment property is accounted for under cost method in the Financial Statements.
Accordingly, after recognition as an asset, the property is carried at its cost, less
accumulated depreciation and impairment losses.
2.3.18.3 Depreciation
Depreciation is provided on a straight-line basis over the estimated life of the class of asset
from the date of purchase up to the date of disposal.
2.3.18.4. De-recognition
Investment properties are derecognized when disposed of, or permanently withdrawn from
use because no future economic benefits are expected. Transfers are made to and from
investment property only when there is a change in use.
3. PROVISIONS & LIABILITIES
3.1 Provisions
Provisions are recognized when the Corporation has a present obligation (legal or constructive)
as a result of a past event, where it is probable that an outflow of resources embodying economic
benefits will be required to settle the obligation and a reliable estimate can be made of the amount
of the obligation. When the company expects some or all of a provision to be reimbursed, the
reimbursement is recognized as a separate asset but only when the reimbursement is virtually
certain. The expense relating to any provision is presented in the income statement net of any
reimbursement. If the effect of the time value of money is material, provisions are determined by
discounting the expected future cash flows at a pre-tax rate that reflects current market
assessments of the time value of money and, where appropriate, the risks specific to the liability.
Where discounting is used, the increase in the provision due to the passage of time is recognized
as an interest expense.

51
3.2 Provision of Gratuity
A provision is made in the financial statement for retirement gratuities from the first year of
service for all employees. The liability recognized in the balance sheet in respect of
Gratuity is the present value of the obligation at the end of the reporting period. CPC has
calculated the retirement benefits costs using the projected unit credit method as recommended
in LKAS -19. The present value of the defined benefit obligation is determined by discounting
the estimated future cash flows using interest rates of government bonds, in the absence of a deep
market for corporate bonds in Sri Lanka.
Actuarial gains / losses arising from experienced adjustments and changes in actuarial
assumptions are charged or credited to equity in other comprehensive income in the period in
which they arise, past service costs are recognized immediately in the comprehensive income
statement.
3.3 Defined Contribution Plans – Employees’ Provident Fund &
Employees’ Trust Fund
Employees are eligible for Employees’ Provident Fund Contributions and Employees’ Trust Fund
contributions in line with the respective statutes and regulations. The Corporation contributes
15% and 3% of gross emoluments of employees to Employees’ Provident Fund and Employees’
Trust Fund respectively.
3.4 Capital Reserve
Specific amounts received from Government Consolidated Fund and the net value of restructuring
sale proceeds which eventually form the issued capital of the successor to Ceylon Petroleum
Corporation are credited to a Capital Reserve.
3.5 Trade payables
Trade payables are obligations to pay the suppliers of the Corporation in the ordinary course of
the business. Payables are recognized initially at fair value and subsequently measured at
amortized cost.
3.6 Financial Instruments
Financial assets and liabilities are recognized when the Corporation becomes a party to the
contractual provisions of the instrument. Financial assets are derecognized when the rights to
receive cash flows from the assets have expired or have been transferred and the Corporation has
transferred substantially all risks and rewards of ownership. Financial liabilities are derecognized
when the obligation specified in the contract is discharged, cancelled or expires.

52
At initial recognition, the Corporation classifies its financial instruments in the following
categories:
(i) Available-for-sale investments
Available for sales investments are non-derivatives that are either designated in this
category or not classified in any of the other category. The Corporation’s available for
sale assets comprise investments in equity securities, (both listed and non-listed) other
than those qualifying as cash equivalents.
(ii) Loans and receivable
Loans and receivables are non-derivative financial assets with fixed or determinable
payments that are not quoted in an active market. The Corporation’s loans and receivables
comprise trade receivables, staff loans and cash equivalents, and are included in both
current and non-current asset. Loans and receivables are
Initially recognized at the amount expected to be received, less, when material, a discount
to reduce the loans and receivables to fair value. Subsequently, loans and
Receivables are measured at amortized cost using the effective interest method less a
provision for impairment.
(iii) Financial liabilities at amortized cost
Financial liabilities at amortized cost include trade payables, bank debt and long term debt.
Trade payables are initially recognized at the amount required to be paid, less, when
material, a discount to reduce the payable to fair value.
Impairment of financial assets
At each reporting date, the Corporation assesses whether there is objective evidence that
a financial asset is impaired. The criteria used to determine if objective evidence of an
impairment loss include:
(i) significant financial difficulty of the obligor;
(ii) delinquencies in interest of principle payment; and
(iii) It becomes probable that the borrower will enter bankruptcy or other financial
reorganization.

53
For equity securities, a significant or prolonged decline in the fair value of the security
below its cost is also evidence that the assets are impaired. If such evidence exists, the
Corporation recognizes an impairment loss, as follows:
(i) financial assets carried at amortized cost : The loss is the difference between the
amortized cost of the loan or receivables and the present value of the estimated
future cash flows, discounted using the instrument’s original effective interest rate.
The carrying amount of the asset is reduced by this amount either directly or
indirectly through the use of an allowance account.
(ii) Available for sale financial asset: The impairment loss is a difference between the
original cost of the asset and its fair value at the measurement date, less any
impairment losses previously recognized in the statement of comprehensive
income. This amount represents the loss in accumulated other comprehensive
income that is re-classified to net income.
Impairment losses on financial assets carried at amortized cost are reversed in subsequent periods if the
amount of the loss decreases and the decrease can be related objectively to an event occurring after the
impairment was recognized.
Impairment losses on available for sale equity instruments are not reversed.
4. INCOME STATEMENT
4.1 Revenue Recognition
Revenue is the gross inflow of economic benefits during the period arising in the course of
ordinary activities of an entity when those inflows result in equity, other than increases relating
to contribution from equity participants.
Revenue is measured at the fair value of consideration received or receivable net of trade
discounts and sales taxes. The following specific criteria are used for the purpose of recognition
of revenue.
4.2 Sale of Goods
Revenue from the sale of goods is recognized when the significant risks and rewards of ownership
of the goods have passed to the buyer, usually on dispatch of the goods.
4.3 Interest Income & Expenses
Interest expenses and income are recognized on accrual basis.

54
4.4 Dividends
Dividend Income is recognized when the shareholders’ right to receive the payment is established.
4.5 Rental Income
Rental income is accounted for on a straight-line basis over the lease terms.
4.6 Profit/(Loss) from Sale of Property, Plant & Equipment& Other Income
Profit/loss arising from sale of property, plant & equipment is recognized in the period in which
the sale occurs and is classified as other income.
4.7 Gains or Losses arising from Investment Securities
Gains or losses arising from the sale of equity shares and financial instruments accounted for on
the date on which the transaction takes place.
4.8 Operating Expenses
All the expenses payable are recognized on accrual basis in the Income Statement to the period
to which they relate.
5. CONTINGENT LIABILITIES, COMMITMENTS & LITIGATION
Contingent liabilities are the possible obligations whose existence will be confirmed only by
uncertain future events or present obligations where the transfer of economic benefit is not
probable or cannot be reliably measured. Contingent liabilities are not recognized in the Balance
Sheet but are disclosed, unless they are remote.
Current litigation mainly involves the recovery process wherein the CPC files cases against the
defaulting customers with a view to recover debt through judicial process.
Litigation also includes worker disputes before the labour tribunals and other agencies like
Human Rights Commission, Parliamentary Ombudsman amicably settled or mostly decided in
favour of the CPC. Except for the disclosures made in Hedging transactions, CPC is of the opinion
that they will not cause any material impact on the financial stability of the CPC and therefore,
no related provisions are made.
In addition to the above, there is a case pending at Supreme Court against CPC and there are four
cases before the High Court relating to import of Petroleum products and there are two
Arbitrations before the Arbitration Tribunal in relation to Crude Oil import treated matter .CPC

55
is of the opinion that they will not cause any material impact on the financial stability of the CPC
and therefore, no related provision are made.
There were 203 unsettle court cases against CPC and 37 unsettle court cases against CPSTL as at
end of the year 2014.The details are given below:
Type of case No of cases against CPC No of cases against CPSTL
Labour Department Inquiry 22 06
Industrial Court Attribution 09 -
Labour Tribunal 03 06
Human Right Commission 23 -
Commercial Arbitration 02 -
Magistrate Court 03 03
District Court 111 13
High Court 11 05
Court of Appeal 13 04
Supreme Court 06 -
Total 203 35
6. DIRECTOR’S INTEREST IN CONTRACTS
No Directors has direct or indirect interest in the contracts with the CPC & CPSTL except for the
disclosures noted below:-
CPC has appointed following three Directors to the Board of CPSTL of which CPC has two
third of share interest.
Mr. L E Susantha Silva - Director
Mr. B Saman Kumara - Director
Mr. A. H. S. Wijesinghe - Director
Mr. L E Susantha Silva is a Non-Executive Director of Housing Development of Finance
Corporation (HDFC) and Open University of Sri Lanka.
CPSTL is a company which engages in storage and distribution of liquid petroleum products
within Sri Lanka. CPC has paid throughput charges amounting to Rs. 8.56 Bn. in the year 2014
to CPSTL. The Director’s fees are paid in terms of the provisions in the Public Enterprises
Circular No. PED 58 dated 29 April 2011.

56
7. EVENTS AFTER THE BALANCE SHEET DATE
All the material events after the Balance Sheet date, if any and where necessary have been
considered and appropriate adjustments/disclosures have been made in the Financial Statements.
8. DIRECTOR’S RESPONSIBILITY STATEMENT
The Board of Directors takes the responsibility for the preparation and presentation of these
Financial Statements.

57
CPC CPC GROUP GROUP
2014 2013 2014 2013
Rs. Mn Rs. Mn Rs. Mn Rs. Mn
1. REVENUE
Sale of Petroleum Products 525,182.094 490,381.492 525,182.094 490,381.492
Terminal Charges & Other Income - - 1,986.618 584.743
525,182.094 490,381.492 527,168.712 490,966.235
2. COST OF SALES.
As Per Gross Margin 498,966.998 463,990.551 498,966.998 463,990.551
Operation Loss/Gain 800.228 383.616 800.228 383.616
Exchange Variation (Crude/Bulk) 967.489 3,263.767 967.489 3,263.767
Direct Expenses & others 6,878.642 6,442.161
500,734.715 467,637.934 507,613.357 474,080.094
- -
3. OTHER OPERATING INCOME
Dividend Income 437.500 0.007 437.500 0.007
Staff Loan Interest 504.206 199.806 738.430 199.806
Rent Income 50.009 46.674 45.636 54.712
Profit on sales of Filling station equipment 25.940 21.689 30.730 21.689
Sundry Income 81.142 53.801 303.965 176.110
1,098.797 321.978 1,556.261 452.324
4.KEROSEN SUBSIDY
For the year 2014 2,715.000 2,715.000 -
2,715.000 - 2,715.000 -
5.INCOME ON INVESTMENT PROPERTY
Flower / Thurstan Road Building & Rental Filling Station 51.823 52.015 51.823 52.015
6. SELLING & DISTRIBUTION EXPENSES
Selling And Distribution Cost 9,808.893 10,336.419 956.317 836.987
Aviation Cost 1,345.368 1,264.878 425.288 399.710
Deprecation 378.551 363.955 378.551 363.955
11,532.812 11,965.252 1,760.156 1,600.652
7. ADMINISTRATIVE EXPENSES
Administrative Cost 3,172.033 3,764.642 6,350.356 (6,284.850)
VAT on Sales of Assrts -2003 1,303.291 - 1,303.291 -
Turnover Tax on Bunker fuel sold to LMS 446.863 - 446.863 -
4,922.187 3,764.642 8,100.510 (6,284.850)
8. FINANCE CHARGES
Interest on Long Term Loans 71.782 82.416 71.782 82.416
Interest on Bank Overdrafts 30.346 37.898 30.346 37.898
Interest on Foreign Bills Payables & Other Bank Loans 13,156.730 18,419.534 13,156.730 18,419.534
Loss on Treasury Bond 702.717 - 702.717 -
13,961.574 18,539.848 13,961.574 18,539.848
9. FINANCE INCOME
Treasury Bill Interest Income 1,222.395 925.518 1,222.395 950.037
Intrest on Deposits 28.697
Interest on R.F.C. A/C 1.801 18.707 1.801 18.707
Interest on Credit invoice 115.698 65.944 115.698 65.944 Interest CEB/IPP/Aviation Customers 1,961.930 2,252.615 1,961.930 2,252.615
Intrest on Treasury Bonds 655.409 - 655.409 -
3,957.234 3,262.784 3,985.931 3,287.303
NOTES TO THE FINANCIAL STATEMENTS

58
10. PROPERTY, PLANT & EQUIPMENT
GROUP
Cost Land & Vested Plant, Mach SPM Motor Furn/Fittings
Buildings Property & Equip Facility Vehicles Off. Equip & Total
Other Assets
Rs.Mn Rs.Mn Rs.Mn Rs.Mn Rs.Mn Rs.Mn Rs.Mn Rs.Mn
Bal as at 01/01/2014 3,255.167 1.016 4,268.001 2,142.422 478.249 1,926.439 12,071.294 39,198.340
Additions 1,063.252 4,282.908 38.828 225.548 5,610.536 5,828.416
Disposals (2.099) (2.426) (4.525) (11.427)
-
Bal as at 31/12/2014 4,318.419 1.016 8,548.810 2,142.422 514.651 2,151.987 17,677.305 45,015.329
4.2 Depreciation
Bal as at 01/01/2014 379.904 0.397 3,381.909 1,290.634 251.928 1,409.074 6,713.847 15,933.894
Charge for the Year 92.595 417.518 31.757 92.385 634.256 1,528.035
Disposals (0.462) (2.426) (2.888) (9.748)
Bal as at 31/12/2014 472.499 0.397 3,798.965 1,290.634 281.259 1,501.459 7,345.215 17,452.181
Net Book Value as at 31.12.2014 3,845.920 0.619 4,749.845 851.788 233.392 650.528 10,332.090 27,563.147
Net Book Value as at 31.12.2013 2,875.263 0.619 886.091 851.788 226.321 517.365 5,357.446 23,264.444
Net Book Value as at 01.01.2013 2,914.384 0.628 903.296 851.788 150.346 607.512 5,428.585 24,423.710
10.1 Assets and Capital Project in Progress
31.12.2014 31.12.2013 01.01.2013 31.12.2014 31.12.2013 01.01.2013
Restated Restated Restated Restated
Rs.Mn Rs.Mn Rs.Mn Rs.Mn Rs.Mn Rs.Mn
Refinery Expansios projet(SOREM) 837.628 837.454 809.102 837.628 837.454 809.102
Buildings 126.275 18.163 15.888 126.275 18.163 15.888
Plant & Machinery 2,119.661 2,197.081 15.004 2,119.661 2,197.081 15.004
Storage Facility 70.024 168.539 2,185.169 70.024 168.539 2,185.169
Re-structuring of Filling Stations 3.736 3.736 3.736 3.736 3.736 3.736
Others 102.054 4,528.225 1,114.717 159.421 4,594.279 1,175.338
3,259.378 7,753.198 4,143.616 3,316.745 7,819.252 4,204.237
10.2. Net Book Values
Property Plant & Equipment 10,332.089 5,357.446 5,428.585 27,563.147 23,264.444 24,423.710
Assets & Capital Projects in Progress 3,259.378 7,753.198 4,143.616 3,316.745 7,819.252 4,204.237
Total Carrying Amount of Property , Plant & Equipments 13,591.467 13,110.644 9,572.201 30,879.893 31,083.696 28,627.947
CPC
CPC GROUP
NOTES TO THE FINANCIAL STATEMENTS

59
10.3 Investment Prpoperty
31.12.2014 31.12.2013 01.01.2013 31.12.2014 31.12.2013 01.01.2013
Restated Restated Restated Restated
Rs.Mn Rs.Mn Rs.Mn Rs.Mn Rs.Mn Rs.Mn
Gross carrying amount
Cost
Balance as at 1.1. 33.570 33.570 32.344 33.570 33.570 32.344
Add: Additions - - 1.226 - - 1.226
Balance as at 31.12 33.570 33.570 33.570 33.570 33.570 33.570
Depreciation
Balance as at 1.1. 7.404 6.600 5.653 7.404 6.600 5.653
Add: Charge for the year 0.804 0.804 0.947 0.804 0.804 0.947
Balance as at 31.12 8.208 7.404 6.600 8.208 7.404 6.600
Net Book Value 25.362 26.166 26.970 25.362 26.166 26.970
No fair value carried out at the balance sheet date and step will be taken to obtain professional valuation in 2015.
10.4 The useful lives of the assets is estimated as follows 2014 2013
Freehold Land Nil Nil
Buildings 40 Years 40 Years
New Head Office building 50 Years 50 Years
Refinery Tanks & Pipelines 40 Years 40 Years
Refinery Plant & Machinery 10 Years 10 Years
Other Location Tanks 40 or 20 Years 40 or 20 Years
Other Locations Pipelines 10 or 5 Years 10 or 5 Years
Plant & Machinery 10 or 5 Years 10 or 5 Years
Bowsers & Tank Lorries 5Years 5Years
Vans & Coaches 4Years 4Years
Furniture/Fittings & Office Equipments up to 31.12.1998 Fully Fully
Furniture/Fittings & Office Equipments up to 31.12.1999 3 Years 3 Years
SPM Facility - Tank Farm 40 Years 40 Years
- Pipelines 20 Years 20Years
Aviation Facilities at Mattala Airport
Fuel Hydrant System 40 Years -
Tanks 5Year -
Pipeline 20 Years -
Grantries & Pumps 10 Years -
10.5 Intangible Assets
Sap ERP User Automation of
ERP Project License Offshore Pipeline Total
Project
Cost of Valuation
Balance at 1st January 2014 412.497 9.380 37.794 459.670
Additions
Transfers - - - -
As at 31st December 2014 412.497 9.380 37.794 37.794
Accumulative Depreciation and Impairment
As at January 2014 308.539 2.358 9.480 320.377
Charge for the Year 91.935 91.935
Transfers
As at 31st December 2014 400.474 2.358 9.480 412.313
Net Book Value
As at 31st December 2014 12.022 7.022 28.313 47.358
As at 31st December 2013 103.958 7.022 28.313 139.293
As at 1st January 2013 184.657 8.898 35.873 229.428
CPC GROUP
NOTES TO THE FINANCIAL STATEMENTS

60
31.12.2014 31.12.2013 01.01.2013 31.12.2014 31.12.2013 01.01.2013
Restated Restated Restated Restated
Rs.Mn Rs.Mn Rs.Mn Rs.Mn Rs.Mn Rs.Mn
11. INVESTMENTS
Investment in Associated Company
Unquoted
Ceylon Petroleum Storage Terminals Ltd. 5,000.000 5,000.000 5,000.000 - - -
Additions to Investments - - -
5,000.000 5,000.000 5,000.000 - - -
31.12.2014 31.12.2013 01.01.2013 31.12.2014 31.12.2013 01.01.2013
Restated Restated Restated Restated
Rs.Mn Rs.Mn Rs.Mn Rs.Mn Rs.Mn Rs.Mn
12. NON CURRENT FINANCIAL ASSETS
Quated equity investments 12.1 33.000 33.000 47.500 33.000 33.000 47.500
Unquoted equity investments 12.2 5.626 5.626 5.626 5.626 5.626 5.626
Non equity investments 12.3 5.000 5.000 5.000 5.000 5.000 5.000
43.626 43.626 58.126 43.626 43.626 58.126
12.1.Quated equity investments
Lanka Cement Ltd. 47.500 47.500 99.000 47.500 47.500 99.000
5,000,000 Ordinary Shares of Rs.10/= each fully paid
Fair value transfer to equity (14.500) (14.500) (51.500) (14.500) (14.500) (51.500)
33.000 33.000 47.500 33.000 33.000 47.500
12.2.Unquoted equity investments
Associated News Papers of Ceylon Ltd.
61,206 Ordinary Shares of Rs.10/= each
fully paid. 0.539 0.539 0.539 0.539 0.539 0.539
Lanka Leyland Ltd.
100 Ordinary Shares of 10/= each
fully paid. 0.001 0.001 0.001 0.001 0.001 0.001
International Coop/Petroleum association - -
5,499 Shares of Us $ 100/= each fully paid - -
Incorporated in USA 5.086 5.086 5.086 5.086 5.086 5.086
5.626 5.626 5.626 5.626 5.626 5.626
12.3.Non equity investments
Investment in Fixed Deposits 5.000 5.000 5.000 5.000 5.000 5.000
5.000 5.000 5.000 5.000 5.000 5.000
CPC GROUP
CPC GROUP
NOTES TO THE FINANCIAL STATEMENTS

61
Rs. Mn Rs. Mn Rs. Mn Rs. Mn Rs. Mn Rs. Mn
With in After With in After With in After
one Year one Year one Year one Year one Year one Year
13 . TRADE & OTHER RECEIVABLE
Trade Receivables 36,879.361 - 53,147.185 97,378.53 4,457.345
Other Receivables 12,045.620 857.64 1,593.196 1,863.125 3,251.512 697.321
Deposits 24.818 51.94 13.685 260.127 12.297
Advance 3,091.563 - 375.128 499.601
Prepayments 278.561 - 178.206 221.211
Loans & Advances to Employees 50.262 2,497.35 31.806 2,242.560 39.865 1,729.378
Available for sales -Investments 9,983.931 - 30,690.486 9,226.94
62,354.116 3,406.923 86,029.692 4,365.812 110,629.953 6,884.044
Rs. Mn Rs. Mn Rs. Mn Rs. Mn Rs. Mn Rs. Mn
With in After With in After With in After
one Year one Year one Year one Year one Year one Year
Trade Receivables 44,443.092 53,945.429 - 97,763.12
Other Receivables 3,491.119 0.52 165.088 1,863.125 3,467.08 12,255.764
Deposits 228.218 51.94 297.858 260.127 12.30 697.32
Advance 3,091.563 - 375.128 - 591.57
Prepayments 278.561 - 178.206 - 221.21
Loans & Advances to Employees 2,178.951 2,497.35 2,126.114 2,242.560 2,434.49 1,729.38
Available for sales -Investments 9,983.931 - 30,690.486 -
63,695.436 2,549.808 87,778.309 4,365.812 104,489.763 14,682.463
All non-current receivables are due within five years from the end of the reporting period.
The fair values of staff loans (except for distress loans) are initially recognized at fair value by discounting the cash flows using the
market based interest rate of 10%.
As of 31 December 2014, CPC's trade receivable of Rs. 45.272 Mill. were impaired.The amount of the impairment provision was Rs. 3.234
as at 31 Dec 2014.The ageing of these trade receivables is as follows.
31.12.2014 31.12.2013 01.01.2013
Restated Restated
2 to 3 years Rs.Mn Rs.Mn
4 to 5 years4.635 5.291 5.291
Over 5 years 2.118 2.76 2.76
38.520 34.44 34.44
45.272 42.491 42.491
Movement on the provision for imparement of trade receivables are as follows.
31.12.2014 31.12.2013 01.01.2013
Restated Restated
Balance as at 1st January 42.491 43.002 43.002
Less: Amount Recovered (0.426) (5.793) (5.793)
Less: Amount write off (0.027) (0.010) (0.010)
Add: Provision for the year 3.234 5.291 5.291
Balance as at 31st December 45.272 42.491 42.491
CPC
CPC
Restated Restated
Restated Restated
CPC
31.12.2014 31.12.2013 01.01.2013
GROUP
31.12.2014 31.12.2013 01.01.2013
NOTES TO THE FINANCIAL
STATEMENTS

62
31.12.2014 31.12.2013 01.01.2013 31.12.2014 31.12.2013 01.01.2013
Restated Restated Restated RestatedRs.Mn Rs.Mn Rs.Mn Rs.Mn Rs.Mn Rs.Mn
14. INVENTORIES
Crude Oil 16,731.368 24,231.471 13,955.461 16,731.368 24,231.471 13,955.461
Other Raw material 934.465 909.535 1,002.053 934.465 909.535 1,002.053
Finished Products 43,716.072 37,870.141 45,577.316 43,716.072 37,870.141 45,577.577
Other Materials & Supplies 2,768.295 2,389.175 2,023.202 3,334.592 2,957.256 2,533.651
Less: Provision for Non Moving Items (380.134) (364.028) (364.113) (578.338) (535.869) (514.352)
63,770.066 65,036.294 62,193.919 64,138.159 65,432.534 62,554.390
31.12.2014 31.12.2013 01.01.2013 31.12.2014 31.12.2013 01.01.2013
Restated Restated Restated Restated
Rs.Mn Rs.Mn Rs.Mn Rs.Mn Rs.Mn Rs.Mn
15. CASH AND CASH EQUIVALENTS
Components of Cash and Cash Equivalents
Cash & Bank Balances 21,474.788 6,134.526 11,623.634 23,380.517 11,388.052 12,085.561
21,474.788 6,134.526 11,623.634 23,380.517 11,388.052 12,085.561
Cash and cash equivalents include the following for the purpose of the statement of cash flows:
Cash and cash equivalents 21,474.788 6,134.526 11,623.634 23,380.517 11,388.052 12,085.561
Bank overdrafts - (8,365.51) - - (8,537.06) (365.08)
21,474.788 (2,230.984) 11,623.634 23,380.517 2,850.991 11,720.479
Add/Less: Adjustment for foreign currency translation (3,671.613) (5,068.406) (4,688.548) (3,671.613) (5,068.41) (4,688.548)
17,803.175 (7,299.390) 6,935.086 19,708.904 (2,217.415) 7,031.931
31.12.2014 31.12.2013 01.01.2013 31.12.2014 31.12.2013 01.01.2013
Restated Restated Restated Restated
Rs.Mn Rs.Mn Rs.Mn Rs.Mn Rs.Mn Rs.Mn
16. CONTRIBUTED CAPITAL
Initial Contribution in Pursuance of Section
23 of Act No 28 of 1961 10.000 10.000 10.000 10.000 10.000 10.000
Voted by Appropriation Act no 23 of 1964 4.000 4.000 4.000 4.000 4.000 4.000
Voted by Appropriation Act no 15 of 1967 20.000 20.000 20.000 20.000 20.000 20.000
Contribution to Capital in 1976 60.000 60.000 60.000 60.000 60.000 60.000
Contribution to Capital in 1979 13.110 13.110 13.110 13.110 13.110 13.110
Contribution to Capital in 1980 10.710 10.710 10.710 10.710 10.710 10.710
Total Contributed by Govt.of Sri Lanka 117.820 117.820 117.820 117.820 117.820 117.820
Transferred from General Reserve in 1987 750.000 750.000 750.000 750.000 750.000 750.000
Transferred from Retained Profits in 1987 132.180 132.180 132.180 132.180 132.180 132.180
1,000.000 1,000.000 1,000.000 1,000.000 1,000.000 1,000.000
( No authorized capital has been fixed by the Parliament.)
1/3 rd of CPSTL Company Shares held by the General Treasury was transferred
to CPC after Cabinet decision. 2,500.000 2,500.000 2,500.000 2,500.000 2,500.000 2,500.000
3,500.000 3,500.000 3,500.000 3,500.000 3,500.000 3,500.000
CPC GROUP
CPC GROUP
CPC GROUP
NOTES TO THE FINANCIAL
STATEMENTS

63
31.12.2014 31.12.2013 01.01.2013 31.12.2014 31.12.2013 01.01.2013
Restated Restated Restated Restated
Rs.Mn Rs.Mn Rs.Mn Rs.Mn Rs.Mn Rs.Mn
17. CAPITAL RESERVE
Balance as at 01st January 4,992.686 4,992.686 4,992.686 4,992.686 4,992.686 4,992.686
Balance as at 31st
December 4,992.686 4,992.686 4,992.686 4,992.686 4,992.686 4,992.686
31.12.2014 31.12.2013 01.01.2013 31.12.2014 31.12.2013 01.01.2013
Restated Restated Restated Restated
Rs.Mn Rs.Mn Rs.Mn Rs.Mn Rs.Mn Rs.Mn
18. LOANS & BORROWINGS
L.T. Loans not assigned to CPSTL
Treasury (A.D.B) Loan - (Interest 14.0% p.a.) repayable in forty 1/2 417.777 493.736 569.695 417.777 493.736 569.695
yearly installments of Rs.37.977 Mil each commencing July ' 01.
L.T. Loans assigned to CPSTL
Treasury (Exim Bank) Loan - (Interest 12 .0 p.a %) repayment commencing 285.705 857.114 1,428.523 285.705 857.114 1,428.523
Oct. 2004 in 24 equal 1/2 yearly installments of final Loan value
Peoples Bank Term Loan 1,886.649 2,374.451 2,523.204
703.482 1,350.850 1,998.218 2,590.131 3,725.301 4,521.422
18.1 CURRENT PORTION OF LOANS & BORROWINGS
L.T. Loans not assigned to CPSTL
Treasury (A.D.B) Loan 75.959 75.959 75.959 75.959 75.959 -
L.T. Loans assigned to CPSTL - -
Treasury (Exim Bank) Loan 571.410 571.410 571.409 571.410 571.410 -
Others - - 487.800 487.800
647.369 647.369 647.368 1,135.169 1,135.169 -
31.12.2014 31.12.2013 01.01.2013 31.12.2014 31.12.2013 01.01.2013
Restated Restated Restated Restated
Rs.Mn Rs.Mn Rs.Mn Rs.Mn Rs.Mn Rs.Mn
19. TRADE & OTHER PAYABLES
Foreign Bills Payable 143,445.125 179,457.390 189,355.413 143,445.125 179,457.390 189,355.413
Other Creditors
- Amount due to Inland Revenue & Custom Dept. 824.289 97.912 2,213.257 970.677 223.588 2,213.257
- Accrued Expenses 1,019.542 1,260.938 2,901.165 1,799.208 2,199.976 3,274.029
- Refundable Deposits & Others 13,666.605 11,859.756 16,943.900 13,673.505 11,419.523 18,311.032
- Amount due to Related Parties 5,324.460 1,593.484 1,872.016 467.129 4,245.237 900.254
- Amount due to SCB - - 7,611.600 7,611.600
164,280.022 194,269.480 220,897.351 160,355.644 197,545.714 221,665.585
31.12.2014 31.12.2013 01.01.2013 31.12.2014 31.12.2013 01.01.2013
Restated Restated Restated Restated
Rs.Mn Rs.Mn Rs.Mn Rs.Mn Rs.Mn Rs.Mn
20. SHORT TERM BOROWINGS
Bank & Other loans
- Wholly Repayable within one year 247,787.669 218,394.690 210,515.694 247,787.669 218,394.690 211,650.863
- Bank Overdrafts - 8,365.509 - 8,537.060 365.082
247,787.669 226,760.199 210,515.694 247,787.669 226,931.750 212,015.945
Short term loans are obtained to finance import bills payable to the suppliers.The interest rate at the beginning of
the year was 7.5% .During the year under reviewed, the interest rate were revised to 6% and 5.5%.
CPC GROUP
CPC GROUP
* In 2003, the transfer of assets to CPSTL had been done at book values. Subsequently it had been decided to record the above
transaction based on the values that had been agreed upon in the process of privatization. The effect of the above transaction
had been adjusted under net re-structuring sales proceeds.
CPC GROUP
CPC GROUP
NOTES TO THE FINANCIAL
STATEMENTS

64
CPC GROUP
2014 2013 2014 2013
Rs.Mn Rs.Mn Rs.Mn Rs.Mn
21. CASH GENERATED FROM OPERATIONS
Profit/(Loss) before tax from continuing operations 1,741.160 (7,926.323) 3,889.635 (6,336.086)
- -
Adjustment for : - -
Depreciation 635.060 485.882 1,528.839 1,624.430
Amortisation 91.935 91.658
Foreign Currency Translation 1,396.794 (379.872) 1,396.794 (379.872)
Investment Income (437.501) 0.007 - 0.010
Interest Received (3,957.234) (3,262.784) (3,985.931) (3,287.302)
Adjustment to Market Value( Quoted Share) 14.500 - 14.500
Provision for Bad & Doubtful Debts & Recoveries 2.781 (0.511) 2.781 (0.511)
Interest Expenses 13,961.574 18,539.848 14,384.351 19,195.078
Interest on Gratuity 85.191 77.080
Provision for Retirement Obligation 190.028 57.032 268.963 126.780
Provision for impairment- Staff Loans 0.369 (2.977)
Provision for impairment- debtors 3.067 120.533
(Profit)/Loss on Sale of Property, Plant & Equipment (14.580) (23.728) (19.370) (36.589)
Subsidy Received 3,022.775 3,022.775 -
Operating Profit/(Loss) before Working Capital changes 16,540.857 7,504.051 20,872.467 11,206.725
Changes in Working Capital
(Increase)/ Decrease in Inventories 1,266.228 (2,842.375) 1,294.375 (2,878.144)
(Increase)/ Decrease in Trade and Other Receivable 24,631.682 27,341.560 25,898.877 25,418.555
Increase/ (Decrease) In Trade and Other Payables (29,989.456) (26,850.426) (37,190.070) (22,136.130)
Cash Generated from/ (Used in) operating activities 12,449.312 5,152.810 10,875.649 11,611.005
CPC GROUP
2014 2014
Rs.Mn Rs.Mn
22. FINANCIAL INSTRUMENT BY CATEGORY
Assets as per the Statement of Financial Position
Trade and other receivables excluding pre-payments and advances 52,406.984 52,891.189
Available for sale investment(including quoted and non-quoted) 43.626 43.626
Investments in Fixed deposits 11,994.697 11,994.697
Investment in Treasury bonds 9,983.931 9,983.931
Cash in hand and at Banka 21,474.788 23,380.517
95,904.026 98,293.960
Liabilities per the Statement of Financial Position
Borrowings 249,138.5200 251,512.969
Trade & Other Payables excluding non financial liabilities 164,280.0220 160,355.6442
Balance as at 31st December 413,418.5420 411,868.6132
NOTES TO THE FINANCIAL STATEMENTS

65
23. EXPLANATION ON RESTATEMENT OF FINANCIAL STATEMENTS
Parent company
Subsidiary Company
Transport expenses was overstated by Rs.5.799Mn during the year 2013 in the books of subsidiary
These errors has been corrected retrospectively in accordance with LKAS 8 Changes in Accounting policies, Changes in Accounting estimates and errors.
CPC CPC GROUP GROUP
31.12.2013 1.1.2013 31.12.2013 1.1.2013
23.1 Reconciliation of Share Holders Equity Rs.Mn. Rs.Mn. Rs.Mn. Rs.Mn.
Balance Reported as per the previous Financial Statements (236,528.740) (228,544.515) (223,843.021) (217,383.131)
Adjustment of Platinum Reserve erroneously credited to stock in 2012 25.696 25.696 25.696 25.696
Adjustment of Provision for Finished Goods Loss erroneously credited to stock in 2012 (21.602) (21.602) (21.602) (21.602)
Adjustment of Legal expenses erroneously debited to Legal expenses in 2013 50.000 - 50.000 -
Adjustment of Notional Credit on Treasury Bill interest income in 2013 7.902 - 7.902 -
Adjustment of retained earnings for consolidation in 2012 - 186.348
Adjustment for over recording of trade payable in 2010 & 2012 - - 182.909 182.909
adjustment of over recording of trade payable in 2013 5.799 -
Restated balance (236,466.744) (228,540.421) (223,592.317) (217,009.780)
Inventories
Balance reported as per the previous financial statements 65,032.200 62,189.825 65,428.44 62,550.30
Adjustment of Platinum Reserve erroneously credited to stock in 2012 25.696 25.696 25.70 25.70
Adjustment of Provision for Finished Goods Loss erroneously credited to stock in 2012 (21.602) (21.602) (21.60) (21.60)
Restated balance 65,036.294 62,193.919 65,432.534 62,554.390
Income Tax Receivable
Balance reported as per the previous financial statements 713.641 246.990 999.059 628.057
Adjustment of Notional Credit on Treasury Bill interest income in 2013 7.902 0.000 7.902 0.000
721.543 246.990 1006.962 628.057
Trade & Other Payables
Balance reported as per the previous financial statements 194,096.926 220897.351 197,561.87 221,848.49
Adjustment of Legal expenses erroneously debited to Legal expenses in 2013 (50.00) - (50.00) -
Adjustment for over recording of trade payable in 2010 & 2012 (182.91) (182.91)
adjustment of over recording of trade payable in 2013 (5.80)
194,046.926 220,897.351 197,323.16 221,665.59
Add: Changes in the Comparative information (Note) 222.554 222.55 -
194,269.480 220,897.351 197,545.714 221,665.585
Note
In previous accounts Payables to fisheries department & product payable to L.I.O.C has been grouped under Trade receivables
more than one year & less than one year now corrected.
Revaluation Reserve amounting to Rs.25.696 Mn. has been erroneously credited to Platinum stock, and provision for Finished goods loss of Rs.21.602mn. Has been
erroneously debited to provision for Finished goods in the year 2012.
Further during the year 2013, Legal Expenses relating to 2012 amounting to RS.50 Mn. Has been erroneously debited to Legal expenses without being debited to
the provision account and Notional credit on Treasury bill interest income amounting to Rs. 7.902Mn has been omitted.
During the year 2010, company has erroneously recorded Rs.65.275Mn payable to Lightens Contractors Malaysia, twice in the system and in the year 2012 Rs.117.633
Mn. Payable to transport vendors was again recorded tice under sundry creditors.
NOTES TO THE FINANCIAL STATEMENTS

66
23.2 Reconciliation of Comprehensive Income
Previously Previously
reported balance Adjustment Restated balance reported balance Adjustment Restated balance
Rs. Mn Rs. Mn Rs. Mn Rs. Mn Rs. Mn Rs. Mn
Less
Dealer Discount
Revenue 490,381.492 - 490,381.492 490,966.235 - 490,966.235
Cost of Sales (467,637.933) - (467,637.933) (474,085.894) (5.799) (474,080.094)
Gross Profit 22,743.559 - 22,743.559 16,880.341 (5.799) 16,886.141
Other Operating Income 321.978 - 321.978 452.324 - 452.324
Income On Investment Property 52.015 - 52.015 52.015 - 52.015
Selling & Distribution Expenses (11,965.252) - (11,965.252) (1,600.652) - (1,600.652)
Administrative Expenses (3,814.642) (50.000) (3,764.642) (6,874.850) (50.000) (6,824.850)
Operating Profit 7,337.658 (50.000) 7,387.657 8,909.178 (55.80) 8,964.978
Finance Cost (18,539.848) - (18,539.848) (18,539.848) - (18,539.848)
Finance Income 3,254.882 (7.902) 3,262.784 3,279.401 (7.902) 3,287.303
Profit /(Loss) before tax (7,947.308) (57.902) (7,889.407) (6,351.269) (63.701) (6,287.567)
Income Tax - - - (216.017) (216.017)
(7,947.308) (57.902) (7,889.407) (6,567.286) (63.701) (6,503.585)
OTHER COMPREHENSIVE INCOME
Net Gain/(loss) on available -for- sale Financial assets (14.500) - (14.500) (14.500) - (14.500)
Re-measurement gain/(loss) on Retirement Benefit plan (22.416) - (22.416) (64.452) - (64.452)
Other comprehensive loss for the year (36.916) - (36.916) (78.952) - (78.952)
Total comprehensive Profit/(Loss) for the year (7,984.224) (57.902) (7,926.323) (6,646.238) (63.701) (6,582.536)
Less ; Non controlling interest - - - (445.995) 1.934 (447.929)
Profit/(Loss) for the year (7,984.224) (57.902) (7,926.323) (7,092.233) (61.768) (7,030.465)
23.3 Reconciliation of Cash Flow Statement
There are no material differences between the Company's statement of cash floors previously presented and the statement of cash
flows presented after the error correction,exept the changes in below figures.
However there is no net effect on the cash flow due to the change.
Previously Previously
reported balance Adjustment Restated balance reported balance Adjustment Restated balance
Rs. Mn Rs. Mn Rs. Mn Rs. Mn Rs. Mn Rs. Mn
Net Operating Profit before Tax (7,984.225) (57.902) (7,926.323) (6,388.19) (52.10) (6,336.087)
Interest income (3,254.882) 7.902 (3,262.784) (3,279.40) 7.90 (3,287.302)
Increase/(Decrease)Trade and other payables (26,800.426) 50.000 (26,850.426) (22,091.93) 44.201 (22,136.130)
(38,039.533) 0.000 (38,039.533) (31,759.519) 0.000 (31,759.519)
NOTES TO THE FINANCIAL STATEMENTS

67
24. RELATED PARTY TRANSACTIONS
Three Directors of the CPC (as noted below) continue to be the directors of the Ceylon Petroleum
Storage Limited (CPSTL) due to equity ownership.
1. L.E. Susantha Silva
2. Mrs. S. Wijayabandara
3. Mr. Bandula Saman Kumara
Primary objective of CPSTL is to provide Storage and transport activities and provision of IT
services. During the year under review CPC has paid Throughput charges of Rs. 7,688 Mil. (2013-
Rs. 8,367 Mil.) and transport charges of Rs. 2,084 Mill. (2013- Rs. 1,998 Mil.) to CPSTL.
25. FINANCIAL RISK FACTORS
The Corporation’s activities expose to a variety of financial risks; market risk (including currency risk,
interest rate risk), credit risk and liquidity risk & price risk. Risk management is carried out by
management under policies approved by Board of Directors. Management identifies and evaluates the
financial risks with reference to the operations of the Corporation. The Corporation’s overall risk
management programs seek to minimize potential adverse effects on the Corporation’s financial
performance.
The principal financial instruments of the Corporation comprise of short term fixed deposits, money
market investments, US Dollar deposits and cash. The main purpose of these finance instruments is to
improve and maintain liquidity of the Corporation and to maximize financial return on the invested funds.
The Corporation has various other financial instruments such as trade receivables and trade payables
which arise directly from its business activities.
(a) Market risk
(i) Foreign exchange risk
When the Corporation imports the petroleum products and is exposed to foreign
exchange risk arising from currency exposure, primarily with respect to US dollars. The
Corporation’s functional currency is LKR in which most of the domestic transactions are
denominated, and all other currencies are considered as foreign currencies for reporting
purposes. Certain bank balances, trade receivables and trade payables are denominated
in foreign currencies.
The Corporations’ financial statements which are presented in LKR, are affected by
foreign exchange fluctuations through both translation risk and transaction risk. The
changes in foreign currency exchange rates affect the cost of materials, purchases and
services obtained from various parties in foreign currencies. In particular, continuous
depreciation of the LKR against the US$ and other foreign currencies has direct impact
NOTES TO THE FINANCIAL STATEMENTS

68
on the operating and financial result through its impact on cost of imported petroleum
products and other purchases.
(ii) Interest rate risk
Interest rate risk of the Corporation arises mainly from the borrowings and investment in
the form of Repo and term deposits. In the case of supplier interest rate varies largely
from prevailing market rates. Foreign currency loans obtained through two state
commercial banks are at negotiated rates of interest The Corporation analyses the interest
exposure on a continuous basis and monitors London Inter Banking Offer Rate (LIBOR)
and money market rates.
(b) Credit risk
Credit risk is the risk of financial loss to the corporation, if a customer fails to meet its contractual
obligations. Most of the Corporation’s customers are not independently rated, therefore the quality
of customers is considered by taking into account its financial position, past experience and other
qualitative factors. Corporation has established a credit policy under which each new customer is
analyzed individually for credit worthiness before the credit limit is granted. Customers who fail to
meet the corporations’ credit policy may transact with the corporation only on cash basis.
Credit risk also arises from cash and cash equivalents and deposits with banks and financial
institutions, as well as credit exposure to customers, including outstanding receivables and
committed transactions.
(c) Liquidity risk
Cash flow planning and forecasting is performed by the Finance division of the Corporation. Finance
division continuously monitors funds available to meet its various financial liabilities and optimum
utilization of excess short term financial resources for better yields.
Surplus cash held over and above balance required for working capital management is invested in
interest bearing financial instruments such as savings accounts and short term repo investments/ time
deposits. At the reporting date, the Corporation held repo investment of Rs. 17,065 Mn and other
liquid assets (time deposits) of Rs. 2,206.67 Mn that are expected to readily generate cash inflows
for managing liquidity risk.
The table below analyses the Corporation’s non-derivative liabilities into relevant maturity grouping
based on the remaining period at the balance sheet date to contractual maturity date.
December 2014 Figures on LKR Million
Category
Type
Less than 3
months 3 – 12 months 1 – 2 years 3-5 Years Over 5 years
Bank
borrowings 66,251 182,183
Long term debt 438 228 38

69
(d) Price Risk
The corporation is exposed to the commodity price risk of petroleum products & other raw
materials imported from overseas countries in US Dollars and other currencies. Cost reflective
price mechanism is not in place in deciding domestic retail sales prices of petroleum products in
line with international oil price movements. The Corporation regularly holds weekly stock review
meetings at which future product requirements are discussed and planned for the required future
importation. At the same time the corporation continuously interacts with the General Treasury
by giving financial information of Petroleum products to make suitable timely managerial
decisions.
27. Capital Management
Primary objective of the capital management is to ensure for Safeguard Corporation’s ability to
ensure going concern status in order to provide returns for equity share holders and benefits to other
stake holders. The Corporation had sustained a profit of Rs. 1,754 Mil (without tax adjustments )
for the current year and had a negative net asset position of Rs. 231,532 Mil as at end of the year
2014 due to accumulated losses for last five years. The external auditors have mentioned that the
corporation’s ability to continue as going concern without the financial assistance from the
government of Sri Lanka and other financial institutions was doubt full.
The heavy losses incurred by the Corporation are largely depend on the sale of Auto Diesel,
Kerosene and Naphtha at highly subsidized rates as retail price is determined by the government.
To cover up such losses as per the sec. 17 0f Finance Act No. 38 of 1971, the Corporation is entitled
to receive subsidy by the government. If the subsidies are received Corporation’s negative net asset
position could be overcome.

70
DOMESTIC SALES OF BULK PRODUCTS
Rupees Mn. 2005 2006 2007 2008 2009 2010 2011 2012 2013(Restated) 2014
.
Petrol 28,633.66 36,677.34 46,579.62 66,433.73 60,055.14 65,157.91 90,498.78 117,600.05 132,397.75 140,885.02
Auto Diesel 78,104.77 92,474.65 113,737.17 151,070.45 119,046.26 122,360.42 165,800.16 246,441.20 216,419.74 244,407.04
Super Diesel 725,285 349.805 467.764 885.25 866.145 1,170.27 1,587.58 3,539.87 4,151.77 5,104.32
Kerosene 11,430.28 13,209.91 12,459.33 14,000.05 9,754.54 10,711.00 12,804.33 18,099.54 16,803.23 15,365.55
Furnace Oil 30,165.89 36,421.65 43,941.11 66,220.15 33,157.15 35,792.02 49,990.51 84,790.17 60,651.35 70,020.50
Total 149,059.89 179,133.35 217,184.99 298,609.63 222,879.22 235,191.62 320,681.36 470,470.83 430,423.84 475,782.43
(B) QUANTITY - Thousand Metric Tons
Petrol 334.10 367.60 382.10 383.75 415.67 484.26 563.37 618.67 640.35 687.33
Auto Diesel 1,330.10 1,335.30 1,449.70 1,371.32 1,427.33 1,422.12 1,848.66 1,930.40 1,559.06 1,757.39
Super Diesel 11.70 4.70 5.40 7.19 8.55 11.37 14.07 22.10 24.89 30.98
Kerosene 178.00 196.60 168.50 151.31 150.69 165.11 146.88 142.86 126.12 121.78
Furnace Oil 972.80 911.10 985.20 994.55 1,095.73 1,004.50 1,092.82 1,187.08 667.51 722.30
Total 2,826.70 2,815.30 2,990.90 2,908.11 3,097.97 3,087.35 3,665.80 3,901.11 3,017.92 3,319.78
(C) RETAIL SELLING PRICES IN PETROLEUM PRODUCTS
(Colombo Spot Price in Rs. Per Litre as at 31st December)
Super Petrol 80.00 95.00 92.00 120.00 115.00 115.00 125.00 159.00 162.00 150.00
Auto Diesel 50.00 92.00 60.00 70.00 73.00 73.00 76.00 115.00 121.00 111.00
Super Diesel 55.30 65.30 65.30 85.30 88.30 88.30 98.30 142.00 145.00 133.00
Kerosene 30.50 48.00 48.00 50.00 51.00 51.00 61.00 106.00 106.00 81.00
Furnace Oil 800" 31.40 44.40 44.40 33.90 34.90 40.00 52.20 92.20 92.20 92.20
Furnace Oil 1500" 30.30 43.30 43.30 31.70 32.70 40.00 50.00 65.00 90.00 90.00
Furnace Oil 3500" 28.00 41.00 41.00 25.00 26.00 40.00 50.00 65.00 90.00 90.00
INCOME & EXPENDITURE
Gross Income(less Taxes) 161,852.00 196,767.00 238.36 341.67 236,332.00 256,329.16 356,442.36 512,910.31 490,381.49 525,182.09
Income from Investment - - - - - - - -
Cost of Sales 144,501.00 187,231.00 221,724.00 338,514.00 233,250.00 265,603.76 428,070.57 573,692.05 467,637.93 500,734.72
Margin 17,350.00 9,536.00 16,641.00 1,835.04 3,082.00 (9,274.61) (71,628.21) (60,781.74) 22,743.56 24,447.38
Working & Establishment
Exppenses including Interest7,510.00 7,621.00 12,657.00 16,570.00 15,424.77 17,648.21 22,875.24 34,034.29 30,632.97 22,706.22
Hedging Expenses - - - - - - 7,611.60 - -
Profit/(Loss) Before Tax 9,840.00 (1,915.00) 3,984.00 (14,735.00) (12,342.64) (26,922.82) (94,503.45) (97,308.37) (7,889.41) 1,741.16
(A) VALUE
TEN YEAR SUMMARY

71
Rupees Mn 2005 2006 2007 2008 2009 2010 2011 2012 2013(Restated) 2014
CAPITAL STRUCTURE
Capital 1,000.00 1,000.00 1,000.00 1,000.00 1,000.00 1,000.00 3,500.00 3,500.00 3,500.00 3,500.00
Reserves 11,673.40 10,065.90 12,567.80 (2,416.40) (14,038.05) (40,951.63) (134,824.14) (232,044.52) (239,966.74) (235,032.12)
L/T Liabilities 19,113.40 16,705.00 13,728.20 10,908.40 32,779.06 28,478.19 27,646.49 1,998.22 1,350.85 703.48
Gratuity Provision 377.40 514.30 541.40 566.50 735.20 746.34 626.68 546.94 538.11 663.95
Total 32,164.20 28,285.40 27,837.40 10,058.50 20,476.21 (10,727.10) (103,050.98) (225,999.36) (234,577.79) (230,164.69)
Represented
Fixed Assets, Including work in
Progress 4,512.70 4,460.90 4,374.60 4,624.00 5,041.00 8,280.08 8,850.37 9,599.17 13,136.81 13,616.83
Investment 2,535.60 2,553.10 2,546.90 2,541.90 2,541.90 2,541.90 5,041.88 5,058.13 5,043.63 5,043.63
Net Current Assets 25,115.90 21,271.50 20,915.90 2,892.60 12,214.67 (28,938.69) (458,601.64) (240,656.66) (252,758.23) (248,825.14)
Total 32,164.20 28,285.50 27,837.40 10,058.50 19,797.57 (18,116.71) (444,709.39) (225,999.36) (234,577.79) (230,164.69)
SUMMARISED CASH FLOW STATEMENT
Cash Flow from Operating 9,839.81 (1,915.03) 3,984.18 (14,735.03) (12,342.64) (26,922.82) (94,508.39) (97,308.37) (7,926.32) 1,741.16
Adjustment for Items not
involving Movement of cash 841.68 1,431.85 1,928.20 1,922.02 4,986.48 5,778.64 (10,854.12) 12,935.23 15,430.37 14,799.70
10,681.49 (483.18) 5,912.38 (12,813.00) (7,356.16) (21,144.18) (83,654.28) (84,373.14) 7,504.05 16,540.86
Change in Working Capital
(increase)/Decrease in
inventories (4,066.37) (9,184.44) (13,321.53) 8,673.83 5,962.16 (15,922.08) 4,328.93 (25,230.46) (2,842.38) 1,266.23
(increase)/Decrease in Trade
and Other Receivables (3,434.62) (2,852.64) (13,098.77) (32,409.85) (9,365.38) (5,283.96) (35,784.66) 5,039.87 27,341.56 24,631.68
(increase)/Decrease in Trade
and Other Payables (1,838.77) 11,099.33 23,813.34 39,946.80 57,438.63 25,211.64 21,399.69 53,864.34 (26,850.43) (29,989.46)
(17,709.06) 19,072.36 14,193.55
Cash Generating From
Operational Activities (730.98) (7,034.05) 36.94 (1,227.61) 41,807.64 (24,169.25) (102,756.33) (68,408.44) (13,919.55) (1,744.23)
Cash Used in Investing
Activities 317.93 662.03 1,165.99 40.61 (308.56) (3,376.18) (643.96) 1,148.48 (7,546.56) (1,898.81)
Cash from/(Used in) Financing
Activities 13,020.88 (2,478.14) (3,326.04) (1,001.41) (21,339.77) (4,379.07) 119,016.51 62,539.95 7,231.63 28,745.61
Net (Decrease)/Increase in
cash & Cash Equivalents 12,607.83 (8,850.16) (2,123.11) (2,188.41) 20,159.31 (31,924.50) 15,616.22 (4,720.01) (14,234.48) 25,102.57
Cash & Cash Equivalents at
beginning of the year 8,325.82 20,933.65 12,083.50 9,960.39 7,771.98 27,963.38 (3,961.12) 11,656.10 6,935.09 (7,299.39)
Cash & Cash Equivalents at
end of the year 20,938.65 12,083.50 9,960.39 7,771.98 27,931.29 (3,961.12) 11,655.10 6,935.09 (7,299.39) 17,803.17
Capital Employed
Operating Profit/(Loss) before
Working Capital changes
Les Gratuity/Tax and Interest
Paid (2,072.72) (5,613.11) (3,268.48) (4,625.38) (4,871.60) 6,858.90 (9,000.57)
TEN YEAR SUMMARY

72

73

74

75

76

77

78

79
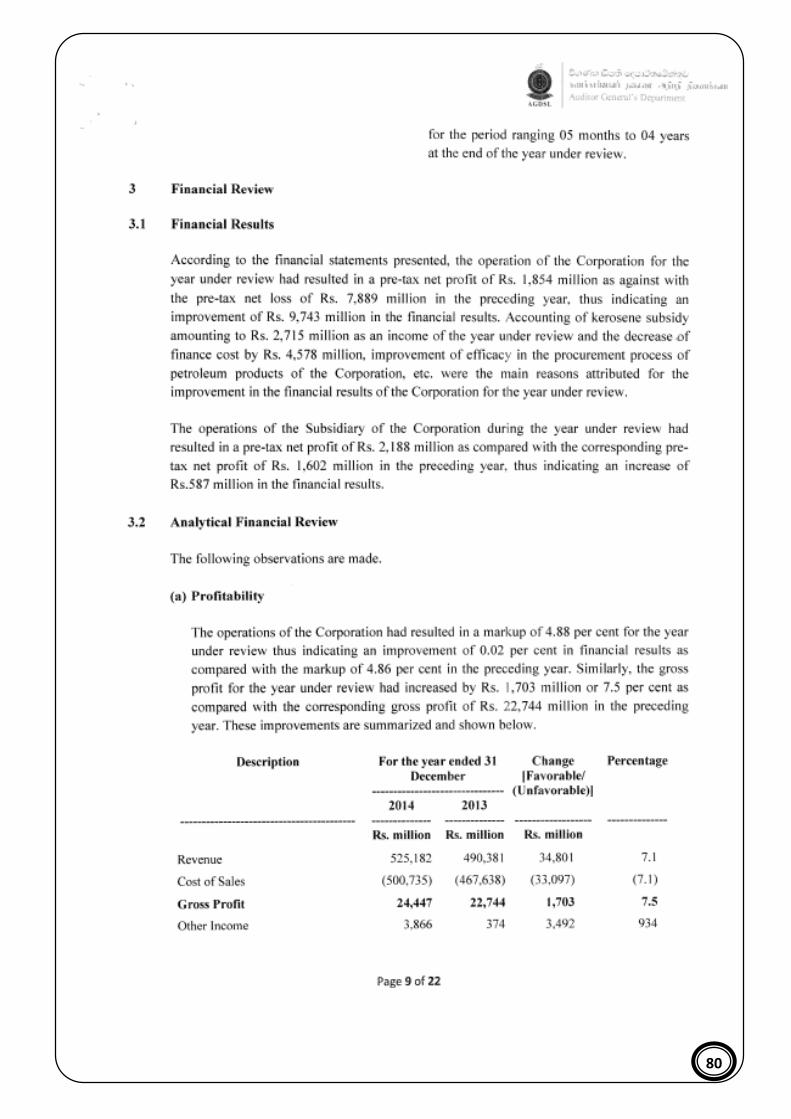
80

81
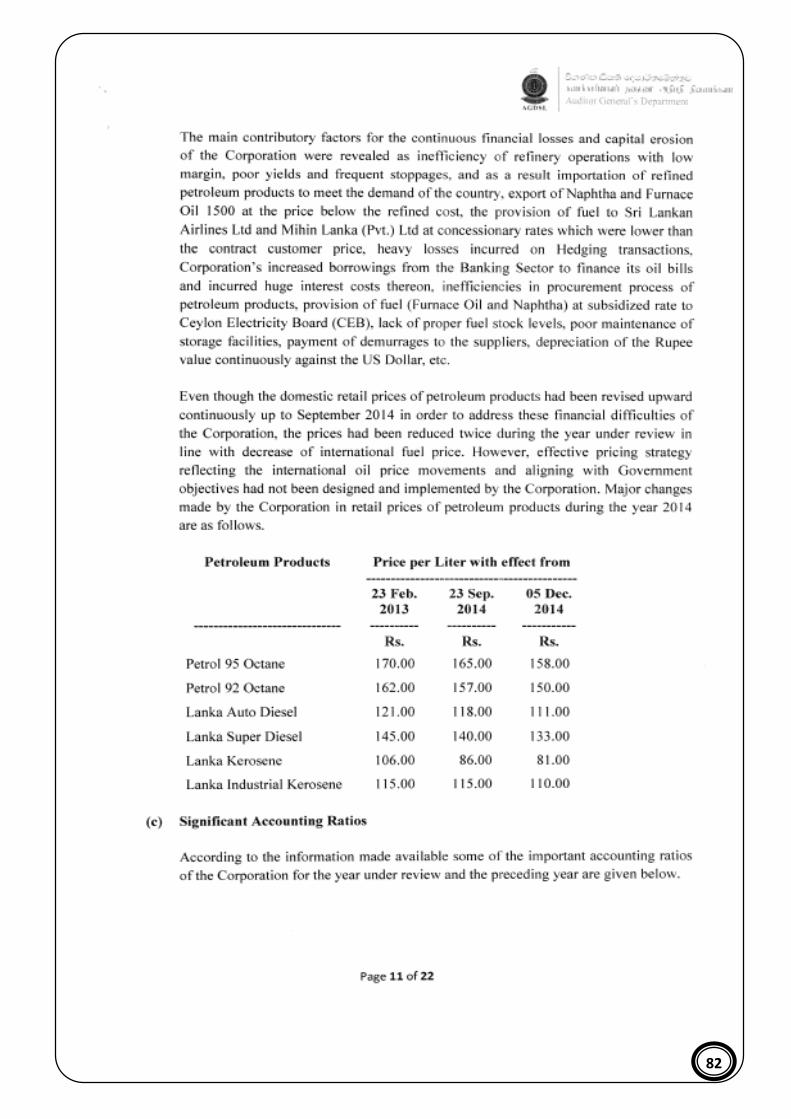
82

83

84

85

86

87

88

89

90

91

92

93

94
Cash Equivalents - Short term investments readily convertible to known amounts of cash subject to
insignificant risk of changes in value.
Contingent Liabilities - Conditions or situations at the Balance Sheet date, the financial effects of
which are to be determined by future events which may or may not occur.
Current Ratio - Measures the number of times current liabilities be recouped with available current
assets.
Debtors to Turnover - Measure of the credit extended to customers (i.e average debt settlement period
if stated in days)
Deferred Income - Income yet to be realized or realized but not recognized as income.
Interest Cover - Measures the extent to which interest charges be covered by profit before Tax.
Liquid Ratio - Measures the number of times current assets be recouped with available current
liabilities.
Post Balance Sheet Events - Significant events that occur between the Balance Sheet date and the date
on which financial statements are authorized for issue.
Provisions - Liability of uncertain timing or amount.
Related parties - Parties who could control or significantly influence the Financial and operating
decisions/policies of the Corporation.
Segments - Constituent business units grouped in terms of nature and similarity of operations.
Working Capital - Capital required for financing the day-to-day operations (current assets less current
liabilities).
GLOSSARY OF FINANCIAL TERMS

95
Avn - Aviation
Bbl - Barrel (Basic unit in international petroleum sales)
bps - Basis points
BTR - Bulk Transfer
CEB - Ceylon Electricity Board
CIF - Cost Insurance Freight
CPC - Ceylon Petroleum Corporation
CPSTL - Ceylon Petroleum Storage Terminals Ltd.,
DES - Delivered Ex Ship
EPF - Employees Provident Fund
ETFB - Employees Trust Fund Board
FIFO - First in First Out
FOB - Free on Board
FOREX - Foreign Exchange
GOSL - Government of Sri Lanka
ICPA - International Coop/Petroleum Association
Int - Interest
LIOC - Lanka Indian Oil Corporation Ltd.,
LMS - Lanka Marine Services (Pvt.) Ltd.,
LPG - Liquid Petroleum Gas
Ltr - Litre (Basic unit in domestic Petroleum sales)
MOU - Memorandum of Understanding
NDB - National Development Bank
OPEC - Oil Producing and exporting Countries
PERC - Public Enterprise Reforms Commission
SPBM - Single Point Buoy Mooring Facility
TT - Turnover Tax
VAT - Value Added Tax
VRS - Voluntary Retirement Scheme
ABBREVIATIONS

96


![TENDER NOTICE CEYLON PETROLEUM CORPORATION (CEYPETCO)ceypetco.gov.lk/wp-content/uploads/JETA1.pdf · 115455406; email: cm@ceypetco.gov.lk and commercial@ceypetco.gov.lk] 1.2. issue](https://static.fdocuments.in/doc/165x107/5e9b8c939a71f65ccb25b614/tender-notice-ceylon-petroleum-corporation-ceypetco-115455406-email-cm-and.jpg)