
Cetacean sightings off the Fiordland coastline · Cetacean sightings off the Fiordland coastline...
42
Cetacean sightings off the Fiordland coastline Analysis of commercial marine mammal viewing data 1996–99 SCIENCE FOR CONSERVATION 187 David Lusseau and Elisabeth Slooten Published by Department of Conservation P.O. Box 10-420 Wellington, New Zealand
Transcript of Cetacean sightings off the Fiordland coastline · Cetacean sightings off the Fiordland coastline...

Cetacean sightings off theFiordland coastline
Analysis of commercial marine mammal viewingdata 1996–99
SCIENCE FOR CONSERVATION 187
David Lusseau and Elisabeth Slooten
Published by
Department of Conservation
P.O. Box 10-420
Wellington, New Zealand

���������������� ������������������������ ������ ����� ��������� ���� ���������������
������������ ������������ �������������������� ������ ������ ����������� �� ��������� !
�������"� ����������������������� ��������� ����� ���� ���� � ��� ���� ������������������� ���� ��� ��
#������� ��������������������$�������%������������������������������� �������������������&''
��������������(������ ���������������������� ������� ����������������������)����������(
#���� ��� ������� ��� ���� ����������������$�������%�����������*�$�������+�,���� ���-���"��������
���.������������������������������/���/ ��� ���%������������������ ������������������ *�$������
+�,���� ���-���*�$�������#��������������0�� ������$� �����*����� ������������ ������*
1����������
2 3���� ��4554*����� ������������ ������
0$$� 667894:;<
0$=� 59;7>9446:894
CONTENTS
Abstract 5
1. Introduction 6
1.1 Cetacean species present in Fiordland 10
1.2 Objectives 12
2. Material and methods 13
2.1 Observer bias and reliability 13
2.2 Temporal analyses 15
2.3 Spatial analyses 15
2.4 Group size frequency distribution 16
3. Results 16
3.1 Observer bias 16
3.2 Sampling effort 17
3.3 Species infrequently observed 18
3.4 Milford Sound 22
3.4.1 Spatial variation 22
3.4.2 Temporal variation 23
3.4.3 Interaction between bottlenose and dusky dolphins 25
3.4.4 Seasonal variations in habitat use 26
3.4.5 Group size 26
3.5 Doubtful Sound 27
3.5.1 Spatial variation 27
3.5.2 Temporal variation 31
3.6 Comparison of group size frequency distribution 31
4. Discussion 33
4.1 Observer bias and sampling effort 33
4.2 Infrequently observed species 34
4.3 Milford Sound 35
4.3.1 Bottlenose dolphin 35
4.3.2 Dusky dolphin 35
4.3.3 Interaction between dusky and bottlenose dolphins 36
4.4 Doubtful Sound 36
4.5 Bottlenose dolphin group size in Milford, Doubtful, and
Dusky Sounds 37
5. Conclusions and recommendations 37
6. Acknowledgements 40
7. References 40

4 Lusseau & Slooten—Cetacean sightings off the Fiordland coastline

5Science for Conservation 187
© January 2002, Department of Conservation. This paper may be cited as:
Lusseau, D.; Slooten., E. 2002. Cetacean sightings off the Fiordland coastline: Analysis of commercial
marine mammal viewing data 1996–99. Science for Conservation 187. 42 p.
Cetacean sightings off theFiordland coastline
Analysis of commercial marine mammal viewingdata 1996–99
David Lusseau and Elisabeth Slooten
Department of Zoology, University of Otago, P.O. Box 56, Dunedin, New
Zealand
A B S T R A C T
From 1996 to 1999, 1422 sightings of cetaceans were recorded by observers on
tour boats in the fiords and off the coast of Fiordland. These were compiled by
the New Zealand Department of Conservation. Only 2.9% of the sightings were
collected outside of Milford and Doubtful Sounds since most of the sampling
effort was concentrated in these two fiords. In addition to species
identification, group size and location were also recorded. Nine species were
identified: bottlenose dolphin (Tursiops sp.), dusky dolphin (Lagenorhynchus
obscurus), common dolphin (Delphinus sp.), long-finned pilot whale
(Globicephala malaena edwardi), orca (Orcinus orca), humpback whale
(Megaptera novaeangliae), southern right whale (Eubalaena australis),
minke whale (Balaenoptera acutorostrata) and sperm whale (Physeter
catodon). These are the first official records of long-finned pilot whale and
minke whale in the region. Bottlenose dolphins were the most commonly
observed species in all areas (87.8% of all sightings), followed by dusky
dolphins (10.3%). Along the coastline outside the fiords, bottlenose dolphins
were also the predominant species (48.1% of sightings, n = 27), followed again
by dusky dolphin (33.3%). Observations from this sighting network were
compared with studies, which used standard sampling techniques, undertaken
in the area. Spatial and temporal variations in tour operator sightings were
accurate and reliable. Estimates of dolphin group size were accurate up to 25
individuals. If the group was larger than 25 animals, its size was overestimated
by tour operators. Species distribution at a large scale (Fiordland coastline) and
small scale (within Doubtful and Milford Sounds) is discussed. Temporal
variations in distribution and group size were also assessed; observer bias was
taken into consideration.
Keywords: cetaceans, bottlenose dolphin, dusky dolphin, common dolphin,
long-finned pilot whale, orca, humpback whale, southern right whale, minke
whale, sperm whale, sightings, abundance estimates, Fiordland, New Zealand.

6 Lusseau & Slooten—Cetacean sightings off the Fiordland coastline
1. Introduction
To better manage the natural resources of Fiordland, it is important to
understand the distribution of cetaceans (dolphins and whales) in space and
time. There are two reasons for this. First, cetaceans have a key position in
marine and coastal ecosystems. Secondly, they play a key role in tourism in this
area. The trophic level of most cetacean species ranges from meso- to top
predator (Pauly et al. 1998). The role of large mammals, especially top
predators, in the regulation of entire ecosystems has been thoroughly discussed
in the literature (see Terborgh et al. 1999 for a review). This role has led many
researchers to consider the potential use of large mammals in the design of
regional reserve networks (Terborgh et al. 1999). The role of top predator in
ecosystem stability has often been described as a ‘top-down regulation’
(Terborgh et al. 1999; Brett & Goldman 1997). Under this concept, species
occupying the highest trophic level (top predators) exert a controlling
influence on species at the next level (prey) and so on throughout the food
web. As a consequence it has been concluded that the removal of a top predator
can result in ecosystem instability (Paine 1966; Estes et al. 1989). Therefore it is
important to determine whether human developments, including tourism
activities, interfere with the population ecology and resource utilisation of
predators such as dolphins and whales, because such interference has
implications for the stability and health of the ecosystem. Basic parameters,
such as species distribution and group size, are useful indicators of species
ecology and can easily be recorded by keen observers with minimum training.
Little information is available on the biology and ecology of marine mammals
utilising Fiordland waters. Most of the present knowledge has been gathered
recently (in the 1990s) and is concentrated on one species (the bottlenose
dolphin) in one fiord (Doubtful Sound) (Williams et al. 1993, Schneider 1999).
People utilising the fiord system (fishers, tour operators, and other boaters) are
a potentially valuable source of information on the past and present status of
marine mammals in this area and their expertise can be a source of basic
information on the ecology of these species in this location.
Webb (1973) described the species he encountered during an observation
cruise aboard the Japanese longliner, Lloret Lopez II, in autumn 1970. From his
account and other anecdotal data the following species are known to utilise
Fiordland waters:
• bottlenose dolphin (Tursiops truncatus)
• dusky dolphin (Lagenorhynchus obscurus)
• common dolphin (Delphinus sp.)
• orca (Orcinus orca)
• sperm whale (Physeter catodon)
• humpback whale (Megaptera novaeangliae)
• southern right whale (Eubalaena australis)
Even though we have some understanding of the species that can be encoun-
tered in this area, we still lack information on their use of this unique habitat.

7Science for Conservation 187
Figure 1. Map of Fiordland,New Zealand.
�����������
��� �����
���� �����
����������������������
���������������������
����������
�� ����
������������
��������
������ ������!����
�������!����
"#$
"%$
&%%$' &%($ &%)$
* #*���
���������
"*�
+#�
"#�
&(#� &)*�&(*�&%#�
����!�����
������!�����
��������
Fiordland extends from Milford Sound in the North to Preservation Inlet in the
South (Fig. 1). The terrestrial portion of the area comprises Fiordland National
Park, covering a land area of 12 524 km2. The fiord complex is composed of 14
fiords. The main oceanographic feature of fiords is the presence of a low-salinity
layer topping the marine stratum. The presence of this layer depends on several
variables, particularly reduced water exchange with the ocean due to
bathymetric conditions, and abundant rainfall. Fiordland is one of the wettest
places on Earth. Annual rainfall on Wilmot Pass (Doubtful Sound) is more than
6700 mm (Stanton & Pickard 1981). The extremely steep topography of the
glacier-formed valleys funnels most of this rain directly into the fiords. Being
less dense than oceanic water, this accumulating freshwater floats on top of the
oceanic water layer because of the reduced mixing effect inside the fiords
(Gibbs et al. 2000). While flowing through the forested landscape, it dissolves a
large amount of tannins, and the resulting tannin-stained low-salinity layer
substantially reduces the amount of light penetrating the marine stratum.
Because of the lack of light, species commonly found beyond the continental
shelf are found at shallow depths in Fiordland waters. The low-salinity layer may
also cause physiological stress on marine species such as cetaceans (Wilson et
al. 1999).
From 1996 to 1999, companies operating
tours in Fiordland recorded sightings of
cetaceans for the New Zealand
Department of Conservation. Most of the
effort was concentrated in Milford and
Doubtful Sounds (Figs 2 and 3), where
cruises were undertaken on a daily basis.
This report compiles these sighting
records and assesses the efficiency of the
sighting network by comparing these
results with the long-term monitoring of
bottlenose dolphins in Doubtful Sound
carried out by the New Zealand Whale
and Dolphin Trust. These three first years
of the sighting network in Fiordland
represent a preliminary test of what data
can be reliably collected by casual
observers.
Volunteer sighting networks have been
recognised as useful to collect data on
the distribution of various species at a
large scale. One of the most famous
networks (North American Breeding Bird
Survey) established by the US Fish and
Wildlife Services has permitted the
monitoring of bird populations nation-
wide in the United States of America
since 1966 (Boulinier et al. 2001, Link &
Sauer 1998). Another network estab-
lished in England allows the nationwide
8 Lusseau & Slooten—Cetacean sightings off the Fiordland coastline
monitoring of badger populations (Moore et al. 1999, Ostler & Roper 1998). In
both of these cases the networks allow for the collection of accurate data to a
scale (spatial and temporal) that is not practical for most scientific studies
because of their cost/benefit efficiency.
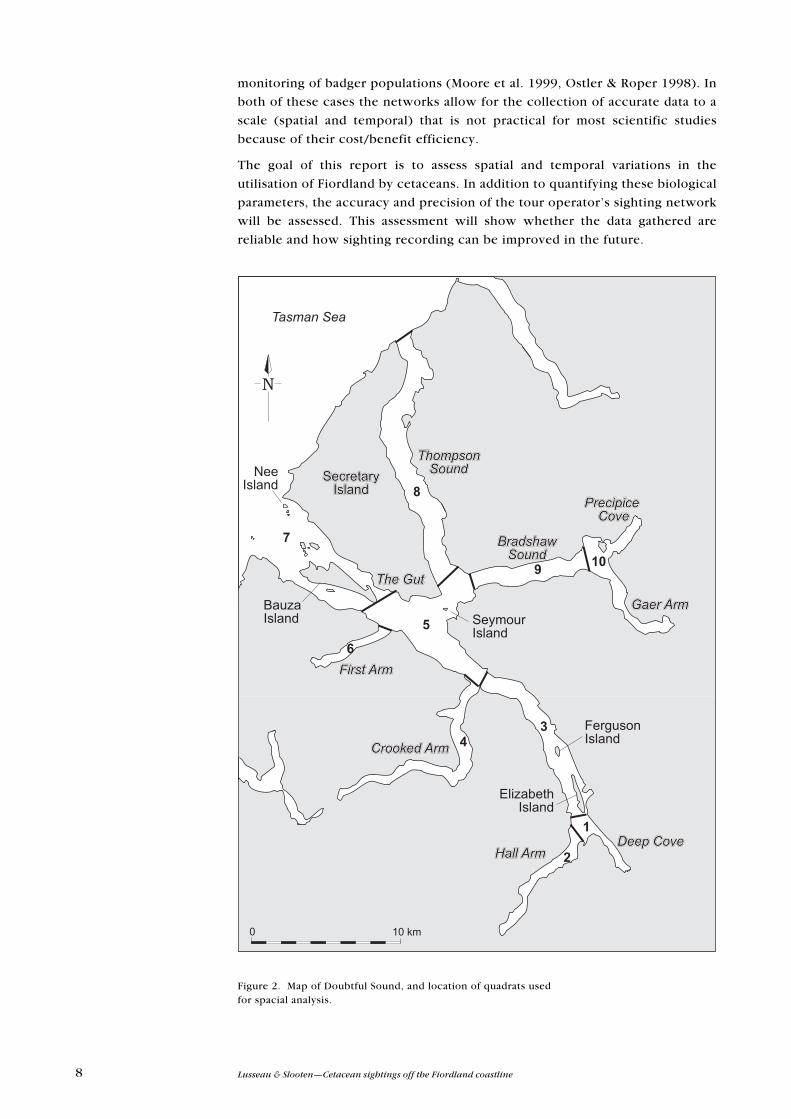
The goal of this report is to assess spatial and temporal variations in the
utilisation of Fiordland by cetaceans. In addition to quantifying these biological
parameters, the accuracy and precision of the tour operator’s sighting network
will be assessed. This assessment will show whether the data gathered are
reliable and how sighting recording can be improved in the future.
Figure 2. Map of Doubtful Sound, and location of quadrats usedfor spacial analysis.
����������
���!�����
��,�!�����
������������������������!�����!�����!�����
����� ����� ����� ���������������
���������������������������������������
���������������������������������������
������������������
������������������������������������������������
'��,�����!�����
���������������������������
���������������������
�����!�����
���������������������
�
�
� ��
��
�
�
-�� ���!�����
* &*���
9Science for Conservation 187
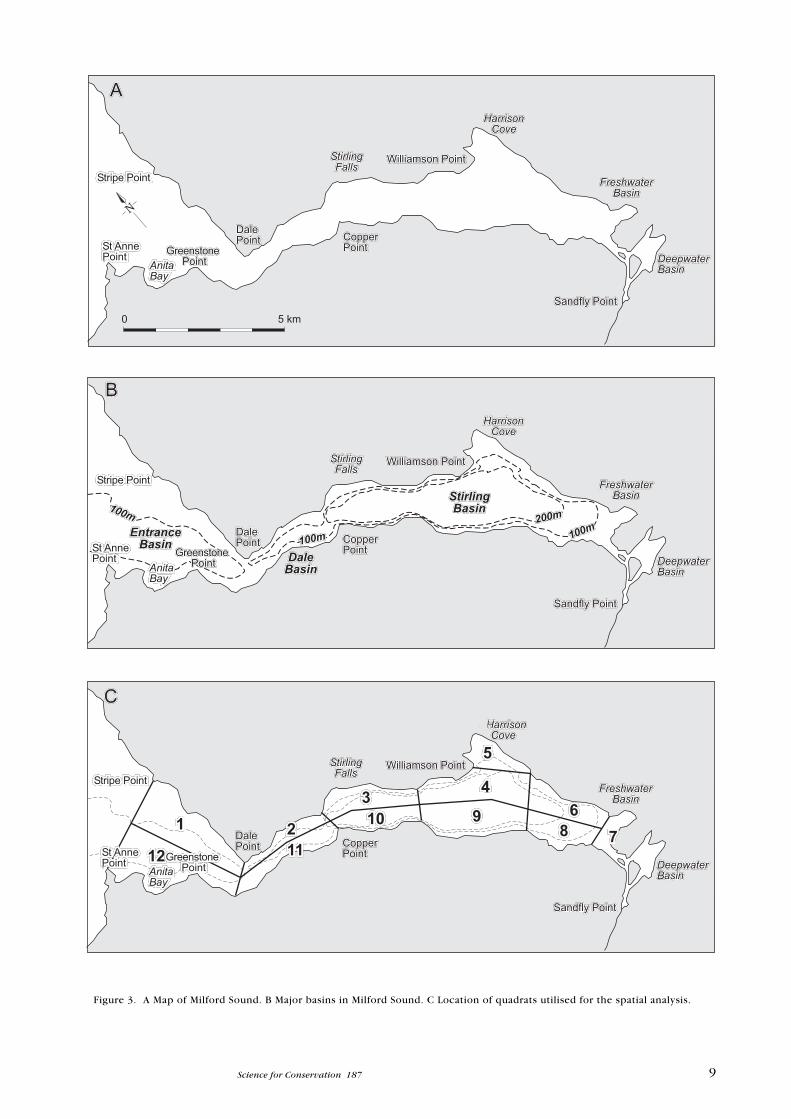
Figure 3. A Map of Milford Sound. B Major basins in Milford Sound. C Location of quadrats utilised for the spatial analysis.
���������������������������������
���������������������
����� ����� ��������������
* #���
��� ���
������
���
������������
������������
���������������������
��.�����.�����.������������������
���������������������������������
���������������������������
������������������������������������������������
���������������������������������
������������������������������������
������������������������������
/���������������/���������������/���������������
���� ������� ������� ���������������
���� ������� ������� ���������������
������������������������������������
���������������������
��.�����.�����.������������������
���������������������������������
���������������������������
������������������������������������������������
���������������������������������
������������������������������������
������ ������ ������������������
/���������������/���������������/���������������
���� ������� ������� ���������������
���� ������� ������� ���������������
������������������������������������
����
����
����
������������
������������
������������
...
���
���
10 Lusseau & Slooten—Cetacean sightings off the Fiordland coastline
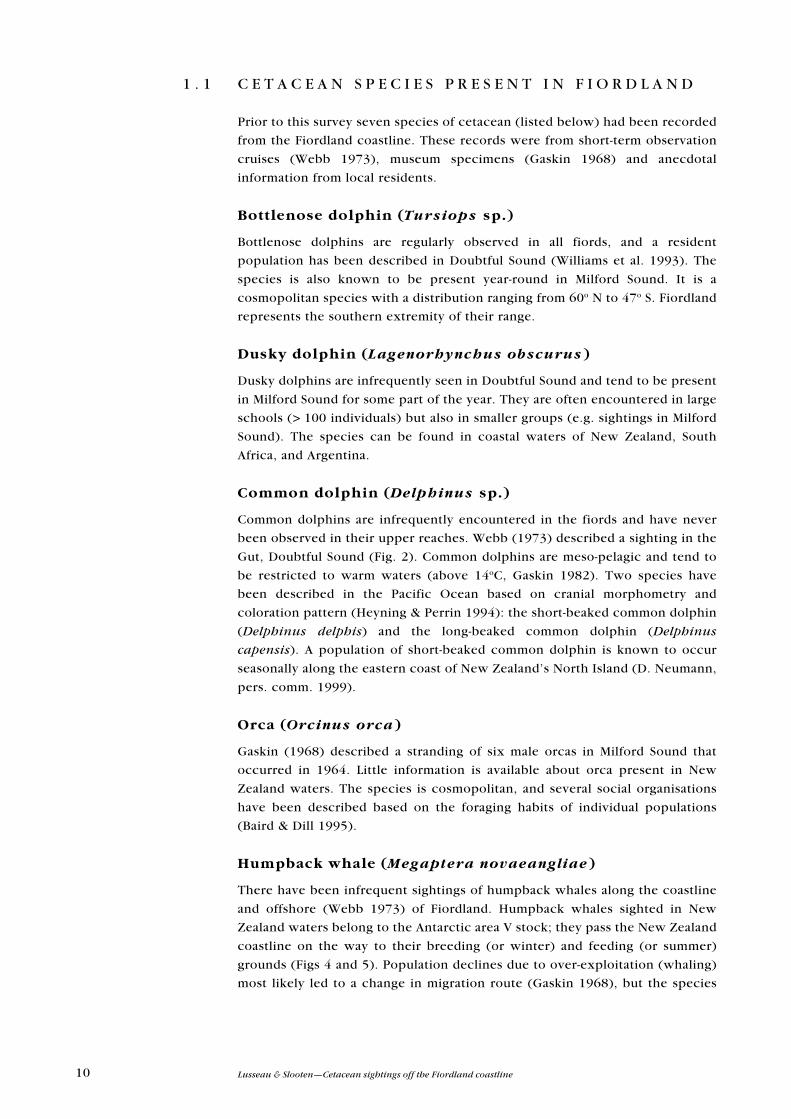
1 . 1 C E T A C E A N S P E C I E S P R E S E N T I N F I O R D L A N D
Prior to this survey seven species of cetacean (listed below) had been recorded
from the Fiordland coastline. These records were from short-term observation
cruises (Webb 1973), museum specimens (Gaskin 1968) and anecdotal
information from local residents.
Bottlenose dolphin (Tursiops sp.)
Bottlenose dolphins are regularly observed in all fiords, and a resident
population has been described in Doubtful Sound (Williams et al. 1993). The
species is also known to be present year-round in Milford Sound. It is a
cosmopolitan species with a distribution ranging from 60o N to 47o S. Fiordland
represents the southern extremity of their range.
Dusky dolphin (Lagenorhynchus obscurus)
Dusky dolphins are infrequently seen in Doubtful Sound and tend to be present
in Milford Sound for some part of the year. They are often encountered in large
schools (> 100 individuals) but also in smaller groups (e.g. sightings in Milford
Sound). The species can be found in coastal waters of New Zealand, South
Africa, and Argentina.
Common dolphin (Delphinus sp.)
Common dolphins are infrequently encountered in the fiords and have never
been observed in their upper reaches. Webb (1973) described a sighting in the
Gut, Doubtful Sound (Fig. 2). Common dolphins are meso-pelagic and tend to
be restricted to warm waters (above 14oC, Gaskin 1982). Two species have
been described in the Pacific Ocean based on cranial morphometry and
coloration pattern (Heyning & Perrin 1994): the short-beaked common dolphin
(Delphinus delphis) and the long-beaked common dolphin (Delphinus
capensis). A population of short-beaked common dolphin is known to occur
seasonally along the eastern coast of New Zealand’s North Island (D. Neumann,
pers. comm. 1999).
Orca (Orcinus orca)
Gaskin (1968) described a stranding of six male orcas in Milford Sound that
occurred in 1964. Little information is available about orca present in New
Zealand waters. The species is cosmopolitan, and several social organisations
have been described based on the foraging habits of individual populations
(Baird & Dill 1995).
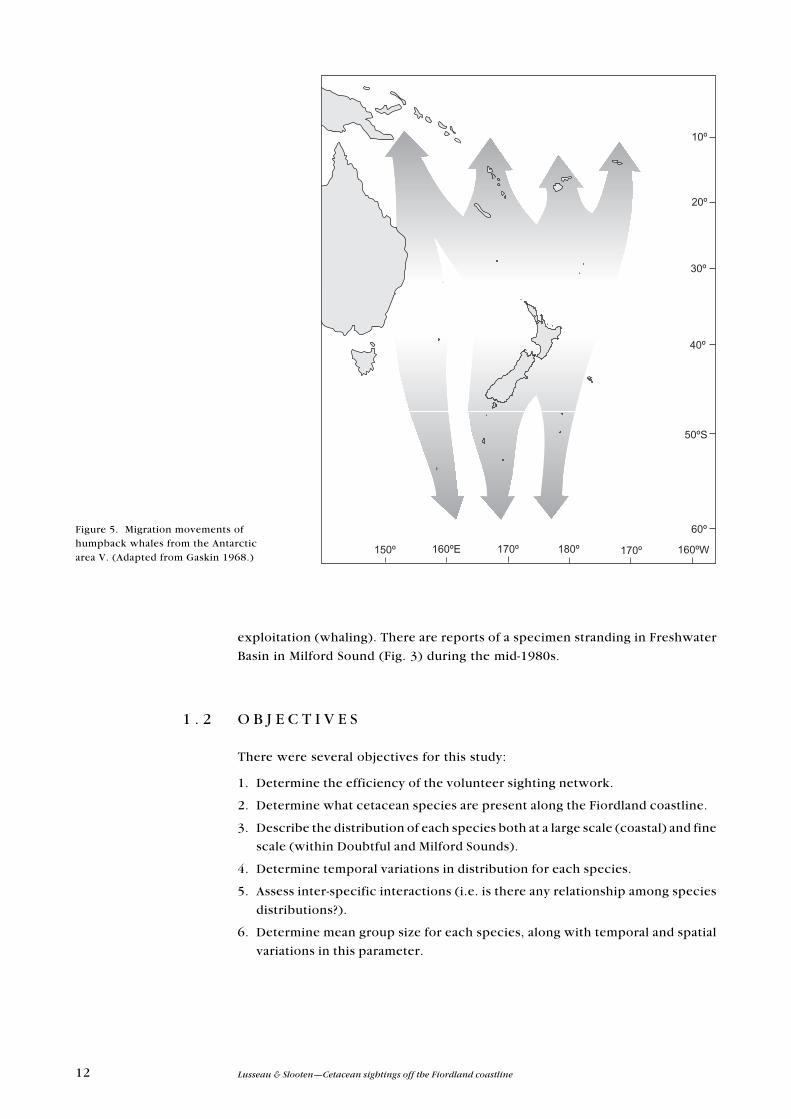
Humpback whale (Megaptera novaeangliae)
There have been infrequent sightings of humpback whales along the coastline
and offshore (Webb 1973) of Fiordland. Humpback whales sighted in New
Zealand waters belong to the Antarctic area V stock; they pass the New Zealand
coastline on the way to their breeding (or winter) and feeding (or summer)
grounds (Figs 4 and 5). Population declines due to over-exploitation (whaling)
most likely led to a change in migration route (Gaskin 1968), but the species

11Science for Conservation 187
can still infrequently be observed along New Zealand’s eastern and western
coasts (Gibbs & Childerhouse 2000).
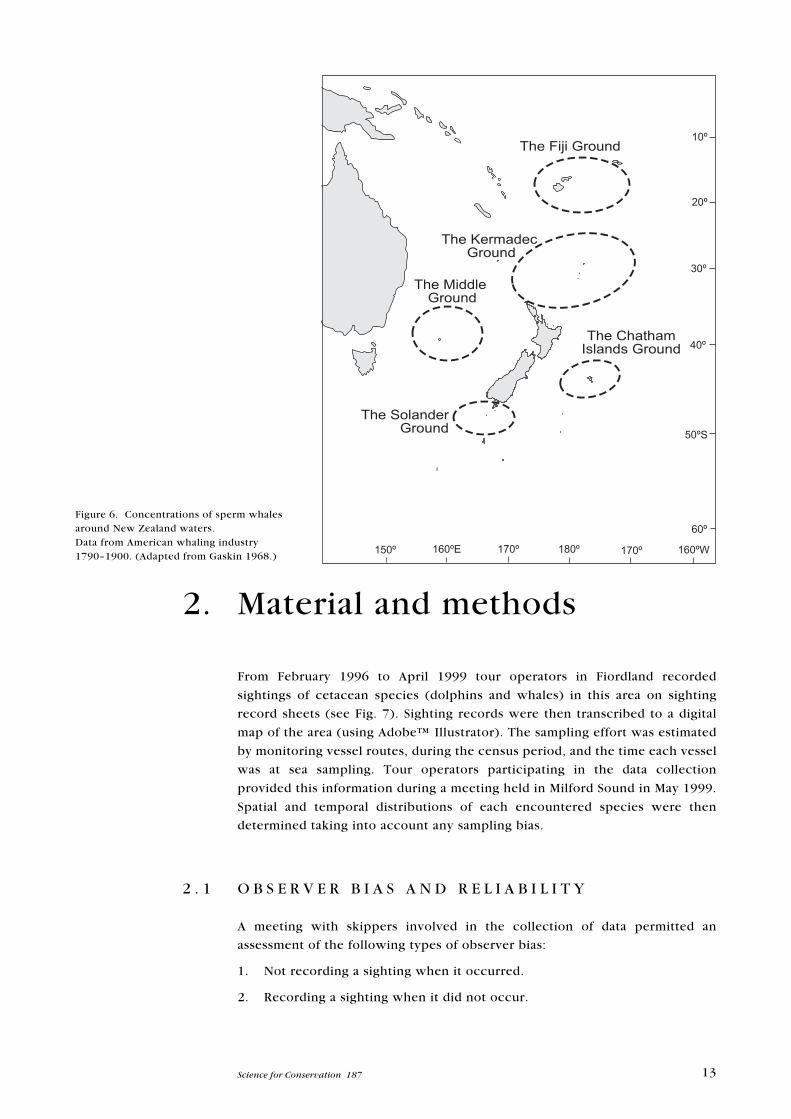
Sperm whale (Physeter catodon)
Sperm whales have occasionally been observed along the coastline between
Doubtful and Breaksea Sounds (Webb 1973) but not inside the fiords. In most
cases only solitary individuals were observed. Fiordland borders one of the
former American whaling grounds (Fig. 6, Solander Ground) indicating that the
species was once more common off the Fiordland coastline.
Southern right whale (Eubalaena australis)
Southern right whales used to be common throughout New Zealand waters but
the species faced extinction at the beginning of the 20th Century due to over-
+#$
"*$
"#$
&(*$ &(#$'
��������0������������1������
����������0.�����������
* +**���
Figure 4. Movement pattern of humpback whales around New Zealand in summer and winter.(Adapted from Gaskin 1968.)
12 Lusseau & Slooten—Cetacean sightings off the Fiordland coastline
&)*$&%*$'&#*$ &(*$ &(*$ &%*$/
%*$
#*$
"*$
+*$
2*$
&*$
exploitation (whaling). There are reports of a specimen stranding in Freshwater
Basin in Milford Sound (Fig. 3) during the mid-1980s.
1 . 2 O B J E C T I V E S
There were several objectives for this study:
1. Determine the efficiency of the volunteer sighting network.
2. Determine what cetacean species are present along the Fiordland coastline.
3. Describe the distribution of each species both at a large scale (coastal) and fine
scale (within Doubtful and Milford Sounds).
4. Determine temporal variations in distribution for each species.
5. Assess inter-specific interactions (i.e. is there any relationship among species
distributions?).
6. Determine mean group size for each species, along with temporal and spatial
variations in this parameter.
Figure 5. Migration movements ofhumpback whales from the Antarcticarea V. (Adapted from Gaskin 1968.)
13Science for Conservation 187
&)*$&%*$'&#*$ &(*$ &(*$ &%*$/
%*$
#*$
"*$
+*$
2*$
&*$
���������������
����������������
�����������!������������
����3������������
����-�4�������
2. Material and methods
From February 1996 to April 1999 tour operators in Fiordland recorded
sightings of cetacean species (dolphins and whales) in this area on sighting
record sheets (see Fig. 7). Sighting records were then transcribed to a digital
map of the area (using Adobe™ Illustrator). The sampling effort was estimated
by monitoring vessel routes, during the census period, and the time each vessel
was at sea sampling. Tour operators participating in the data collection
provided this information during a meeting held in Milford Sound in May 1999.
Spatial and temporal distributions of each encountered species were then
determined taking into account any sampling bias.
2 . 1 O B S E R V E R B I A S A N D R E L I A B I L I T Y
A meeting with skippers involved in the collection of data permitted an
assessment of the following types of observer bias:
1. Not recording a sighting when it occurred.
2. Recording a sighting when it did not occur.
Figure 6. Concentrations of sperm whalesaround New Zealand waters.Data from American whaling industry1790–1900. (Adapted from Gaskin 1968.)
14 Lusseau & Slooten—Cetacean sightings off the Fiordland coastline
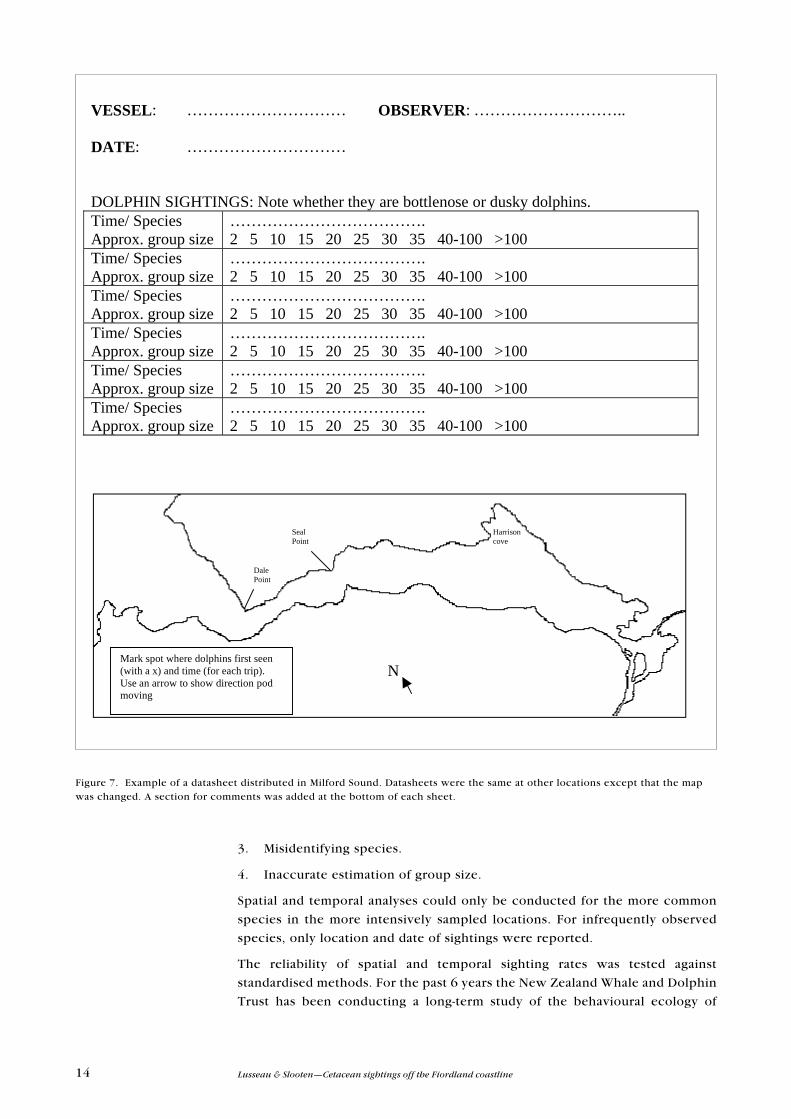
VESSEL: ………………………… OBSERVER: ………………………..
DATE: …………………………
DOLPHIN SIGHTINGS: Note whether they are bottlenose or dusky dolphins.Time/ SpeciesApprox. group size
……………………………….2 5 10 15 20 25 30 35 40-100 >100
Time/ SpeciesApprox. group size
……………………………….2 5 10 15 20 25 30 35 40-100 >100
Time/ SpeciesApprox. group size
……………………………….2 5 10 15 20 25 30 35 40-100 >100
Time/ SpeciesApprox. group size
……………………………….2 5 10 15 20 25 30 35 40-100 >100
Time/ SpeciesApprox. group size
……………………………….2 5 10 15 20 25 30 35 40-100 >100
Time/ SpeciesApprox. group size
……………………………….2 5 10 15 20 25 30 35 40-100 >100
NMark spot where dolphins first seen(with a x) and time (for each trip).Use an arrow to show direction podmoving
Harrisoncove
DalePoint
SealPoint
Figure 7. Example of a datasheet distributed in Milford Sound. Datasheets were the same at other locations except that the mapwas changed. A section for comments was added at the bottom of each sheet.
3. Misidentifying species.
4. Inaccurate estimation of group size.
Spatial and temporal analyses could only be conducted for the more common
species in the more intensively sampled locations. For infrequently observed
species, only location and date of sightings were reported.
The reliability of spatial and temporal sighting rates was tested against
standardised methods. For the past 6 years the New Zealand Whale and Dolphin
Trust has been conducting a long-term study of the behavioural ecology of

15Science for Conservation 187
bottlenose dolphins in Doubtful Sound. Spatial and temporal patterns have been
described in that fiord using a standardised systematic survey route and photo-
identification (Schneider 1999). The pattern observed from the sighting
network data was compared to the one described by Schneider (1999). In
addition, Schneider (1999) and Haase (2000) obtained bottlenose dolphin
group size frequencies in Doubtful Sound using visual scan sampling (Altman
1974) and photo-identification from 1994 to 1997 and in 1999. Again, the
sampling technique of the sighting network was tested against these techniques
to assess their reliability in dolphin group size estimation.
2 . 2 T E M P O R A L A N A L Y S E S
Temporal variations in species sightings, standardised to the sampling effort,
were assessed at a seasonal level using a presence/absence coding of sightings.
The existence of cycles was also assessed. Once these temporal variations were
ascertained for each species, inter-specific interactions were easily determined.
The year was divided into seasons to assess differences in frequency of
occurrence of each species in each location. Seasons were defined as follow:
• Summer: December, January, and February.
• Autumn: March, April, and May.
• Winter: June, July, and August.
• Spring: September, October, and November.
2 . 3 S P A T I A L A N A L Y S E S
Spatial analyses could only be conducted for sightings in Milford and Doubtful
Sounds. Variations in spatial distribution were estimated by dividing these two
fiords into quadrats (Figs 2 and 3C). In the case of Milford Sound three
geographic scales were utilised to assess spatial patterns, with quadrats of
approximately equal size (Fig. 3C and Table 1). For Doubtful Sound, quadrats
were determined on a geographic basis (arms v. main fiord body); consequently
quadrats had unequal surface area. This discrepancy was taken into
consideration when calculating expected frequencies of occurrence of dolphins
TABLE 1 . THREE GEOGRAPHIC SCALES UTILISED TO ASSESS SPATIAL PATTERN
IN MILFORD SOUND.
SCALE DESCRIPTION (F IGURE 3C)
Fine scale 12 quadrats
Entrance, middle, and upper fiord Entrance: quadrats 1 + 12
Middle: quadrats 2 + 3 + 10 + 11
Upper fiord: quadrats 4 + 5 + 6 + 7 + 8 + 9
North and South coasts North: quadrats 1 + 2 + 3 + 4 + 5 + 6
South: quadrats 7 + 8 + 9 + 10 + 11 + 12

16 Lusseau & Slooten—Cetacean sightings off the Fiordland coastline
in each quadrat. In other words the expected probability of finding dolphins in
a quadrat was related to the size of that quadrat.
Subsequently a goodness of fit test, using a chi-square distribution, was
performed to investigate the deviation of observed frequency of sightings in
each quadrat from the expected frequency. If the distribution of cetaceans was
homogeneous then the chances of observing them in any quadrat would be
equal (or related to the size of the quadrat). Differences between observed and
expected frequencies for each quadrat were then added up and this sum was
compared to a χ2 (chi-square) distribution. This goodness of fit test was chosen
because all quadrats had more than five sightings. It was used to determine if
the overall pattern of dolphin distribution was significantly different from
random.
2 . 4 G R O U P S I Z E F R E Q U E N C Y D I S T R I B U T I O N
To assess variations of group size among species and location observed group
sizes were classified using 10 group size categories (see Fig. 7). Because of the
difference in class sizes provided in the datasheet, the data were pooled into 9
equal group size classes (classes of size 5 individuals). Medians for grouped data
and 25% and 75% quartiles were calculated following the technique described
by Sokal & Rohlf (1981). These statistics provide an estimation of the central
tendency and the degree of variability of the frequency distribution. In other
words they provide the same information as average and standard deviation
would for a continuous dataset. Most group sizes were estimated as ranges and
therefore could be included in group size classes but point data could not be
estimated without increasing the estimation error of each sighting. Group sizes
were then compared for different locations using a χ2 test of independence.
This analysis tested the independence of group size frequency distribution from
the area in which the group was encountered.
3. Results
3 . 1 O B S E R V E R B I A S
Tour operators seem to have a good understanding of the cetacean species that
occur regularly in Fiordland. However, there seems to be some discrepancies in
the ability to identify infrequently seen species. Therefore, sightings of these
species were only recorded when they were correctly and independently
identified by several observers.
There is a chance that dolphins were present but not sighted. Some skippers felt
that dolphins had eluded them during long dives. There were no quantitative
data for dolphins being present but unrecorded but if it did occur it was likely
to be infrequent because of the number of observers involved in the data

17Science for Conservation 187
collection. Moreover the cruises undertaken were not stopped after one group
of dolphin was encountered. Since tours operating in Fiordland are scenic
cruises, the trajectory of the cruise is constant over time and always completed.
Therefore the probability that a group of dolphin was not recorded because
another group was already present in the fiord is low. It is equivalent to the
probability a group of dolphins was not sighted yet was present. No data were
available to assess the probability that a sighting was recorded when none
occurred, but we judged that the likelihood was low. Observers seemed to have
recorded sightings only when confirmed by other operators. Moreover, because
of the geography of fiords the distance between boats and animals was never
excessive.
On six occasions different vessels recorded the same sighting (same location at
the same time). By comparing the group size estimated by each observer for
these sightings it was determined that the estimation of group size was
reasonably consistent among observers and never deviated by more than one
group size class.
Tours started at different times of the day and more tours occurred during
afternoon than morning hours. It was therefore not possible to assess difference
in dolphin distribution depending on time of the day.
3 . 2 S A M P L I N G E F F O R T
Seasons were unequally sampled in all locations. The Fiordland coastline was
only sampled by one boat during winter months (May to September) and by
occasional cruises during the other months. By contrast, Milford and Doubtful
Sounds were sampled less during winter (Tables 2 and 3). Most sampling
occurred temporally during 1997 and 1998 and, as expected, spatially in Milford
and Doubtful Sounds (Tables 2, 3 and 4).
Milford Sound was evenly sampled by tour operators (see Fig. 8) except for
quadrat 7 which was not always entirely visited. Deepwater basin was regularly
visited by only one vessel. This lack of regular observation was taken into
consideration when calculated the area sampled in quadrat 7. In Doubtful
Sound quadrats 1 to 5 were habitually sampled (see Fig. 9) throughout the year.
TABLE 2 . TOTAL NUMBER OF DAYS SPENT
OBSERVING IN DOUBTFUL SOUND EVERY SEASON,
1997–99.
SEASON 1997 1998 1999 TOTAL
Summer 90 90 75 255
Autumn 50 59 3 112
Winter 41 38 N/A 79
Spring 50 57 N/A 107
TABLE 3 . TOTAL NUMBER OF DAYS SPENT
OBSERVING IN MILFORD SOUND EVERY SEASON,
1996–99.
SEASON 1996 1997 1998 1999 TOTAL
Summer 28 89 90 90 297
Autumn 92 71 92 61 316
Winter 57 30 0 N/A 87
Spring 0 70 59 N/A 129

18 Lusseau & Slooten—Cetacean sightings off the Fiordland coastline
TABLE 4 . RELATIVE FREQUENCY OF S IGHTINGS (n = 1422) IN EACH SAMPLED
REGION OF FIORDLAND, 1996–99.
LOCATION FREQUENCY OF S IGHTINGS (%)
Milford Sound 52.60
George Sound 0.14
Doubtful Sound 42.83
Between Doubtful and Dusky Sounds 0.42
Dusky Sound 3.66
South of Preservation Inlet 0.35
3 . 3 S P E C I E S I N F R E Q U E N T L Y O B S E R V E D
Seven species were infrequently observed by the sighting network in Fiordland
waters (Table 5 and Figs 10 and 11). Common dolphins were observed only
during summer months (3 sightings, Table 6) and at the entrance of fiords (Figs
10 and 11). Both sightings in Doubtful Sound were in the gut area (Fig. 10). No
description allowed to distinguishing which species of common dolphin is
present in Fiordland. Southern long-finned pilot whales (Globicephala melaena
edwardi) were sighted at the entrance of Dusky Sound and in Doubtful Sound,
in the vicinity of Elizabeth Island (Figs 10 and 11). Only two sighting records
were available for that species. In both cases the group size was small (1 and 5
individuals) which is uncommon for the species. These sightings are the first
official record of this species in Fiordland. A group of 10 orcas was observed
travelling south at the entrance of Milford Sound (Fig. 11).
Sperm whales were observed on two occasions in the vicinity of Dagg Sound
during winter 1996 and 1998 (Fig. 11). Surprisingly, humpback whales were
Figure 8. Typical cruise pattern followed (clockwise) by tour operators in Milford Sound.

19Science for Conservation 187
Figure 9. Typical cruise pattern followed by tour operators in Doubtful Sound.
observed during summer and winter, seasons when they are supposed to be at,
respectively, their feeding and breeding grounds (Table 6). A group of six
whales was encountered inside Doubtful Sound as far as the entrance of
Crooked Arm in January 1998 (Fig. 10). A solitary minke whale (Balenoptera
acutorostrata) was sighted off Ferguson Island, Doubtful Sound in October
1997, constituting the first official record of this species in Fiordland. Finally,
only a solitary southern right whale was seen during this 3-year observation
period in Milford Sound in June 1997.

20 Lusseau & Slooten—Cetacean sightings off the Fiordland coastline
TABLE 5 . RELATIVE FREQUENCY OF OCCURRENCE (n = 1422) OF EACH
CETACEAN SPECIES OBSERVED FROM TOUR BOATS IN FIORDLAND, 1996–99.
SPECIES FREQUENCY OF S IGHTINGS (%)
Bottlenose dolphin 87.75
Dusky dolphin 10.35
Mixed schools of bottlenose and dusky dolphins 0.28
Common dolphin 0.28
Pilot whale 0.14
Orca 0.07
Sperm whale 0.14
Humpback whale 0.35
Minke whale 0.07
Southern right whale 0.07
��������������������������5����������������������������������
Figure 10. Sighting records ofinfrequently observed species inDoubtful Sound.

21Science for Conservation 187
�����������
����������
������������
��������
"%$
&%%$' &%($ &%)$
* #*���
�
�
�
��
��
��������������������������������������������5�����������������������1������������ ������������������
�
TABLE 6 . SEASONAL OCCURRENCE (NUMBER OF DAYS WITH SIGHTINGS) OF
INFREQUENTLY OBSERVED SPECIES ALONG FIORDLAND COASTLINE, 1996–99.
SUMMER AUTUMN WINTER SPRING
Common dolphin 3 - - -
Pilot whale 1 - - 1
Orca 1 - - -
Sperm whale - - 2 -
Humpback whale 2 (Jan) - 1 (Jul) 1 (Nov)
Minke whale 1
Southern right whale - - 1 -
Figure 11. Sighting records along the Fiordlandcoast, 1996–99. Numbers next to symbols givethe number of sightings at that locality.Sightings of bottlenose dolphins in Milford andDoubtful Sounds are not included. For sightingsof infrequently seen species in Doubtful Soundsee Fig. 10.

22 Lusseau & Slooten—Cetacean sightings off the Fiordland coastline
3 . 4 M I L F O R D S O U N D
3.4.1 Spatial variation
Bottlenose dolphinSightings of bottlenose dolphins were not homogeneous throughout Milford
Sound. In the finer scale analysis most of the χ2 value was contributed by
differences from expected sighting frequency in quadrats 2, 3, and 4 (Table 7).
Bottlenose dolphins tended to spend more time in these quadrats than would be
expected if sightings were evenly distributed among quadrats. They also tended
to spend more time along the northern shore, especially in the vicinity of Dale
Point (Table 8, Fig. 12) and in the middle of the fiord (Table 9).
Dusky dolphinSimilarly, the chance of finding dusky dolphins in Milford Sound was not equally
distributed over the fiord (n = 89, χ2 = 60.26, p < 0.0001). Most sightings
occurred in quadrat 1 (25.8%, n = 89). Tables 10 and 11 and Fig. 13 also show
TABLE 7 . RELATIVE FREQUENCY OF OCCURRENCE (%) OF BOTTLENOSE
DOLPHINS IN EACH QUADRAT IN MILFORD SOUND FROM FEBRUARY 1996 TO
MAY 1998.
QUADRAT OVERALL (n = 513) SUMMER (n = 208) AUTUMN (n = 198)
1 7.4 7.7 6.1
2 14.2 19.2 11.1
3 14.0 12.0 16.7
4 13.6 11.1 14.6
5 4.7 6.7 4.5
6 7.8 5.8 10.1
7 4.9 4.8 6.6
8 4.1 5.8 2.0
9 7.8 6.2 8.1
10 10.1 7.2 11.6
11 7.4 8.6 5.0
12 3.9 4.8 3.5
Homogeneity test χ2 = 100.96 χ2 = 46.54 χ2 = 54.00
p < 0.0001 p < 0.0001 p < 0.0001
TABLE 8 . RELATIVE FREQUENCY OF OCCURRENCE (%) OF BOTTLENOSE
DOLPHINS ALONG EACH SHORE OF MILFORD SOUND FROM FEBRUARY 1996 TO
MAY 1998.
SHORELINE OVERALL (n = 513) SUMMER (n = 208) AUTUMN (n = 198)
North shore 61.8 62.5 63.1
South shore 38.2 37.5 36.9
Homogeneity test χ2 = 28.45 χ2 = 13.00 χ2 = 13.66
p < 0.0001 p = 0.0003 p = 0.0002

23Science for Conservation 187
TABLE 9 . RELATIVE FREQUENCY OF OCCURRENCE (%) OF BOTTLENOSE
DOLPHINS IN EACH SECTION OF MILFORD SOUND FROM FEBRUARY 1996 TO
MAY 1998.
SECTION OVERALL (n = 513) SUMMER (n = 208) AUTUMN (n = 198)
Entrance 11.3 12.5 9.6
Middle 45.8 47.1 44.4
Upper fiord 42.9 40.4 46.0
Homogeneity test χ2 = 37.99 χ2 = 17.87 χ2 = 13.92
p < 0.0001 p = 0.0001 p < 0.001
Figure 12. Sighting records of bottlenose dolphins in Milford Sound, 1996–98.
that dusky dolphins tended to be found at the entrance and in the outer fiord,
with few sightings in the inner middle portion of the fiord.
3.4.2 Temporal variation
Bottlenose dolphinBottlenose dolphins appeared to be present year-round in Milford Sound (Fig.
14). The number of sightings was generally lower during winter and spring but
the sighting effort during these months is too low to draw any firm conclusions
from this result (Table 12).
Dusky dolphinObservations of dusky dolphins indicate that the dolphins are mainly present in
Milford Sound during summer months (Fig. 15 and Table 13). However the low
sampling effort outside the summer season made it impossible to test this
hypothesis.

24 Lusseau & Slooten—Cetacean sightings off the Fiordland coastline
*
&*
2*
+*
"*
#*
%*
(*
)*
-��6
���������
��������
��� ���� �
������
����
�����������789
*
#
&*
&#
2*
2#
+*��
����������
����
�����
������
:��-����.�����:��:��.����1����� :��-����.�����:��:��.����1����� :��-����.�����:��:��.����1����� :��-����.
�� ���� �������� �����
& ; ; % & ; ; ( & ; ; ) & ; ; ;
TABLE 10. RELATIVE FREQUENCY OF
OCCURRENCE (%, n = 89) OF DUSKY DOLPHINS
ALONG EACH SHORE OF MILFORD SOUND FROM
FEBRUARY 1996 TO MAY 1998.
SECTION FREQUENCY (%)
North shore 61.8
South shore 38.2
Homogeneity test χ2 = 4.96
p = 0.026
TABLE 11. RELATIVE FREQUENCY OF
OCCURRENCE (%, n = 89) OF DUSKY DOLPHINS
IN EACH SECTION OF MILFORD SOUND FROM
FEBRUARY 1996 TO MAY 1998.
SECTION FREQUENCY (%)
Entrance 39.3
Middle 12.4
Upper fiord 48.3
Homogeneity test χ2 = 39.21
p < 0.0001
Figure 13. Sighting records of dusky dolphins in Milford Sound, 1996–98.
Figure 14. Monthly frequency of occurrence (%) of bottlenose dolphins in Milford Sound fromJanuary 1996 to April 1999. Frequencies are standardised to the time spent observing eachmonth, shown on the right-hand axis.

25Science for Conservation 187
:��-����.�����:��:��.����1�����*
&*
2*
+*
"*
#*
%*
#
&*
&#
2*
2#
+*
:��-����.�����:��:��.����1����� :��-����.�����:��:��.����1����� :��-����.
��
����������
����
�����
������
�� ���� �������� �����
& ; ; % & ; ; ( & ; ; ) & ; ; ;
-��6
���������
��������
��� ���� �
������
����
�����������789
TABLE 12. FREQUENCY OF OCCURRENCE (%) OF
DAYS WITH SIGHTINGS OF BOTTLENOSE
DOLPHINS IN MILFORD SOUND (1996–99)
STANDARDISED TO THE NUMBER OF DAYS SPENT
COLLECTING DATA.
SEASON 1996 1997 1998 1999 TOTAL
Summer 60.7 52.8 20.0 7.8 35.3
Autumn 27.2 46.5 38.0 34.4 36.5
Winter 22.8 40.0 N/A N/A 31.4
Spring N/A 35.7 45.8 N/A 40.7
TABLE 13. FREQUENCY OF OCCURRENCE (%) OF
DAYS WITH SIGHTINGS OF DUSKY DOLPHINS IN
MILFORD SOUND (1996–99) STANDARDISED TO
THE NUMBER OF DAYS SPENT COLLECTING DATA.
SEASON 1996 1997 1998 1999 TOTAL
Summer 7.1 28.1 8.9 15.6 14.9
Autumn 0.0 1.4 1.1 1.6 1.0
Winter 0.0 0.0 N/A N/A 0.0
Spring N/A 0.0 5.1 N/A 2.5
Figure 15. Monthly frequency of occurrence (%) of dusky dolphins in Milford Sound fromFebruary 1996 to April 1999. Frequencies are standardised to the time spent observing eachmonth, shown on the right-hand axis.
3.4.3 Interaction between bottlenose and dusky dolphins
Sufficient data to examine the interaction between these two species was only
available for Milford Sound. A larger sample size is required to detect any
significant trend in the interaction between the two species. However, it was
noticeable that both species are rarely present at the same time in Milford
Sound.
Dusky dolphins were sighted on 55 days (6.6% of the sampling period) and
bottlenose dolphins on 289 days (34.9% of the sampling period). Out of those
days both species were encountered at the same time in the fiord on only 15
days (1.8% of the sampling period). In other words on most of the days dusky
dolphins were sighted (72.7%), bottlenose dolphins were not encountered
within the fiord. Conversely, on 94.8% of the days bottlenose dolphins were
sighted, dusky dolphins were absent from Milford Sound. In both cases the
probability of finding one species when another is present is significantly less
than random (Fisher’s exact test: encountering bottlenose dolphins when dusky
dolphins are present, p = 0.0013; encountering dusky dolphins when bottle-
nose dolphins are present, p < 0.0001).

26 Lusseau & Slooten—Cetacean sightings off the Fiordland coastline
3.4.4 Seasonal variations in habitat use
Sufficient data were available to analyse the interaction of space and time in
only bottlenose dolphin distribution for summer and autumn months. The
preference for the northern shore of the middle portion of the fiord seemed to
be consistent during summer and autumn (Tables 7, 8 and 9; Figs 16 and 17).
The middle of the fiord seemed to be also preferred during winter and spring,
but more data are needed for a thorough statistical analysis (Figs 18 and 19).
3.4.5 Group size
Bottlenose dolphinThe median group size was 16 individuals (Fig. 20). Bottlenose dolphin group
size was not related to the shoreline along which they were observed (north vs.
south shore: n = 508, χ2 = 9.62, df = 8, p = 0.29). Large groups were observed
more often in the fiord entrance, while smaller groups were sighted more often
inside the fiord (χ2 = 33.71, df = 12, p < 0.001, Table 14).
������������
.���.���.���
Figure 16. Sighting records of bottlenose dolphins in Milford Sound, summer 1996–98.
Figure 17. Sighting records of bottlenose dolphins in Milford Sound, autumn 1996–98.

27Science for Conservation 187
/�����/�����/�����
���� ���� ����
Figure 18. Sighting records of bottlenose dolphins in Milford Sound, winter 1996–98.
Figure 19. Sighting records of bottlenose dolphins in Milford Sound, spring 1996–98.
Dusky dolphinThe median group size was 32 individuals (Fig. 21). No spatial analysis of group
size frequency distribution could be performed because the sample size was too
low (n = 98).
3 . 5 D O U B T F U L S O U N D
Bottlenose dolphins were the only species seen frequently in Doubtful Sound.
Consequently, spatial and temporal analyses of sighting records could only be
carried out for this species.
3.5.1 Spatial variation
Quadrats were unequally sampled in Doubtful Sound. Most observers spent
most of their time in quadrats 1 to 5. As they were the only ones equally

28 Lusseau & Slooten—Cetacean sightings off the Fiordland coastline
*
2*
"*
%*
)*
&**
&2*
*<# #<&* &*<&# &#<2* 2*<2# 2#<+* +*<+# +#<"* ="*
�������,�������
��
��������� ���� �
�������>�&%?"
*
#
&*
&#
2*
2#
+*
+#
"*
"#
*<# #<&* &*<&# &#<2* 2*<2# 2#<+* +*<+# +#<"* ="*
�������,�������
��
��������� ���� � �������>�+&?(
TABLE 14 . GROUP SIZE FREQUENCY DISTRIBUTION IN EACH SECTION OF
MILFORD SOUND (1996–99) .
GROUP SIZE OBSERVED FREQUENCY (%)
CLASS (No. o f Entrance Middle Upper f iord
indiv idua ls ) (n = 58) (n = 230) (n = 220)
0–5 12.1 13.5 16.8
5–10 5.2 11.7 15.9
10–15 8.6 15.7 19.1
15–20 22.4 28.3 15.0
20–25 19.0 16.1 17.3
25–30 13.8 8.3 11.4
> 30 19.0 6.5 4.5
Independence test χ2 = 33.71 p < 0.001
Figure 20. Bottlenosedolphin group sizefrequency distribution(n = 508) in Milford Sound.
Figure 21. Dusky dolphingroup size frequencydistribution (n = 98) inMilford Sound.

29Science for Conservation 187
sampled, quadrats 1 to 5
were only considered in this
analysis.Bottlenose dolphins
tended to be observed more
than expected in Crooked
Arm and less than expected
in Deep Cove (Table 15 and
Fig. 22). This finding is in
agreement with results from
the long-term monitoring
program of bottlenose
dolphins in Doubtful Sound
(Schneider 1999).
A similar spatial distribution
seemed to occur during
summer and autumn (Table
15 and Fig. 23), but bottle-
nose dolphins tended to
spend more time in the main
body of the fiord (quadrat 5)
during the colder seasons
(Table 15 and Fig. 23). Once
again this distribution
matches the one described
by Schneider (1999); dol-
phins spent more time in the
arms during warmer seasons
and in the main fiord body
during colder seasons.
Figure 22. Sighting records of bottlenose dolphins in Doubtful Sound from December1996 to February 1999.
TABLE 15. RELATIVE FREQUENCY OF OCCURRENCE (%) OF BOTTLENOSE DOLPHINS IN EACH QUADRAT IN
DOUBTFUL SOUND FROM DECEMBER 1996 TO FEBRUARY 1999.
QUADRAT OVERALL (n = 518) SUMMER (n = 275) AUTUMN (n = 117) WINTER/SPRING (n = 123)
1 1.7 1.1 2.6 2.4
2 8.6 10.2 6.8 7.3
3 21.0 21.1 17.1 25.2
4 41.7 49.8 52.1 12.2
5 26.8 17.8 21.4 52.8
Homogeneity χ2 = 202.20 χ2 = 190.76 χ2 = 86.58 χ2 = 23.17
test p < 0.0001 p < 0.0001 p < 0.0001 p = 0.0001

30 Lusseau & Slooten—Cetacean sightings off the Fiordland coastline
��������
.��� /�����
Figure 23. Sighting records of bottlenose dolphins in Doubtful Sound during different seasons, December 1996 to February 1999.
31Science for Conservation 187
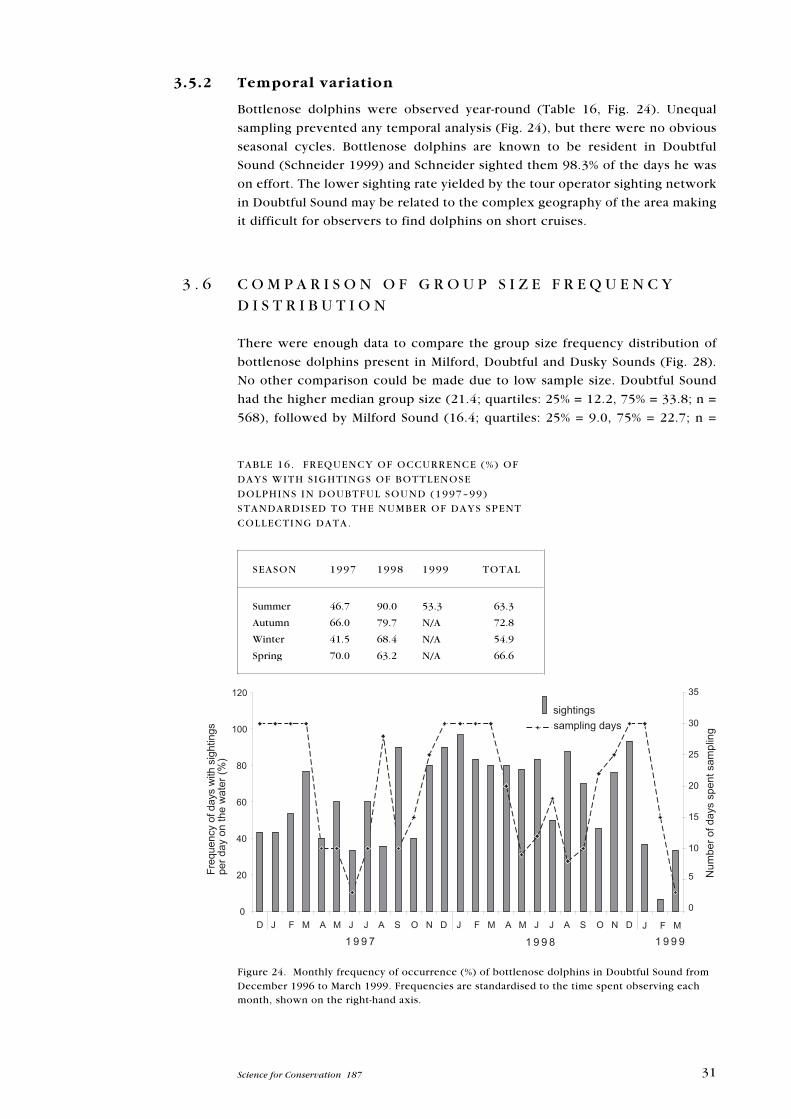
3.5.2 Temporal variation
Bottlenose dolphins were observed year-round (Table 16, Fig. 24). Unequal
sampling prevented any temporal analysis (Fig. 24), but there were no obvious
seasonal cycles. Bottlenose dolphins are known to be resident in Doubtful
Sound (Schneider 1999) and Schneider sighted them 98.3% of the days he was
on effort. The lower sighting rate yielded by the tour operator sighting network
in Doubtful Sound may be related to the complex geography of the area making
it difficult for observers to find dolphins on short cruises.
3 . 6 C O M P A R I S O N O F G R O U P S I Z E F R E Q U E N C YD I S T R I B U T I O N
There were enough data to compare the group size frequency distribution of
bottlenose dolphins present in Milford, Doubtful and Dusky Sounds (Fig. 28).
No other comparison could be made due to low sample size. Doubtful Sound
had the higher median group size (21.4; quartiles: 25% = 12.2, 75% = 33.8; n =
568), followed by Milford Sound (16.4; quartiles: 25% = 9.0, 75% = 22.7; n =
:�����-��������.�������:����:����.��������1��������*
2*
"*
%*
)*
&**
&2*
*
#
&*
&#
2*
2#
+*
+#
:�����-��������.�������:����:����.��������1�������� :�����-����
& ; ; (
�
& ; ; ) & ; ; ;
��
����������
����
�����
������
�� ���� �������� �����
-��6
���������
��������
��� ���� �
������
����
�����������789
TABLE 16. FREQUENCY OF OCCURRENCE (%) OF
DAYS WITH SIGHTINGS OF BOTTLENOSE
DOLPHINS IN DOUBTFUL SOUND (1997–99)
STANDARDISED TO THE NUMBER OF DAYS SPENT
COLLECTING DATA.
SEASON 1997 1998 1999 TOTAL
Summer 46.7 90.0 53.3 63.3
Autumn 66.0 79.7 N/A 72.8
Winter 41.5 68.4 N/A 54.9
Spring 70.0 63.2 N/A 66.6
Figure 24. Monthly frequency of occurrence (%) of bottlenose dolphins in Doubtful Sound fromDecember 1996 to March 1999. Frequencies are standardised to the time spent observing eachmonth, shown on the right-hand axis.

32 Lusseau & Slooten—Cetacean sightings off the Fiordland coastline
508) and Dusky Sound (11.3; quartiles: 25% = 6.0, 75% = 19.2; n = 46). The
sampling effort was spatially inconsistent in Dusky Sound. Because of the
relationship between spatial location and group size described above, the
sample size for Dusky Sound may be too low to obtain a reliable estimation of
the group size frequency distribution in that fiord. It was therefore not
compared with those from the two other fiords.
Group size frequency distributions in Milford and Doubtful Sounds were
independent (χ2 = 112.5, df = 8, p < 0.0001). The distribution for groups in
Doubtful seemed to peak at ‘10–15’ and ‘> 40’ size classes (Fig. 25), while the
one for groups in Milford seemed to peak only at the ‘15-20’ size class.
Frequency distribution of group size was compared to the one from the New
Zealand Whale and Dolphin Trust (NZWDT) obtained from 1994 to 1999,
inclusive (Schneider 1999; Haase 2000). Both Schneider’s (1999) and Haase’s
(2000) studies were pooled together in order to cover a similar time range as
the sighting network did (1994 to 1997 and 1999 vs. 1996 to 1999). The median
group size in Doubtful Sound is slightly higher than NZWDT’s estimate (median
group size = 20.3; quartiles: 25% = 11.84, 75% = 34.06; n = 1487) but falls
within the same range. The frequency distributions of group size described by
Schneider (1999) and Haase (2000) and the volunteer network were
significantly independent (χ2 = 24.76, df = 8, p = 0.002). Group size estimations
from Schneider and Haase studies are bound to be more accurate since they are
derived from photo-identification of every individual present in the group.
Figure 26 shows that operators tended to underestimate the number of groups
within the ‘25-30’ and ‘30-35’ classes and overestimate the number of groups
within the ‘35–40’ and ‘> 40’ classes. This bias in estimation is easily
demonstrated by pooling all classes above 25 individuals in size together. In that
case the frequency distributions described by Schneider and Haase and by the
sighting network are similar (χ2 = 3.8, df = 5, p = 0.578). This result demon-
*
#
&*
&#
2*
2#
+*
*<# #<&* &*<&# &#<2* 2*<2# 2#<+* +*<+# +#<"* ="*
�������,�
-��6
���������
�������
��78
9
�����������
��������
����������
Figure 25. Group size frequency distribution for bottlenose dolphin groups in Milford, Doubtful,and Dusky/Breaksea Sounds.

33Science for Conservation 187
*
2
"
%
)
&*
&2
&"
&%
&)
*<# #<&* &*<&# &#<2* 2*<2# 2#<+* +*<+# +#<"* ="*
�������,�
-��6
����
�����
�������
��78
9
�������������5����
�������������
strates that tour operators were not able to estimate accurately the size of
groups containing more than 25 individuals.
4. Discussion
4 . 1 O B S E R V E R B I A S A N D S A M P L I N G E F F O R T
The sighting network was an efficient way to gather data both at both large and
small scales over an extended period of time. Moreover the data collected were
in general agreement with results from standard sampling techniques applied in
another study in Doubtful Sound (Schneider 1999). It can therefore be
concluded that the spatial information gathered by that the sighting network is
reliable. However this study shows that group size could not be reliably
estimated if there was more than 25 individuals in the group. This bias in the
estimation of the size of large group did not affect the estimation of the median
group size. The median estimated from the sighting network data was in
agreement with Schneider (1999) and Haase (2000) findings. The inequality in
temporal sampling effort was the most notable disadvantage of this sampling
technique. This could be remedied by involving more diverse observers,
particularly those active when tourism activities are low.
Inconsistency in data collection was also a problem with the sighting network.
Calving seasons could not be estimated because the occurrence of calves in a
group was not consistently recorded (within and among observers). The
movement of the animals was another piece of information that, even though it
did not require much experience from observers, was not consistently
Figure 26. Comparison of group size frequency distributions between estimates of Schneiderand Haase (1994–97 and 1999) and of tour operators (1996–99).
34 Lusseau & Slooten—Cetacean sightings off the Fiordland coastline
reported. Despite these problems, it would still be very useful to continue to
collect these data. Quality can be increased to a reliable level with a minimum
of training of observers. Two studies relying on observers to collect data should
that the precision of data collection was increased by training of the observers,
as well as by increasing their experience (Miller & Death 1996; Kendall et al.
1996). Moreover, short-term double-blind tests would allow an assessment of
the efficiency of the training by monitoring the consistency in data collection.
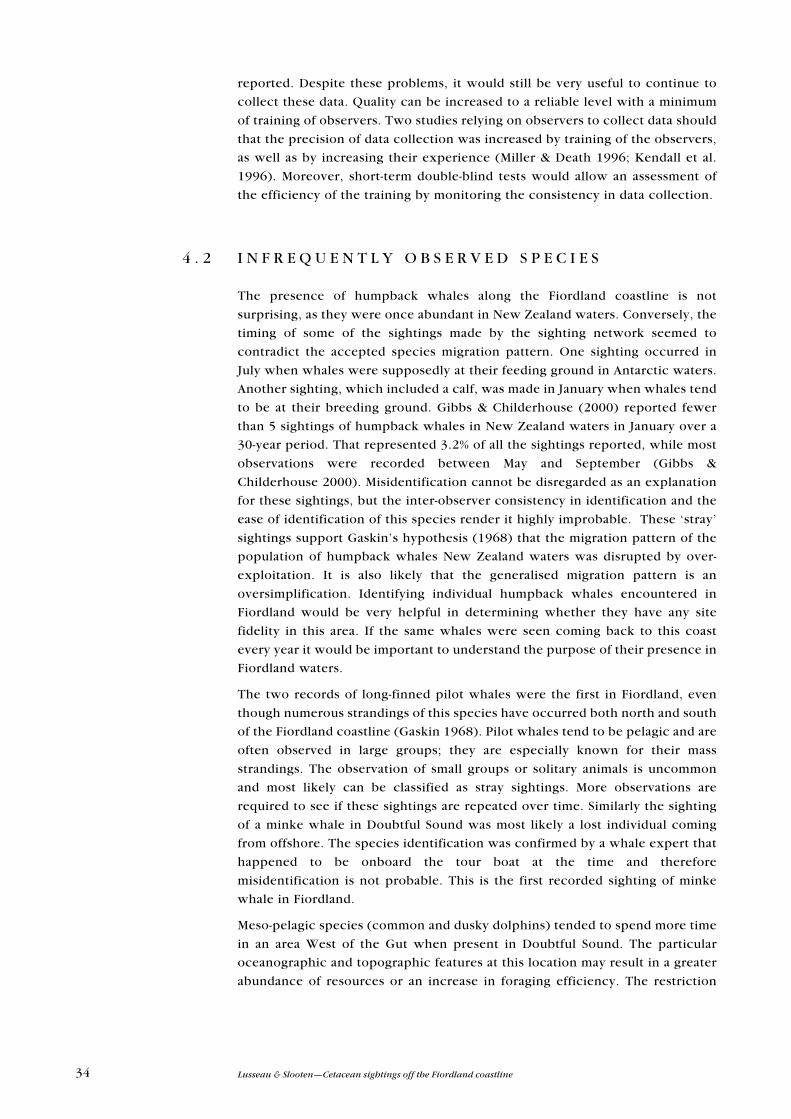
4 . 2 I N F R E Q U E N T L Y O B S E R V E D S P E C I E S
The presence of humpback whales along the Fiordland coastline is not
surprising, as they were once abundant in New Zealand waters. Conversely, the
timing of some of the sightings made by the sighting network seemed to
contradict the accepted species migration pattern. One sighting occurred in
July when whales were supposedly at their feeding ground in Antarctic waters.
Another sighting, which included a calf, was made in January when whales tend
to be at their breeding ground. Gibbs & Childerhouse (2000) reported fewer
than 5 sightings of humpback whales in New Zealand waters in January over a
30-year period. That represented 3.2% of all the sightings reported, while most
observations were recorded between May and September (Gibbs &
Childerhouse 2000). Misidentification cannot be disregarded as an explanation
for these sightings, but the inter-observer consistency in identification and the
ease of identification of this species render it highly improbable. These ‘stray’
sightings support Gaskin’s hypothesis (1968) that the migration pattern of the
population of humpback whales New Zealand waters was disrupted by over-
exploitation. It is also likely that the generalised migration pattern is an
oversimplification. Identifying individual humpback whales encountered in
Fiordland would be very helpful in determining whether they have any site
fidelity in this area. If the same whales were seen coming back to this coast
every year it would be important to understand the purpose of their presence in
Fiordland waters.
The two records of long-finned pilot whales were the first in Fiordland, even
though numerous strandings of this species have occurred both north and south
of the Fiordland coastline (Gaskin 1968). Pilot whales tend to be pelagic and are
often observed in large groups; they are especially known for their mass
strandings. The observation of small groups or solitary animals is uncommon
and most likely can be classified as stray sightings. More observations are
required to see if these sightings are repeated over time. Similarly the sighting
of a minke whale in Doubtful Sound was most likely a lost individual coming
from offshore. The species identification was confirmed by a whale expert that
happened to be onboard the tour boat at the time and therefore
misidentification is not probable. This is the first recorded sighting of minke
whale in Fiordland.
Meso-pelagic species (common and dusky dolphins) tended to spend more time
in an area West of the Gut when present in Doubtful Sound. The particular
oceanographic and topographic features at this location may result in a greater
abundance of resources or an increase in foraging efficiency. The restriction

35Science for Conservation 187
between Bauza and Secretary islands (Fig. 2) may make it easier for marine
predators to trap prey against the tidal flow.
4 . 3 M I L F O R D S O U N D
Little was known about cetaceans present in Milford Sound before the sighting
network was established. Many questions still await answers, but important
conclusions can be made from the first three years of survey.
4.3.1 Bottlenose dolphin
Bottlenose dolphins were present year-round in Milford Sound. The home range
of these dolphins clearly extends beyond Milford Sound, as their sighting
frequency within the Sound varies over time. The temporal pattern of their
presence is still unresolved, but they tend to be more common during warmer
months. The home range of other studied bottlenose dolphin populations is in
the vicinity of 100 km2 (Wells et al. 1988; Wilson et al. 1997; Schneider 1999). It
is therefore likely that Milford Sound alone cannot support a resident
population of bottlenose dolphins and that several fiords would be required to
meet their energetic and spatial requirements.
Tour operators reported seeing bottlenose dolphins repeatedly feeding on
yellow-eyed mullet by herding schools in small bays and trapping them against
the rock wall of the fiord. This may explain the apparent preference for the
middle northern shore of Milford Sound. This shoreline contains many cusps
and bays, which may facilitate predation, while the southern shore is more
even. Dolphins also seem to prefer narrowing areas such as Dale and Copper
Points (Figs 3 and 12). These places may also facilitate the capture of pelagic,
schooling prey.
There were also reports from tour operators of bottlenose dolphins feeding on
flounder, eels and trout. Most of these prey items (including yellow-eyed
mullet) have life cycles with pelagic and freshwater phases (McDowall 1990).
Their presence in Milford Sound is therefore dictated by these cycles and may
be highly seasonal. More observations are required to detect any differences in
habitat use that could be related to a seasonal shift in prey preference and
availability.
Group size relates to behavioural state in bottlenose dolphin groups in other
areas (Shane 1990; Lusseau et al. 1998). In Florida, bottlenose dolphins tend to
travel in larger groups and feed in smaller groups. The fact that larger groups
were observed at the entrance to Milford Sound suggests that bottlenose
dolphins may use the middle portion of the fiord mainly for feeding, while they
are likely to be in the process of travelling (in or out) when seen at the entrance
of the fiord.
4.3.2 Dusky dolphin
The presence of dusky dolphins in Milford Sound was highly seasonal, with
most of sightings during summer. The sighting pattern of dusky dolphins off
Kaikoura is similar; dolphins come to within 1–3 km of shore during daytime in

36 Lusseau & Slooten—Cetacean sightings off the Fiordland coastline
summer and tend to be sighted further offshore and in larger groups during
winter (Barr & Slooten 1999). This pattern may be related to a need to protect
newly born calves from offshore predation or to increase social interactions
during the reproduction period, but more information is required to test these
hypotheses.
Interestingly, dusky dolphins tended to avoid the deeper basin of Milford Sound
and spent more time at the entrance (Fig. 4). Dusky dolphins off Kaikoura tend
to feed at night, when their prey are present within 50–100 m of the surface
(Würsig et al. 1997). These dolphins may not be deep-divers preferring to wait
for their prey to come within reachable depths. A similar scenario may occur in
Milford Sound, which could explain dusky dolphins’ avoidance of the deeper
area (Fig. 4) and the preference for the shallower entrance basin. Once again
more data are required before habitat use of dusky dolphins in Milford Sound
can be fully understood.
Dusky dolphins tended to be observed in large groups, which is normal for this
species. More observations are necessary to determine whether group size
varies with their location in the fiord.
4.3.3 Interaction between dusky and bottlenose dolphins
There were reports from tour operators of dusky dolphins actively avoiding
bottlenose dolphins when both species were simultaneously present in Milford
Sound. However, mixed schools of these two species were also encountered.
The interaction between these two dolphins remains unclear, even though
there seems to be a tendency for them not to be seen at the same time in Milford
Sound. Dusky and bottlenose dolphins may feed on different prey species, and
the spatial abundance of these may determine which species of dolphin is
present. It can also be hypothesised that the presence of one species of dolphin
may impair the foraging ability of the other and therefore displace that species.
This is the case with sympatric populations of orcas where transient and
resident orcas are rarely observed in the same area at the same time (Baird & Dill
1995). Resident orcas mainly feed on fish and have developed highly specialised
vocalisation patterns to co-operate during foraging bouts. Transient orcas
mainly feed on other marine mammals that are able to detect orca vocalisations.
Transient orcas are silent during hunting to avoid being detected by their prey.
The presence of resident orcas therefore makes it difficult for transient orcas to
feed, as their prey are alerted by the vocalisations of the residents. Similar
differences may exist between dusky and bottlenose dolphins; for example,
some fish species may be more sensitive to bottlenose dolphin vocalisations,
these same fish being the preferred prey of dusky dolphins.
4 . 4 D O U B T F U L S O U N D
Observations in Doubtful Sound agreed with results from previous research
(Schneider 1999). Bottlenose dolphins can be observed year-round and tend to
spend more time in the arms of the fiord during warmer months and in the main
body of the fiord during colder months. Dusky dolphins are seen infrequently
throughout the fiord.
37Science for Conservation 187
4 . 5 B O T T L E N O S E D O L P H I N G R O U P S I Z E I N
M I L F O R D , D O U B T F U L , A N D D U S K Y S O U N D S
Bottlenose dolphins are often encountered in Dusky and Breaksea Sounds (Fig.
11) and this fiord system may support a resident population. When comparing
group size of bottlenose dolphins in this fiord with those in Doubtful and
Milford Sounds, it is found that the largest fiord (Dusky/Breaksea Sound) seems
to have the smallest median group size. This could be due to a biased sampling
effort and a limited sample size (i.e. number of trips) in Dusky Sound compared
with the two other fiords. Group size is related to spatial location (see above)
so, without an equal sampling of most parts of the fiord (e.g. arms and main
body, inner and outer fiord) it is not possible to draw conclusions about
differences in group size. A better understanding of the spatial use of Dusky
Sound by tour operators is needed.
In Milford and Doubtful Sounds, observed group size fits the theory that the size
of the group depends on the occupied habitat: the greater the depth and/or the
openness of the area, the larger the school (Norris & Dohl 1980).
5. Conclusions andrecommendations
There is still much information that needs to be gathered on cetaceans utilising
Fiordland. Cetaceans are one of the most important natural resources of
Fiordland. They affect, and are affected by, all user groups present in this
unique region. Their link to non-consumptive users is evident since they are one
of the main reason tourists cruise the fiords. As key species in the local
ecosystem cetaceans are also indirectly related to consumptive user groups.
Much information on cetaceans can be gathered by the established sighting
network, and it appears to be relatively efficient and reliable. However, there is
also a need to answer specific questions that will require more standard
methodology. For example, managing the potential effects of tourism requires a
better understanding of the detailed ecology of bottlenose dolphins in Milford
Sound, including population size, their residency pattern and their foraging
ecology. It is also important to understand why dusky dolphins visit Milford
Sound. Do they visit during summer months because of prey availability or to
provide a protective area for their calves? Where do they spend the rest of the
year? Finally a better understanding of how humpback whales use Fiordland
waters would be useful. Do the same individuals come back every year? How do
they utilise Fiordland? Are humpback whales seen just stray individuals taking a
rest on their migrations? Do the same individuals spend a long period in the
same area? Can they be related to humpback whales seen on nursery grounds?
Increased collaboration between the scientific community carrying formal
studies in Fiordland and the tour boat sighting network will improve the
amount and quality of data available on cetaceans in Fiordland.

38 Lusseau & Slooten—Cetacean sightings off the Fiordland coastline
This study raised several issues concerning the tour operator-sighting network,
which can be remedied to improve the quality of the data gathered. Here are
recommendations to help improve the sighting record quality.
Diversification of the observers involved in the networkDiversification will help to increase the sampling effort during the winter
season and increase the sampling effort of Fiordland coastline outside Milford
and Doubtful Sounds. Fishing charter operators, professional fishermen, and
helicopter and plane pilots would be good candidates to join the sighting
network.
Photo-identificationObservers of the sighting network are more prone to encounter infrequently
seen cetacean species. They should therefore be encouraged and trained to
contribute photo-identifications of individual whales and dolphins
encountered.
New sighting sheetA new sighting sheet (similar to the one proposed in Fig. 27) needs to be
established to eliminate the confusion of what should be recorded. It is also
necessary to clarify group size classes. The new sighting sheet needs to enable
observers to systematically record:
• The size of the group (group size estimation should not go beyond 25 individuals)
• The presence of calves in the group
• Effort (whether cetaceans were sighted or not)
• Movement of the group
TrainingAn information seminar would benefit observers willing to join the sighting
network. The seminar could be designed as a one-day forum and the following
issues could be raised:
• How to recognise calves and juveniles from adults
• How to record effort
• How to photo-identify cetaceans
• Estimation of the size of large groups of cetaceans
• Familiarisation with the sighting sheet
• How to identify whales and dolphins
FeedbackEvery year a meeting could be held or a report could be sent to every observer
taking part to the sighting network. Such a document would explain the
progress made in the year by the network and how the data gathered has been
utilised. This feedback is necessary to maintain the interest, and therefore the
reliability, of the observers.
Double-blind test for quality controlOnce a year a double-blind test could be run in a random location within the
sampled area (i.e. Fiordland). The goal of the test would be to determine the

39Science for Conservation 187
This sheet needs to be filled in every day. One sheet per day.
VESSEL: ………………………… OBSERVER: ………………………..
DATE: …………………………
Did you observe any dolphin/whale today? Yes No (circle one)
CETACEAN SIGHTINGS: Note the species1 Time/ Species
group size (circle one range)
calf present?
……………………………….
0-5 5-10 10-15 15-20 20-25 >25
Yes No (circle one) How many?:…………..
2 Time/ Species
group size (circle one range)
calf present?
……………………………….
0-5 5-10 10-15 15-20 20-25 >25
Yes No (circle one) How many?:…………..
3 Time/ Species
group size (circle one range)
calf present?
……………………………….
0-5 5-10 10-15 15-20 20-25 >25
Yes No (circle one) How many?:…………..
4 Time/ Species
group size (circle one range)
calf present?
……………………………….
0-5 5-10 10-15 15-20 20-25 >25
Yes No (circle one) How many?:…………..
5 Time/ Species
group size (circle one range)
calf present?
……………………………….
0-5 5-10 10-15 15-20 20-25 >25
Yes No (circle one) How many?:…………..
Mark location where cetaceans were first seen (with a x). Place the sighting number (fromthe table) next to the cross. Indicate with an arrow the direction the animals are moving.
N
Harrisoncove
DalePoint
SealPoint
Figure 27. Suggested improvements for datasheet distributed in Milford Sound. A ‘comments’ section will also be present at thebottom of the sheet.

40 Lusseau & Slooten—Cetacean sightings off the Fiordland coastline
precision and accuracy of the sighting network by using standard sampling
methods. In a location where sampling is known to occur, an independent
vessel would run a series of strip transects looking for cetaceans. Every time a
cetacean group was encountered, similar information that gathered by the
network would be recorded. Both sets would later be compared.
6. Acknowledgements
We would like to thank the University of Otago Division of Sciences and the
Departments of Zoology and Marine Sciences for their financial, technical and
logistic support. This work was contracted by the Department of Conservation,
Southland Conservancy and we are profoundly indebted to Lindsay Chadderton
(DOC Invercargill, now Northern Regional Office); without his efforts this
compilation would not have existed. We are grateful to the tour operating
companies that took part to this sighting network: Fiordland Travel, Red Boat
Cruises, and Fiordland Ecology Holidays. The data were collected by the crew
of: Breaksea Girl, Commander Peak, Kay Dee II, Lady of the Sound, Lady of
the South Pacific, Lady Stirling, Milford Flyer, Milford Wanderer, and
Monarch; we thank them for all their efforts. We would also like to thank
Lynette Clelland, Mark Orams, Jaap Jasperse and Ian West, whose critical review
of this manuscript greatly increased its clarity.
7. References
Altmann, J. 1974: Observational study of behavior: sampling methods. Behaviour 49: 227–267.
Barr, K.; Slooten, E. 1999: Effects of tourism on dusky dolphins in Kaikoura. Conservation Advisory
Science Notes 229. 28 p. Department of Conservation, Wellington.
Baird, R.W.; Dill, L.M. 1995: Occurrence and behaviour of transient killer whales: seasonal and pod-
specific variability, foraging behaviour, and prey handling. Canadian Journal of Zoology
73(7): 1300.
Boulinier, T.; Nichols, J.D.; Hines, J.E.; Sauer, J.R.; Flather, C.H.; Pollock, K.H. 2001: Forest
fragmentation and bird community dynamics: Inference at regional scales. Ecology 82(4):
1159–1169.
Brett M.T.; Goldman, C.R. 1997: Consumer versus resource control in freshwater pelagic food webs.
Science 275: 384–386.
Estes, J.A.; Duggins, D.O.; Rathbun, G.B. 1989: The ecology of extinction in kelp forest communities.
Conservation Biology 3: 252–264.
Gaskin, D.E. 1968: The New Zealand Cetacea. Fisheries Research Bulletin 1. 92 p. Fisheries Research
Division, New Zealand Marine Department, Wellington.
Gaskin, D.E. 1982: The Ecology of Whales and Dolphins. 460 p. Heinemann Educational Books,
London.
41Science for Conservation 187
Gibbs, M.T.; Bowman, M.J.; Dietrich, D.E. 2000: Maintenance of near-surface stratification in
Doubtful Sound, a New Zealand fjord. Estuarine Coastal & Shelf Science 51(6): 683–704.
Gibbs, N.; Childerhouse, S. 2000: Humpback whales around New Zealand. Conservation Advisory
Science Notes 287. Department of Conservation, Wellington.
Haase, P. 2000: Social organisation, behaviour and population parameters of bottlenose dolphins in
Doubtful Sound, Fiordland. MSc Thesis, University of Otago. 110 p.
Heyning, J.E.; Perrin, W.F. 1994: Evidence for two species of common dolphins (genus Delphinus)
from the eastern North Pacific. Contributions in Science 442: 1–35.
Kendall, W.L.; Peterjohn B.G.; Sauer J.R. 1996: First-time observer effects in the North American
Breeding Bird Survey. Auk 113(4): 823–829.
Link, W.A.; Sauer, J.R. 1998: Estimating population change from count data—application to the
North American Breeding Bird Survey. Ecological Applications 8(2): 258–268.
Lusseau, D.; Clement, D.M.; Hart, K.D.; Papa, R.S.; Morris, J.G. 1998: Spatial and temporal uses of the
Indian River Lagoon between Eau Gallie Causeway and Sebastian inlet, FL, by a population of
bottlenose dolphin (Tursiops truncatus). Proceedings of the 6th Atlantic Coastal Dolphin
Conference, May 1998.
McDowall, R.M. 1990: New Zealand Freshwater Fishes. A Natural History and Guide. 553 p.
Heinemann Reed, Auckland.
Miller, I.R.; Death, G.1996: Effects of training on observer’s performance in assessing benthic cover
by means of the Manta tow technique. Marine & Freshwater Research 47(1): 19–26.
Moore, N.; Whiterow, A.; Kelly, P.; Garthwaite, D.; Bishop, J.; Langton, S.; Cheeseman, C. 1999:
Survey of badger Meles meles damage to agriculture in England and Wales. Journal of
Applied Ecology 36(6): 974–988.
Norris, K.S.; Dohl, T.B. 1980: The Structure and Functions of Cetacean Schools. Pp. 211–262 in:
Herman, L.M. (ed.) Cetacean Behavior: Mechanisms and Functions. John Wiley & Sons, New
York.
Ostler, J.R.; Roper, T.J. 1998: Changes in size, status, and distribution of badger Meles meles L. setts
during a 20-year period. International Journal of Mammalian Biology 63(4): 200–209.
Paine, R. 1966: Food web complexity and species diversity. American Naturalist 100: 65–75.
Pauly, D.; Trites, A.W.; Capuli, E.; Christensen, V. 1998: Diet composition and trophic levels of
marine mammals. ICES Journal of Marine Science 55: 467–481.
Schneider, K. 1999: Behaviour and ecology of bottlenose dolphins in Doubtful Sound, Fiordland,
New Zealand. PhD Thesis, University of Otago. 211 p.
Shane, S.H. 1990: Behavior and ecology of the bottlenose dolphin at Sanibel Island, Florida. Pp. 245–
265 in: Leatherwood, S.; Reeves, R.R. (eds) The Bottlenose Dolphin. Academic Press,
Sydney.
Sokal, R.R.; Rohlf, F.S. 1981: Descriptive statistics. Pp. 38–61 in: Sokal,R.R.; Rohlf, F.S. Biometry.
Academic Press: Sydney.
Stanton, B.R.; Pickard, G.L. 1981: Physical oceanography of the New Zealand fiords. New Zealand
Oceanographic Institute Memoir 88. 37 p.
Terborgh, J.; Estes, J.A.; Paquet, P.; Ralls, K.; Boyd-Heger, D.; Miller, B.J.; Noss, R.F. 1999: The role of
top carnivores in regulating terrestrial ecosystems. Pp. 39–64 in: Soulé, M.E.; Terborgh, J.
(eds) Continental Conservation: Scientific Foundations of Regional Reserve Networks.
Island Press, Washington DC.
Webb, B.F. 1973: Cetaceans sighted off the West Coast of the South Island, New Zealand, Summer
1970. NZ Journal of Marine and Freshwater Research 7(1–2): 179–182.
Wells, R.S.; Irvine, A.B.; Scott, M.D. 1988: The social ecology of inshore odontocetes. Pp. 263–318
in: Herman, L.M. (ed.) Cetacean Behavior: Mechanisms and Functions. Krieger Publishing
Company, Malabar, Florida.

42 Lusseau & Slooten—Cetacean sightings off the Fiordland coastline
Williams, J.A.; Dawson, S.M.; Slooten, E. 1993: The abundance and distribution of bottlenosed
dolphins (Tursiops truncatus) in Doubtful Sound, New Zealand. Canadian Journal of
Zoology 71:2080–2088.
Wilson, B.; Thompson, P.M.; Hammond, P.S. 1997: Habitat use by bottlenose dolphins: seasonal
distribution and stratified movement patterns in the Moray Firth, Scotland. Journal of
Applied Ecology 34: 1365–1374.
Wilson, B.; Arnold, H.; Bearzi, G.; Fortuna, C.M.; Gaspar, R.; Ingram, S.; Liret, C.; Pribanic, S.;
Read, A.J.; Ridoux, V.; Schneider, K.; Urian., K.W.; Wells, R.S.; Wood, C.; Thompson, P.M.;
Hammond, P.S. 1999: Epidermal diseases in bottlenose dolphins: impacts of natural
and anthropogenic factors. Proceedings of the Royal Society of London Series B 266:
1077–1083.
Würsig, B.; Cipriano, F.; Slooten, E.; Constantine, R.; Barr, K.; Yin, S. 1997: Dusky dolphins
(Lagenorhynchus obscurus) off New Zealand: status of present knowledge. Report to the
International Whaling Commission 47: 715–722.


