Cesar A. Silva and Luiz A. S. Madureira* - SciELO · TRANSPETRO located at Santa Catarina State in...
11
Article J. Braz. Chem. Soc., Vol. 26, No. 4, 676-686, 2015. Printed in Brazil - ©2015 Sociedade Brasileira de Química 0103 - 5053 $6.00+0.00 A http://dx.doi.org/10.5935/0103-5053.20150026 *e-mail: [email protected]; [email protected] Application of Headspace Solid-Phase Microextraction and Gas Chromatography- Mass Spectrometry (HS-SPME-GC/MS) on the Evaluation of Degradation Efficiency of Phenolic Compounds and Identification of By-Products from Produced Water Cesar A. Silva and Luiz A. S. Madureira* Universidade Federal de Santa Catarina, Departamento de Química, Campus Universitário Trindade, 88040-900 Florianópolis-SC, Brazil Application of the headspace solid-phase microextraction and gas chromatography-mass spectrometry (HS-SPME-GC/MS) technique as an analytical tool to monitoring the degradation of phenolic compounds and the formation of by-products in produced water by UV photolysis and UV/peroxide is proposed. All of the experimental conditions for the degradation tests were carried out according to the response of the surface modeling methods developed. The direct photolysis and the UV/H 2 O 2 processes were capable to degrade more than 99% of the initial concentrations of total phenolic components of produced water. The main by-product found was 2,6-di-tert- butylbenzoquinone (DBQ). The presence of DBQ and other hydroxy compounds, constituting the major fraction of by-products identified, demonstrates that the degradations are initiated by the oxidation of the aromatic phenolic ring generating quinones, diphenols, benzoic acids and phenones. Keywords: SPME, phenols, produced water, by-products, photodegradation Introduction Produced water is co-produced during recovery of natural gas and crude oil from onshore and offshore operations. This water is considered the largest volume of waste stream in the exploration and production process of oil and gas. During oil exploration, water from the reservoir containing petroleum is pumped to the surface. It is usually reinjected into wells to enhance oil recovery. However, with continuous pumping, the ratio of produced water increases significantly, and part of the water has to be discharged into the sea, rivers, other water bodies and surrounding soils. 1 Global produced water production is estimated to be around 250 million barrels per day to around 80 million barrels per day of oil. As a result, more than 40% of it is discharged into the environment. 2 Due to the increasing volume of waste all over the world in the current decade, the outcome and effect of discharging produced water on the environment has lately become a significant issue of environmental concern. 3 Produced water is a complex mixture containing in its natural composition dispersed oil and dissolved organic compounds, including aromatic hydrocarbons, organic acids, phenols, inorganic compounds as well as traces of chemicals added in the production/separation steps. Studies on the evaluation of the acute and chronic toxicity of produced water have evidenced that the aromatic hydrocarbons and the alkylated phenols are the most important contributors to the toxicity. 4,5 In this context, the decision on selecting appropriate treatment technologies capable of achieving a desired end use quality for this effluent has become a challenge to oil refineries and petroleum industries. The growing demand for detoxification of polluted waters has led, in the last few decades, to the development of new and more effective technologies. Alternative technologies like oxidative processes can be successfully applied to a broad spectrum of organic compounds. Among these, advanced oxidation processes (AOP’s) are innovative environmental remediation technologies that are gaining importance for degradation of a great variety of organic pollutants. 6-8 Most of the studies involving degradation of organic pollutants have been discussed focusing on degradation kinetics usually employing liquid-liquid extraction (LLE) or solid-phase extraction (SPE) methods in combination with gas chromatography (GC) or high performance liquid chromatography (HPLC) to identify by-products. However, these methods involve multiple extraction steps as well as the use of large volume of solvents. The SPME method developed by Louch et al., 9 provides a solution to these
Transcript of Cesar A. Silva and Luiz A. S. Madureira* - SciELO · TRANSPETRO located at Santa Catarina State in...

Article J Braz Chem Soc Vol 26 No 4 676-686 2015Printed in Brazil - copy2015 Sociedade Brasileira de Quiacutemica0103 - 5053 $600+000Ahttpdxdoiorg1059350103-505320150026
e-mail luizmadureiraufscbr lasmadureirabolcombr
Application of Headspace Solid-Phase Microextraction and Gas Chromatography-Mass Spectrometry (HS-SPME-GCMS) on the Evaluation of Degradation Efficiency of
Phenolic Compounds and Identification of By-Products from Produced Water
Cesar A Silva and Luiz A S Madureira
Universidade Federal de Santa Catarina Departamento de Quiacutemica Campus Universitaacuterio Trindade 88040-900 Florianoacutepolis-SC Brazil
Application of the headspace solid-phase microextraction and gas chromatography-mass spectrometry (HS-SPME-GCMS) technique as an analytical tool to monitoring the degradation of phenolic compounds and the formation of by-products in produced water by UV photolysis and UVperoxide is proposed All of the experimental conditions for the degradation tests were carried out according to the response of the surface modeling methods developed The direct photolysis and the UVH2O2 processes were capable to degrade more than 99 of the initial concentrations of total phenolic components of produced water The main by-product found was 26-di-tert-butylbenzoquinone (DBQ) The presence of DBQ and other hydroxy compounds constituting the major fraction of by-products identified demonstrates that the degradations are initiated by the oxidation of the aromatic phenolic ring generating quinones diphenols benzoic acids and phenones
Keywords SPME phenols produced water by-products photodegradation
Introduction
Produced water is co-produced during recovery of natural gas and crude oil from onshore and offshore operations This water is considered the largest volume of waste stream in the exploration and production process of oil and gas During oil exploration water from the reservoir containing petroleum is pumped to the surface It is usually reinjected into wells to enhance oil recovery However with continuous pumping the ratio of produced water increases significantly and part of the water has to be discharged into the sea rivers other water bodies and surrounding soils1 Global produced water production is estimated to be around 250 million barrels per day to around 80 million barrels per day of oil As a result more than 40 of it is discharged into the environment2 Due to the increasing volume of waste all over the world in the current decade the outcome and effect of discharging produced water on the environment has lately become a significant issue of environmental concern3
Produced water is a complex mixture containing in its natural composition dispersed oil and dissolved organic compounds including aromatic hydrocarbons organic acids phenols inorganic compounds as well as traces
of chemicals added in the productionseparation steps Studies on the evaluation of the acute and chronic toxicity of produced water have evidenced that the aromatic hydrocarbons and the alkylated phenols are the most important contributors to the toxicity45 In this context the decision on selecting appropriate treatment technologies capable of achieving a desired end use quality for this effluent has become a challenge to oil refineries and petroleum industries
The growing demand for detoxification of polluted waters has led in the last few decades to the development of new and more effective technologies Alternative technologies like oxidative processes can be successfully applied to a broad spectrum of organic compounds Among these advanced oxidation processes (AOPrsquos) are innovative environmental remediation technologies that are gaining importance for degradation of a great variety of organic pollutants6-8
Most of the studies involving degradation of organic pollutants have been discussed focusing on degradation kinetics usually employing liquid-liquid extraction (LLE) or solid-phase extraction (SPE) methods in combination with gas chromatography (GC) or high performance liquid chromatography (HPLC) to identify by-products However these methods involve multiple extraction steps as well as the use of large volume of solvents The SPME method developed by Louch et al9 provides a solution to these
Silva and Madureira 677Vol 26 No 4 2015
problems minimizing time consumption and common errors associated with extraction efficiency and sample manipulation This solvent-free technique is simple rapid relatively inexpensive and compatible with analytical separation techniques such as GC and HPLC
Recently works applying the hyphenation of SPME with GCMS have been used in degradation studies of environmental organic pollutants proving to be a very suitable analytical technique1011 The present study describes the application of SPME as an analytical tool to monitoring the degradation of phenolic compounds and by-products in produced water exposed to direct UV and UVperoxide photolysis For this purpose all experimental conditions involving the degradation tests were performed according to response surface modeling methods
Experimental
Chemicals and standard solutions
Photolysis experiments were performed initially with phenol (995 pure) obtained from Sigma-Aldrich (St Louis USA) Stock solutions were prepared in deionized water and kept at 4 degC in the absence of light Hydrogen peroxide was purchased by Merck (Darmstadt Germany) The produced water samples were kindly supplied by TRANSPETRO located at Santa Catarina State in Brazil and kept stored at 4 degC (pH lt 2) until analysis
Phenol o -c reso l p -c reso l o -e thy lphenol (o-EtP) p-ethylphenol (p-EtP) 26-dimethylphenol (2 6 -DMP) 3 4 -d ime thy lpheno l (3 4 -DMP) 1-naphthol 235-trimethylphenol (235-TMP) and 2356-tetramethylphenol (2356-TeMP) were supplied by Accustandard Inc (New Haven USA) Pentachlorophenol (PeCP) and 246-trichlorophenol (246-TCP) were purchased from Sigma-Aldrich (St Louis USA) Acetic anhydride and potassium carbonate obtained from Carlo Erba (Milan Italy) were used as derivatizing reagents previous to SPME analysis
Photolysis experiments
The photodegradation studies were carried out in a thermostated reactor containing 200 mL of wastewater (25 plusmn 1 degC) The photoreactor system consists of a 500 mL cylindrical glass body with a 13 W germicidal low pressure mercury vapor lamp (UV-C at 2537 nm) surrounded with quartz jacket The mixture inside the reactor was magnetically stirred The first set of the experiments were carried out with phenol solution (50 mg L-1) to obtain optimum conditions by multivariate experimental design
A second set of experiments was performed using produced water samples Initial pH was adjusted with solution of NaOH or HCl 01 mol L-1 The progress of the phenol degradation was monitored by emission fluorescence spectra recorded using a Perkin Elmer LS-50 model spectrofluorimeter (Waltham USA) In order to obtain emission spectra of the undissociated form of phenol fluorescence was measured in buffer solution (HClKCl 02 mol L-1 pH 2) using excitation wavelength of 270 nm and the emission band recorded at λmax = 300 nm
Sample preparation and analysis by HS-SPME-GCMS
An aliquot of 10 mL of water containing phenol was placed into a 22 mL vial About 40 g of sodium chloride and the derivatizing reagents potassium carbonate (04 g) and acetic anhydride (100 microL) were successively added and the vial immediately sealed Before headspace extraction the test solution was previously heated (45 ordmC) and stirred for 5 min to achieve equilibrium The HS-SPME analysis of phenol solution was performed with a 75 microm CAR-PDMS fiber housed in a manual Supelco SPME holder (St Louis USA) during 30 min under magnetic stirring The fiber after extraction was directly inserted into the injection port of the GC for 5 min at 270 degC (splitless mode)
The procedure described above was employed to evaluate the photodegradation processes and to identify the organic intermediates The GC-MS analysis was performed with a Thermo Finnigan GC ultra gas chromatograph (San Jose USA) equipped with a splitsplitless injector and a DB-5MS column (30 m x 025 mm x 025 microm film thickness) The GC oven temperature program was 70 degC for 5 min heated to 120 degC at 8 degC min-1 then at 2 degC min-1
until 135 degC and finally at 8 degC min-1 to 280 degC Helium was used as carrier gas (constant flow of 1 mL min-1) The ion trap mass spectrometer PolarisQ Thermo Finnigan (San Jose USA) was operated in the electron ionization mode and full scan (50 to 450 mz) Ion trap and transfer line temperatures were set at 200 and 250 degC respectively
Multivariate experimental optimization
The optimization processes involving UV photolysis and UVH2O2 experiments were carried out according to the response surface modeling methods using a central composite design (CCD) To estimate the pH effect vs time in the removal efficiency of phenol and to select the best conditions for UV photolysis the CCD optimization was performed as shown in Table 1 For the UVH2O2 process only the levels of pH and H2O2 variables to the multivariate optimization design were studied as described in Table 1
Application of Headspace Solid-Phase Microextraction and Gas Chromatography-Mass Spectrometry J Braz Chem Soc678
Results and Discussion
Analytical figures of merit
Several parameters were examined in order to optimize the method for the determination of phenols in produced water proposed herein The main analytical figures of merit obtained were linearity linear correlation coefficient limits of detection and precision The results can be observed in Table 2
Phenolic composition of Produced Water
Two samples of produced water collected in different days were used to evaluate the optimum conditions established by the multivariate experiments An important remark to be made is that in both samples the presence of a thin layer of oil and dispersed oil droplets were significant These samples were taken from a settling tank kept stored for long periods to separate oilwater The longer is the period of storage in these tanks the higher is the concentration of phenolic compounds partitioned from the oil into the aqueous fraction The compounds were identified and quantified by HS-SPME-GCMS technique as described in Table 3 To minimize the matrix effect and that the concentration levels of phenolic compounds in the samples fit into the linear range an appropriate dilution (500 fold) was performed It can be noted the high levels of phenolic compounds much more than has already been reported in the literature3712-16 So there is a demand for an oxidative treatment in order to attain levels required for final disposal imposed by the Brazilian National Environmental Council - CONAMA (05 mg L-1 for total phenols of wastewaters)17 The direct UV photolysis experiments were performed using Sample 1 and H2O2UV processes were carried out with Sample 2
According to Neff4 phenols in produced water are mainly alkyl radicals containing 1-9 atoms of carbon In this study alkyl radicals with up to four atoms of carbon were identified with predominance of mono di and trialkyl phenols The presence of chlorophenols can be considered as by-products due to chlorination process applied in some oil stations This is a speculative hypothesis since we had no information about treatment processes However it is known from the literature that during the oil and gas production chemicals such as corrosion inhibitors biocides and emulsion breakers are added to prevent operational problems3
Degradation processes with synthetic aqueous solution of phenol
Preliminary degradations were performed using synthetic aqueous solution of phenol at 500 mg L-1
monitored by fluorescence emission spectra for 300 min Figure 1 shows the degradation profiles of phenol solution with UV and UVH2O2 processes For the UV photolysis the degradation rate is fast at the initial period of the reaction but it slows down later on (Figure 1a) In the initial period of reaction the rate is higher because of the formation of oxidants (HO and H2O2 possibly formed) reacting with phenol As the reaction goes on a great
Table 1 Codified levels of variables in CCD layout applied to optimize phenol degradation by UV and UVH2O2 photolysis
ExperimentLevels of variables and codes
time mina pHab [H2O2] (mg L-1)b
1 0 (ndash141) 70 (0) 500 (ndash141)
2 180 (+141) 70 (0) 10000 (+141)
3 30 (ndash1) 35 (ndash1) 1925 (ndash1)
4 150 (+1) 35 (ndash1) 8575 (+1)
5 30(ndash1) 105 (+1) 1925 (ndash1)
6 150 (+1) 105 (+1) 8575 (+1)
7 90 (0) 120 (+141) 5250 (0)
8 90 (0) 20 (ndash141) 5250 (0)
9 90 (0) 70 (0) 5250 (0)
10 90 (0) 70 (0) 5250 (0)
11 90 (0) 70 (0) 5250 (0)
avariables applied to optimize UV photolysis bvariables applied to UVH2O2 processes
Table 2 Analytical quality parameters for HS-SPMEGC-MS analysis of phenols
CompoundCorrelation
coefficient (r)LOD (microg L-1)
RSD (n = 5) (50-500 microg L-1)
Phenol 099751 00037 75-13
o-Cresol 099817 00034 64-20
p-Cresol 099805 00044 103-22
26-DMP 099614 00030 137-30
34-DMP 099717 00086 146-76
o-EtP 099871 00055 137-30
p-EtP 099756 00037 120-17
1-Naphtol 099854 00008 138-45
235-TMP 099677 00021 143-51
2356-TeMP 099875 00026 121-72
246-TCP 099891 00004 95 -75
PeCP 099981 00017 103-81
Linear range 01-1000 microg L-1 DMP dimethylphenol EtP ethylphenol TMP trimethylphenol TeMP tetramethylphenol TCP thriclorophenol PeCP pentachlorophenol
Silva and Madureira 679Vol 26 No 4 2015
number of intermediate compounds generated react with available oxidants competing with phenol It was observed that there was no significant alteration in the removal of phenol after 180 min varying from 825 to 871 at the end of the experiment (300 min) Based on these results all the experiments were restricted to 180 min To optimize UVH2O2 process all the experiments were performed up to 60 min
Multivariate experimental design to phenol removal
UV photolysisThe use of three-dimensional plots of regression models
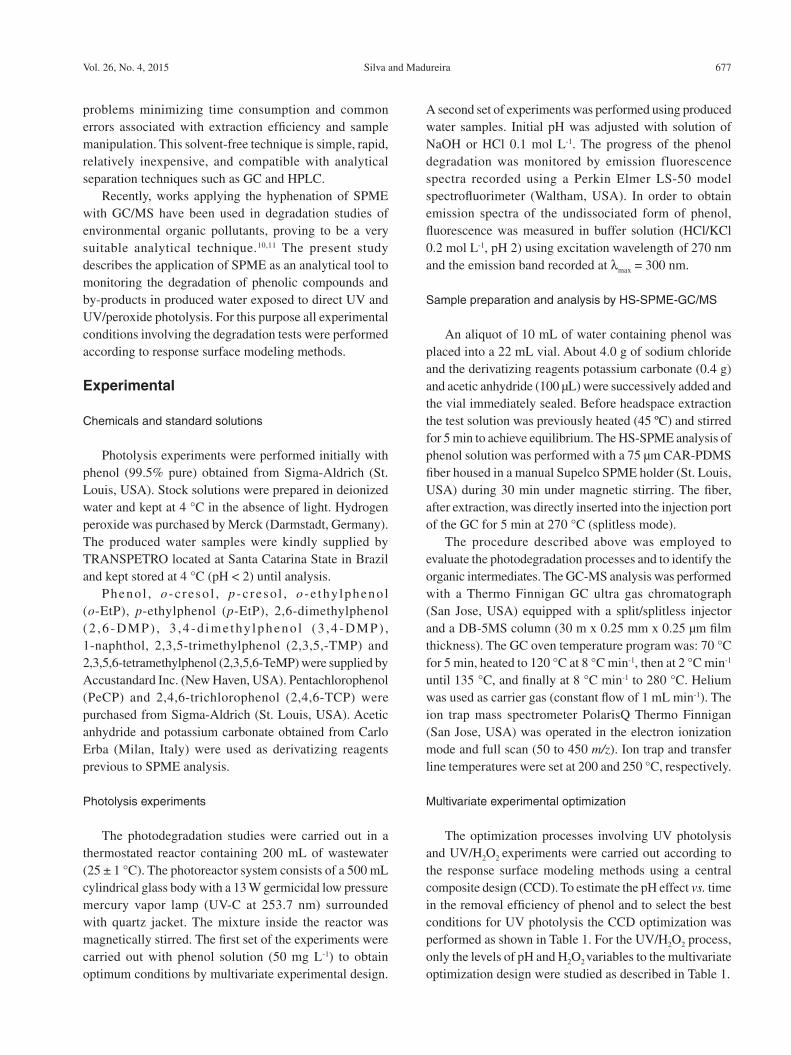
are highly recommended for the graphical interpretation of the factor interactions The response surface methodology (RSM) is a statistical modeling technique employed for multiple regression analysis The RSM uses quantitative data obtained from properly designed experiments to solve multivariable equations being simultaneously used in several studies18-23 The results depicted in Figures 2a and 2b describe the response surface plot as function of time and pH for the highest efficiency removal of phenol at 180 min as described in the first test (Figure 1a) The efficiency removal obtained was higher in a considerable range of pH from acidic to neutral pH values However the contour plot (Figure 2b) shows acidic pH reaching the highest removal in a short period of time compared to the other pH values
For direct photolysis of phenol previous studies reported that the rates of degradation under acidic
Table 3 Characteristic mass fragments and phenolic composition of produced water samples
CompoundCharacteristic mass fragment
ions (mz)a Retention time minConcentration (mg L-1)b
Sample 1 Sample 2
Phenol 94 + 136 909 38745 plusmn 1276 7130 plusmn 441
o-Cresol 108 + 150 1083 16657 plusmn 845 9289 plusmn 545
m-Cresol 108 + 150 1146 15635 plusmn 746 1414 plusmn 128
p-Cresol 108 + 150 1158 3960 plusmn 178 1693 plusmn 098
24 DMP 107 + 122 + 164 1239 181 plusmn 004 029 plusmn 003
o-EtP 107 + 122 + 164 1254 066 plusmn 002 044 plusmn 005
23 DMP 107 + 122 + 164 1316 1155 plusmn 098 099 plusmn 007
26 DMP 107 + 122 + 164 1328 1181 plusmn 048 117 plusmn 006
p-EtP 107 + 122 + 164 1359 421 plusmn 004 052 plusmn 002
34 DMP 107 + 122 + 164 1391 4749 plusmn 126 253 plusmn 018
25 DMP 107 + 122 + 164 1483 1663 plusmn 078 154 plusmn 008
TMPsc 121 + 136 + 178 1513-1695 730 plusmn 005 084 plusmn 006
246-TCP 196 + 198 + 200 1975 023 plusmn 001 005 plusmn 001
PeCP 264 + 266 + 268 2727 077 plusmn 004 017 plusmn 001
Total phenols 85245 plusmn 3148 20380 plusmn 1049aacetyl phenols b(average plusmn uncertainty with confidence limit of 95 n = 3) csum of all isomers
0 20 40 60 80 100 120 140 160 180 200
0
20
40
60
80
100
time min
(a)
0 10 20 30 40 50 60
0
20
40
60
80
100
time min
Rem
oval
Rem
oval
(b)
Figure 1 Degradation profile for phenol obtained by fluorescence spectra Initial conditions (a) UV photolysis 500 mg L-1 and pH 53 (natural pH) (b) 500 mg L-1 pH 7 and 525 mg H2O2 L
-1 (λexc= 270 nm λemis = 300 nm)
Application of Headspace Solid-Phase Microextraction and Gas Chromatography-Mass Spectrometry J Braz Chem Soc680
conditions are faster than those in alkaline conditions24 Ionic species derived from phenol are predominant when pH exceeds 100 (equal to pKa value of phenol at 25 degC) and are less susceptible to photolysis than the molecular species which predominates when pH lt pKa Also it has been found that the quantum yield of phenol photoxidation is pH dependent reaching maximum at pH values lt 2 and minimum at pH 11625 The pH effect in the removal of phenol is clearly observed in Figure 3 which shows that phenol degradation is faster at lower pH reaching 872 in pH 2 whereas in alkaline conditions the removal efficiency drops to 547 (pH 12) Esplugas et al8 studied the effect of pH on photolytic removal of phenol (100 mg L-1) at pH 4 68 and 114 obtaining 242 140 and 50 of removal respectively after 30 min of treatment
Based on the results previously described the experiments of direct photolysis to remove phenolic compounds were conducted at pH 2 The acidic condition is an important factor in the process of degradation of phenolic compounds in produced water to minimize the scavenger
effect of carbonate ion At pH lt 45 the HO scavenging becomes negligible since all carbonate species are in the form of carbonic acid which has a very low reactivity with HO26 It is also known that hydroxyl radical scavenging role of chloride ions Studies by Liao et al27 reported the scavenger effect caused by the presence of carbonate and chloride ions versus pH in H2O2UV process The authors suggested a careful pH adjustment (acidic pH) in the presence of both chloride and bicarbonate species to achieve the best response for oxidative processes
UVH2O2 processTo UVH2O2 processes a multivariate experiment of
type 22 with a central composite design was employed to establish the relationship between pH effect and H2O2
concentration (Figure 4)
Figure 2 (a) Fitted surface and (b) contour plot for removal of phenol with direct UV photolysis after 180 min of irradiation
0 20 40 60 80 100 120 140 160 180 200
00
05
10
15
20 pH 20
pH 35
pH 70
pH 105
pH 120
-ln
(CC
0)
time min
Figure 3 Plot of -ln(CC0) vs time at different pH values in the removal of phenol by UV photolysis
Figure 4 Fitted surface response for the removal of phenol after 60 min by UVH2O2 process
0 20 40 60 80 100 120 140 160 180 200
00
05
10
15
20 pH 20
pH 35
pH 70
pH 105
pH 120
-ln
(CC
0)
time min
Silva and Madureira 681Vol 26 No 4 2015
The surface response fitted showed a regression coefficient R2 (08642) ensures a satisfactory adjustment of the quadratic model to the experimental data Analysis of variance indicated significance only to pH linear effect (p-value ltlt005) According to the Pareto chart (Figure 5) the removal increases as pH linear effect decreases Nevertheless as can be seen through the 3D plot the oxidation rate was independent of pH and peroxide interaction Within the peroxide concentration range studied there are no significant variations in response over a wide pH range (2-10) after 60 min of treatment The optimal observed concentration of H2O2 required to obtain maximum removal was around 600 mg L-1 at neutral pH This visual interpretation agrees with the values calculated by the model as critical values which are observed from the best response for the model The critical values calculated were 5865 mg H2O2 L
-1 of and pH 62 obtaining 999 of removal efficiency (experimental data 992) The H2O2
concentrations studied varied from 50 to 1000 mg L-1 resulting in a range of H2O2phenol concentration ratios of 1 to 20 In most degradation experiments performed using UVH2O2 it has been found that the rate is H2O2
concentration dependent increasing to an optimum value beyond which an inhibitory effect takes place At higher H2O2 concentrations the H2O2 photolysis exercises a competitive mechanism acting as a free-radical scavenger itself consuming hydroxyl radicals to be recombined and regenerate H2O2 So to avoid an excess of H2O2 that could retard the degradation and taking into account the interaction effect of pH we performed all the effluent oxidation process with 600 mg H2O2 L
-1 at pH 7 According to the studies reported by De Laat et al28 efficiencies of UVH2O2 processes were not affected by pH below 8 although a decrease was observed for higher pH The photochemical process is more efficient in alkaline media
because the concentration of the conjugate anion of hydrogen peroxide increases with pH and this species has a higher absorption coefficient (ε254 = 240 mol Lndash1 cmndash1) than H2O2 favoring light absorption and increasing HObull production29 However as shown in Figure 4 at pH gt 10 there is a decrease in the removal of phenol probably due to the fast decomposition of peroxide and hydroxyl radicals at higher pH as observed by Christensen et al30 In this work the direct photolysis of phenol was accelerated in acidic pH In contrast the synergistic effect between UV radiation and the use of the oxidant H2O2 was more effective in neutral pH as described by Alnaizy and Akgerman31 Therefore for the removal of the phenolic compounds from produced water the degradation process with UVH2O2 was performed at pH 7
Produced water phenolic compounds removal
Once established the optimum conditions for phenol removal experiments were conducted using produced water samples The removal profile of phenolic compounds during irradiation with UV (180 min) can be observed through the analysis of the chromatograms obtained by HS-SPME-GCMS (Figure 6)
Analysis of HS-SPME-GCMS allowed us to assess efficiently the removal of phenolic compounds proving to be a promising analytical tool in studies to monitor photodegradation of organic pollutants Based on these results we observed that the UV photolysis was able to quantitatively remove the majority of the phenolic compounds reducing 803 up to 999 of their initial concentrations after 180 min of treatment (Figure 7)
Despite lower concentrations of chlorophenols detected in the sample (Table 4) compared to the concentrations of other phenolic compounds the degradation rate of chlorophenols are among the lowest values (803 for 246-TCP and 889 for PeCP) These results are consistent with earlier studies which found the lower susceptibility to degradation of chlorophenols by direct UV irradiation3233 The lower removal is due to the fact that the dissociated forms of chlorophenols absorb UV radiation more strongly so for a faster and efficient removal of these compounds direct photolysis should be conducted in alkaline conditions32 Despite the lower removal of CPs an increase in their degradation rate can be proposed with an increase in radiation time Titus et al33 reported several studies showing that the degradation of different CPs are faster when decreasing the number of chlorine atoms in alkali medium at constant values of initial CP concentration radiation intensity and temperature In contrast in their work they found this trend seems not to be applied in
Figure 5 Pareto chart obtained from central composite design for UVH2O2 optimization
Application of Headspace Solid-Phase Microextraction and Gas Chromatography-Mass Spectrometry J Braz Chem Soc682
acidic conditions where the kinetic constant for 246-TCP degradation was higher than the one for 24-DCP In our work we can observe the same trend to the acidic condition Even with concentration three times lower than PeCP the 246-TCP compound had a slower rate of removal
With respect to monoalkyl and dialkylphenols similar degradation profiles reaching almost their complete mineralization in solely 45 min (938-999) were estimated as shown in Figure 7 The exception occurred to m-cresol and p-ethylphenol reaching 866 and 802 of removal respectively during the same period of treatment The rate of phenol removal was also slow yielding only 751 Some factors may be accounted to the slower removal of these compounds Firstly we must consider
the large concentration of aromatic compounds such as benzene toluene and other alkyl substituted benzenes present in produced water which through oxidative processes involving hydroxyl radical can be oxidized generating phenols and other substituted phenolic isomers A second consideration should be made regarding the decomposition process of phenol by direct photolysis The absorption of UV light at 254 nm leads to the generation of phenoxyl radical caused by the formation of an excited state of phenol with subsequent deprotonation The phenoxyl radical can exist as ortho-carbon para-carbon or resonant structures with oxygen-centered as described by Alapi and Dombi34 and depicted in Scheme 1 Although the formation of ortho meta and para-cresols as intermediate products from UV photolysis of phenol in produced water has not been widely discussed in the literature the kinetic profile of degradation described in Figure 7 suggests that can also happen concomitantly a pathway production of substituted phenols by methyl or other alkyl radicals from aromatic and aliphatic hydrocarbons found in large amounts in these samples As observed through removal profile obtained to m-cresol and p-ethylphenol the degradation rate was similar to phenol degradation during the initial 30 min even with concentrations of about 2 up to 100 times smaller than initial concentration of phenol This fact supports our hypothesis that simultaneous to the phenol degradation an increase in the concentration of some alkyl phenols occur coming from the attack by methylalkyl radicals making the degradation of these compounds more slowly This apparent slow degradation rate could then be attributed to a possible formation of alkyl phenols from the resonance structure as depicted in Scheme 1
Figure 6 Chromatograms of phenolic compounds in produced water exposed to UV photolysis DMP dimethylphenol EtP ethyl phenol TMP trimethylphenol TCP triclorophenol PeCP pentachlorophenol
0 20 40 60 80 100 120 140 160 180 200
0
20
40
60
80
100
time min
Eff
icie
ncy
rem
oval
phenol
o-cresol
m-cresol
p-cresol
(24 DMP)
o-ethylphenol
(23 DMP)
(26 DMP)
p-ethylphenol
(34 DMP)
(25 DMP)
TMPs
246-TCP
PeCP
Figure 7 Profile showing removal of phenolic compounds during the treatment of produced water by UV photolysis DMP Dimethylphenol EtP ethyl phenol TMP trimethylphenol TCP thriclorophenol PeCP pentachlorophenol
0 20 40 60 80 100 120 140 160 180 200
0
20
40
60
80
100
time min
Eff
icie
ncy
rem
oval
phenol
o-cresol
m-cresol
p-cresol
(24 DMP)
o-ethylphenol
(23 DMP)
(26 DMP)
p-ethylphenol
(34 DMP)
(25 DMP)
TMPs
246-TCP
PeCP
Silva and Madureira 683Vol 26 No 4 2015
Based on the results described in Table 4 we can affirm that the oxidative process via direct photolysis is an efficient process for the removal of phenolic compounds in produced water Despite the high concentrations determined the process was efficient in removing 997 of the phenolic compounds studied The total concentration of residual phenolic compounds (22 mg L-1) reached
values close to those permitted by CONAMA 430 for total phenols (05 mg L-1)17 These are outstanding results when compared to those obtained by testing a synthetic solution using phenol as model compound Although the samples had concentrations much higher than the test solution (50 mg L-1) this process showed very satisfactory results A plausible explanation for this efficiency can be attributed to the presence of salts and metal hydroxides that could act synergistically as catalysts increasing the rate of degradation of phenolic compounds in produced water Another important aspect to be considered is the high content of dissolved organic matter (DOM) present in produced water It is well known that DOM acts as an important agent photosensitizer increasing photoreactivity of many organic compounds by the indirect formation of highly reactive species like radicals35 Future studies will be conducted to understand the effects of these constituents in the process of photolysis
UVperoxide degradation process of phenolic compounds found in the produced water monitored by HS-SPME-GCMS showed removal efficiency gt 90 for most studied compounds already within the first 15 min of degradation (Figure 8) Similarly in the UV photolysis the 246-TCP also showed lower degradation rate by UVperoxide (806) Although the sample subjected to degradation by UVperoxide contains a much lower concentration of phenols the results obtained by the two methods were very similar differing only in the kinetics of the reaction for the process of UVH2O2 proved to be
Table 4 Residual concentration and removal efficiency of phenolic compounds obtained by the degradation processes
CompoundResidual concentration (mg L-1)a Removal efficiency
UV photolysis (180 min) UVH2O2 (60 min) UV photolysis (180 min) UVH2O2 (60 min)
Phenol 183 125 995 983
o-Cresol 002 006 999 999
m-Cresol 019 003 999 998
p-Cresol 003 006 999 996
24 DMP lt 001 lt 001 999 995
o-Ethylphenol nd lt 001 1000 991
23 DMP lt 001 lt 001 999 998
26 DMP lt 001 lt 001 999 997
p-Ethylphenol 001 lt 001 997 996
34 DMP 003 001 999 994
25 DMP 002 001 999 994
TMPs 001 003 998 963
246-TCP 005 001 803 806
PeCP 001 001 825 926
Total phenols (mg L-1) 221 149amean concentration (n=3) nd not detected
Scheme 1 Proposed tentative formation of alkyl phenols
Application of Headspace Solid-Phase Microextraction and Gas Chromatography-Mass Spectrometry J Braz Chem Soc684
faster This improvement in removal (shorter treatment time) obtained by the UVH2O2 process is due to different mechanisms of formation resulting in a more efficient generation of hydroxyl radicals
By-products identification by GC-MS
Table 5 describes the main by-products formed during the UV and UVH2O2 processes These compounds were identified by HS-SPME-GCMS and comparison with NIST library data authentic standards and based on literature The results revealed the formation of several hydroxylated compounds aromatic esters chlorophenols
some organic acids and alkyl benzenes Although reported in the literature hydroquinones and benzoquinones were not identified in the final treated residue3637 However the formation of these by-products was noted during the degradation processes due the appearance and rapid disappearance of a yellowish-brown color in solution within the first minutes of treatment indicating the formation of these by-products as transient intermediates The main by-product detected was 26-di-tert-butylbenzoquinone (DBQ) in samples subjected to both UV and UVH2O2 treatment The presence of this compound as well as hydroxy compounds constituting the major fraction of by-products identified demonstrates that the main pathway
Figure 8 Total ion chromatograms (TIC) showing the distribution of phenolic compounds in produced water after applying UVH2O2 treatment for 60 min DMP dimethylphenol EtPethylphenol TMP trimethylphenol (see other codes at the foot note of Table 2)
Table 5 Main by-products formed during the UV and UVH2O2 processes tentatively identified by GC-MS
Compound Structural formula
26-Di-tert-butylbenzoquinone (DBQ)
O
O
2-Hydroxybenzoic acid OH
O
OH
35-Di-tert-butylpyrocatechol
HO
HO
Compound Structural formula
35-Di-tert-butyl-4-hydroxyacetophenone
OH
O
25-Di-tert-butylhydroquinone (DTBHQ)
HO
OH
35-Di-tert-butyl-4-hydroxybenzaldehyde
O
OH
Silva and Madureira 685Vol 26 No 4 2015
Table 5 Main by-products formed during the UV and UVH2O2 processes tentatively identified by GC-MS (cont)
Compound Structural formula
14-Naphthoquinone 6-acetyl-25-dihydroxy
OH
OH
O
O
O
Benzaldehyde 2-hydroxy-4-methoxy-36-dimeyhyl
OH
O
O
25-Di-t-amyl-p-benzoquinone (DAQ)
O
O
1-(2-Methylphenyl) ethanone
O
3-Acetyl-244-trimethylcyclohex-2-en-1-one
O
O
Pentanoic acid 5-hydroxy-24-di-t-butylphenyl esters OHO
O
4rsquo-Butoxy-2rsquo-methylacetophenone
O
O
2rsquo-Methyl-4rsquo-propoxypropiophenone
O
O
2-Methyl-1-(2-methyl-4-propoxyphenyl)propan-1-one
O
O
Compound Structural formula
1-(26-dimethyl-4-propoxyphenyl)-2-methyl-propan1-one
O
O
pentanedioc acid (24-di-t-buthylphenyl) mono-ester O OH
O O
246-Tris(11-dimethyl)-4-methylcyclohexa-25-dien-1-one O
Propanoic acid 2-methyl-1-(11dimethyl)-2-methyl-13-propanediyl ester
O
O OO
Ethanone 11rsquo-(6-methoxy-25-benzofurandiyl)bis O O
O
O
79-Di-tert-butyl-1-oxaspiro(45)deca-69-diene-28-dione
O
O
O
12-Benzenedicarboxylic acid butyl cyclohexyl ester O
O
OO
of degradation is initiated by the oxidation of the aromatic phenolic ring generating quinones diphenols benzoic acids and phenones The cleavage of the aromatic ring results in the production of organic acids and aliphatic hydrocarbons shown in this study but at low concentrations The non-identification of these compounds in high concentrations indicates that despite the high efficiency of the treatment process the complete mineralization of the sample was not achieved possibly due to the high organic content A large number of compounds identified denote the
countless possibilities of by-products that may be formed when complex samples such as produced water are subjected to chemical processes of oxidation indicating the importance of further studies focusing on the toxicity of such compounds
Conclusions
In conclusion we showed in this work that the multivariate experiment optimization is an important
Application of Headspace Solid-Phase Microextraction and Gas Chromatography-Mass Spectrometry J Braz Chem Soc686
statistical tool to monitoring and evaluate the removal processes of phenolic compounds in complex samples like produced water The direct photolysis and UVH2O2
processes were capable to degrade more than 99 of the initial total concentration of phenolic compounds present in the produced water The HS-SPME-GCMS was successfully used for the determination of the residual concentration of phenolic compounds as well as the formation of by-products proving to be an important analytical tool in wastewater treatment studies
Supplementary Information
Supplementary data (fluorescence spectra ANOVA tables and spectra of by-products) are available free of charge at httpjbcssbqorgbr as PDF file
Acknowledgments
The authors are thankful to TRANSPETRO for the samples provided to the Brazilian Federal Agency for Support and Evaluation of Graduate Education (CAPES) and PETROBRAS for the financial support
References
1 Lu J R Wang X L Shan B T Li X M Wang W D
Chemosphere 2006 62 322
2 Ahmadum F R Pendashteh A Abdullah L C Biak DRA
Madaeni S S Abidin Z Z J Hazard Mater 2009 170 530
3 Farag A M Harper D D Int J Coal Geol 2014 126 157
4 Neff J M Bioaccumulation in Marine Organisms Elsevier
Oxford 2002
5 The International Association of Oil amp Gas Producers (OGP)
Report 364 London 2005
6 Stepnowski P Siedlecka E M Behrend P Jastorff B Water
Res 2002 36 2167
7 Coelho A Castro AV Dezotti M SantrsquoAnna G L
J Hazard Mater 2006 137 178
8 Esplugas S Gimenez J Contreras S Pascual E
Rodriguez M Water Res 2002 36 1034
9 Louch D Motlagh S Pawliszyn J Anal Chem 1992 64
1187
10 Sanchez-Prado L Llompart M Lores M Garcia-Jares C
Bayona J M Cela R Chemosphere 2006 65 1338
Alvarez-Rivera G Llompart M Garcia-Jares C Lores M
J Chromatogr A 2014 1349 105
11 Mascolo G Ciannarella R Balest L Lopez A J Hazard
Mater 2008 152 1138
12 Boitsov S Meier S Klungsoyr J Svardal A J Chromatogr A
2004 1059 131
13 Lee K Neff J M Produced Water Environmental Risks and
Advances in Mitigation Technologies Springer New York
2011
14 Faksness L G Grini P G Daling P S Mar Pollut Bull
2004 48 731
15 Boitsov S Mjos S A Meier S Mar Environ Res 2007
64 651
16 Igunnu E T Chen G Z J Low-Carbon Technol 2014 9
157
17 Conselho Nacional do Meio Ambiente (CONAMA) Resoluccedilatildeo
430 Available in httpwwwmmagovbrportconamalegiabre
cfmcodlegi=646 acessed in January 2015
18 Gaya U I Abdullah A H Zainal Z Hussein M Z
J Hazard Mater 2009 168 57
19 Naidu G S N Panda T Biochem Eng J 1998 2 71
20 Montgomery D C Runger G C Hubele N F Engineering
Statistics John Wiley and Sons Inc Hoboken 2001
21 Vining G G Statistical Methods for Engineers Duxburg Press
London 2003
22 Mason R L Gunst R F Hess J J Statistical Design and
Analysis of Experiments with Applications to Engineering and
Science John Wiley and Sons Inc Hoboken 2003
23 Guaracho V V Kaminari N M S Ponte M J J S Ponte
H A J Hazard Mater 2009 172 1087
24 Castrantas H M Gibilisco R D ACS Symp Ser 1990 422
77
25 Audureau J Filiol C Boule P Lemaire J J Chim Phys
PCB 1976 73 613
26 Liao C H Kang S F Wu F A Chemosphere 2001 44
1193
27 Liao C H Gurol M D Environ Sci Technol 1995 29 3007
28 Delaat J Tace E Dore M Water Res 1994 28 2507
29 Andreozzi R Caprio V Insola A Marotta R Catal Today
1999 53 51
30 Christensen H Sehested K Corfitzen H J Phys Chem
1982 86 1588
31 Alnaizy R Akgerman A Adv Environ Res 2000 4 233
23 Trapido M Hirvonen A Veressinina Y Hentunen J
Munter R OzoneSci Eng 1997 19 75
33 Pera-Titus M Garcia-Molina V Banos M A Gimenez J
Esplugas S Appl Catal B 2004 47 219
34 Alapi T Dombi A J Photoch Photobio A 2007 188 409
35 Miller P L Chin Y P Environ Sci Technol 2005 39 4454
36 Kusic H Koprivanac N Bozic A L Chem Eng J 2006
123 127
37 Busca G Berardinelli S Resini C Arrighi L J Hazard
Mater 2008 160 265
Submitted August 17 2014
Published online February 6 2015
Silva and Madureira 677Vol 26 No 4 2015
problems minimizing time consumption and common errors associated with extraction efficiency and sample manipulation This solvent-free technique is simple rapid relatively inexpensive and compatible with analytical separation techniques such as GC and HPLC
Recently works applying the hyphenation of SPME with GCMS have been used in degradation studies of environmental organic pollutants proving to be a very suitable analytical technique1011 The present study describes the application of SPME as an analytical tool to monitoring the degradation of phenolic compounds and by-products in produced water exposed to direct UV and UVperoxide photolysis For this purpose all experimental conditions involving the degradation tests were performed according to response surface modeling methods
Experimental
Chemicals and standard solutions
Photolysis experiments were performed initially with phenol (995 pure) obtained from Sigma-Aldrich (St Louis USA) Stock solutions were prepared in deionized water and kept at 4 degC in the absence of light Hydrogen peroxide was purchased by Merck (Darmstadt Germany) The produced water samples were kindly supplied by TRANSPETRO located at Santa Catarina State in Brazil and kept stored at 4 degC (pH lt 2) until analysis
Phenol o -c reso l p -c reso l o -e thy lphenol (o-EtP) p-ethylphenol (p-EtP) 26-dimethylphenol (2 6 -DMP) 3 4 -d ime thy lpheno l (3 4 -DMP) 1-naphthol 235-trimethylphenol (235-TMP) and 2356-tetramethylphenol (2356-TeMP) were supplied by Accustandard Inc (New Haven USA) Pentachlorophenol (PeCP) and 246-trichlorophenol (246-TCP) were purchased from Sigma-Aldrich (St Louis USA) Acetic anhydride and potassium carbonate obtained from Carlo Erba (Milan Italy) were used as derivatizing reagents previous to SPME analysis
Photolysis experiments
The photodegradation studies were carried out in a thermostated reactor containing 200 mL of wastewater (25 plusmn 1 degC) The photoreactor system consists of a 500 mL cylindrical glass body with a 13 W germicidal low pressure mercury vapor lamp (UV-C at 2537 nm) surrounded with quartz jacket The mixture inside the reactor was magnetically stirred The first set of the experiments were carried out with phenol solution (50 mg L-1) to obtain optimum conditions by multivariate experimental design
A second set of experiments was performed using produced water samples Initial pH was adjusted with solution of NaOH or HCl 01 mol L-1 The progress of the phenol degradation was monitored by emission fluorescence spectra recorded using a Perkin Elmer LS-50 model spectrofluorimeter (Waltham USA) In order to obtain emission spectra of the undissociated form of phenol fluorescence was measured in buffer solution (HClKCl 02 mol L-1 pH 2) using excitation wavelength of 270 nm and the emission band recorded at λmax = 300 nm
Sample preparation and analysis by HS-SPME-GCMS
An aliquot of 10 mL of water containing phenol was placed into a 22 mL vial About 40 g of sodium chloride and the derivatizing reagents potassium carbonate (04 g) and acetic anhydride (100 microL) were successively added and the vial immediately sealed Before headspace extraction the test solution was previously heated (45 ordmC) and stirred for 5 min to achieve equilibrium The HS-SPME analysis of phenol solution was performed with a 75 microm CAR-PDMS fiber housed in a manual Supelco SPME holder (St Louis USA) during 30 min under magnetic stirring The fiber after extraction was directly inserted into the injection port of the GC for 5 min at 270 degC (splitless mode)
The procedure described above was employed to evaluate the photodegradation processes and to identify the organic intermediates The GC-MS analysis was performed with a Thermo Finnigan GC ultra gas chromatograph (San Jose USA) equipped with a splitsplitless injector and a DB-5MS column (30 m x 025 mm x 025 microm film thickness) The GC oven temperature program was 70 degC for 5 min heated to 120 degC at 8 degC min-1 then at 2 degC min-1
until 135 degC and finally at 8 degC min-1 to 280 degC Helium was used as carrier gas (constant flow of 1 mL min-1) The ion trap mass spectrometer PolarisQ Thermo Finnigan (San Jose USA) was operated in the electron ionization mode and full scan (50 to 450 mz) Ion trap and transfer line temperatures were set at 200 and 250 degC respectively
Multivariate experimental optimization
The optimization processes involving UV photolysis and UVH2O2 experiments were carried out according to the response surface modeling methods using a central composite design (CCD) To estimate the pH effect vs time in the removal efficiency of phenol and to select the best conditions for UV photolysis the CCD optimization was performed as shown in Table 1 For the UVH2O2 process only the levels of pH and H2O2 variables to the multivariate optimization design were studied as described in Table 1
Application of Headspace Solid-Phase Microextraction and Gas Chromatography-Mass Spectrometry J Braz Chem Soc678
Results and Discussion
Analytical figures of merit
Several parameters were examined in order to optimize the method for the determination of phenols in produced water proposed herein The main analytical figures of merit obtained were linearity linear correlation coefficient limits of detection and precision The results can be observed in Table 2
Phenolic composition of Produced Water
Two samples of produced water collected in different days were used to evaluate the optimum conditions established by the multivariate experiments An important remark to be made is that in both samples the presence of a thin layer of oil and dispersed oil droplets were significant These samples were taken from a settling tank kept stored for long periods to separate oilwater The longer is the period of storage in these tanks the higher is the concentration of phenolic compounds partitioned from the oil into the aqueous fraction The compounds were identified and quantified by HS-SPME-GCMS technique as described in Table 3 To minimize the matrix effect and that the concentration levels of phenolic compounds in the samples fit into the linear range an appropriate dilution (500 fold) was performed It can be noted the high levels of phenolic compounds much more than has already been reported in the literature3712-16 So there is a demand for an oxidative treatment in order to attain levels required for final disposal imposed by the Brazilian National Environmental Council - CONAMA (05 mg L-1 for total phenols of wastewaters)17 The direct UV photolysis experiments were performed using Sample 1 and H2O2UV processes were carried out with Sample 2
According to Neff4 phenols in produced water are mainly alkyl radicals containing 1-9 atoms of carbon In this study alkyl radicals with up to four atoms of carbon were identified with predominance of mono di and trialkyl phenols The presence of chlorophenols can be considered as by-products due to chlorination process applied in some oil stations This is a speculative hypothesis since we had no information about treatment processes However it is known from the literature that during the oil and gas production chemicals such as corrosion inhibitors biocides and emulsion breakers are added to prevent operational problems3
Degradation processes with synthetic aqueous solution of phenol
Preliminary degradations were performed using synthetic aqueous solution of phenol at 500 mg L-1
monitored by fluorescence emission spectra for 300 min Figure 1 shows the degradation profiles of phenol solution with UV and UVH2O2 processes For the UV photolysis the degradation rate is fast at the initial period of the reaction but it slows down later on (Figure 1a) In the initial period of reaction the rate is higher because of the formation of oxidants (HO and H2O2 possibly formed) reacting with phenol As the reaction goes on a great
Table 1 Codified levels of variables in CCD layout applied to optimize phenol degradation by UV and UVH2O2 photolysis
ExperimentLevels of variables and codes
time mina pHab [H2O2] (mg L-1)b
1 0 (ndash141) 70 (0) 500 (ndash141)
2 180 (+141) 70 (0) 10000 (+141)
3 30 (ndash1) 35 (ndash1) 1925 (ndash1)
4 150 (+1) 35 (ndash1) 8575 (+1)
5 30(ndash1) 105 (+1) 1925 (ndash1)
6 150 (+1) 105 (+1) 8575 (+1)
7 90 (0) 120 (+141) 5250 (0)
8 90 (0) 20 (ndash141) 5250 (0)
9 90 (0) 70 (0) 5250 (0)
10 90 (0) 70 (0) 5250 (0)
11 90 (0) 70 (0) 5250 (0)
avariables applied to optimize UV photolysis bvariables applied to UVH2O2 processes
Table 2 Analytical quality parameters for HS-SPMEGC-MS analysis of phenols
CompoundCorrelation
coefficient (r)LOD (microg L-1)
RSD (n = 5) (50-500 microg L-1)
Phenol 099751 00037 75-13
o-Cresol 099817 00034 64-20
p-Cresol 099805 00044 103-22
26-DMP 099614 00030 137-30
34-DMP 099717 00086 146-76
o-EtP 099871 00055 137-30
p-EtP 099756 00037 120-17
1-Naphtol 099854 00008 138-45
235-TMP 099677 00021 143-51
2356-TeMP 099875 00026 121-72
246-TCP 099891 00004 95 -75
PeCP 099981 00017 103-81
Linear range 01-1000 microg L-1 DMP dimethylphenol EtP ethylphenol TMP trimethylphenol TeMP tetramethylphenol TCP thriclorophenol PeCP pentachlorophenol
Silva and Madureira 679Vol 26 No 4 2015
number of intermediate compounds generated react with available oxidants competing with phenol It was observed that there was no significant alteration in the removal of phenol after 180 min varying from 825 to 871 at the end of the experiment (300 min) Based on these results all the experiments were restricted to 180 min To optimize UVH2O2 process all the experiments were performed up to 60 min
Multivariate experimental design to phenol removal
UV photolysisThe use of three-dimensional plots of regression models
are highly recommended for the graphical interpretation of the factor interactions The response surface methodology (RSM) is a statistical modeling technique employed for multiple regression analysis The RSM uses quantitative data obtained from properly designed experiments to solve multivariable equations being simultaneously used in several studies18-23 The results depicted in Figures 2a and 2b describe the response surface plot as function of time and pH for the highest efficiency removal of phenol at 180 min as described in the first test (Figure 1a) The efficiency removal obtained was higher in a considerable range of pH from acidic to neutral pH values However the contour plot (Figure 2b) shows acidic pH reaching the highest removal in a short period of time compared to the other pH values
For direct photolysis of phenol previous studies reported that the rates of degradation under acidic
Table 3 Characteristic mass fragments and phenolic composition of produced water samples
CompoundCharacteristic mass fragment
ions (mz)a Retention time minConcentration (mg L-1)b
Sample 1 Sample 2
Phenol 94 + 136 909 38745 plusmn 1276 7130 plusmn 441
o-Cresol 108 + 150 1083 16657 plusmn 845 9289 plusmn 545
m-Cresol 108 + 150 1146 15635 plusmn 746 1414 plusmn 128
p-Cresol 108 + 150 1158 3960 plusmn 178 1693 plusmn 098
24 DMP 107 + 122 + 164 1239 181 plusmn 004 029 plusmn 003
o-EtP 107 + 122 + 164 1254 066 plusmn 002 044 plusmn 005
23 DMP 107 + 122 + 164 1316 1155 plusmn 098 099 plusmn 007
26 DMP 107 + 122 + 164 1328 1181 plusmn 048 117 plusmn 006
p-EtP 107 + 122 + 164 1359 421 plusmn 004 052 plusmn 002
34 DMP 107 + 122 + 164 1391 4749 plusmn 126 253 plusmn 018
25 DMP 107 + 122 + 164 1483 1663 plusmn 078 154 plusmn 008
TMPsc 121 + 136 + 178 1513-1695 730 plusmn 005 084 plusmn 006
246-TCP 196 + 198 + 200 1975 023 plusmn 001 005 plusmn 001
PeCP 264 + 266 + 268 2727 077 plusmn 004 017 plusmn 001
Total phenols 85245 plusmn 3148 20380 plusmn 1049aacetyl phenols b(average plusmn uncertainty with confidence limit of 95 n = 3) csum of all isomers
0 20 40 60 80 100 120 140 160 180 200
0
20
40
60
80
100
time min
(a)
0 10 20 30 40 50 60
0
20
40
60
80
100
time min
Rem
oval
Rem
oval
(b)
Figure 1 Degradation profile for phenol obtained by fluorescence spectra Initial conditions (a) UV photolysis 500 mg L-1 and pH 53 (natural pH) (b) 500 mg L-1 pH 7 and 525 mg H2O2 L
-1 (λexc= 270 nm λemis = 300 nm)
Application of Headspace Solid-Phase Microextraction and Gas Chromatography-Mass Spectrometry J Braz Chem Soc680
conditions are faster than those in alkaline conditions24 Ionic species derived from phenol are predominant when pH exceeds 100 (equal to pKa value of phenol at 25 degC) and are less susceptible to photolysis than the molecular species which predominates when pH lt pKa Also it has been found that the quantum yield of phenol photoxidation is pH dependent reaching maximum at pH values lt 2 and minimum at pH 11625 The pH effect in the removal of phenol is clearly observed in Figure 3 which shows that phenol degradation is faster at lower pH reaching 872 in pH 2 whereas in alkaline conditions the removal efficiency drops to 547 (pH 12) Esplugas et al8 studied the effect of pH on photolytic removal of phenol (100 mg L-1) at pH 4 68 and 114 obtaining 242 140 and 50 of removal respectively after 30 min of treatment
Based on the results previously described the experiments of direct photolysis to remove phenolic compounds were conducted at pH 2 The acidic condition is an important factor in the process of degradation of phenolic compounds in produced water to minimize the scavenger
effect of carbonate ion At pH lt 45 the HO scavenging becomes negligible since all carbonate species are in the form of carbonic acid which has a very low reactivity with HO26 It is also known that hydroxyl radical scavenging role of chloride ions Studies by Liao et al27 reported the scavenger effect caused by the presence of carbonate and chloride ions versus pH in H2O2UV process The authors suggested a careful pH adjustment (acidic pH) in the presence of both chloride and bicarbonate species to achieve the best response for oxidative processes
UVH2O2 processTo UVH2O2 processes a multivariate experiment of
type 22 with a central composite design was employed to establish the relationship between pH effect and H2O2
concentration (Figure 4)
Figure 2 (a) Fitted surface and (b) contour plot for removal of phenol with direct UV photolysis after 180 min of irradiation
0 20 40 60 80 100 120 140 160 180 200
00
05
10
15
20 pH 20
pH 35
pH 70
pH 105
pH 120
-ln
(CC
0)
time min
Figure 3 Plot of -ln(CC0) vs time at different pH values in the removal of phenol by UV photolysis
Figure 4 Fitted surface response for the removal of phenol after 60 min by UVH2O2 process
0 20 40 60 80 100 120 140 160 180 200
00
05
10
15
20 pH 20
pH 35
pH 70
pH 105
pH 120
-ln
(CC
0)
time min
Silva and Madureira 681Vol 26 No 4 2015
The surface response fitted showed a regression coefficient R2 (08642) ensures a satisfactory adjustment of the quadratic model to the experimental data Analysis of variance indicated significance only to pH linear effect (p-value ltlt005) According to the Pareto chart (Figure 5) the removal increases as pH linear effect decreases Nevertheless as can be seen through the 3D plot the oxidation rate was independent of pH and peroxide interaction Within the peroxide concentration range studied there are no significant variations in response over a wide pH range (2-10) after 60 min of treatment The optimal observed concentration of H2O2 required to obtain maximum removal was around 600 mg L-1 at neutral pH This visual interpretation agrees with the values calculated by the model as critical values which are observed from the best response for the model The critical values calculated were 5865 mg H2O2 L
-1 of and pH 62 obtaining 999 of removal efficiency (experimental data 992) The H2O2
concentrations studied varied from 50 to 1000 mg L-1 resulting in a range of H2O2phenol concentration ratios of 1 to 20 In most degradation experiments performed using UVH2O2 it has been found that the rate is H2O2
concentration dependent increasing to an optimum value beyond which an inhibitory effect takes place At higher H2O2 concentrations the H2O2 photolysis exercises a competitive mechanism acting as a free-radical scavenger itself consuming hydroxyl radicals to be recombined and regenerate H2O2 So to avoid an excess of H2O2 that could retard the degradation and taking into account the interaction effect of pH we performed all the effluent oxidation process with 600 mg H2O2 L
-1 at pH 7 According to the studies reported by De Laat et al28 efficiencies of UVH2O2 processes were not affected by pH below 8 although a decrease was observed for higher pH The photochemical process is more efficient in alkaline media
because the concentration of the conjugate anion of hydrogen peroxide increases with pH and this species has a higher absorption coefficient (ε254 = 240 mol Lndash1 cmndash1) than H2O2 favoring light absorption and increasing HObull production29 However as shown in Figure 4 at pH gt 10 there is a decrease in the removal of phenol probably due to the fast decomposition of peroxide and hydroxyl radicals at higher pH as observed by Christensen et al30 In this work the direct photolysis of phenol was accelerated in acidic pH In contrast the synergistic effect between UV radiation and the use of the oxidant H2O2 was more effective in neutral pH as described by Alnaizy and Akgerman31 Therefore for the removal of the phenolic compounds from produced water the degradation process with UVH2O2 was performed at pH 7
Produced water phenolic compounds removal
Once established the optimum conditions for phenol removal experiments were conducted using produced water samples The removal profile of phenolic compounds during irradiation with UV (180 min) can be observed through the analysis of the chromatograms obtained by HS-SPME-GCMS (Figure 6)
Analysis of HS-SPME-GCMS allowed us to assess efficiently the removal of phenolic compounds proving to be a promising analytical tool in studies to monitor photodegradation of organic pollutants Based on these results we observed that the UV photolysis was able to quantitatively remove the majority of the phenolic compounds reducing 803 up to 999 of their initial concentrations after 180 min of treatment (Figure 7)
Despite lower concentrations of chlorophenols detected in the sample (Table 4) compared to the concentrations of other phenolic compounds the degradation rate of chlorophenols are among the lowest values (803 for 246-TCP and 889 for PeCP) These results are consistent with earlier studies which found the lower susceptibility to degradation of chlorophenols by direct UV irradiation3233 The lower removal is due to the fact that the dissociated forms of chlorophenols absorb UV radiation more strongly so for a faster and efficient removal of these compounds direct photolysis should be conducted in alkaline conditions32 Despite the lower removal of CPs an increase in their degradation rate can be proposed with an increase in radiation time Titus et al33 reported several studies showing that the degradation of different CPs are faster when decreasing the number of chlorine atoms in alkali medium at constant values of initial CP concentration radiation intensity and temperature In contrast in their work they found this trend seems not to be applied in
Figure 5 Pareto chart obtained from central composite design for UVH2O2 optimization
Application of Headspace Solid-Phase Microextraction and Gas Chromatography-Mass Spectrometry J Braz Chem Soc682
acidic conditions where the kinetic constant for 246-TCP degradation was higher than the one for 24-DCP In our work we can observe the same trend to the acidic condition Even with concentration three times lower than PeCP the 246-TCP compound had a slower rate of removal
With respect to monoalkyl and dialkylphenols similar degradation profiles reaching almost their complete mineralization in solely 45 min (938-999) were estimated as shown in Figure 7 The exception occurred to m-cresol and p-ethylphenol reaching 866 and 802 of removal respectively during the same period of treatment The rate of phenol removal was also slow yielding only 751 Some factors may be accounted to the slower removal of these compounds Firstly we must consider
the large concentration of aromatic compounds such as benzene toluene and other alkyl substituted benzenes present in produced water which through oxidative processes involving hydroxyl radical can be oxidized generating phenols and other substituted phenolic isomers A second consideration should be made regarding the decomposition process of phenol by direct photolysis The absorption of UV light at 254 nm leads to the generation of phenoxyl radical caused by the formation of an excited state of phenol with subsequent deprotonation The phenoxyl radical can exist as ortho-carbon para-carbon or resonant structures with oxygen-centered as described by Alapi and Dombi34 and depicted in Scheme 1 Although the formation of ortho meta and para-cresols as intermediate products from UV photolysis of phenol in produced water has not been widely discussed in the literature the kinetic profile of degradation described in Figure 7 suggests that can also happen concomitantly a pathway production of substituted phenols by methyl or other alkyl radicals from aromatic and aliphatic hydrocarbons found in large amounts in these samples As observed through removal profile obtained to m-cresol and p-ethylphenol the degradation rate was similar to phenol degradation during the initial 30 min even with concentrations of about 2 up to 100 times smaller than initial concentration of phenol This fact supports our hypothesis that simultaneous to the phenol degradation an increase in the concentration of some alkyl phenols occur coming from the attack by methylalkyl radicals making the degradation of these compounds more slowly This apparent slow degradation rate could then be attributed to a possible formation of alkyl phenols from the resonance structure as depicted in Scheme 1
Figure 6 Chromatograms of phenolic compounds in produced water exposed to UV photolysis DMP dimethylphenol EtP ethyl phenol TMP trimethylphenol TCP triclorophenol PeCP pentachlorophenol
0 20 40 60 80 100 120 140 160 180 200
0
20
40
60
80
100
time min
Eff
icie
ncy
rem
oval
phenol
o-cresol
m-cresol
p-cresol
(24 DMP)
o-ethylphenol
(23 DMP)
(26 DMP)
p-ethylphenol
(34 DMP)
(25 DMP)
TMPs
246-TCP
PeCP
Figure 7 Profile showing removal of phenolic compounds during the treatment of produced water by UV photolysis DMP Dimethylphenol EtP ethyl phenol TMP trimethylphenol TCP thriclorophenol PeCP pentachlorophenol
0 20 40 60 80 100 120 140 160 180 200
0
20
40
60
80
100
time min
Eff
icie
ncy
rem
oval
phenol
o-cresol
m-cresol
p-cresol
(24 DMP)
o-ethylphenol
(23 DMP)
(26 DMP)
p-ethylphenol
(34 DMP)
(25 DMP)
TMPs
246-TCP
PeCP
Silva and Madureira 683Vol 26 No 4 2015
Based on the results described in Table 4 we can affirm that the oxidative process via direct photolysis is an efficient process for the removal of phenolic compounds in produced water Despite the high concentrations determined the process was efficient in removing 997 of the phenolic compounds studied The total concentration of residual phenolic compounds (22 mg L-1) reached
values close to those permitted by CONAMA 430 for total phenols (05 mg L-1)17 These are outstanding results when compared to those obtained by testing a synthetic solution using phenol as model compound Although the samples had concentrations much higher than the test solution (50 mg L-1) this process showed very satisfactory results A plausible explanation for this efficiency can be attributed to the presence of salts and metal hydroxides that could act synergistically as catalysts increasing the rate of degradation of phenolic compounds in produced water Another important aspect to be considered is the high content of dissolved organic matter (DOM) present in produced water It is well known that DOM acts as an important agent photosensitizer increasing photoreactivity of many organic compounds by the indirect formation of highly reactive species like radicals35 Future studies will be conducted to understand the effects of these constituents in the process of photolysis
UVperoxide degradation process of phenolic compounds found in the produced water monitored by HS-SPME-GCMS showed removal efficiency gt 90 for most studied compounds already within the first 15 min of degradation (Figure 8) Similarly in the UV photolysis the 246-TCP also showed lower degradation rate by UVperoxide (806) Although the sample subjected to degradation by UVperoxide contains a much lower concentration of phenols the results obtained by the two methods were very similar differing only in the kinetics of the reaction for the process of UVH2O2 proved to be
Table 4 Residual concentration and removal efficiency of phenolic compounds obtained by the degradation processes
CompoundResidual concentration (mg L-1)a Removal efficiency
UV photolysis (180 min) UVH2O2 (60 min) UV photolysis (180 min) UVH2O2 (60 min)
Phenol 183 125 995 983
o-Cresol 002 006 999 999
m-Cresol 019 003 999 998
p-Cresol 003 006 999 996
24 DMP lt 001 lt 001 999 995
o-Ethylphenol nd lt 001 1000 991
23 DMP lt 001 lt 001 999 998
26 DMP lt 001 lt 001 999 997
p-Ethylphenol 001 lt 001 997 996
34 DMP 003 001 999 994
25 DMP 002 001 999 994
TMPs 001 003 998 963
246-TCP 005 001 803 806
PeCP 001 001 825 926
Total phenols (mg L-1) 221 149amean concentration (n=3) nd not detected
Scheme 1 Proposed tentative formation of alkyl phenols
Application of Headspace Solid-Phase Microextraction and Gas Chromatography-Mass Spectrometry J Braz Chem Soc684
faster This improvement in removal (shorter treatment time) obtained by the UVH2O2 process is due to different mechanisms of formation resulting in a more efficient generation of hydroxyl radicals
By-products identification by GC-MS
Table 5 describes the main by-products formed during the UV and UVH2O2 processes These compounds were identified by HS-SPME-GCMS and comparison with NIST library data authentic standards and based on literature The results revealed the formation of several hydroxylated compounds aromatic esters chlorophenols
some organic acids and alkyl benzenes Although reported in the literature hydroquinones and benzoquinones were not identified in the final treated residue3637 However the formation of these by-products was noted during the degradation processes due the appearance and rapid disappearance of a yellowish-brown color in solution within the first minutes of treatment indicating the formation of these by-products as transient intermediates The main by-product detected was 26-di-tert-butylbenzoquinone (DBQ) in samples subjected to both UV and UVH2O2 treatment The presence of this compound as well as hydroxy compounds constituting the major fraction of by-products identified demonstrates that the main pathway
Figure 8 Total ion chromatograms (TIC) showing the distribution of phenolic compounds in produced water after applying UVH2O2 treatment for 60 min DMP dimethylphenol EtPethylphenol TMP trimethylphenol (see other codes at the foot note of Table 2)
Table 5 Main by-products formed during the UV and UVH2O2 processes tentatively identified by GC-MS
Compound Structural formula
26-Di-tert-butylbenzoquinone (DBQ)
O
O
2-Hydroxybenzoic acid OH
O
OH
35-Di-tert-butylpyrocatechol
HO
HO
Compound Structural formula
35-Di-tert-butyl-4-hydroxyacetophenone
OH
O
25-Di-tert-butylhydroquinone (DTBHQ)
HO
OH
35-Di-tert-butyl-4-hydroxybenzaldehyde
O
OH
Silva and Madureira 685Vol 26 No 4 2015
Table 5 Main by-products formed during the UV and UVH2O2 processes tentatively identified by GC-MS (cont)
Compound Structural formula
14-Naphthoquinone 6-acetyl-25-dihydroxy
OH
OH
O
O
O
Benzaldehyde 2-hydroxy-4-methoxy-36-dimeyhyl
OH
O
O
25-Di-t-amyl-p-benzoquinone (DAQ)
O
O
1-(2-Methylphenyl) ethanone
O
3-Acetyl-244-trimethylcyclohex-2-en-1-one
O
O
Pentanoic acid 5-hydroxy-24-di-t-butylphenyl esters OHO
O
4rsquo-Butoxy-2rsquo-methylacetophenone
O
O
2rsquo-Methyl-4rsquo-propoxypropiophenone
O
O
2-Methyl-1-(2-methyl-4-propoxyphenyl)propan-1-one
O
O
Compound Structural formula
1-(26-dimethyl-4-propoxyphenyl)-2-methyl-propan1-one
O
O
pentanedioc acid (24-di-t-buthylphenyl) mono-ester O OH
O O
246-Tris(11-dimethyl)-4-methylcyclohexa-25-dien-1-one O
Propanoic acid 2-methyl-1-(11dimethyl)-2-methyl-13-propanediyl ester
O
O OO
Ethanone 11rsquo-(6-methoxy-25-benzofurandiyl)bis O O
O
O
79-Di-tert-butyl-1-oxaspiro(45)deca-69-diene-28-dione
O
O
O
12-Benzenedicarboxylic acid butyl cyclohexyl ester O
O
OO
of degradation is initiated by the oxidation of the aromatic phenolic ring generating quinones diphenols benzoic acids and phenones The cleavage of the aromatic ring results in the production of organic acids and aliphatic hydrocarbons shown in this study but at low concentrations The non-identification of these compounds in high concentrations indicates that despite the high efficiency of the treatment process the complete mineralization of the sample was not achieved possibly due to the high organic content A large number of compounds identified denote the
countless possibilities of by-products that may be formed when complex samples such as produced water are subjected to chemical processes of oxidation indicating the importance of further studies focusing on the toxicity of such compounds
Conclusions
In conclusion we showed in this work that the multivariate experiment optimization is an important
Application of Headspace Solid-Phase Microextraction and Gas Chromatography-Mass Spectrometry J Braz Chem Soc686
statistical tool to monitoring and evaluate the removal processes of phenolic compounds in complex samples like produced water The direct photolysis and UVH2O2
processes were capable to degrade more than 99 of the initial total concentration of phenolic compounds present in the produced water The HS-SPME-GCMS was successfully used for the determination of the residual concentration of phenolic compounds as well as the formation of by-products proving to be an important analytical tool in wastewater treatment studies
Supplementary Information
Supplementary data (fluorescence spectra ANOVA tables and spectra of by-products) are available free of charge at httpjbcssbqorgbr as PDF file
Acknowledgments
The authors are thankful to TRANSPETRO for the samples provided to the Brazilian Federal Agency for Support and Evaluation of Graduate Education (CAPES) and PETROBRAS for the financial support
References
1 Lu J R Wang X L Shan B T Li X M Wang W D
Chemosphere 2006 62 322
2 Ahmadum F R Pendashteh A Abdullah L C Biak DRA
Madaeni S S Abidin Z Z J Hazard Mater 2009 170 530
3 Farag A M Harper D D Int J Coal Geol 2014 126 157
4 Neff J M Bioaccumulation in Marine Organisms Elsevier
Oxford 2002
5 The International Association of Oil amp Gas Producers (OGP)
Report 364 London 2005
6 Stepnowski P Siedlecka E M Behrend P Jastorff B Water
Res 2002 36 2167
7 Coelho A Castro AV Dezotti M SantrsquoAnna G L
J Hazard Mater 2006 137 178
8 Esplugas S Gimenez J Contreras S Pascual E
Rodriguez M Water Res 2002 36 1034
9 Louch D Motlagh S Pawliszyn J Anal Chem 1992 64
1187
10 Sanchez-Prado L Llompart M Lores M Garcia-Jares C
Bayona J M Cela R Chemosphere 2006 65 1338
Alvarez-Rivera G Llompart M Garcia-Jares C Lores M
J Chromatogr A 2014 1349 105
11 Mascolo G Ciannarella R Balest L Lopez A J Hazard
Mater 2008 152 1138
12 Boitsov S Meier S Klungsoyr J Svardal A J Chromatogr A
2004 1059 131
13 Lee K Neff J M Produced Water Environmental Risks and
Advances in Mitigation Technologies Springer New York
2011
14 Faksness L G Grini P G Daling P S Mar Pollut Bull
2004 48 731
15 Boitsov S Mjos S A Meier S Mar Environ Res 2007
64 651
16 Igunnu E T Chen G Z J Low-Carbon Technol 2014 9
157
17 Conselho Nacional do Meio Ambiente (CONAMA) Resoluccedilatildeo
430 Available in httpwwwmmagovbrportconamalegiabre
cfmcodlegi=646 acessed in January 2015
18 Gaya U I Abdullah A H Zainal Z Hussein M Z
J Hazard Mater 2009 168 57
19 Naidu G S N Panda T Biochem Eng J 1998 2 71
20 Montgomery D C Runger G C Hubele N F Engineering
Statistics John Wiley and Sons Inc Hoboken 2001
21 Vining G G Statistical Methods for Engineers Duxburg Press
London 2003
22 Mason R L Gunst R F Hess J J Statistical Design and
Analysis of Experiments with Applications to Engineering and
Science John Wiley and Sons Inc Hoboken 2003
23 Guaracho V V Kaminari N M S Ponte M J J S Ponte
H A J Hazard Mater 2009 172 1087
24 Castrantas H M Gibilisco R D ACS Symp Ser 1990 422
77
25 Audureau J Filiol C Boule P Lemaire J J Chim Phys
PCB 1976 73 613
26 Liao C H Kang S F Wu F A Chemosphere 2001 44
1193
27 Liao C H Gurol M D Environ Sci Technol 1995 29 3007
28 Delaat J Tace E Dore M Water Res 1994 28 2507
29 Andreozzi R Caprio V Insola A Marotta R Catal Today
1999 53 51
30 Christensen H Sehested K Corfitzen H J Phys Chem
1982 86 1588
31 Alnaizy R Akgerman A Adv Environ Res 2000 4 233
23 Trapido M Hirvonen A Veressinina Y Hentunen J
Munter R OzoneSci Eng 1997 19 75
33 Pera-Titus M Garcia-Molina V Banos M A Gimenez J
Esplugas S Appl Catal B 2004 47 219
34 Alapi T Dombi A J Photoch Photobio A 2007 188 409
35 Miller P L Chin Y P Environ Sci Technol 2005 39 4454
36 Kusic H Koprivanac N Bozic A L Chem Eng J 2006
123 127
37 Busca G Berardinelli S Resini C Arrighi L J Hazard
Mater 2008 160 265
Submitted August 17 2014
Published online February 6 2015
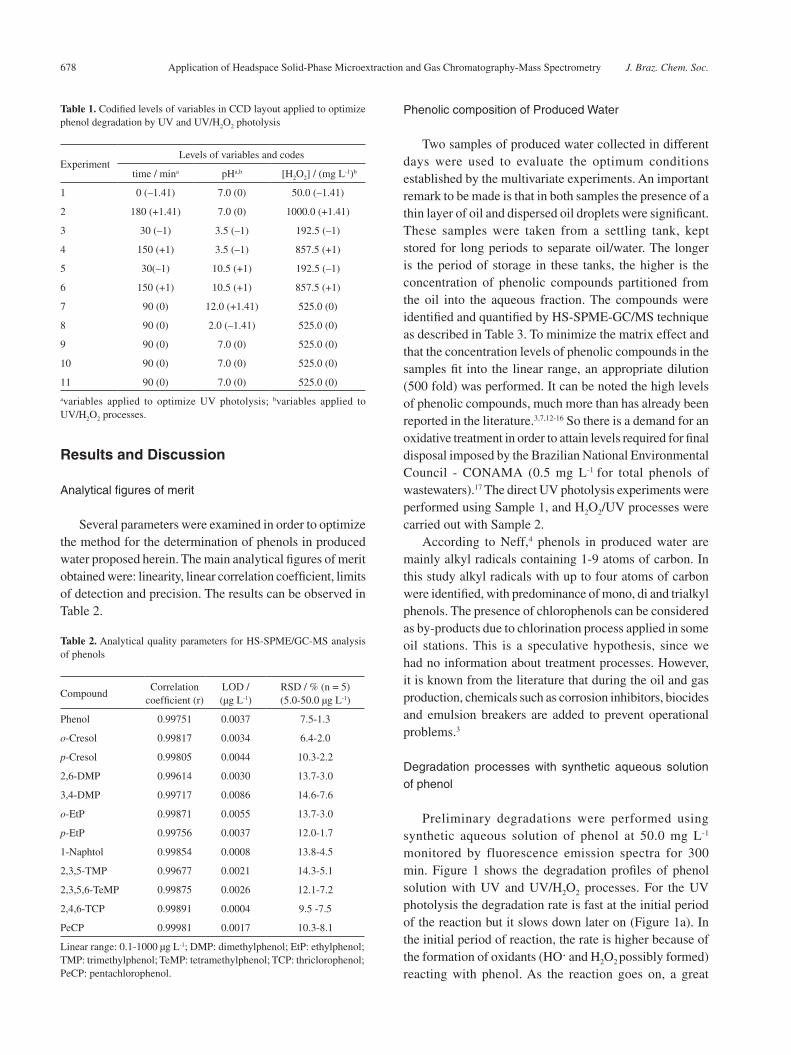
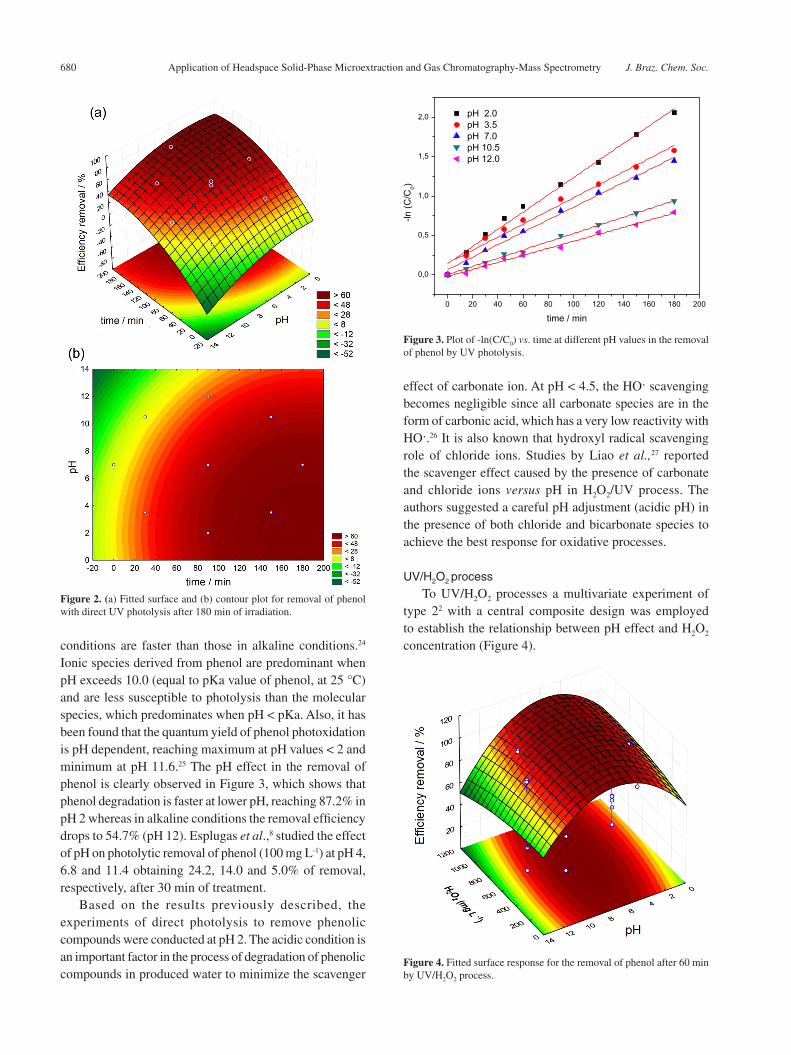