Certus Accelerate - Building the business case for why you need to invest in your data by Julien...
26
BUILDING THE BUSINESS CASE FOR WHY YOU NEED TO INVEST IN YOUR DATA
-
Upload
certus-solutions -
Category
Technology
-
view
126 -
download
0
Transcript of Certus Accelerate - Building the business case for why you need to invest in your data by Julien...
BUILDING THE BUSINESS CASE
FOR WHY YOU NEED TO INVEST
IN YOUR DATA
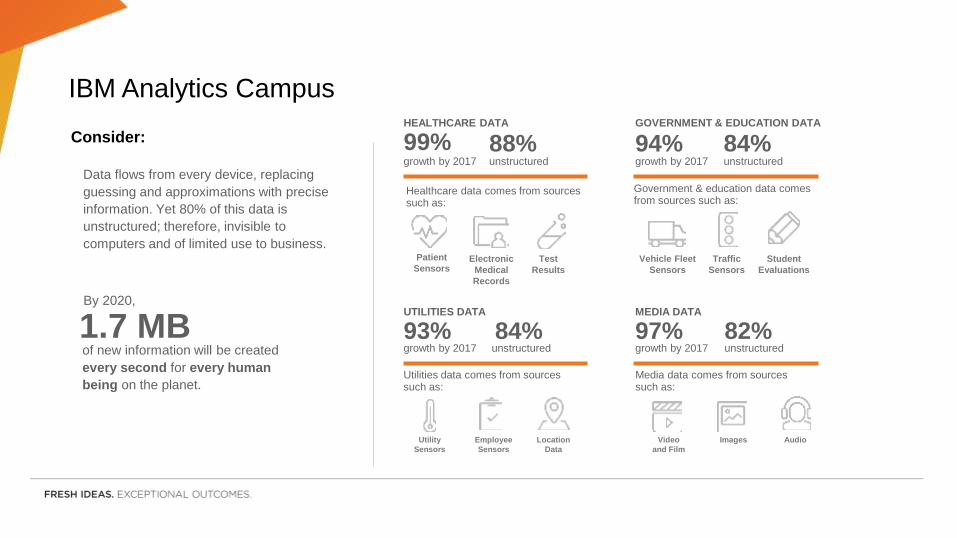
HEALTHCARE DATA GOVERNMENT & EDUCATION DATA
99% 88% 94% 84%
Healthcare data comes from sources such as:
Government & education data comes from sources such as:
Patient
SensorsElectronic
Medical
Records
Test
Results
Vehicle Fleet
Sensors
Traffic
Sensors
Student
Evaluations
UTILITIES DATA MEDIA DATA
93% 84% 97% 82%
Utilities data comes from sources such as:
Media data comes from sources such as:
Utility
Sensors
Employee
Sensors
Location
Data
Video
and Film
Images Audio
growth by 2017 unstructured growth by 2017 unstructured
growth by 2017 unstructured growth by 2017 unstructured
Data flows from every device, replacing
guessing and approximations with precise
information. Yet 80% of this data is
unstructured; therefore, invisible to
computers and of limited use to business.
By 2020,
of new information will be created
every second for every human
being on the planet.
1.7 MB
IBM Analytics Campus
Consider:

The world is being rewritten in software
code, and cloud is the platform on which
the new digital builders—from developers
to business professionals—are
reimagining everything from banking to
retail to healthcare.
100,000,000lines of codein a new car
5,000,000lines of codein smart appliances
1,200,000lines of codein a smartphone
80,000lines of codein a pacemaker
IBM Analytics Campus
Consider:
of B2B
collaboration
will take place
through web
APIs next year.
50%
Smart TVs
represented 27% of
all TV sales in 2012;
by 2018, they will
represent 82%.
Smart LED lighting
will grow from 6M
units in 2015 to 570M
units in 2020, used for
safety communication,
health, pollution and
personalized services.
By 2017, there will be
1B connected things
in smart homes,
including appliances,
smoke detectors and
cameras.
Sensors for industrial asset
monitoring and management will
grow from just over 15M units in
2014 to over 40M units in 2018
Smart traffic sensors
and other devices
installed in smart
cities will grow from
237M units in 2015 to
371M in 2017.
Revenues for
smart grid sensors
will grow ten-fold from
2014 to 2021.
Code Tools
Analytics
Data
APIs
By 2020, there will be
925M smart meters
installed worldwide,
more than double the
400M in 2014.

So where do we want to go from here?
Predictive Prescriptive Cognitive

Cognitive systems can understand the world through sensing and
interaction, reason using hypotheses and arguments and learn from experts
and through data. Watson is the most advanced such system.
Today, businesses in
countries across.
There are
Watson ecosystem partner
companies, with
78%of business and IT executives
believe that successful business will
manage employees alongside
intelligent machines.
On average there are
36
17industries are applying cognitive
technologies.
350+
100of those have taken their product to market.
1.3BWatson API calls a month
and growing.
Among C-Suite executives familiar
with cognitive computing:
96%
84%
94%
89%
in insurance intend to invest in cognitive
capabilities.
in healthcare believe it will play a
disruptive role in the industry, and 60%
believe they lack the skilled professionals
and technical experience to achieve it.
in retail intend to invest in cognitive
capabilities.
in telecommunications believe
it will have a critical impact on the future of
their business.
IBM Analytics Campus
Consider:

IBM Analytics Campus
Understands
natural
language
Generates
and
evaluates
hypotheses
Discover
Adapts
and learns
Watson is
COGNITIVE
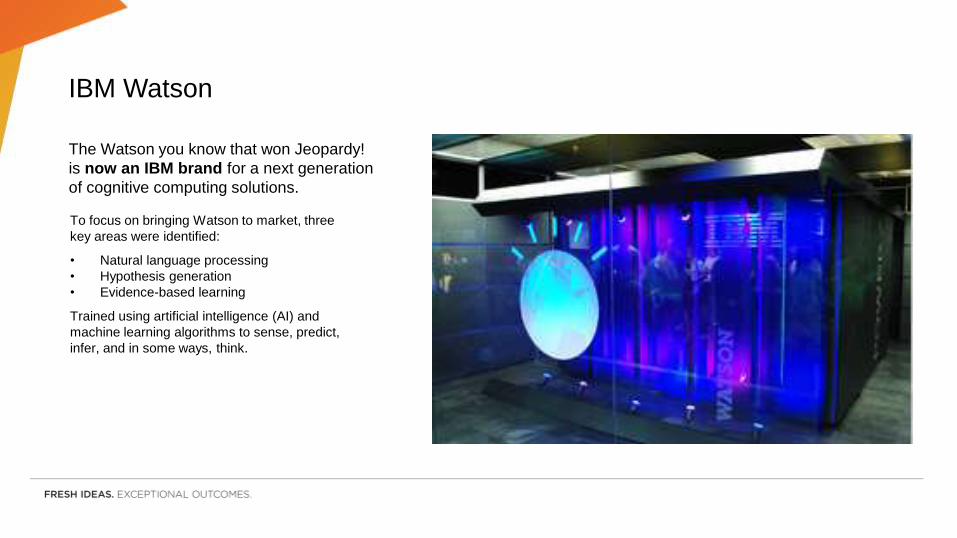
The Watson you know that won Jeopardy!
is now an IBM brand for a next generation
of cognitive computing solutions.
IBM Watson
To focus on bringing Watson to market, three
key areas were identified:
• Natural language processing
• Hypothesis generation
• Evidence-based learning
Trained using artificial intelligence (AI) and
machine learning algorithms to sense, predict,
infer, and in some ways, think.

Watson solutions aim to enhance, scale, and accelerate human expertise,
targeting a wide range of complex challenges
Natural Language
Discover
Learn
Understand
Confidence

Relationship
Extraction
Questions
&
Answers
Language
Detection
Personal
ity
Insights
Keyword
ExtractionImage Link
Extraction
Feed
Detection
Visual
Recognition
Concept
Expansion
Concept
Insights
DialogSentiment
Analysis
Text to
Speech
Tradeoff
Analytics
Natural
Language
Classifier
Author
Extraction
Speech to
Text
Retrieve
&
Rank
Watson
News
Language
Translation
Entity
Extraction
Tone
Analyzer
Concept
Tagging
Taxonomy
Text
Extraction
Message
Resonance
Image
Tagging
Face
Detection
Answer
Generation
Usage
Insights
Fusion
Q&A
Video
Augmentation
Decision
Optimization
Knowledge
Graph
Risk
Stratification
Policy
Identification
Emotion
Analysis
Decision
Support
Criteria
Classification
Knowledge
Canvas
Easy
Adaptation
Knowledge
Studio Service
Statistical
Dialog
Q&A
Qualification
Factoid
Pipeline
Case
Evaluation
The Watson that competed on
Jeopardy! in 2011 comprised what
is now a single API—Q&A—built
on five underlying technologies.
Since then, Watson has grown to
a family of 28 APIs.
By the end of 2016, there will
be nearly 50 Watson APIs—
with more added every year.
Natural Language
Processing
Machine Learning
Question Analysis
Feature Engineering
Ontology Analysis
IBM Analytics CampusIBM Watson

So where are we all right now?
Structured
Semi-structured
Unstructured

• Unfortunately, 40% to 50% of data warehouse initiatives end in costly failure.
International Association for Computer Information Systems
• Gartner estimates in 2012 that by 2014, fewer than 30% of business intelligence
(BI) initiatives will align analytics completely with enterprise business drivers,
despite alignment being the foremost BI challenge
• LinkedIn poll in 2013 asked BI experts how much of a BI project was spent in just
getting the data right. The answer came back as around 75–80%.
• Data warehouses are replaced on average every 3–5 years!
Statistical overview
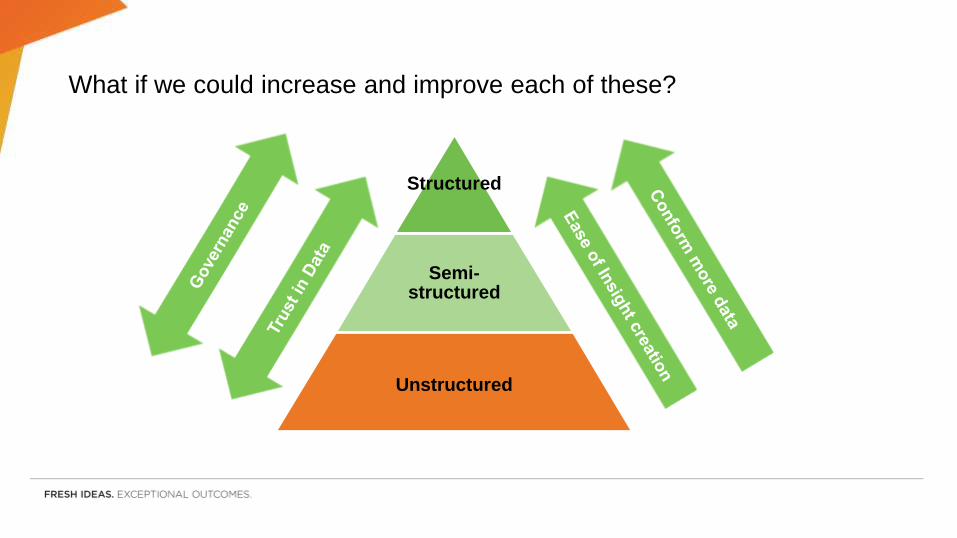
What if we could increase and improve each of these?
Structured
Semi-structured
Unstructured
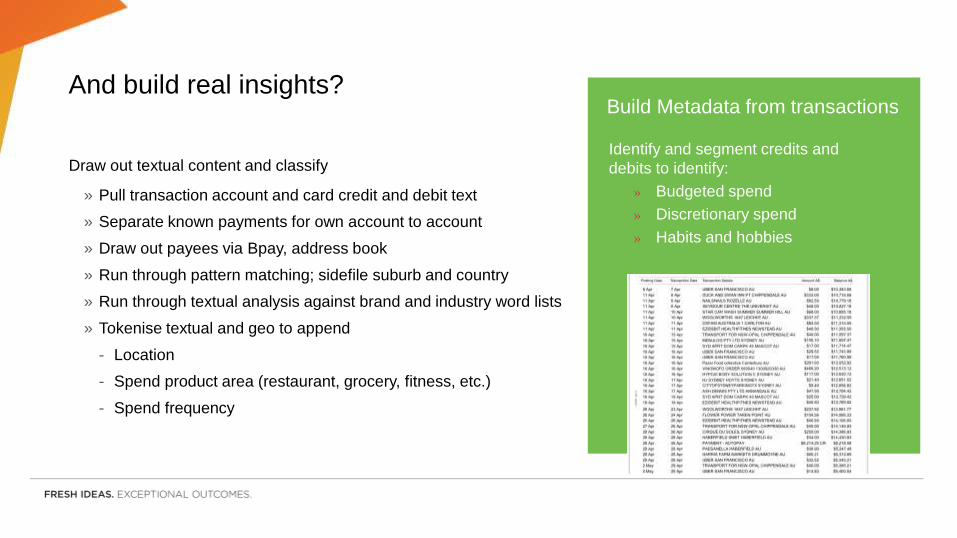
Draw out textual content and classify
» Pull transaction account and card credit and debit text
» Separate known payments for own account to account
» Draw out payees via Bpay, address book
» Run through pattern matching; sidefile suburb and country
» Run through textual analysis against brand and industry word lists
» Tokenise textual and geo to append
- Location
- Spend product area (restaurant, grocery, fitness, etc.)
- Spend frequency
And build real insights?Build Metadata from transactions
Identify and segment credits and
debits to identify:
» Budgeted spend
» Discretionary spend
» Habits and hobbies
So we need a new architecture
and a new approach
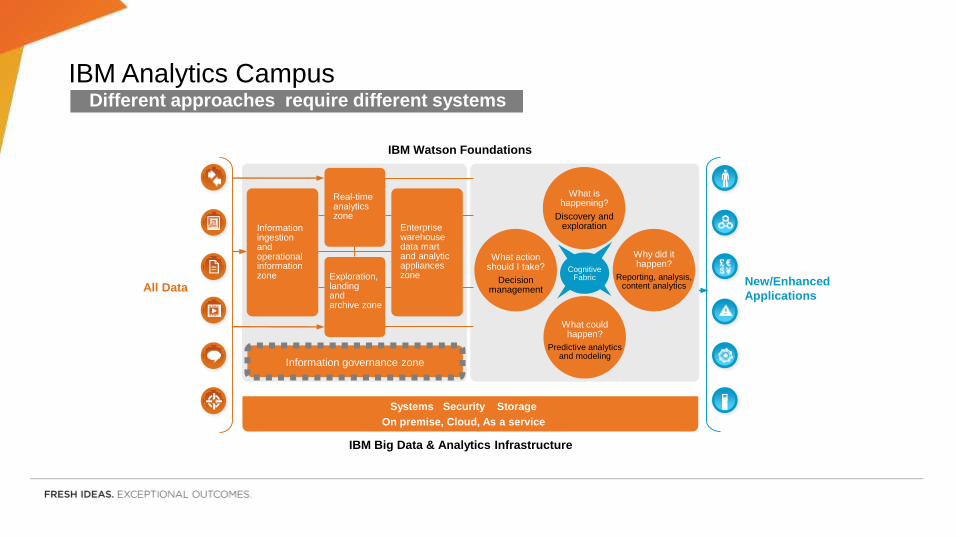
IBM Analytics CampusDifferent approaches require different systems
Systems Security
On premise, Cloud, As a service
Storage
IBM Watson Foundations
IBM Big Data & Analytics Infrastructure
New/Enhanced
ApplicationsAll Data
Real-time analytics zone
Enterprise warehouse data mart and analytic appliances zone
Information governance zone
Exploration, landingand archive zone
Information ingestion and operational informationzone
What could happen?
Predictive analyticsand modeling
What action should I take?
Decisionmanagement
What is happening?
Discovery andexploration
Why did it happen?
Reporting, analysis,content analytics
CognitiveFabric

• Capturing any type of information, fast/slow, big/small, structured, unstructured, text/images etc
• The ability to visualise, report. predict and action
BUT to make this a reality we need to apply:
• Retained auditability/integrity
• Flexible Access
• Appropriate security
• Single view of an entity
• Just Enough Governance,
• Just enough modelling,
• Automation
• Avoiding re-engineering,
New Tools & Methods are providing new capabilities to:
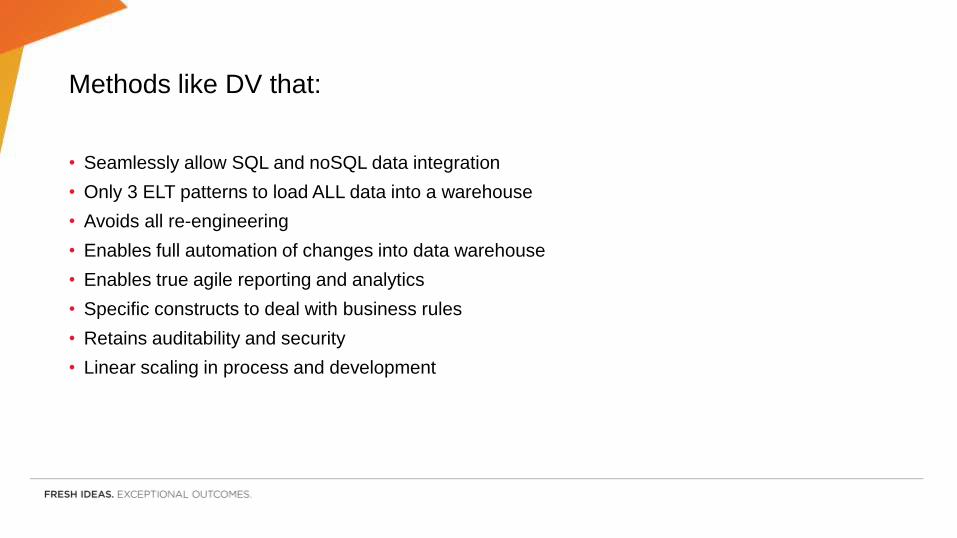
• Seamlessly allow SQL and noSQL data integration
• Only 3 ELT patterns to load ALL data into a warehouse
• Avoids all re-engineering
• Enables full automation of changes into data warehouse
• Enables true agile reporting and analytics
• Specific constructs to deal with business rules
• Retains auditability and security
• Linear scaling in process and development
Methods like DV that:

Operational Data Store
Bring data together in real time.
Create an alternative to querying operational
databases.
Make operational data easier to access and use.
Time Machine
Go back to any point in time and re-run a query.
Troubleshoot old decisions made on old report.
Analyse change over time.
Semantic Layer
Store data so that reporting and analytic tools can use it.
Model and name information so it can be understood
and used safely.
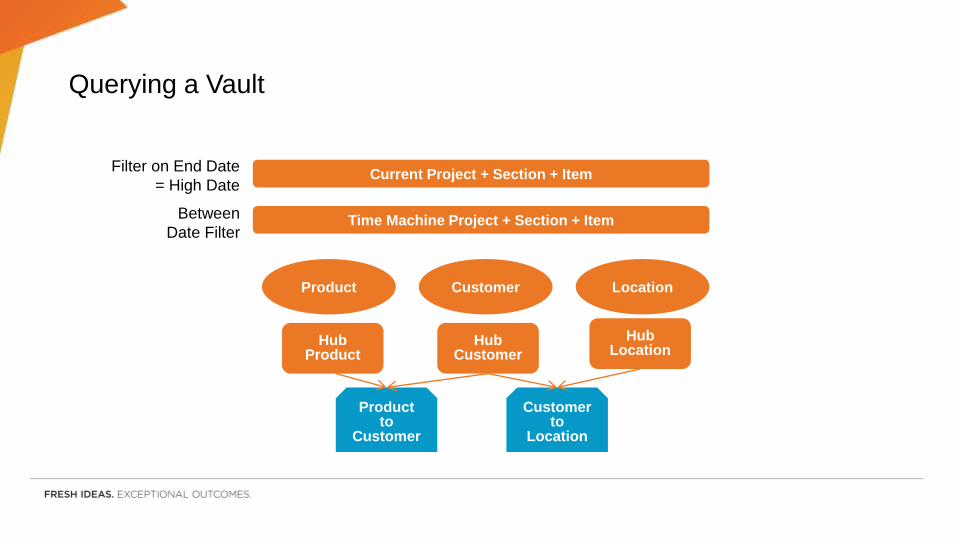
Querying a Vault
Product Customer Location
Hub Product
Hub Customer
Hub Location
Product to
Customer
Customer to
Location
Current Project + Section + Item
Time Machine Project + Section + Item
Filter on End Date
= High Date
Between
Date Filter

IBM Analytics CampusInformation integration and governance
New/Enhanced
ApplicationsAll Data
Information Integration and Governance
Information Governance and compliance reporting
Data Quality
Entity Management
Information Lifecycle
Management
Information Integration
On-Premises, As-A-Service (IBM DataWorks)and Cloud (SoftLayer)
Unlocks key insights, by providing trust and comprehensive view
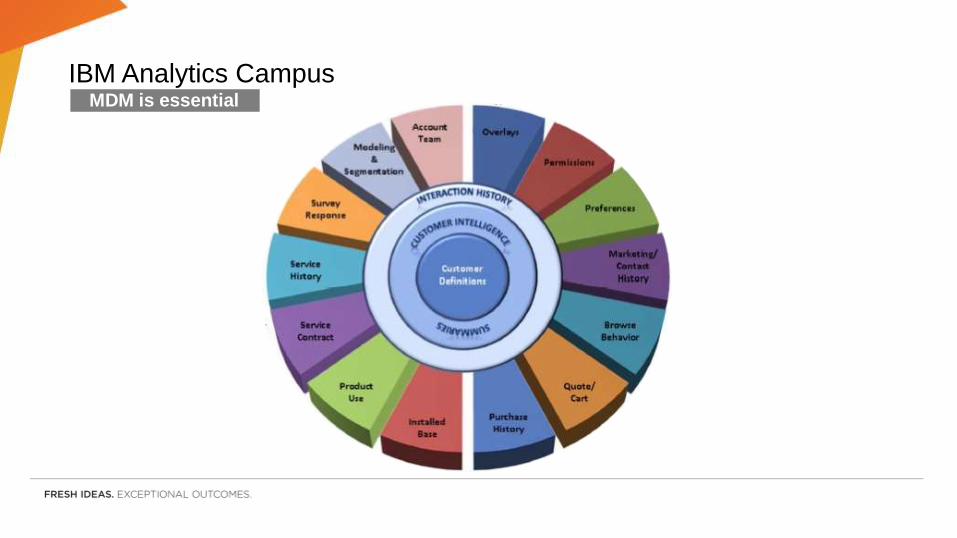
IBM Analytics CampusMDM is essential
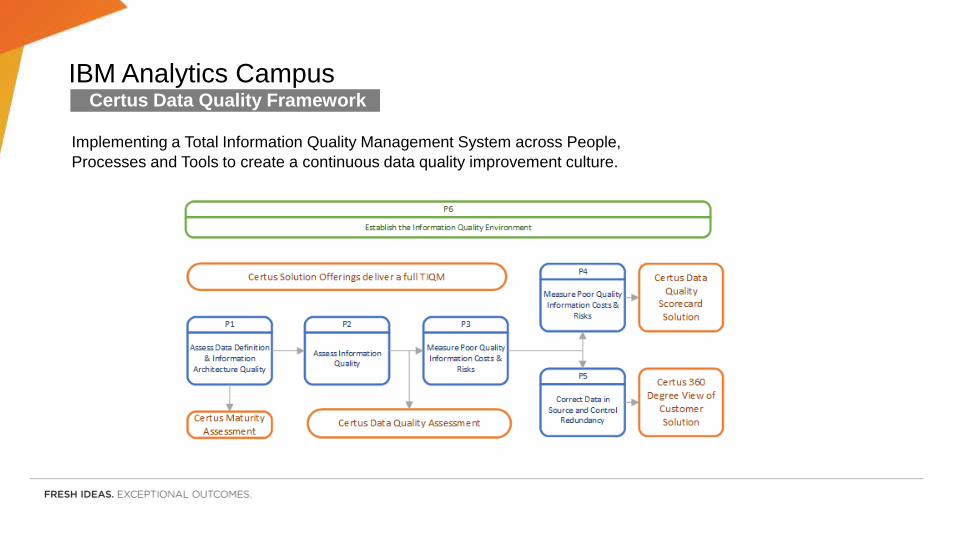
IBM Analytics CampusCertus Data Quality Framework
Implementing a Total Information Quality Management System across People,
Processes and Tools to create a continuous data quality improvement culture.
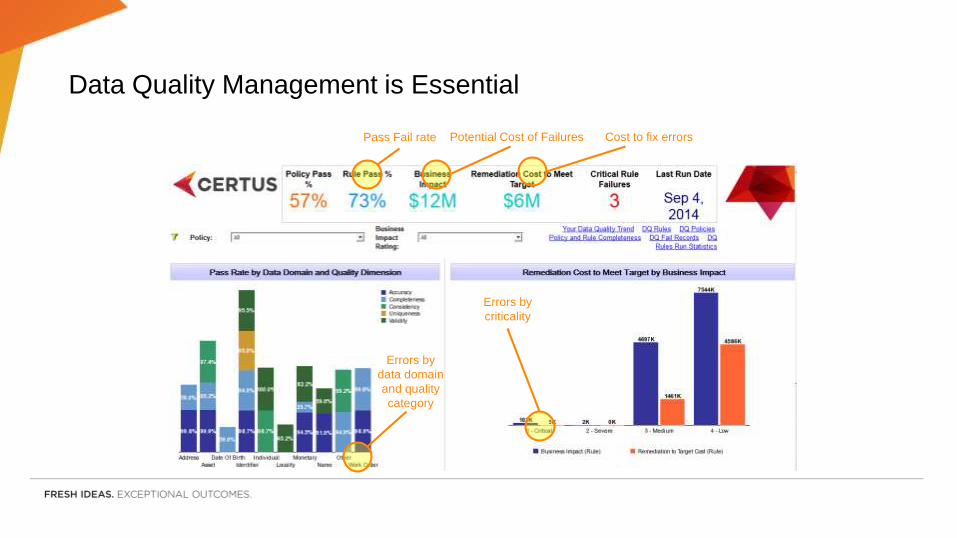
Data Quality Management is Essential
Pass Fail rate Potential Cost of Failures Cost to fix errors
Errors by
data domain
and quality
category
Errors by
criticality
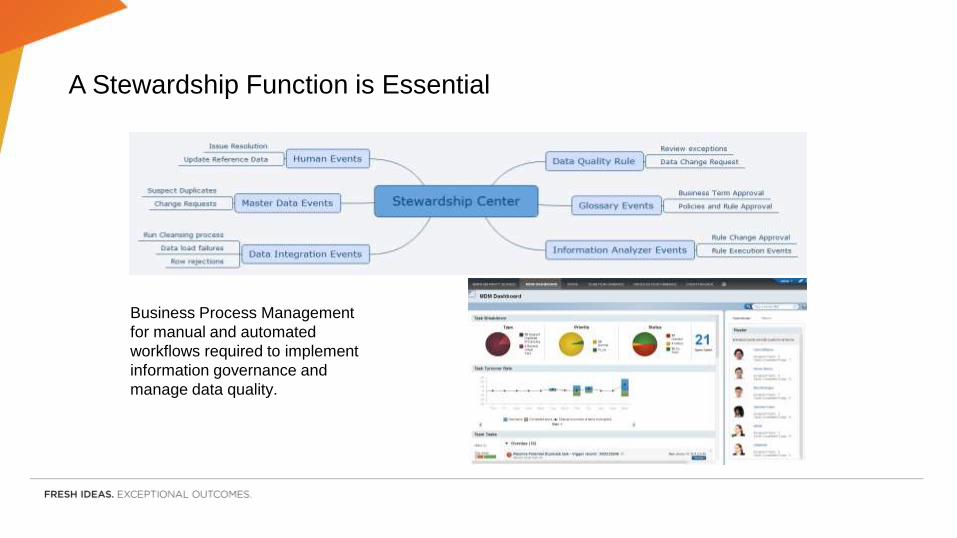
A Stewardship Function is Essential
Business Process Management
for manual and automated
workflows required to implement
information governance and
manage data quality.
Governance can be justified by efficiency and avoiding rework but looking at the
impact of the cost of data quality is better.
Single entity view is boring plumbing that no one wants to do but if you look at what
you can achieve with a true single view of customer/patient/asset/product the effort
is worth it and the payoffs immense.
A Data Warehouse refresh is painful process and has a poor history however to
take advantage of new opportunities, markets or ways of doing business you need
to embrace more information. The justification for the effort is helped by the fact that
the new DW should be flexible to cater for a huge number of uses, automated so
maintenance is minimal, and designed to last and cost a fraction of what was spent
on the legacy DW.
So back to the business case:
Becoming an analytically driven or
cognitive business is a journey.
Businesses will be able to rapidly capitalize
on new opportunities if they have invested
in the foundations of their information
management systems.