
Certification of a reference material consisting of genomic...
35
EUR 23371 EN - 2008 Certification of a reference material consisting of genomic DNA inserts of Bacillus licheniformis DSM 5749 for PFGE IRMM-311 N. Meeus, L. De Baets, P. van Iwaarden, W. Philipp, H. Schimmel
Transcript of Certification of a reference material consisting of genomic...
EUR 23371 EN - 2008
Certification of a reference materialconsisting of genomic DNA inserts of
Bacillus licheniformis DSM 5749 for PFGEIRMM-311
N. Meeus, L. De Baets, P. van Iwaarden, W. Philipp, H. Schimmel
The mission of the IRMM is to promote a common and reliable European measurement system in support of EU policies. European Commission Joint Research Centre Institute for Reference Materials and Measurements Contact information Address: Retieseweg 111, 2440 Geel, Belgium E-mail: [email protected] Tel.: 014/571 705 Fax: 014/590 406 http://irmm.jrc.ec.europa.eu/ http://www.jrc.ec.europa.eu/ Legal Notice Neither the European Commission nor any person acting on behalf of the Commission is responsible for the use which might be made of this publication.
Europe Direct is a service to help you find answers to your questions about the European Union
Freephone number (*):
00 800 6 7 8 9 10 11
(*) Certain mobile telephone operators do not allow access to 00 800 numbers or these calls may be billed.
A great deal of additional information on the European Union is available on the Internet. It can be accessed through the Europa server http://europa.eu/ EUR 23371 EN ISBN 978-92-79-09025-7 ISSN 1018-5593 DOI 10.2787/51728 Luxembourg: Office for Official Publications of the European Communities © European Communities, 2008 Printed in Belgium

European Commission
IRMM information REFERENCE MATERIALS
Certification of a reference material consisting of genomic DNA inserts of
Bacillus licheniformis DSM 5749 for PFGE
IRMM-311
N. Meeus, L. De Baets, P. van Iwaarden, W. Philipp, H. Schimmel
European Commission Joint Research Centre
Institute for Reference Materials and Measurements (IRMM) Geel, Belgium

1
Abstract This report describes the production and certification of IRMM-311, a reference
material of genomic DNA (gDNA) of Bacillus licheniformis DSM 5749 in agarose
inserts. This CRM (IRMM-311) is intended to be used for the taxonomic identification
of authorised probiotic feed additives by Pulsed Field Gel Electrophoresis (PFGE).
The homogeneity and stability of the batch was assessed by monitoring the PFGE
pattern of a SfiI restriction enzyme digest of gDNA of Bacillus licheniformis DSM
5749 in agarose inserts. The batch was found to be homogeneous and the material
is stable at 4 °C. The batch was characterised by five laboratories determining the
PFGE pattern of a SfiI restriction enzyme digest of IRMM-311. The pattern should be
considered as a whole and restriction fragments in the size range from 50 kb to 90 kb
are certified for their fragment length. DNA sequence analysis of the 3' end of the
16S rRNA gene and the entire 16S-23S internal transcribed spacer (ITS) coding
region confirmed the identity of the strain as Bacillus licheniformis. Each vial contains
one agarose insert containing gDNA of Bacillus licheniformis DSM 5749.

2

3
Table of contents
GLOSSARY..............................................................................................................................................4
1 INTRODUCTION ...........................................................................................................................5
2 PARTICIPANTS .............................................................................................................................6
3 PROCESSING ................................................................................................................................7
4 PROCEDURES ...............................................................................................................................9
5 HOMOGENEITY..........................................................................................................................11
6 STABILITY ...................................................................................................................................13 6.1 SHORT-TERM STABILITY ...........................................................................................................13 6.2 LONG-TERM STABILITY .............................................................................................................14
7 BATCH CHARACTERISATION.................................................................................................16
8 ADDITIONAL CHARACTERISATION......................................................................................18
9 METROLOGICAL TRACEABILITY................................................................................................19
10 CERTIFIED VALUE AND UNCERTAINTY.................................................................................20
11 INSTRUCTIONS FOR USE ............................................................................................................21
12 REFERENCES..........................................................................................................................23
ACKNOWLEDGEMENTS ............................................................................................................24
ANNEX 1 .........................................................................................................................................25

4
Glossary BLAST Basic Local Alignment Search Tool
bp base pair
DNA deoxyribonucleic acid
DNase deoxyribonuclease
DTCS dye terminator cycle sequencing
EDTA ethylenediaminetetraacetic acid
ES 0.5 mol/L EDTA pH 8.0, 1 % (m/v) sodium lauryl sarcosine
ESP ES containing proteinase K at 1 mg/mL
gDNA genomic DNA
ITS internal transcribed spacer
kb kilo base pairs
LMP low melting point
LTS long-term stability
N number of vials
n number of replicates
n.a. not applicable
no. number
NB nutrient broth
OD600 optical density at a wavelength of 600 nm
PCR polymerase chain reaction
PFGE pulsed field gel electrophoresis
PMSF phenylmethanesulfonyl fluoride
rDNA ribosomal DNA, DNA sequences encoding ribosomal RNA RE restriction enzyme
RNA ribonucleic acid
RNase ribonuclease
rRNA ribosomal RNA
RSD relative standard deviation
s standard deviation
SDS sodium dodecyl sulphate
SE standard error
STS short-term stability
TBE 89 mmol/L Tris, 89 mmol/L boric acid, 2 mmol/L EDTA, pH 8.3
TE 10 mmol/L Tris, 1 mmol/L EDTA, at specified pH
Tris tris(hydroxymethyl)aminomethane
5
1 Introduction Probiotic micro-organisms authorised for use as feed additives are described in
Commission Regulation (EC) No 2148/2004 [1]. Pulsed Field Gel Electrophoresis
(PFGE) is a powerful molecular typing method which can be used to discriminate
different strains of bacterial species [2]. Bacterial strains yielding the same PFGE
patterns are considered to be the same strain [3]. This report describes the
production and certification of a batch of 400 vials of a reference material composed
of genomic DNA (gDNA) of Bacillus licheniformis DSM 5749 in agarose (IRMM-311),
in support of EU legislation. Council Directive 70/524/EEC concerning additives in
feed regulates the use of probiotic bacilli and Directive 93/113/EC regulates the
marketing of micro-organisms and their preparations in animal nutrition. According to
both Directives, the use of specific genera of bacteria as feed additives are approved.
One of the officially approved probiotics is Bacillus licheniformis DSM 5749. The
certification of IRMM-311 was performed according to IRMM Reference Materials
Unit procedures applying a quality management system according to ISO Guide 34
[4 - 7]. Homogeneity and stability of the produced batch was analysed at IRMM.
Short-term stability (STS) measurements were performed following incubation at 4 °C
and 18 °C in the frame of the certification project. Long-term stability (LTS)
measurements were performed following incubation at 4 °C. The batch was
characterised by monitoring the PFGE pattern of a restriction enzyme (RE) digest of
selected samples by IRMM and 4 different external laboratories. Identification of
Bacillus licheniformis DSM 5749 was confirmed by DNA sequencing of the nucleotide
sequences of the 3' end of the 16S rDNA and the 16S–23S internal transcribed
spacer (ITS) [9].
6
2 Participants Bacillus licheniformis strain DSM 5749 originates from the Chr. Hansen A/S culture
collection (Hørsholm, DK).
The processing and certification of IRMM-311 was performed at IRMM.
Participants for the batch characterisation were:
- Chr. Hansen A/S, Hørsholm, DK.
- Animal Sciences Group, Lelystad, NL.
- Food and Consumer Product Safety Authority, Zutphen, NL.
- University of Helsinki, Helsinki, FI.
- European Commission, Joint Research Centre, Institute for Reference Materials
and Measurements (IRMM), Geel, BE.
A summary of the different steps in the processing and certification of IRMM-311 is
given in Table 1. Table 1. Summary of different steps in the production of IRMM-311. Project phases Time period
Processing Nov. - Dec. 2005
Certification Feb. - Aug. 2006
Certification report and certificate Oct. 2006 – Aug 2007
7
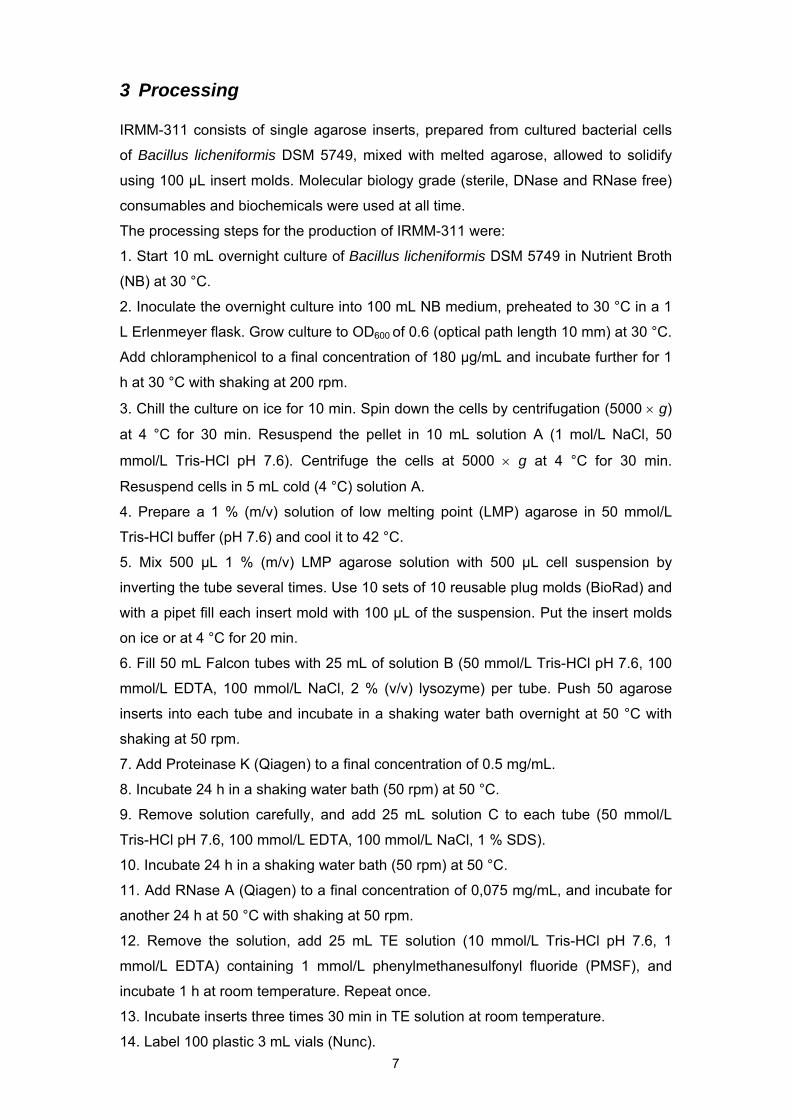
3 Processing IRMM-311 consists of single agarose inserts, prepared from cultured bacterial cells
of Bacillus licheniformis DSM 5749, mixed with melted agarose, allowed to solidify
using 100 µL insert molds. Molecular biology grade (sterile, DNase and RNase free)
consumables and biochemicals were used at all time.
The processing steps for the production of IRMM-311 were:
1. Start 10 mL overnight culture of Bacillus licheniformis DSM 5749 in Nutrient Broth
(NB) at 30 °C.
2. Inoculate the overnight culture into 100 mL NB medium, preheated to 30 °C in a 1
L Erlenmeyer flask. Grow culture to OD600 of 0.6 (optical path length 10 mm) at 30 °C.
Add chloramphenicol to a final concentration of 180 μg/mL and incubate further for 1
h at 30 °C with shaking at 200 rpm.
3. Chill the culture on ice for 10 min. Spin down the cells by centrifugation (5000 × g)
at 4 °C for 30 min. Resuspend the pellet in 10 mL solution A (1 mol/L NaCl, 50
mmol/L Tris-HCl pH 7.6). Centrifuge the cells at 5000 × g at 4 °C for 30 min.
Resuspend cells in 5 mL cold (4 °C) solution A.
4. Prepare a 1 % (m/v) solution of low melting point (LMP) agarose in 50 mmol/L
Tris-HCl buffer (pH 7.6) and cool it to 42 °C.
5. Mix 500 μL 1 % (m/v) LMP agarose solution with 500 μL cell suspension by
inverting the tube several times. Use 10 sets of 10 reusable plug molds (BioRad) and
with a pipet fill each insert mold with 100 μL of the suspension. Put the insert molds
on ice or at 4 °C for 20 min.
6. Fill 50 mL Falcon tubes with 25 mL of solution B (50 mmol/L Tris-HCl pH 7.6, 100
mmol/L EDTA, 100 mmol/L NaCl, 2 % (v/v) lysozyme) per tube. Push 50 agarose
inserts into each tube and incubate in a shaking water bath overnight at 50 °C with
shaking at 50 rpm.
7. Add Proteinase K (Qiagen) to a final concentration of 0.5 mg/mL.
8. Incubate 24 h in a shaking water bath (50 rpm) at 50 °C.
9. Remove solution carefully, and add 25 mL solution C to each tube (50 mmol/L
Tris-HCl pH 7.6, 100 mmol/L EDTA, 100 mmol/L NaCl, 1 % SDS).
10. Incubate 24 h in a shaking water bath (50 rpm) at 50 °C.
11. Add RNase A (Qiagen) to a final concentration of 0,075 mg/mL, and incubate for
another 24 h at 50 °C with shaking at 50 rpm.
12. Remove the solution, add 25 mL TE solution (10 mmol/L Tris-HCl pH 7.6, 1
mmol/L EDTA) containing 1 mmol/L phenylmethanesulfonyl fluoride (PMSF), and
incubate 1 h at room temperature. Repeat once.
13. Incubate inserts three times 30 min in TE solution at room temperature.
14. Label 100 plastic 3 mL vials (Nunc).

8
15. Transfer one agarose insert to each labeled plastic vial containing 1 mL TE.
16. Store the vials at 4 °C until digestion with REs.
17. Perform homogeneity and stability study and batch characterisation.
Steps 1 to 16 were repeated 4 times in order to produce 400 samples. As a control,
PFGE analysis was performed on 2 random samples as described in section 4 and
revealed the presence of intact high molecular mass DNA in the plugs.

9
4 Procedures 4.1 Minimum sample volume. One agarose insert is used per analysis.
4.2 Digestion of agarose inserts with a RE Digestion of agarose inserts with a RE was performed as described in section 11.2.
More information on the procedure can be found in reference [8]. Four different REs
(NotI, SpeI, AscI and SfiI) were tested of which SfiI appeared to be the most suitable.
4.3 Pulsed Field Gel Electrophoresis.
The measurements in this report were performed using the Bio-Rad CHEF-DR® III
System (Bio-Rad Laboratories, BE) using the method described in section 11.2.
Other PFGE systems can be used as well. More information on the procedure can be
found in reference [8].
4.4 16S-RNA strain identification and DNA sequencing. 16S-RNA strain identification was performed as described in [9]. Briefly, gDNA was
isolated using the Qiagen genomic tip 20/G kit. 16S rRNA and 16S-23S ITS were
amplified by PCR using primers L516SF and L523SR. Amplified fragments were
visualised on agarose gels, extracted from gel using the Qiagen gel extraction kit and
cloned into pCR2.1 (Invitrogen). Plasmids were purified using the QIAGEN Plasmid
Mini Kit and sequenced using the dye terminator cycle sequencing (DTCS) reaction,
according to the DTCS chemistry protocol [10]. Primers for sequencing were the
universal M13 primers annealing to the 5' terminus of lacZ. Samples were analysed
on a CEQ™ 8000 genetic analysis system (Beckman Coulter, Inc., Fullerton, CA, US),
using the following method: denaturation 120 s at 90 °C, injection 15 s at 2.0 kV,
separation 85.0 min at 4.2 kV. As a control for the sequencing reaction the CEQ™
8000 pUC18 plasmid was included on each sequencing plate. Validation of DNA
sequencing using the CEQ™ 8000 system is described in detail in reference [11].
4.5 Sequencing of Pulse Marker Pulse Marker is a mixture of λ DNA Hind III fragments, λ DNA, and λ concatemers
embedded in 1% LMP agarose. The concatamers are two or more identical linear
molecular units, covalently linked in tandem by means of single-stranded extensions
or cos sites. In order to check the completeness of the concatemers of λ, i.e. no
parts are missing at the covalent bond, the nucleotide sequence at the linking region
of two DNA molecules in the marker was determined. A 1 mm slice of Pulse Marker
D2291 (Sigma) was used as template in a PCR reaction amplifying a 216 base pair
(bp) region including the end of 1 λ molecule and the start of a second. Based on the
sequence in GenBank (J02459) primers were chosen 76 bp upstream and 87 bp
downstream from the cos sites respectively (Figure 1). PCR was performed under
10
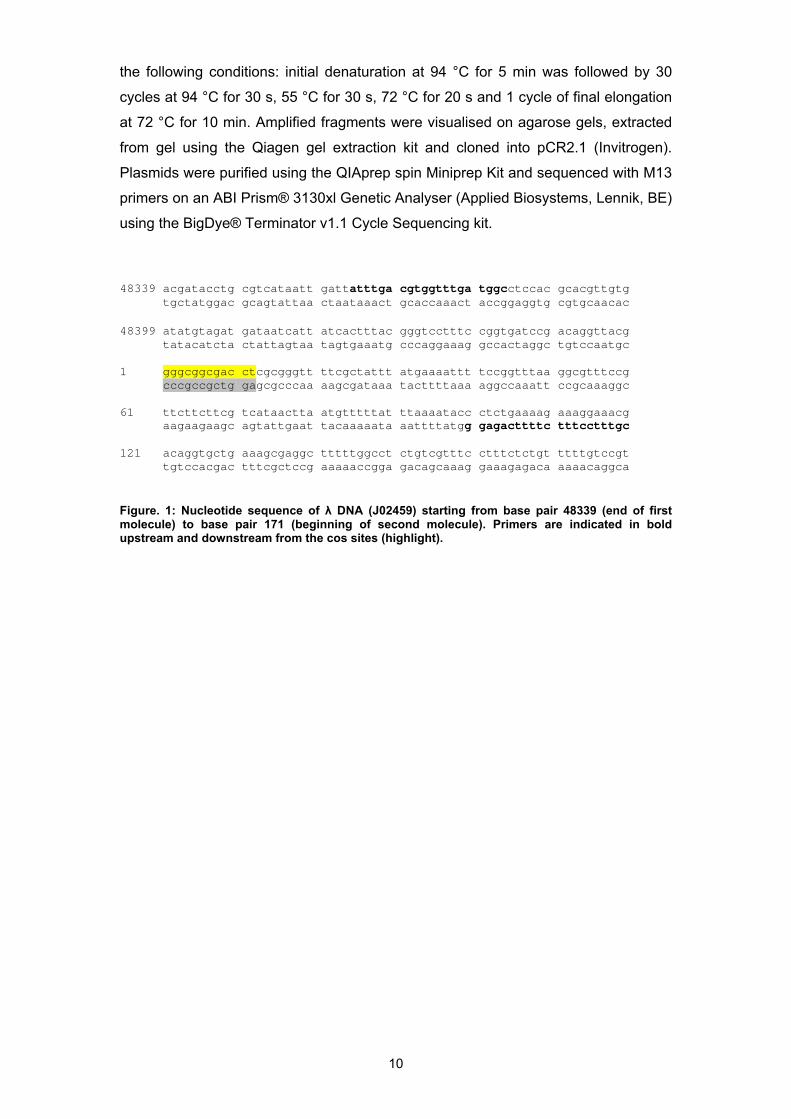
the following conditions: initial denaturation at 94 °C for 5 min was followed by 30
cycles at 94 °C for 30 s, 55 °C for 30 s, 72 °C for 20 s and 1 cycle of final elongation
at 72 °C for 10 min. Amplified fragments were visualised on agarose gels, extracted
from gel using the Qiagen gel extraction kit and cloned into pCR2.1 (Invitrogen).
Plasmids were purified using the QIAprep spin Miniprep Kit and sequenced with M13
primers on an ABI Prism® 3130xl Genetic Analyser (Applied Biosystems, Lennik, BE)
using the BigDye® Terminator v1.1 Cycle Sequencing kit. 48339 acgatacctg cgtcataatt gattatttga cgtggtttga tggcctccac gcacgttgtg tgctatggac gcagtattaa ctaataaact gcaccaaact accggaggtg cgtgcaacac 48399 atatgtagat gataatcatt atcactttac gggtcctttc cggtgatccg acaggttacg tatacatcta ctattagtaa tagtgaaatg cccaggaaag gccactaggc tgtccaatgc 1 gggcggcgac ctcgcgggtt ttcgctattt atgaaaattt tccggtttaa ggcgtttccg cccgccgctg gagcgcccaa aagcgataaa tacttttaaa aggccaaatt ccgcaaaggc 61 ttcttcttcg tcataactta atgtttttat ttaaaatacc ctctgaaaag aaaggaaacg aagaagaagc agtattgaat tacaaaaata aattttatgg gagacttttc tttcctttgc 121 acaggtgctg aaagcgaggc tttttggcct ctgtcgtttc ctttctctgt ttttgtccgt tgtccacgac tttcgctccg aaaaaccgga gacagcaaag gaaagagaca aaaacaggca Figure. 1: Nucleotide sequence of λ DNA (J02459) starting from base pair 48339 (end of first molecule) to base pair 171 (beginning of second molecule). Primers are indicated in bold upstream and downstream from the cos sites (highlight).

11
5 Homogeneity The total number of samples produced was 400. The total number of samples to be
used in the homogeneity study (N) was calculated as 3√ 400 = 7.4 [5]. In this study N
is set to 8 and the number of replicates (n) is set to 1.
The homogeneity study was performed by monitoring the PFGE pattern of a SfiI
digest of the samples in comparison with commercial size standards for PFGE (D
2291 and D 2416, Sigma). Identical banding patterns were found for all 8 samples.
Imaging was done using GeneSnap software and fragment length for restriction
bands in the size range 50 kb – 90 kb were assigned using GeneTools software,
copyright© of Synoptics Ltd., Cambridge, UK. The results of the homogeneity
measurements are summarised in Figure 2 and Table 2.
Figure 2. PFGE of SfiI digest of gDNA of the samples used in homogeneity measurements of IRMM-311. Run conditions: initial switch time ( = final switch time) = 3 s, run time = 20 h, 6 V per cm, angle = 120°, buffer temperature 14 °C. Lane 1: PFGE standard 0.1 - 200 kb (D 2291, Sigma); Lane 2-9: corresponds to the series of sample numbers in Table 2; Lane 10: PFGE standard 50 - 1000 kb (D 2416, Sigma). Restriction bands between 50 kb and 90 kb are marked from 1 to 10.
1 2 3 4 5 6 7 8 9 10 145.5 kb - 97.0 kb - 48.5 kb - 23.1 kb -
- 145.5 kb - 97.0 kb 1
3
5 7
9
- 48.5 kb
2
4 6
8
10
1 2 3 4 5 6 7 8 9 10

12
Table 2. Homogeneity of the PFGE pattern of IRMM-311. Assignment of fragment length [kb] to restriction bands between 50 kb and 90 kb of a SfiI digest of each sample.
No suspicious data were detected based on the number and the positioning of the
bands. No bands were missing and no new bands appeared. Therefore the complete
set of data was used. No major differences in the intensity of the restriction patterns
of the different samples was visually observed. Therefore the batch was found to be
homogenous.
Sample Band no. 0032 0100 0139 0159 0250 0274 0338 0398 1 89.4 88.7 88.4 88.3 89.1 87.9 87.4 86.7 2 81.9 82.2 82.4 81.8 82.8 83.1 81.4 81.5 3 76.4 76.9 75.3 76.2 77.4 73.7 76.2 74.9 4 73.7 73.7 73.2 73.5 75.7 73.0 73.4 73.3 5 66.7 66.9 66.7 66.4 67.3 65.7 66.9 66.7 6 65.9 65.9 65.9 65.4 66.7 65.1 65.8 65.3 7 60.4 60.4 60.5 60.2 61.0 59.7 60.1 59.8 8 55.8 56.4 54.4 56.0 55.6 55.6 55.6 54.0 9 53.7 54.0 53.9 53.5 54.3 53.0 53.4 53.3 10 50.2 50.4 50.3 49.8 50.4 49.2 49.6 49.6
Fragment length [kb]

13
6 Stability 6.1 Short-term stability The proper conditions for transport of the material to the customer were determined
in a STS study consisting of isochronous incubation of samples at 4 °C and 18 °C
for 0, 2 and 4 weeks. For each time/temperature combination two samples were
tested. The PFGE pattern of a SfiI digest of selected samples was analysed using
commercial size standards.
The data from the STS study are summarised in Figure 3 and Table 3. No suspicious
data were detected. Therefore, the whole data set was used. At 4 °C and 18 °C the
material is stable, with all restriction bands between 50 kb and 90 kb detected by
PFGE analysis. At 18 °C a slightly weaker signal is found, however al major bands
are still visible. The material must be shipped at 4 °C (use of cooling elements). At
this temperature, degradation of the material is negligible.
Figure 3. PFGE of SfiI digests of the samples used for STS measurements of IRMM-311. Run conditions: initial switch time ( = final switch time) = 3 s, run time = 20 h, 6 V per cm, angle = 120°, buffer temperature 14 °C. Lanes 1, 3, 6 and 8: D 2291 (Sigma); 2: 0004, 0 weeks; 4: 0087, 2 weeks, 4 °C; 5: 0058, 2 weeks 18 °C; 7: 0171, 4 weeks 4 °C; 9: 0135, 4 weeks, 18 °C
194.0 kb ─ 145.5 kb ─
97.0 kb ─
48.5 kb ─ 23.1 kb ─
1 2 3 4 5 6 7 8 9
194.0 kb ─ 145.5 kb ─ 97.0 kb ─ 48.5 kb ─ 23.1 kb ─
194.0 kb ─ 145.5 kb ─
97.0 kb ─ 48.5 kb ─ 23.1 kb ─
194.0 kb ─ 145.5 kb ─ 97.0 kb ─ 48.5 kb ─ 23.1 kb ─
1 2 3 4 5 6 7 8 9
14
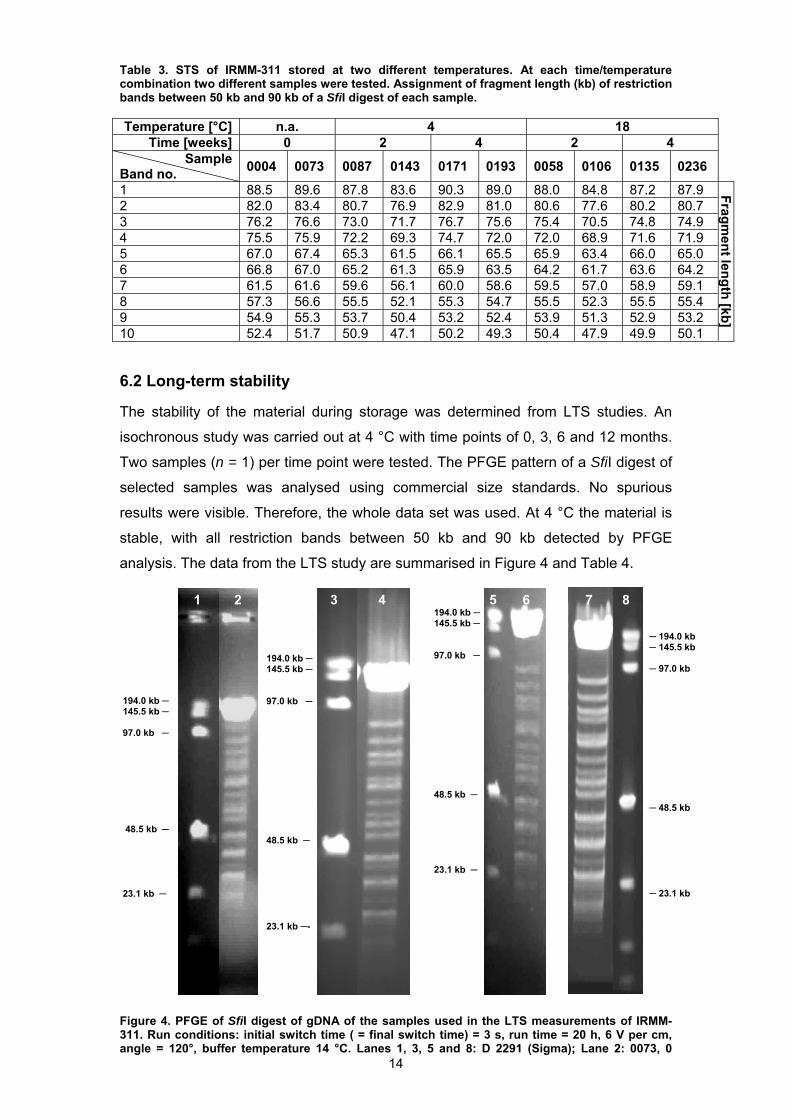
Table 3. STS of IRMM-311 stored at two different temperatures. At each time/temperature combination two different samples were tested. Assignment of fragment length (kb) of restriction bands between 50 kb and 90 kb of a SfiI digest of each sample. Temperature [°C] n.a. 4 18
Time [weeks] 0 2 4 2 4 Sample
Band no. 0004 0073 0087 0143 0171 0193 0058 0106 0135 0236
1 88.5 89.6 87.8 83.6 90.3 89.0 88.0 84.8 87.2 87.9 2 82.0 83.4 80.7 76.9 82.9 81.0 80.6 77.6 80.2 80.7 3 76.2 76.6 73.0 71.7 76.7 75.6 75.4 70.5 74.8 74.9 4 75.5 75.9 72.2 69.3 74.7 72.0 72.0 68.9 71.6 71.9 5 67.0 67.4 65.3 61.5 66.1 65.5 65.9 63.4 66.0 65.0 6 66.8 67.0 65.2 61.3 65.9 63.5 64.2 61.7 63.6 64.2 7 61.5 61.6 59.6 56.1 60.0 58.6 59.5 57.0 58.9 59.1 8 57.3 56.6 55.5 52.1 55.3 54.7 55.5 52.3 55.5 55.4 9 54.9 55.3 53.7 50.4 53.2 52.4 53.9 51.3 52.9 53.2 10 52.4 51.7 50.9 47.1 50.2 49.3 50.4 47.9 49.9 50.1
Fragment length [kb]
6.2 Long-term stability
The stability of the material during storage was determined from LTS studies. An
isochronous study was carried out at 4 °C with time points of 0, 3, 6 and 12 months.
Two samples (n = 1) per time point were tested. The PFGE pattern of a SfiI digest of
selected samples was analysed using commercial size standards. No spurious
results were visible. Therefore, the whole data set was used. At 4 °C the material is
stable, with all restriction bands between 50 kb and 90 kb detected by PFGE
analysis. The data from the LTS study are summarised in Figure 4 and Table 4.
Figure 4. PFGE of SfiI digest of gDNA of the samples used in the LTS measurements of IRMM-311. Run conditions: initial switch time ( = final switch time) = 3 s, run time = 20 h, 6 V per cm, angle = 120°, buffer temperature 14 °C. Lanes 1, 3, 5 and 8: D 2291 (Sigma); Lane 2: 0073, 0
194.0 kb ─ 145.5 kb ─ 97.0 kb ─ 48.5 kb ─ 23.1 kb ─
194.0 kb ─ 145.5 kb ─ 97.0 kb ─ 48.5 kb ─ 23.1 kb ─
194.0 kb ─ 145.5 kb ─ 97.0 kb ─ 48.5 kb ─ 23.1 kb ─-
─ 194.0 kb ─ 145.5 kb ─ 97.0 kb ─ 48.5 kb ─ 23.1 kb
1 2 3 4 5 6 7 8

15
months 4 °C; Lane 4: 0195, 3 months 4 °C; Lane 6: 0239, 6 months 4 °C; Lane 7: 0319, 12 months 4 °C. Table 4. LTS of IRMM-311 stored at 4 °C. At each time/temperature combination two samples were tested. Assignment of fragment length (kb) to restriction bands between 50 kb and 90 kb of a SfiI digest of each sample. Temperature [°C] n.a. 4 °C
Time [months] 0 3 6 12 Sample
Band no. 0004 0073 0126 0195 0239 0279 0319 0377
1 88.5 89.6 87.7 86.7 86.8 87.8 84.6 85.5 2 82.0 83.4 80.6 79.7 78.4 80.0 78.4 78.8 3 76.2 76.6 75.6 74.2 72.2 74.6 74.2 74.6 4 75.5 75.9 72.3 71.1 68.5 71.8 71.8 72.0 5 67.0 67.4 66.5 65.4 60.9 63.0 66.8 66.9 6 66.8 67.0 64.4 63.3 59.5 62.8 65.3 65.5 7 61.5 61.6 59.3 58.2 53.7 57.4 60.2 60.6 8 57.3 56.6 55.4 54.9 49.7 53.8 56.3 56.7 9 54.9 55.3 53.1 52.3 46.8 50.6 53.6 53.8 10 52.4 51.7 49.9 49.4 43.5 47.5 50.2 50.5
Fragment length
[kb]

16
7 Batch characterisation
The batch of IRMM-311 was characterised by IRMM and four external laboratories.
Each laboratory analysed two samples of IRMM-311 by PFGE following digestion
with SfiI according to the protocol in section 11.2 and reported the image of the
PFGE gel. Fragment lengths of the characteristic restriction bands in the region
between 50 kb and 90 kb were assigned using an appropriate software. The results
are summarised in Table 5, Figure 5 and annex 1. Although not all gels are of the
same quality, it is clear that all labs obtained an identical banding pattern.
Table 5. Batch characterisation of IRMM-311. Two samples were tested by each participant. Assignment of fragment length (kb) of restriction bands between 50 kb and 90 kb of aSfiI digest. Mean of laboratory means, standard deviation (s) and relative standard deviation (RSD) are indicated. Laboratory code A B C
sample Band no. 0021 0060 0085 0109 345 387
1 89.7 89.0 95.6 96.0 88.2 88.1 2 83.2 82.6 81.1 81.0 80.5 80.2 3 78.1 78.0 73.1 73.3 75.5 75.2 4 74.8 75.1 68.5 68.2 72 72.4 5 69.0 69.4 65.6 65.4 66.9 67.1 6 66.9 67.3 61.3 60.8 64.4 64.8 7 61.7 61.8 59.4 59.2 59.3 59.7 8 57.9 58.3 55.9 55.4 55.6 56.1 9 54.8 55.6 53.2 52.4 52.9 53.3 10 51.4 51.9 50.4 49.8 48.9 49.6 Laboratory code D E
sample Band no. 0276 0320 0159 0250 mean s RSD
[%] 1 85.9 85.7 88.3 89.1 89.6 3.5 3.9 2 77.8 77.9 81.8 82.8 80.9 1.9 2.5 3 73.2 73.3 76.2 77.4 75.3 2.0 2.7 4 70.8 70.5 73.5 75.7 72.2 2.7 3.7 5 65.9 65.7 66.4 67.3 66.9 1.4 2.1 6 64 64 65.4 66.7 64.6 2.2 3.4 7 60.4 60.3 60.2 61.0 60.3 1.0 1.6 8 57.3 56.9 56.0 55.6 56.5 1.0 1.8 9 54.7 54.6 53.5 54.3 53.9 1.0 1.9 10 51.7 51.7 49.8 50.4 50.6 1.1 2.1

17
40.0
50.0
60.0
70.0
80.0
90.0
100.0
0 1 2 3 4 5 6 7 8 9 10 11
band number
fragm
ent l
engt
h (k
b)
0021
0060
0085
0109
0345
0387
0276
0320
0159
0250
Figure 5. Results of batch characterisation. Graphical representation of fragment length of 10 restriction bands between 50 kb and 90 kb. Each symbol corresponds to a different sample analysed by one of the participating laboratories.

18
8 Additional characterisation Identification of Bacillus licheniformis was confirmed by DNA sequencing of the
nucleotide sequences of the 3' end of the 16S rDNA and the 16S–23S ITS [9]. The
Basic Local Alignment Search Tool (BLAST) finds regions of local similarity between
sequences. The program compares nucleotide or protein sequences to sequence
databases and calculates the statistical significance of matches. Using nucleotide-
nucleotide BLAST the obtained sequence was compared to other nucleotide
sequences in the GenBank database and showed 99 % homology with the reported
DNA sequence of the 16S rDNA and the 16S–23S ITS of different strains of Bacillus
licheniformis (Figure 6). For DSM 5749 this sequence is not published in the
GenBank. Therefore a match of 100% was not found.
gi|56160984|gb|CP000002.2| Bacillus licheniformis ATCC 14580, complete genome Length=4222334 Features in this part of subject sequence: rRNA-23S ribosomal RNA rRNA-16S ribosomal RNA Score = 852 bits (430), Expect = 0.0 Identities = 442/446 (99%), Gaps = 0/446 (0%) Strand=Plus/Minus Query 77 CTAGTAATCGCGGATCAGCATGCCGCGGTGAATACGTTCCCGGGCCTTGTACACACCGCC 136 |||||||||||||||||||||||||||||||||||||||||||||||||||||||||||| Sbjct 3121633 CTAGTAATCGCGGATCAGCATGCCGCGGTGAATACGTTCCCGGGCCTTGTACACACCGCC 3121574 Query 137 CGTCACACCACGAGAGTTTGTAACACCCGAAGTCGGTGAGGTAACCTTTTGGAGCCAGCC 196 |||||||||||||||||||||||||||||||||||||||||||||||||||||||||||| Sbjct 3121573 CGTCACACCACGAGAGTTTGTAACACCCGAAGTCGGTGAGGTAACCTTTTGGAGCCAGCC 3121514 Query 197 GCCGAAGGTGGGACAGATGATTGGGGTGAAGTCGTAACAAGGTAGCCGTATCGGAAGGTG 256 |||||||||||||||||||||||||||||||||||||||||||||||||||||||||||| Sbjct 3121513 GCCGAAGGTGGGACAGATGATTGGGGTGAAGTCGTAACAAGGTAGCCGTATCGGAAGGTG 3121454 Query 257 CGGCTGGATCACCTCCTTTCTAAGGATATTATACGGAATATAAGACCTTGCGGTCTTATA 316 |||||||||||||||||||||||||||||||||||||||||||||||||||||||||||| Sbjct 3121453 CGGCTGGATCACCTCCTTTCTAAGGATATTATACGGAATATAAGACCTTGCGGTCTTATA 3121394 Query 317 GACAGGTACGTTTAGATCTTGTTTAGTTTTGAAGGATCATTCCTTCAAAGCGTGTTCTTT 376 ||||||| ||||| |||||||||||||||||||||||||||||||||||||||||||||| Sbjct 3121393 GACAGGTGCGTTTGGATCTTGTTTAGTTTTGAAGGATCATTCCTTCAAAGCGTGTTCTTT 3121334 Query 377 GAAAACTAGATAACAGTAGACATCACATTCAATTCGTAATGCAAGATATCACGTAGTGAT 436 |||||||||||||||||||||||||||||||||| ||||||||||||||||||||||||| Sbjct 3121333 GAAAACTAGATAACAGTAGACATCACATTCAATTAGTAATGCAAGATATCACGTAGTGAT 3121274 Query 437 TCTTTTTAACGGTTAAGTTAGAAAGGGCGCACGGTGGATGCCTTGGCACTAGGAGCCGAT 496 |||||||||||||||||||||||||||||||||||||||||||||||||||||||||||| Sbjct 3121273 TCTTTTTAACGGTTAAGTTAGAAAGGGCGCACGGTGGATGCCTTGGCACTAGGAGCCGAT 3121214 Query 497 GAAGGACGGGACTAACACCGATATGC 522 |||||||||||| ||||||||||||| Sbjct 3121213 GAAGGACGGGACGAACACCGATATGC 3121188 Figure 6. Comparison of the homology of the nucleotide sequences of the 3' end of the 16S rDNA and the 16S–23S ITS obtained from IRMM-311 (Query) with the reported DNA sequence of the complete genome of Bacillus licheniformis ATCC 14580 in Genebank (accession no. CP000002), using nucleotide-nucleotide BLAST (blastn) on www.ncbi.nlm.nih.gov. Primers sites L516SF and L523SR are highlighted.

19
9 Metrological traceability
The obtained sequence of Pulse Marker showed 100 % homology with the λ
sequence (J02459). No part was missing, no part was added and no repetitions were
observed (Figure 7). We conclude that the marker consists of full λ concatamers.
Therefore the fragment length of the SfiI digested DNA fragments is traceable to
intact λ DNA (isolated from the bacteriophage λ cI857 ind1 Sam7). A. ATTTGACGTGGTTTGATGGCCTCCACGCACGTTGTGATATGTAGATGATAATCATTATCACTTTACGGGTCCTTTCCGGTGATCCGACAGGTTACGGGGCGGCGACCTCGCGGGTTTTCGCTATTTATGAAAATTTTCCGGTTTAAGGCGTTTCCGTTCTTCTTCGTCATAACTTAATGTTTTTATTTAAAATACCCTCTGAAAAGAAAGGAAACG
B.
Score = 231 bits (120), Expect = 1e-57 Identities = 120/120 (100%), Gaps = 0/120 (0%) Strand=Plus/Plus Query 97 GGGCGGCGACCTCGCGGGTTTTCGCTATTTATGAAAATTTTCCGGTTTAAGGCGTTTCCG 156 |||||||||||||||||||||||||||||||||||||||||||||||||||||||||||| Sbjct 1 GGGCGGCGACCTCGCGGGTTTTCGCTATTTATGAAAATTTTCCGGTTTAAGGCGTTTCCG 60 Query 157 TTCTTCTTCGTCATAACTTAATGTTTTTATTTAAAATACCCTCTGAAAAGAAAGGAAACG 216 |||||||||||||||||||||||||||||||||||||||||||||||||||||||||||| Sbjct 61 TTCTTCTTCGTCATAACTTAATGTTTTTATTTAAAATACCCTCTGAAAAGAAAGGAAACG 120 Score = 185 bits (96), Expect = 7e-44 Identities = 96/96 (100%), Gaps = 0/96 (0%) Strand=Plus/Plus Query 1 ATTTGACGTGGTTTGATGGCCTCCACGCACGTTGTGATATGTAGATGATAATCATTATCA 60 |||||||||||||||||||||||||||||||||||||||||||||||||||||||||||| Sbjct 48407 ATTTGACGTGGTTTGATGGCCTCCACGCACGTTGTGATATGTAGATGATAATCATTATCA 48466 Query 61 CTTTACGGGTCCTTTCCGGTGATCCGACAGGTTACG 96 |||||||||||||||||||||||||||||||||||| Sbjct 48467 CTTTACGGGTCCTTTCCGGTGATCCGACAGGTTACG 48502 Figure. 7 A. Nucleotide sequence of Pulse Marker D 2291 obtained with M13 primers on an ABI Prism® 3130xl Genetic Analyser. The highlighted part is the start of the second λ molecule. B. Comparison of sequence identities between obtained sequence (A.) and λ sequence (J02459).
The identity of the IRMM-311 has been confirmed by dye terminator cycle
sequencing of the nucleotide sequences of the 3' end of the 16S rDNA and the 16S–
23S internal transcribed spacer (ITS) [9].

20
10 Certified value and uncertainty
The certified properties of IRMM-311 are the fragment lengths [kb] of 10 DNA fragments
in a PFGE pattern as determined by each of five laboratories. The certified value for
each band is the mean fragment length calculated from the means obtained by five
different laboratories (Table 6). The PFGE pattern was obtained by SfiI digestion of
gDNA of Bacillus licheniformis DSM 5749 in agarose inserts (Figure 8). The obtained
band pattern of an unknown sample should always be compared to that of the
reference material on the same agarose gel, considering all SfiI fragments in size
between 50 kb and 90 kb. Uncertainties for the certified values were taken as the half-
width of the 95 % confidence interval of the mean. Table 6. Unweighted mean of the means of five accepted sets of results, obtained by a SfiI digest of gDNA of Bacillus licheniformis DSM 5749. IRMM-311: Bacillus licheniformis DSM 5749
Certified value (kb) Uncertainty (kb) 89.6 4.7 80.9 2.5 75.3 2.7 72.2 3.5 66.9 1.9 64.6 2.9 60.3 1.3 56.5 1.3 53.9 1.3 50.6 1.3
Figure 8. PFGE pattern of a SfiI digest of gDNA of Bacillus licheniformis DSM 5749 in agarose inserts when analysed according to a specified procedure (see section 11). Restriction bands between 50 kb and 90 kb are marked from 1 to 10.
10987654321
9.4 kb
23.1 kb
97.0 kb
194.0 kb 145.5 kb
48.5 kb
Marker IRMM-311
21
11 Instructions for use 11.1 Dispatch Dispatch to the customer shall be done at 4 °C (use of cooling elements). Upon
receipt by the customer, the material should be stored at 4 °C until use.
11.2 Handling and intended use This CRM is intended to be used for the taxonomic identification of the authorised
probiotic feed additive Bacillus licheniformis DSM 5749 by PFGE.
Molecular biology grade (sterile, DNase-, RNase-free) consumables and
biochemicals shall be used in all procedures.
11.2.1 Digestion of agarose inserts with SfiI restriction enzyme - Transfer the agarose insert of IRMM-311 to a 1.5 mL tube containing 1 mL 10
mmol/L Tris-HCl buffer (pH 7.6) and incubate 30 min at room temperature.
- Remove the solution and add another 1 mL 10 mmol/L Tris-HCl buffer (pH 7.6),
incubate again 30 min at room temperature.
- Remove solution without destroying the plug.
- Incubate insert two times 30 min at room temperature in 0.5 mL RE buffer for SfiI
(use RE and appropriate buffer from manufacturer of choice). Renew restriction
buffer in between.
- Remove restriction buffer.
- Add to each insert: 30 μL 10 × concentrated RE buffer for SfiI, 30 U SfiI and add
H2O to a final volume of 300 μL.
- Incubate at 50 °C for 15 -17 h.
- Remove solution carefully, add 1 mL of ES solution (0.5 M EDTA pH 8.0, 1 % (w/v)
sodium lauryl sarcosine).
- Incubate overnight at 50 °C.
- Remove solution, add 250 μL ESP (ES containing proteinase K at 1 mg/mL).
- Incubate 2 h at 50 °C.
- Dilute Tris-Borate-EDTA (TBE) buffer (89 mmol/L Tris-borate, 2 mmol/L EDTA, pH
8.3), e.g. Sigma T7527, with distilled water in a volume ratio 1:3 (buffer:water).
- Remove solution, add 1 mL diluted TBE buffer and incubate 1 h at room
temperature. Inserts can be kept in this solution for several days at 4 °C.
- Take a 1 mm slice of agarose inserts of each of the PFGE standards D2291 and
D2416 and incubate in 1 mL diluted TBE for 1 h at room temperature.
22
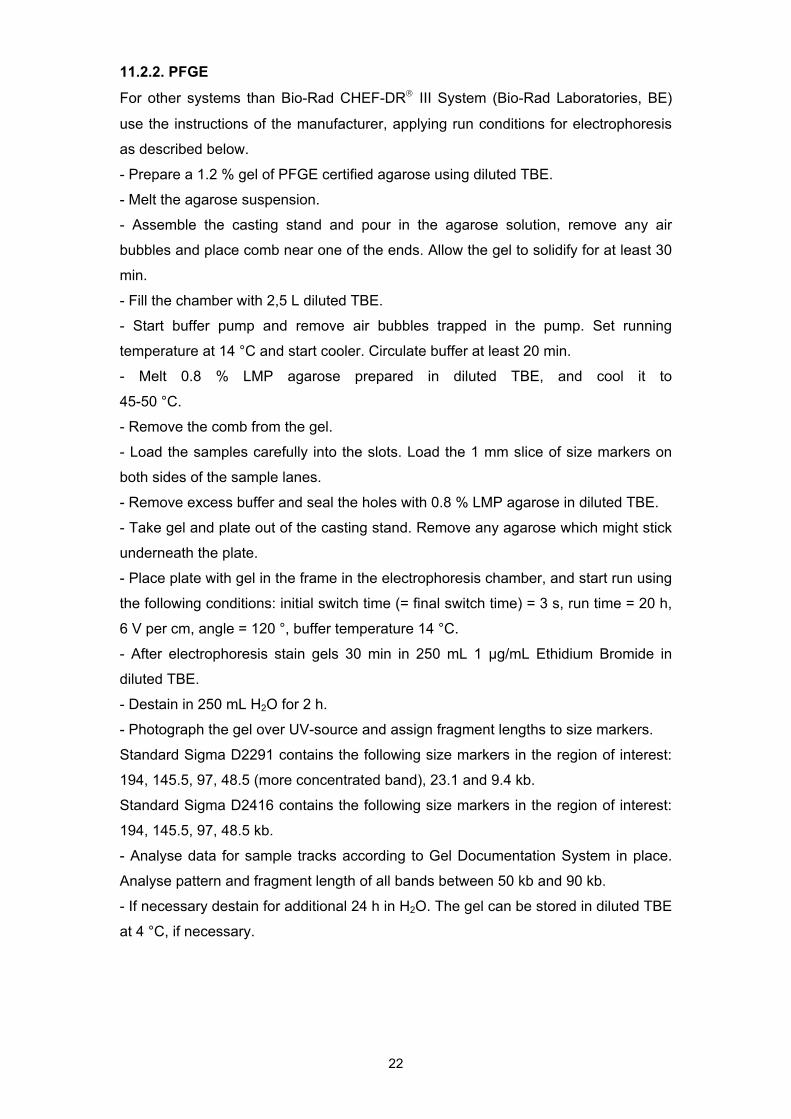
11.2.2. PFGE
For other systems than Bio-Rad CHEF-DR® III System (Bio-Rad Laboratories, BE)
use the instructions of the manufacturer, applying run conditions for electrophoresis
as described below.
- Prepare a 1.2 % gel of PFGE certified agarose using diluted TBE.
- Melt the agarose suspension.
- Assemble the casting stand and pour in the agarose solution, remove any air
bubbles and place comb near one of the ends. Allow the gel to solidify for at least 30
min.
- Fill the chamber with 2,5 L diluted TBE.
- Start buffer pump and remove air bubbles trapped in the pump. Set running
temperature at 14 °C and start cooler. Circulate buffer at least 20 min.
- Melt 0.8 % LMP agarose prepared in diluted TBE, and cool it to
45-50 °C.
- Remove the comb from the gel.
- Load the samples carefully into the slots. Load the 1 mm slice of size markers on
both sides of the sample lanes.
- Remove excess buffer and seal the holes with 0.8 % LMP agarose in diluted TBE.
- Take gel and plate out of the casting stand. Remove any agarose which might stick
underneath the plate.
- Place plate with gel in the frame in the electrophoresis chamber, and start run using
the following conditions: initial switch time (= final switch time) = 3 s, run time = 20 h,
6 V per cm, angle = 120 °, buffer temperature 14 °C.
- After electrophoresis stain gels 30 min in 250 mL 1 μg/mL Ethidium Bromide in
diluted TBE.
- Destain in 250 mL H2O for 2 h.
- Photograph the gel over UV-source and assign fragment lengths to size markers.
Standard Sigma D2291 contains the following size markers in the region of interest:
194, 145.5, 97, 48.5 (more concentrated band), 23.1 and 9.4 kb.
Standard Sigma D2416 contains the following size markers in the region of interest:
194, 145.5, 97, 48.5 kb.
- Analyse data for sample tracks according to Gel Documentation System in place.
Analyse pattern and fragment length of all bands between 50 kb and 90 kb.
- If necessary destain for additional 24 h in H2O. The gel can be stored in diluted TBE
at 4 °C, if necessary.

23
12 References
[1] Commission Regulation (EC) No 2148/2004 of 16 December 2004 concerning
the permanent and provisional authorisations of certain additives and the
authorisation of new uses of an additive already authorised in feedingstuffs. Off. J.
Eur. Commun. L 370 (2004), 24
[2] Olive, D.M., Bean, P. (1999) Principles and Applications of Methods for DNA-
Based Typing of Microbial Organisms. J. Clin. Microbiol. 37, 1661–1669.
[3] Tenover, F.C., Arbeit R.D., Goering R.V., Mickelsen P.A., Murray B.E., Persing
D.H., Swaminathan, B. (1995) Interpreting chromosomal DNA restriction patterns
produced by pulsed-field gel electrophoresis: criteria for bacterial strain typing. J.
Clin. Microbiol. 33 (9), 2233-2239
[4] ISO Guide 34: 2000, General requirements for the competence of reference
material producers. Organization for International Standardization, Genève.
[5] van der Veen, A.M.H., Linsinger, T.P.J., Pauwels, J. (2001) Uncertainty
calculations in the certification of reference materials. 2. Homogeneity study. Accred.
Qual. Assur. 6, 26-30.
[6] van der Veen, A.M.H., Linsinger, T.P.J., Lamberty, A., Pauwels, J. (2001)
Uncertainty calculations in the certification of reference materials. 3. Stability study.
Accred. Qual. Assur. 6, 257-263.
[7] van der Veen, A.M.H., Linsinger, T.P.J., Schimmel, H., Lamberty, A., Pauwels,
J. (2001) Uncertainty calculations in the certification of reference materials 4.
Characterisation and certification. Accred. Qual. Assur. 6, 290-294.
[8] Sambrook, J. , Fritsch, E.F., Maniatis, T. (1989) Molecular Cloning: A
Laboratory Manual. Cold Spring Harbor Laboratory Press, 2nd edition.
[9] Xu, D., Côte, J-C. (2003) Phylogenetic relationships between Bacillus species
and related genera inferred from comparison of 3' end 16S rDNA and 5' end 16S–
23S ITS nucleotide sequences. IJSEM, 53, 695–704.
[10] CEQ 8000 Series – DTCS chemistry protocol.
http://www.beckmancoulter.com/
Literature/BioResearch/390003ac.pdf. Beckman Coulter, Inc. (2003).
[11] Galvin, N.M., Clark, M.W., Reddy, M.P. (1998) CEQ™ 2000 DNA Analysis
System Performance, Beckman Coulter, Inc.

24
Acknowledgements
The authors would like to thank R. Zeleny and W. Broothaerts (IRMM) for reviewing
the certification report, as well as the experts of the Certification Advisory Panel
'Biological Macromolecules and Biological/Biochemical Parameters', R. Dybkaer
(Frederiksberg Hospital, DK), E. Jansen (National Institute of Public Health and the
Environment, NL) and U. Örnemark (LGC Promochem, SE) for their critical
comments.

25
Annex 1: IRMM-311 batch characterisation – results received from five laboratories Laboratory A 1. D2291 marker
2. IRMM-311 # 0021
3. IRMM-311 # 0060
4. D2416 marker
1 2 3 4
97 kb-
48.5 kb-
23.1 kb-
145.5 kb-
9.4 kb-
194 kb- - 194 kb - 145.5 kb
- 97 kb
- 48.5 kb

26
Laboratory B 1. In house Marker
2. D2291 marker
3. D2416 marker
4. D2291 marker
5. IRMM-311 # 0085
6. IRMM-311 # 0109
7. D2416 marker
1 2 3 4 5 6 7
194 kb- 145.5 kb-
97 kb-
48.5 kb-
23.1 kb-
- 194 kb - 145.5 kb
- 97 kb
- 48.5 kb
27
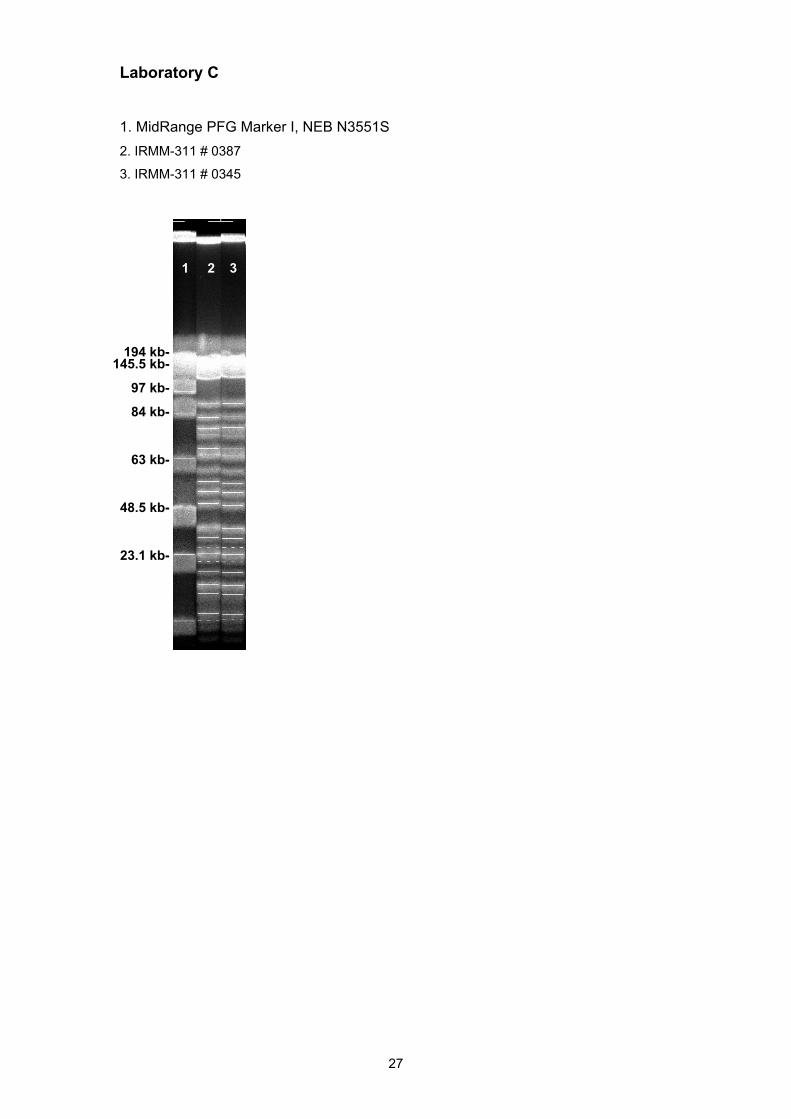
Laboratory C 1. MidRange PFG Marker I, NEB N3551S 2. IRMM-311 # 0387
3. IRMM-311 # 0345
1 2 3
194 kb- 145.5 kb-
97 kb-
84 kb-
63 kb-
48.5 kb-
23.1 kb-
28
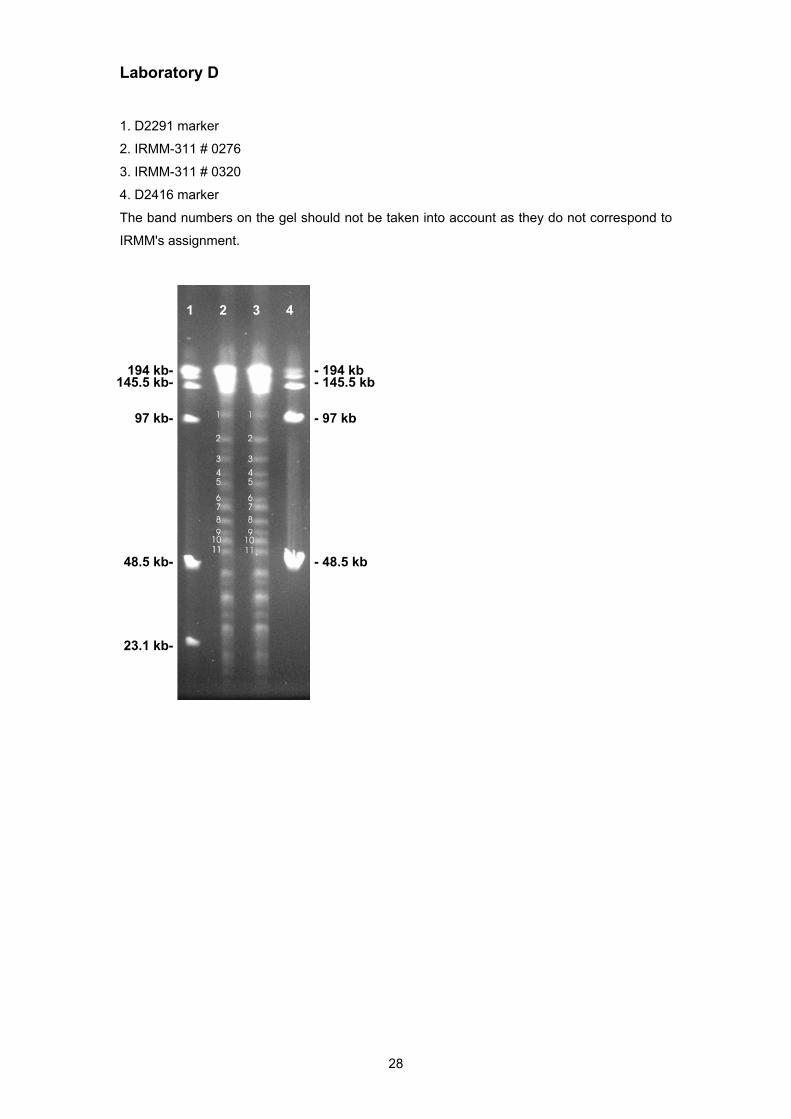
Laboratory D 1. D2291 marker
2. IRMM-311 # 0276
3. IRMM-311 # 0320
4. D2416 marker The band numbers on the gel should not be taken into account as they do not correspond to
IRMM's assignment.
1 2 3 4
145.5 kb-
97 kb-
48.5 kb-
23.1 kb-
194 kb-
- 48.5 kb
- 97 kb
- 145.5 kb - 194 kb

29
Laboratory E 1. D2291 marker
2. IRMM-311 # 0159
3. IRMM-311 # 0250
4. D2416 marker
1 2 3 4
23.1 kb-
48.5 kb-
97 kb- 145.5 kb-
194 kb- - 194 kb - 145.5 kb - 97 kb
- 48.5 kb
European Commission EUR 23371 EN – Joint Research Centre – Institute for Reference Materials and Measurements Title: Certification of a reference material consisting of genomic DNA inserts of Bacillus licheniformis DSM 5749 for PFGE, IRMM-311 Authors: N. Meeus, L. De Baets, P. van Iwaarden, W. Philipp, H. Schimmel Luxembourg: Office for Official Publications of the European Communities 2008 – 29 pp. – 21.0 x 29.7 cm EUR – Scientific and Technical Research series – ISSN 1018-5593 ISBN 978-92-79-09025-7 DOI 10.2787/51728 Abstract This report describes the production and certification of IRMM-311, a reference material of genomic DNA (gDNA) of Bacillus licheniformis DSM 5749 in agarose inserts. This CRM (IRMM-311) is intended to be used for the taxonomic identification of authorised probiotic feed additives by Pulsed Field Gel Electrophoresis (PFGE). The homogeneity and stability of the batch was assessed by monitoring the PFGE pattern of a SfiI restriction enzyme digest of gDNA of Bacillus licheniformis DSM 5749 in agarose inserts. The batch was found to be homogeneous and the material is stable at 4 °C. The batch was characterised by five laboratories determining the PFGE pattern of a SfiI restriction enzyme digest of IRMM-311. The pattern should be considered as a whole and restriction fragments in the size range from 50 kb to 90 kb are certified for their fragment length. DNA sequence analysis of the 3' end of the 16S rRNA gene and the entire 16S-23S internal transcribed spacer (ITS) coding region confirmed the identity of the strain as Bacillus licheniformis. Each vial contains one agarose insert containing gDNA of Bacillus licheniformis DSM 5749.

How to obtain EU publications Our priced publications are available from EU Bookshop (http://bookshop.europa.eu), where you can place an order with the sales agent of your choice. The Publications Office has a worldwide network of sales agents. You can obtain their contact details by sending a fax to (352) 29 29-42758.

The mission of the JRC is to provide customer-driven scientific and technical support for the conception, development, implementation and monitoring of EU policies. As a service of the European Commission, the JRC functions as a reference centre of science and technology for the Union. Close to the policy-making process, it serves the common interest of the Member States, while being independent of special interests, whether private or national.
LA
-NA
-23371-EN-C


![Michigan Pediatric Adolescent Interdisciplinary Network · 2018. 10. 13. · diseases/amplified-musculoskeletal-pain-syndrome-amps [4] Meeus, M., & Nijs, J (2007). Central sensitization:](https://static.fdocuments.in/doc/165x107/5fec9506a0dab57aa128cc5f/michigan-pediatric-adolescent-interdisciplinary-network-2018-10-13-diseasesamplified-musculoskeletal-pain-syndrome-amps.jpg)


