Certain Frozen Fish Fillets from Vietnam - USITC · certain frozen fish fillets from Vietnam would...
53
U.S. International Trade Commission Publication 4498 October 2014 Washington, DC 20436 Certain Frozen Fish Fillets from Vietnam Investigation No. 731-TA-1012 (Second Review)
Transcript of Certain Frozen Fish Fillets from Vietnam - USITC · certain frozen fish fillets from Vietnam would...
U.S. International Trade CommissionPublication 4498 October 2014
Washington, DC 20436
Certain Frozen Fish Fillets from VietnamInvestigation No. 731-TA-1012 (Second Review)
U.S. International Trade Commission
COMMISSIONERS
Meredith M. Broadbent, Chairman Dean A. Pinkert, Vice Chairman
Irving A. Williamson David S. Johanson
F. Scott Kieff Rhonda K. Schmidtlein
Karen Laney
Staff assigned
Address all communications to Secretary to the Commission
United States International Trade Commission Washington, DC 20436
Acting Director of Operations
David Thirkill, Investigator-Intern Renee Berry, Commodity-Industry Analyst
Carolyn Holmes, Statistical Assistant Charles St. Charles, Attorney Advisor
Christopher Cassise, Supervisory Investigator
U.S. International Trade CommissionWashington, DC 20436
www.usitc.gov
Publication 4498 October 2014
Certain Frozen Fish Fillets from VietnamInvestigation No. 731-TA-1012 (Second Review)

CONTENTS Page
i
Determination ................................................................................................................................. 1
Views of the Commission ............................................................................................................... 3
Information obtained in the review ....................................................................................... I‐1
Introduction ............................................................................................................................... I‐1
Background ............................................................................................................................ I‐1
The original investigation ...................................................................................................... I‐2
First five‐year review ............................................................................................................. I‐2
Commerce’s final results of expedited second five‐year review .......................................... I‐3
Previous and related title VII investigations .......................................................................... I‐3
The product ............................................................................................................................... I‐3
Commerce’s scope ................................................................................................................ I‐3
U.S. tariff treatment .............................................................................................................. I‐4
Domestic like product and domestic industry ...................................................................... I‐4
Physical characteristics and uses ........................................................................................... I‐6
Production process ................................................................................................................ I‐6
Interchangeability and customer and producer perceptions ............................................... I‐7
Channels of distribution ........................................................................................................ I‐9
Pricing and related information ............................................................................................ I‐9
The industry in the United States ........................................................................................... I‐10
U.S. producers ..................................................................................................................... I‐10
U.S. producers’ trade and financial data ............................................................................. I‐11
U.S. imports and apparent U.S. consumption ......................................................................... I‐12
U.S. imports ......................................................................................................................... I‐13
Apparent U.S. consumption and market shares ................................................................. I‐14
The industry in Vietnam .......................................................................................................... I‐15
Tariff or non‐tariff barriers to trade .................................................................................... I‐17
CONTENTS Page
ii
Appendixes
A. Statement of adequacy .................................................................................................... A‐1 B. Summary data from the original investigation and first five‐year review ....................... B‐1
Note.—Information that would reveal confidential operations of individual concerns may not
be published and therefore has been deleted. Such deletions are indicated by asterisks.
UNITED STATES INTERNATIONAL TRADE COMMISSION
Investigation No. 731‐TA‐1012 (Second Review)
CERTAIN FROZEN FISH FILLETS FROM VIETNAM
DETERMINATION
On the basis of the record1 developed in the subject five‐year review, the United States International Trade Commission (“Commission”) determines, pursuant to section 751(c) of the Tariff Act of 1930 (19 U.S.C. ' 1675(c)), that revocation of the antidumping duty order on certain frozen fish fillets from Vietnam would be likely to lead to continuation or recurrence of material injury to an industry in the United States within a reasonably foreseeable time.
BACKGROUND
The Commission instituted this review on June 2, 2014 (79 FR 31345) and determined on September 5, 2014, that it would conduct an expedited review (79 FR 56826).
1 The record is defined in sec. 207.2(f) of the Commission=s Rules of Practice and Procedure
(19 CFR ' 207.2(f)).

3
VIEWS OF THE COMMISSION
Based on the record in this five‐year review, we determine under section 751(c) of the Tariff Act of 1930, as amended (“the Tariff Act”), that revocation of the antidumping duty order on certain frozen fish fillets from Vietnam would likely lead to continuation or recurrence of material injury to an industry in the United States within a reasonably foreseeable time.
Background I.
The original investigation was instituted in response to an antidumping petition filed on June 28, 2002, by the Catfish Farmers of America, a trade association of catfish farmers and processors, and individual catfish processors.1 In August 2003, the Commission determined that an industry in the United States was materially injured by reason of imports of certain frozen fish fillets from Vietnam sold in the United States at less than fair value (“LTFV”).2 Commerce issued an antidumping duty order on imports of certain frozen fish fillets from Vietnam on August 12, 2003.3
On July 1, 2008, the Commission instituted the first five‐year review concerning certain frozen fish fillets from Vietnam.4 It conducted a full review based on an adequate domestic interested party group response and an adequate respondent interested party group response.5 Only the domestic parties, however, filed briefs with the Commission and appeared at the Commission's hearing. In June 2009, the Commission made an affirmative determination.6 Commerce subsequently issued a notice continuing the order.7
The Commission instituted this review on June 2, 2014.8 The Commission received a joint response to its notice of institution from domestic parties.9 The Commission also received a partial response from the Vietnamese Association of Seafood Exporters and Producers (VASEP).10 VASEP declined the opportunity to complete the response and cure deficiencies.11
1 Certain Frozen Fish Fillets from Vietnam, Inv. No. 731‐TA‐1012 (Final), USITC Pub. 3617 (Aug.
2003) (“Original Determination, USITC Pub. 3617”) at I‐1. 2 Original Determination, USITC Pub. 3617 at 3. 3 Notice of Antidumping Duty Order: Certain Frozen Fish Fillets from the Socialist Republic of
Vietnam, 68 Fed. Reg. 47909 (Aug. 12, 2003). 4 Certain Frozen Fish Fillets from Vietnam, 73 Fed. Reg. 37487 (Jul. 1, 2008). 5 See Certain Frozen Fish Fillets from Vietnam, Inv. No. 731‐TA‐1012, USITC Pub. 4083 (June
2009) (“First Review Determination, USITC Pub. 4083”) at Appendix A (Explanation of Commission Determination on Adequacy).
6 See First Review Determination, USITC Pub. 4083 at 3. 7 74 Fed. Reg. 33208 (Jul. 10, 2009). 8 Certain Frozen Fish Fillets from Vietnam: Institution of a Five‐Year Review, 79 Fed. Reg. 32345
(Jun. 2, 2014). 9 Domestic Parties’ Response to Notice of Institution (Jul. 2, 2014). Domestic parties identified
eleven U.S. catfish processors in addition to the six that responded to the notice of institution. Id. at Exhibit 3.
10 VASEP’s Response to Notice of Institution (Jul. 2, 2014). 11 See Commission Cure Letter (Jul. 7, 2014), VASEP’s Response to Cure Letter (Jul. 16, 2014).
4
Because the Commission received an adequate response from domestic interested parties accounting for a substantial share of U.S. production of frozen catfish fillets, the Commission determined that the domestic interested party group response was adequate.12 The Commission determined that VASEP’s response and the respondent interested party group response were inadequate.13 In the absence of an adequate respondent interested party group response, or any other circumstances that would warrant a full review, the Commission unanimously determined to conduct an expedited review of the subject order.14
Domestic Like Product and Industry II.
A. Domestic Like Product
In making its determination under section 751(c) of the Tariff Act, the Commission defines the “domestic like product” and the “industry.”15 The Tariff Act defines “domestic like product” as “a product which is like, or in the absence of like, most similar in characteristics and uses with, the article subject to an investigation under this subtitle.”16 The Commission’s practice in five‐year reviews is to examine the domestic like product definition from the original investigation and consider whether the record indicates any reason to revisit the prior findings.17
Commerce has defined the scope of the antidumping duty order under review as follows:
The product covered by the order is frozen fish fillets, including regular,
shank, and strip fillets and portions thereof, whether or not breaded or marinated, of the species Pangasius Bocourti, Pangasius Hypophthalmus (also known as Pangasius Pangasius), and Pangasius Micronemus.
Frozen fish fillets are lengthwise cuts of whole fish. The fillet products covered by the scope include boneless fillets with the belly flap intact (“regular” fillets), boneless fillets with the belly flap removed (“shank” fillets), boneless shank fillets cut into strips (“fillets strips/finger”), which include fillets cut into strips, chunks, blocks, skewers, or any other shape.
12 79 Fed. Reg. 56826 (Sep. 28, 2014). 13 Id. 14 Id. 15 19 U.S.C. § 1677(4)(A). 16 19 U.S.C. § 1677(10); see, e.g., Cleo Inc. v. United States, 501 F.3d 1291, 1299 (Fed. Cir. 2007);
NEC Corp. v. Department of Commerce, 36 F. Supp. 2d 380, 383 (Ct. Int’l Trade 1998); Nippon Steel Corp. v. United States, 19 CIT 450, 455 (1995); Timken Co. v. United States, 913 F. Supp. 580, 584 (Ct. Int’l Trade 1996); Torrington Co. v. United States, 747 F. Supp. 744, 748‐49 (Ct. Int’l Trade 1990), aff’d, 938 F.2d 1278 (Fed. Cir. 1991); see also S. Rep. No. 249, 96th Cong., 1st Sess. 90‐91 (1979).
17 See, e.g., Internal Combustion Industrial Forklift Trucks from Japan, Inv. No. 731‐TA‐377 (Second Review), USITC Pub. 3831 at 8‐9 (Dec. 2005); Crawfish Tail Meat from China, Inv. No. 731‐TA‐752 (Review), USITC Pub. 3614 at 4 (July 2003); Steel Concrete Reinforcing Bar from Turkey, Inv. No. 731‐TA‐745 (Review), USITC Pub. 3577 at 4 (Feb. 2003).
5
Specifically excluded from the scope are frozen whole fish (whether or not dressed), frozen steaks, and frozen belly‐flap nuggets. Frozen whole dressed fish are deheaded, skinned, and eviscerated. Steaks are bone‐in, cross‐section cuts of dressed fish. Nuggets are the belly‐flaps.
The subject merchandise will be hereinafter referred to as frozen “basa” and “tra” fillets, which are the Vietnamese common names for these species of fish.18 In the original investigation, the Commission found that the basa and tra species from which
frozen fish fillets from Vietnam were produced were not raised in the United States. In the absence of a domestic article that was “like” the subject imports, the Commission found that the domestic article “most similar in characteristics and uses” with the subject imports was frozen fillets of catfish, of the family Ictaluridae.19 The Commission explained that subject basa and tra and domestic catfish were all freshwater white fish, with similar 6‐month shelf lives when frozen, similar texture, and a neutral/mild flavor. Further, it found that frozen fillets of basa, tra, and domestic catfish were typically individually quick frozen, packaged in 15‐pound boxes, and sold in the same size increments, primarily to the food service industry and secondarily to restaurants.20 The Commission observed, moreover, that frozen basa and tra fillets from Vietnam had been widely marketed, sold, and even labeled in the United States during the period of investigation as frozen “catfish” fillets under product names that were similar to U.S. catfish producers’ products or that implied domestic origin.21 For
18 Expedited Second Sunset Review of the Antidumping Duty Order on Certain Frozen Fish Fillets
from the Socialist Republic of Vietnam: Issues and Decision Memorandum, U.S. Department of Commerce (Sep. 29, 2014) (“Commerce Issues and Decision Memorandum”) at 2. These products are classifiable the under the Harmonized Tariff Schedule of the United States statistical reporting numbers 0304.29.6033, 0304.62.0020, 0305.59.0000, 0305.59.4000, 1604.19.2000, 1604.19.2100, 1604.19.3000, 1604.19.3100, 1604.19.4000, 1604.19.4100, 1604.19.5000, 1604.19.5100, 1604.19.6100 and 1604.19.8100 of. Id.
19 Original Determination, USITC Pub. 3617 at 5; see also 19 U.S.C. § 1677(10), S. Rep. No. 249, 96th Cong., 1st Sess. 90‐91 (1979).
20 Original Determination, USITC Pub. 3617 at 5. 21 Original Determination, USITC Pub. 3617 at 5‐6. In 2001 and 2002, legislation intended to
prohibit this practice was enacted. The Commission noted that section 755 of the Agriculture, Rural Development, Food and Drug Administration, and Related Agencies Appropriations Act of 2002 provided that, effective November 28, 2001, “{n}one of the funds appropriated or otherwise made available by this Act to the Food and Drug Administration shall be used to allow admission of fish or fish products labeled wholly or in part as ‘catfish’ unless the products are taxonomically from the family Ictaluridae.” That Act also required, as of September 30, 2004, that a retailer of farm‐raised fish (among other agricultural products) “shall inform consumers, at the final point of sale of the covered commodity to consumers, of the country of origin of the covered commodity,” but exempted food service establishments. State labeling laws were also in effect in Mississippi, Louisiana, and Arkansas. Original Determination, USITC Pub. 3617 at 6 n.19. The Commission also noted that it included catfish fillets that were breaded and marinated in the definition of the domestic like product, citing similarities with plain frozen catfish fillets in terms of physical characteristics and uses, channels of distribution, production processes and employees, and price. Original Determination, USITC Pub. 3617 at 6 n.20.
6
these reasons, the Commission defined the domestic like product as frozen catfish fillets, whether or not breaded or marinated.22
In the first five‐year review of the order, the domestic parties indicated that they agreed with the Commission’s definition of the domestic like product in the original investigation. Moreover, the Commission found that there was no new information obtained during the review that would suggest any reason to revisit the Commission’s domestic like product definition from the original investigation. Therefore, consistent with its domestic like product definition in the original investigation, the Commission defined the domestic like product as frozen catfish fillets, whether plain, breaded, or marinated.23
In this five‐year review, the domestic parties indicate that they agree with the definition of the domestic like product adopted by the Commission in the original investigation and the first review.24 There is no new information in the record indicating that the characteristics of the product at issue have changed since the prior proceedings.25 Accordingly, we again define the domestic like product as frozen catfish fillets, whether plain, breaded, or marinated.
B. Domestic Industry
Section 771(4)(A) of the Tariff Act defines the relevant industry as the domestic “producers as a whole of a domestic like product, or those producers whose collective output of a domestic like product constitutes a major proportion of the total domestic production of the product.”26 In defining the domestic industry, the Commission’s general practice has been to include in the industry producers of all domestic production of the like product, whether toll‐produced, captively consumed, or sold in the domestic merchant market. In the original investigation and the first five‐year review, the Commission defined a single domestic industry consisting of processing operations producing frozen catfish fillets, whether plain, breaded, or marinated.27 The Commission also considered whether to include catfish farmers in the domestic industry pursuant to the processed agricultural product provision of the statute.28 In both determinations, the Commission found that, because the raw agricultural product (fresh raw catfish) was not “substantially or completely devoted to the production of the processed agricultural product” (frozen catfish fillets), the statute was not
22 Original Determination, USITC Pub. 3617 at 5. The Commission also found that information on
competition among the subject imports, domestic frozen catfish fillets, and other types of frozen fish fillets, including tilapia, did not indicate that including other types of frozen fish fillets in the definition of the domestic like product would be appropriate. Original Determination, USITC Pub. 3617 at 6 n.21.
23 First Review Determination, USITC Pub. 4083 at 6. 24 Domestic Parties’ Comments at 7. 25 See generally Confidential Staff Report (“CR”) at 4‐14, Public Staff Report (“PR”) at 4‐10. 26 19 U.S.C. § 1677(4)(A). The definitions in 19 U.S.C. § 1677 are applicable to the entire subtitle
containing the antidumping and countervailing duty laws, including 19 U.S.C. §§ 1675 and 1675a. See 19 U.S.C. § 1677.
27 Original Determination, USITC Pub. 3617 at 9; First Review Determination, USITC Pub. 4083 at 6.
28 Original Determination, USITC Pub. 3617 at 7‐9; First Review Determination, USITC Pub. 4083 at 6; see 19 U.S.C. § 1677(4)(E).
7
satisfied. Therefore, catfish farmers were found not to be part of the industry producing frozen catfish fillets.29 The Commission noted in both determinations, however, that it considered the relationship and interdependence of catfish farmers and processors to be an important condition of competition.30 In this review, domestic parties indicate that they agree with the definition of the domestic industry adopted by the Commission in the original determination and the first review determination.31 Additionally, the information available indicates that a substantial proportion of the fresh catfish farmed in the United States is processed into products other than frozen fillets.32 Therefore, the grower/processor statutory provision is inapplicable to this review for the same reason that it was inapplicable in the prior proceedings.33 Consequently, we again define the domestic industry to include all U.S. processing operations producing frozen catfish fillets, whether plain, breaded, or marinated.34
Revocation of the Antidumping Duty Order Would Likely Lead to III.Continuation or Recurrence of Material Injury Within a Reasonably Foreseeable Time
A. Legal Standards
In a five‐year review conducted under section 751(c) of the Tariff Act, Commerce will revoke an antidumping or countervailing duty order unless: (1) it makes a determination that dumping or subsidization is likely to continue or recur and (2) the Commission makes a determination that revocation of the antidumping or countervailing duty order “would be likely to lead to continuation or recurrence of material injury within a reasonably foreseeable time.”35 The Uruguay Round Agreements Act Statement of Administrative Action (“SAA”) states that “under the likelihood standard, the Commission will engage in a counterfactual analysis; it must decide the likely impact in the reasonably foreseeable future of an important change in the status quo – the revocation or termination of a proceeding and the elimination of its restraining
29 Whereas the statute and its legislative history indicate that all or almost all of the catfish
farmers’ production would have to be devoted to production of frozen catfish fillets for the farmers to be included in the domestic industry, only about one‐half of their fresh raw catfish was devoted to production of frozen catfish fillets, with the remaining portion devoted to products such as fresh fillets, fresh and frozen steaks, and nuggets. Original Determination, USITC Pub. 3617 at 8‐9; First Review Determination, USITC Pub. 4083 at 6 n.27
30 Original Determination, USITC Pub. 3617 at 9; First Review Determination, USITC Pub. 4083 at 6.
31 Domestic Parties’ Comments at 7. 32 CR at 9‐10, PR at 7‐8. 33 Moreover, as in the prior proceedings, we consider the relationship and interdependence of
catfish farmers and processors to be an important condition of competition. 34 There are no related party issues in this review, and there were none in the original
investigation and first review. 35 19 U.S.C. § 1675a(a).
8
effects on volumes and prices of imports.”36 Thus, the likelihood standard is prospective in nature.37 The U.S. Court of International Trade has found that “likely,” as used in the five‐year review provisions of the Tariff Act, means “probable,” and the Commission applies that standard in five‐year reviews.38 The statute states that “the Commission shall consider that the effects of revocation or termination may not be imminent, but may manifest themselves only over a longer period of time.”39 According to the SAA, a “‘reasonably foreseeable time’ will vary from case‐to‐case, but normally will exceed the ‘imminent’ timeframe applicable in a threat of injury analysis in original investigations.”40 Although the standard in a five‐year review is not the same as the standard applied in an original investigation, it contains some of the same fundamental elements. The statute provides that the Commission is to “consider the likely volume, price effect, and impact of imports of the subject merchandise on the industry if the orders are revoked or the suspended investigation is terminated.”41 It directs the Commission to take into account its prior injury determination, whether any improvement in the state of the industry is related to the order or the suspension agreement under review, whether the industry is vulnerable to material injury if the orders are revoked or a suspension agreement is terminated, and any findings by
36 SAA, H.R. Rep. 103‐316, vol. I at 883‐84 (1994). The SAA states that “{t}he likelihood of injury
standard applies regardless of the nature of the Commission’s original determination (material injury, threat of material injury, or material retardation of an industry). Likewise, the standard applies to suspended investigations that were never completed.” Id. at 883.
37 While the SAA states that “a separate determination regarding current material injury is not necessary,” it indicates that “the Commission may consider relevant factors such as current and likely continued depressed shipment levels and current and likely continued {sic} prices for the domestic like product in the U.S. market in making its determination of the likelihood of continuation or recurrence of material injury if the order is revoked.” SAA at 884.
38 See NMB Singapore Ltd. v. United States, 288 F. Supp. 2d 1306, 1352 (Ct. Int’l Trade 2003) (“‘likely’ means probable within the context of 19 U.S.C. § 1675(c) and 19 U.S.C. § 1675a(a)”), aff’d mem., 140 Fed. Appx. 268 (Fed. Cir. 2005); Nippon Steel Corp. v. United States, 26 CIT 1416, 1419 (2002) (same); Usinor Industeel, S.A. v. United States, 26 CIT 1402, 1404 nn.3, 6 (2002) (“more likely than not” standard is “consistent with the court’s opinion;” “the court has not interpreted ‘likely’ to imply any particular degree of ‘certainty’”); Indorama Chemicals (Thailand) Ltd. v. United States, 26 CIT 1059, 1070 (2002) (“standard is based on a likelihood of continuation or recurrence of injury, not a certainty”); Usinor v. United States, 26 CIT 767, 794 (2002) (“‘likely’ is tantamount to ‘probable,’ not merely ‘possible’”).
39 19 U.S.C. § 1675a(a)(5). 40 SAA at 887. Among the factors that the Commission should consider in this regard are “the
fungibility or differentiation within the product in question, the level of substitutability between the imported and domestic products, the channels of distribution used, the methods of contracting (such as spot sales or long‐term contracts), and lead times for delivery of goods, as well as other factors that may only manifest themselves in the longer term, such as planned investment and the shifting of production facilities.” Id.
41 19 U.S.C. § 1675a(a)(1).
9
Commerce regarding duty absorption pursuant to 19 U.S.C. § 1675(a)(4).42 The statute further provides that the presence or absence of any factor that the Commission is required to consider shall not necessarily give decisive guidance with respect to the Commission’s determination.43 In evaluating the likely volume of imports of subject merchandise if the orders under review are revoked and/or a suspended investigation is terminated, the Commission is directed to consider whether the likely volume of imports would be significant either in absolute terms or relative to production or consumption in the United States.44 In doing so, the Commission must consider “all relevant economic factors,” including four enumerated factors: (1) any likely increase in production capacity or existing unused production capacity in the exporting country; (2) existing inventories of the subject merchandise, or likely increases in inventories; (3) the existence of barriers to the importation of the subject merchandise into countries other than the United States; and (4) the potential for product shifting if production facilities in the foreign country, which can be used to produce the subject merchandise, are currently being used to produce other products.45 In evaluating the likely price effects of subject imports if the orders under review are revoked and/or a suspended investigation is terminated, the Commission is directed to consider whether there is likely to be significant underselling by the subject imports as compared to the domestic like product and whether the subject imports are likely to enter the United States at prices that otherwise would have a significant depressing or suppressing effect on the price of the domestic like product.46 In evaluating the likely impact of imports of subject merchandise if the orders under review are revoked and/or a suspended investigation is terminated, the Commission is directed to consider all relevant economic factors that are likely to have a bearing on the state of the industry in the United States, including but not limited to the following: (1) likely declines in output, sales, market share, profits, productivity, return on investments, and utilization of capacity; (2) likely negative effects on cash flow, inventories, employment, wages, growth, ability to raise capital, and investment; and (3) likely negative effects on the existing development and production efforts of the industry, including efforts to develop a derivative or more advanced version of the domestic like product.47 All relevant economic factors are to be considered within the context of the business cycle and the conditions of competition that are distinctive to the industry. As instructed by the statute, we have considered the extent to
42 19 U.S.C. § 1675a(a)(1). In 2009, Commerce made an affirmative finding of duty absorption
with respect to QVD Food and its U.S. affiliate QVD USA, Inc. Certain Frozen Fish Fillets from the Socialist Republic of Vietnam: Final Results of the Antidumping Duty Administrative Review and New Shipper Reviews, 74 Fed. Reg. 11349 (Mar. 17, 2009) (Fourth Administrative Review).
43 19 U.S.C. § 1675a(a)(5). Although the Commission must consider all factors, no one factor is necessarily dispositive. SAA at 886.
44 19 U.S.C. § 1675a(a)(2). 45 19 U.S.C. § 1675a(a)(2)(A‐D). 46 See 19 U.S.C. § 1675a(a)(3). The SAA states that “{c}onsistent with its practice in
investigations, in considering the likely price effects of imports in the event of revocation and termination, the Commission may rely on circumstantial, as well as direct, evidence of the adverse effects of unfairly traded imports on domestic prices.” SAA at 886.
47 19 U.S.C. § 1675a(a)(4).
10
which any improvement in the state of the domestic industry is related to the order under review and whether the industry is vulnerable to material injury upon revocation.48 As noted above, during the adequacy phase of this proceeding, the Commission received only a partial response to the notice of institution from VASEP, which VASEP acknowledged was incomplete and thereafter declined to complete.49 The record, therefore, contains limited new information with respect to the certain frozen fish fillet industry in Vietnam. Accordingly, for our determination, we rely as appropriate on the facts available from the original investigation and prior review, data submitted in the response to the notice of institution, and other public data.
B. Conditions of Competition and the Business Cycle
In evaluating the likely impact of the subject imports on the domestic industry if an order is revoked, the statute directs the Commission to consider all relevant economic factors “within the context of the business cycle and conditions of competition that are distinctive to the affected industry.”50 The following conditions of competition inform our determination. Demand Conditions. In the original investigation, the Commission observed that U.S. demand for frozen fillets of catfish, basa, and tra had increased. Apparent U.S. consumption increased from 148.4 million pounds in 2000 to 184.2 million pounds in 2002, an increase of 24.1 percent.51 In the first five‐year review, apparent U.S. consumption increased irregularly from 161 million pounds in 2003 to 212 million pounds in 2008, an increase of more than 30 percent. This increase reportedly was attributable to such factors as the desire for healthier food, an increase in availability, affordability, and the mild taste of the product.52 In the current review, apparent U.S. consumption was 290 million pounds in 2013, 37 percent higher than in 2008, the end of the first review period.53 Supply Conditions. In the original investigation, the Commission observed that the domestic industry, consisting of 25 processors, was the leading source of supply to the U.S. market and that, as demand continued to increase, the industry’s capacity increased by 12.8 percent from 2000 to 2002.54 The industry’s market share, however, declined from 90.7
48 The SAA states that in assessing whether the domestic industry is vulnerable to injury if the
order is revoked, the Commission “considers, in addition to imports, other factors that may be contributing to overall injury. While these factors, in some cases, may account for the injury to the domestic industry, they may also demonstrate that an industry is facing difficulties from a variety of sources and is vulnerable to dumped or subsidized imports.” SAA at 885.
49 VASEP’s Response to Notice of Institution (Jul. 2, 2014), VASEP’s Response to Cure Letter (Jul. 16, 2014). See also CR/PR at Appendix A.
50 19 U.S.C. § 1675a(a)(4). 51 Original Determination, USITC Pub. 3617 at 10. 52 First Review Determination, USITC Pub. 4083 at 10. 53 CR/PR at Table I‐3. 54 Original Determination, USITC Pub. 3617 at 10.
11
percent in 2000 to 80.1 percent in 2002.55 The Commission stated that, while subject imports were largely absent from the U.S. market prior to 1999, they subsequently became an increasingly significant source of supply.56 Subject imports’ market share increased from 8.4 percent in 2000 to 19.6 percent in 2002.57 Nonsubject imports were consistently less than one percent of apparent U.S. consumption during the period of investigation (POI).58 In the first review, the Commission explained that, despite the continuation of growth in apparent U.S. consumption during the review period, the domestic industry contracted as processors consolidated or went out of business. Four domestic catfish processors ceased operations and another closed several plants during the review period.59 The domestic industry’s market share fell from 87.1 percent in 2003 to 54.1 percent in 2008.60 The Commission observed that processors experienced cost‐side pressures during the review period as the price for live fish increased as a result of reduced supply; there had been a 25 percent reduction from the peak 2002 level in the total acreage dedicated to ponds for raising catfish.61 The Commission also explained that the extent to which processors could lower their costs by paying farmers lower prices for live catfish was limited because several of the processors were owned by catfish farms.62 Subject imports’ market share increased during the first review period from 12.2 percent in 2003 to 25.1 percent in 2008.63 The Commission identified growth in the volume of nonsubject imports, most notably those from China, as a major change in the conditions of competition since the original investigation. Whereas nonsubject imports had accounted for less than one percent of apparent U.S. consumption throughout the original investigation period, they accounted for 20.8 percent in 2008.64 In this review, domestic parties identified 17 current U.S. producers of frozen catfish fillets. They noted that at least three processing facilities have ceased operations since the prior review.65 The domestic industry’s production capacity was 81.5 million pounds in 2013. It accounted for 17.9 percent of apparent U.S. consumption in 2013.66 Subject imports accounted
55 Original Determination, USITC Pub. 3617 at 13. 56 Original Determination, USITC Pub. 3617 at 10. 57 Original Determination, USITC Pub. 3617 at 13. 58 Original Determination, USITC Pub. 3617 at 10. 59 First Review Determination, USITC Pub. 4083 at 11. 60 First Review Determination, USITC Pub. 4083 at 13. 61 First Review Determination, USITC Pub. 4083 at 12. The Commission explained that that some
catfish farmers had reduced or ceased operations because they were unable to increase prices sufficiently to cover the increased feed costs. Id.
62 First Review Determination, USITC Pub. 4083 at 12. 63 First Review Determination, USITC Pub. 4083 at 13. 64 First Review Determination, USITC Pub. 4083 at 12. The Commission noted that the data for
nonsubject imports included not only imports of basa and tra but also imports of catfish, which accounted for most of the imports from China. Id. nn.79, 80. Catfish, however, are not within the scope of the antidumping duty order.
65 CR at 14‐15, PR at 11‐12. 66 CR/PR at Table 1‐4.
12
for the largest share of apparent U.S. consumption in 2013, with a 77.4 percent share.67 Nonsubject imports accounted for 5.7 percent of total imports in 2013 and 4.7 percent of apparent U.S. consumption in that year.68
Substitutability. In the original investigation, the Commission found that the domestic like product and subject imports were interchangeable and were used in the same applications.69 Specifically, as noted above, the Commission found that the frozen fillets of basa, tra, and catfish generally were similar in appearance, texture, price, and taste, and were sold in the same size range and in similar packaging.70 A majority of importers and domestic producers and some purchasers reported that the subject imports and the domestic like product were used interchangeably.71 Subject basa and tra fillets in fact were marketed and sold in the United States as “catfish.”72 The Commission found that, although the marketing of the subject imports may have changed as a result of the laws concerning labeling, consumers still viewed basa and tra as comparable to domestic catfish fillets, basa and tra fillets competed with catfish fillets at the same accounts, large purchasers had switched between catfish fillets and the subject imports, and the labeling laws did not reverse commercial ties in the market that responded to price.73
In the first review, the Commission found that the degree to which frozen catfish fillets and frozen basa and tra fillets from Vietnam were substitutable in the U.S. market may have decreased as a result of the stricter labeling requirements at the federal and state levels that the Commission cited in the original investigation. The Commission found, however, that distributors, sellers, and restaurant owners still appeared to be marketing the subject imports as a substitute for catfish in oral communications, price lists, and menus. The Commission noted also that the market share of subject imports increased during the period of review while the market share of domestic catfish declined. The Commission concluded that, given the record as a whole, including the similarities in physical characteristics of the products and the contrasting trends in market share, there appeared to be at least moderate substitutability between domestic frozen catfish fillets and frozen basa and tra fillets from Vietnam.74
The information available in this review contains nothing to indicate that the substitutability between subject imports and domestic frozen catfish fillets has changed since the prior review. Accordingly, we again find that there is at least a moderate degree of substitutability between subject imports and the domestic like product.
67 CR/PR at Table I‐4. 68 CR/PR at Tables I‐2, I‐4. 69 Original Determination, USITC Pub. 3617 at 13‐14. 70 Original Determination, USITC Pub. 3617 at 10‐11. 71 Original Determination, USITC Pub. 3617 at 12. 72 As previously stated, in 2001 and 2002, legislation intended to prohibit this practice was
enacted. 73 Original Determination, USITC Pub. 3617 at 11‐12. 74 First Review Determination, USITC Pub. 4083 at 11.
13
C. Likely Volume of Subject Imports
Original Investigation and Prior Review. In its original investigation, the Commission found that the quantity of subject imports rose from 12.5 million pounds in 2000 to 26.0 million pounds in 2001 and 36.0 million pounds in 2002, an increase of 187.4 percent from 2000 to 2002.75 The Commission stated that, although apparent U.S. consumption grew between 2000 and 2002, the volume of subject imports grew significantly faster and captured an increasing share of the U.S. market.76 Moreover, the Commission found that the subject imports’ increase in market share came largely at the expense of the domestic industry, as nonsubject import volumes were insignificant throughout the period. Subject imports increased relative to domestic production as well.77 The Commission concluded that the increased volume of subject imports was significant both in absolute terms and relative to production and apparent consumption in the United States.78
During the first review period, subject imports increased from 19.7 million pounds in 2003 to 53.3 million pounds in 2008, an increase of 171 percent. Subject imports increased their U.S. market share from 12.2 percent in 2003 to 25.1 percent in 2008.79 By contrast, the domestic industry’s market share fell from 87.1 percent in 2003 to 54.1 percent in 2008. The Commission found that nonsubject imports gained a greater portion of the domestic industry’s lost market share than did the subject imports, increasing from 0.7 percent in 2003 to 20.8 percent in 2008, but continued to hold a smaller share of the U.S. market than subject imports.80
The Commission found that the industry in Vietnam was much larger than it was at the time of the original investigation and remained export oriented. Production of basa and tra in Vietnam was reported to be over six times greater in 2007 than it was in 2002, and the Vietnamese industry had plans to add new capacity.81
The Commission found that there was likely significant excess capacity in Vietnam that could be the source of increased exports to the United States in the reasonably foreseeable future if the order were revoked.82
Data on the Vietnamese industry showed that its exports of basa and tra surged from 73 million pounds in 2003 to 1.4 billion pounds in 2008.83 The Commission found that the rapid increase in exports during the review period, destined for the European Union and other markets such as Australia, Russia, and Ukraine, indicated a likely increase in shipments to the United States should the order be revoked. Given the ease and speed with which the
75 Original Determination, USITC Pub. 3617 at 13. 76 Original Determination, USITC Pub. 3617 at 13. Subject imports’ market share increased from
8.4 percent in 2000 to 19.6 percent in 2002. Id. 77 Original Determination, USITC Pub. 3617 at 13. Subject imports were equivalent to 11.6
percent of domestic production in 2000, but rose to 33.2 percent by 2002. Id. 78 Original Determination, USITC Pub. 3617 at 13‐14. 79 First Review Determination, USITC Pub. 4083 at 13. 80 First Review Determination, USITC Pub. 4083 at 13. 81 First Review Determination, USITC Pub. 4083 at 14. 82 First Review Determination, USITC Pub. 4083 at 14. 83 First Review Determination, USITC Pub. 4083 at 14.
14
Vietnamese industry had expanded its exports, and that the U.S. market remained an attractive, high priced, and growing destination for subject imports even during the review period, the Vietnamese industry would likely increase exports significantly upon revocation of the order.84
The Commission therefore concluded that the likely volume of subject imports, both in absolute terms and relative to production and consumption in the United States, would be significant if the antidumping duty order were revoked.85
Current Review. Several factors support the conclusion that the subject import volume
is likely to be significant in the event of revocation of the order. Notwithstanding the antidumping duty order, subject imports have continued to be present in the U.S. market at increasing levels since the original investigation and the prior review, reaching an all‐time peak in 2013. During the review period, subject imports increased steadily from 84.4 million pounds in 2009 to 106.6 million pounds in 2010, 186.4 million pounds in 2011, 213.1 million pounds in 2012, and 224.3 million pounds in 2013, an increase of 166 percent from 2009 to 2013.86 Whereas subject imports accounted for 25.1 percent of apparent U.S. consumption in 2008, the end of the first review period, they accounted for 77.4 percent of apparent U.S. consumption in 2013.87 The market share of the domestic producers, on the other hand, dropped from 54.1 percent in 2008 to 17.9 percent in 2013. 88
Available data indicate that the industry in Vietnam continues to manufacture and export substantial volumes of frozen basa and tra fillets.89 Domestic parties state that production capacity has increased further since the first review, asserting for instance that the number of processors in Vietnam grew from 80 in the first review period to 100 in 2012.90
The record also indicates that there continues to be significant excess capacity in Vietnam for the production of the subject merchandise. Numerous producers in Vietnam have announced plans in the past five years to expand their capacity, and an Aquaculture Plan issued by the government of Vietnam in 2011 includes the goal of substantially increasing production of basa and tra in the near term and through 2020.91 Given the greatly increased capacity of the Vietnamese industry since imposition of the order and the likelihood of further increases,
84 First Review Determination, USITC Pub. 4083 at 15. The Commission found that Commerce
Department findings that exporters had circumvented the antidumping duty order by shipping through third countries and mis‐labeling the subject merchandise as other species of fish further demonstrated the attractiveness of the U.S. market. Id.
85 First Review Determination, USITC Pub. 4083 at 15. 86 CR/PR at Table I‐2. The peak volume of subject imports in the original investigation was 36.0
million pounds in 2002, and the peak volume in the first review was 53.3 million pounds in 2008. Original Determination, USITC Doc. 3617 at 13; First Review Determination, USITC Doc. 4083 at 13.
87 CR/PR at Table I‐4. 88 CR/PR at Table I‐4. 89 CR/PR at Table 1‐5. 90 CR at 21‐22, PR at 17. 91 CR at 22, PR at 17.
15
we find that the subject industry is likely to have significant excess capacity to enable it to increase exports to the United States if the order were revoked.92
The United States remains an attractive market for the frozen basa and tra fillet industry in Vietnam. Subject imports from Vietnam have increased by 320.8 percent since the first review, well above the overall increase in Vietnam’s total exports.93
Formal and informal barriers exist in third country markets that prevent or limit importation of subject basa and tra from Vietnam. Russia implemented a ban on imports of Vietnamese basa and tra in January 2014 after inspection revealed microbe pollution and hormone medications in the fish.94 A report produced by VASEP states that, in 2012, Vietnamese basa and tra exporters began shifting shipments from the EU to the U.S. market because of low prices in the EU, a drop in European demand, and a fear of late payment by European buyers.95
Based on the foregoing, we find it likely that the subject producers in Vietnam would, upon revocation of the order, increase exports to the U.S. market to an even greater extent than they have with the order in place, and that the likely volume of subject imports would be significant.96
D. Likely Price Effects
Original Investigation and Prior Review. In the original investigation, the Commission found that the domestic like product and subject imports were substitutable and that they competed not only in the same U.S. regions and through the same channels of distribution, but at the same customer accounts. The Commission found that subject imports of basa and tra undersold the domestic product in all 139 monthly price comparisons, by margins ranging from
92 CR at 20‐22, PR at 16‐18. Information provided by domestic parties in their response to the
notice of institution indicates that producers in Vietnam have substantial unused capacity, as high as 70 percent for some producers. CR at 21, PR at 17.
93 CR/PR at Tables I‐3, I‐5 (data for total exports from Vietnam, available only through 2010, show total exports increasing by 2.9 percent from 2008 to 2010, while exports to the United States increased by 130.6 percent). The circumvention findings cited in the first review determination provide further evidence of the attractiveness of the U.S. market. First Review Determination, Pub. 4083 at 15 and 15 n.108. See also CR at 17 n.61, PR at 13 n.61.
94 CR at 23, PR at 18. Domestic parties state that Brazil’s 2013 imposition of strict inspection and quality control requirements on seafood imports reduces the extent to which Brazil will be a destination for exports of seafood generally. Domestic Parties’ Response to Notice of Institution at 14‐15 and Exhibit 25.
95 Domestic Parties’ Response to Notice of Institution at Exhibit 23 (VASEP, Report on Vietnam Seafood Export Quarter I/2012 at 27). There are no antidumping duty or countervailing duties concerning certain frozen fish fillets from Vietnam in other countries.
96 We have also considered inventories of the subject merchandise and the potential for product‐shifting. Due to the nature of this expedited review, there are no data available on inventories of the subject merchandise. In the first review, the Commission stated that there was no indication that Vietnamese processors could shift from the processing of other fish to basa and tra production. First Review Determination, USITC Pub. 4083 at 15 n.106. There is no basis on the current record for determining whether or not that is still the case.
16
9.2 percent to 38.6 percent, and concluded that the underselling was significant. The Commission also found that significant price depression occurred during the POI, as average prices for the domestic like product declined significantly over the POI.97 In the first review, the Commission found the domestic like product and subject imports continued to be used interchangeably and that price remained an important factor in purchasing decisions. It found that the subject imports undersold the domestic like product in all 74 comparisons at margins that ranged from 17.5 to 50.7 percent, greater with the order in place than during the original investigation.98 The Commission found that, although prices for the domestic like product increased during the review period, the increases were not sufficient to cover the increasing costs of the processors, which encompassed the cost of live catfish. Consequently, the industry experienced a cost‐price squeeze during the review period. The Commission found that, in light of strong demand, the domestic industry should have been able to pass these cost increases to purchasers by way of higher prices, but was unable to do so. It explained that, if the order were revoked and domestic producers were competing against greater volumes of low‐priced imports from Vietnam, it would be even more difficult for the domestic producers to raise prices to cover their increasing costs, leading to even greater price‐suppressing effects.99 The Commission found that subject exporters were likely to price their product even more aggressively if the order were revoked in order to export large volumes of subject merchandise to the United States and increase their share of the U.S. market. Thus the Commission found that, absent the antidumping duty order, the subject exporters were likely to lower their prices, as they had in their other export markets, in order to increase their market share in the United States.100 For these reasons, the Commission concluded that subject imports from Vietnam were likely to have significant price effects if the order were revoked.101 Current Review. There is no new product‐specific pricing information on the record of this expedited review. We find that price continues to be an important factor in purchasing decisions. In light of the consistent underselling that occurred during the POI and the first review period, we find that, if the antidumping duty order were revoked, subject imports from Vietnam would likely be priced aggressively and undersell the domestic like product to gain market share. This in turn would likely require the domestic industry either to cut prices or restrain price increases to match the prices offered by the subject imports or to risk losing sales to the subject imports. For the foregoing reasons, we conclude that subject imports from Vietnam are likely to have significant price effects if the order were revoked.
97 Original Determination, USITC Pub. 3617 at 15‐17. 98 First Review Determination, USITC Pub. 4083 at 16. 99 First Review Determination, USITC Pub. 4083 at 17. 100 First Review Determination, USITC Pub. 4083 at 17. 101 First Review Determination, USITC Pub. 4083 at 18.
17
E. Likely Impact102
Original Investigation and Prior Review. In the original investigation, the Commission found that that the domestic industry expanded its capacity over the POI, but by an amount that was less than the 24.1 percent increase in apparent U.S. consumption. The Commission found that the domestic industry’s capacity utilization decreased as the volume of subject imports increased significantly and that the industry’s sales were significantly constrained despite the growth in demand. Due to the significant growth in subject import volume, the domestic industry’s share of the U.S. market declined by 10.6 percentage points from 2000 to 2002 despite increased shipments by U.S. processors.103 The domestic industry’s profitability declined from 2000 to 2002 as it was unable to lower costs sufficiently to compensate for declining prices. The industry’s employment levels also decreased between 2000 and 2002. Based on significant declines in many of the domestic industry’s performance indicators, the Commission found that the increasing volumes of subject imports had a significant adverse impact on the domestic industry.104 In the first five‐year review period, the Commission found that despite relatively strong demand for certain frozen fish fillets, the industry’s capacity, production, capacity utilization, and market share all declined. U.S. shipments of the domestic like product declined overall as well, although the value of the domestic industry’s sales increased as domestic prices increased. The domestic industry’s production and related workers (PRWs) and hours worked fluctuated, but decreased overall during the period examined.105 The Commission also found that the domestic industry’s profitability suffered during the review period. The industry reported its greatest operating income of $16.1 million in 2003, the first year of the review period. The industry, however, reported operating income of just $574,000 and $3.6 million in 2007 and 2008, respectively. The domestic industry’s operating income as a ratio to net sales was 6.2 percent in 2003, 3.0 percent in 2004, 3.1 percent in 2005, 3.0 percent in 2006, 0.2 percent in 2007, and 1.2 percent in 2008. The industry’s capital expenditures fell during the period examined as well, from $5.3 million in 2003 to $2.2 million in 2008.106 The Commission found that the domestic industry’s trade and financial indicators reflected a shrinking and less profitable industry. Raw material costs increased during the period examined, as the industry’s primary input, live catfish, increased in price due to higher
102 Under the statute, “the Commission may consider the magnitude of the margin of dumping”
in making its determination in a five‐year review. 19 U.S.C. § 1675a(a)(6). The statute defines the “magnitude of the margin of dumping” to be used by the Commission in five‐year reviews as “the dumping margin or margins determined by the administering authority under section 1675a(c)(3) of this title.” 19 U.S.C. § 1677(35)(C)(iv); see also SAA at 887.
Commerce expedited its antidumping duty review determination and found that revocation of the antidumping duty order would likely lead to continuation or recurrence of dumping at weighted average margins up to 63.88 percent. 79 Fed. Reg. 60452, 60453 (Oct. 7, 2014).
103 Original Determination, USITC Pub. 3617 at 17‐18. 104 Original Determination, USITC Pub. 3617 at 17‐18. 105 First Review Determination, USITC Pub. 4083 at 18‐19. 106 First Review Determination, USITC Pub. 4083 at 20.
18
feed costs. The industry had difficulty reducing its costs because raw materials were such a large cost component. Further, despite the antidumping duty order, the industry’s ability to raise its prices was constrained due to price pressure from increasing volumes of low‐priced subject imports.107 The Commission also observed that U.S. catfish farmers were reducing their catfish production due to low prices for catfish relative to production costs and that this reduced the supply of live catfish available to processors. The Commission found that this trend was likely to continue in the foreseeable future because it was unprofitable for U.S. processors to pay more for live catfish. Given the decline in the industry’s trade and financial indicators as well as the other difficulties facing the industry, the Commission found that the industry was vulnerable to the effects of the subject imports if the order were revoked.108 The Commission also considered the growing presence of nonsubject imports in the U.S. market, with China being by far the largest source of nonsubject imports. The Commission found, however, that the Chinese industry was not focused on export‐led growth, as was the Vietnamese industry; less than five percent of Chinese aquaculture production was exported, and the Chinese “catfish” industry was significantly smaller than the subject industry in Vietnam. The Commission noted that the average unit values (“AUVs”) of nonsubject imports were substantially higher than the AUVs for subject imports during all years of the review period, indicating that subject imports would likely be priced more aggressively than nonsubject imports if the order were revoked. Thus, the Commission found that subject imports were likely to have a significant adverse impact upon the domestic industry if the order were revoked, notwithstanding the fluctuating presence of nonsubject imports in the U.S. market.109 Given that subject imports and the domestic like product were at least moderately substitutable, the Commission found that, in the event of revocation, low‐priced subject imports would likely increase in absolute terms and would gain market share at the expense of the domestic industry, would undersell the domestic like product significantly, and would depress and/or suppress prices for the domestic like product. Accordingly, the Commission found that revocation of the order would likely have a significant adverse impact on the domestic industry with respect to the industry’s production, shipments, sales, market share, employment, and profits.110 Current Review. The information available concerning the domestic industry’s condition in this review consists of the data that the domestic producers provided in response to the notice of institution. Because this is an expedited review, we only have limited information regarding the domestic industry’s financial performance. The record is insufficient for us to
107 First Review Determination, USITC Pub. 4083 at 20. 108 First Review Determination, USITC Pub. 4083 at 20. 109 First Review Determination, USITC Pub. 4083 at 20. 110 First Review Determination, USITC Pub. 4083 at 20‐21.
19
make a finding on whether the domestic industry is vulnerable to the continuation or recurrence of material injury in the event of revocation of the order.111
The information on the record indicates that, in 2013, the capacity of the reporting domestic producers was 81.5 million pounds, production was 50.3 million pounds, and capacity utilization was 66.8 percent.112 U.S. shipments in 2013 were 51.9 million pounds valued at $180.0 million.113 The domestic industry reported that its ratio of operating income to net sales was 12.1 percent.114 Based on the limited information on the record, we find that, should the order be revoked, the likely significant volume and price effects of the subject imports would likely have a significant adverse impact on the production, shipments, sales, market share, and revenues of the domestic industry. This impact would likely cause declines in the domestic industry’s financial performance.
We have also considered the role of factors other than subject imports, including the presence of nonsubject imports, so as not to attribute injury from other factors to the subject imports. While nonsubject imports have increased their market share since the original POI, during which they accounted for less than one percent of apparent U.S. consumption,115 they accounted for a smaller share of apparent U.S. consumption during the current review period, 4.7 percent, than they did in 2008, 20.8 percent.116 Moreover, AUVs for nonsubject imports, although below the AUVs for the domestic like product, were higher in 2013 and prior years than the AUVs for the subject imports.117 The experience during the period of review indicates that the likely increase in subject import volume upon revocation would likely take market share from both the domestic industry and nonsubject imports and would have independent adverse price effects on the domestic industry given that the subject imports would likely be priced lower than both the domestic like product and nonsubject imports.118 Consequently, we find that nonsubject imports are not a cause of the likely adverse effects we have attributed to the subject imports.
Accordingly, we conclude that if the orders were revoked, subject imports would likely have a significant impact on the domestic industry within a reasonably foreseeable time.
111 Commissioner Pinkert finds that the evidence regarding the domestic industry’s vulnerability
to the continuation or recurrence of material injury in the event of revocation of the order is mixed. The industry’s capacity, production, capacity utilization, U.S. shipments, net sales quantities, and net sales values all were lower in 2013 than in 2008, the last year of the Commission’s prior five‐year review. CR/PR at Table I‐1. Nevertheless, the industry registered an operating income in 2013 of nearly $22 million and an operating income margin of 12.1 percent, both of which were substantially higher than during the period of the prior review.
112 CR/PR at Table I‐1. 113 CR/PR at Table I‐1. 114 CR/PR at Table I‐1. 115 Original Determination, USITC Pub. 3617 at 10. 116 CR/PR at Table 1‐4. 117 CR/PR at Table I‐2. Because differences in AUVs may reflect differences in product mix, we
view such data with caution. 118 CR/PR at Table I‐4.
20
Conclusion IV.
For the above reasons, we determine that revocation of the antidumping duty order on certain frozen fish fillets from Vietnam would likely lead to continuation or recurrence of material injury to an industry in the United States within a reasonably foreseeable time.
I‐1
INFORMATION OBTAINED IN THE REVIEW
INTRODUCTION
Background
Effective June 2, 2014, the U.S. International Trade Commission (“Commission” or “USITC”) gave notice, pursuant to section 751(c) of the Tariff Act of 1930, as amended (“the Act”),1 that it had instituted a review to determine whether revocation of the antidumping duty order on certain frozen fish fillets from Vietnam would likely lead to the continuation or recurrence of material injury to a domestic industry.2 On September 5, 2014, the Commission determined that the domestic interested party response to the notice of institution was adequate3 and respondent party group response was inadequate.4 In the absence of any other circumstances that would warrant the conduct of a full review, the Commission determined to conduct an expedited review of the antidumping duty order pursuant to section 751 (c) (3) of the Act.5 The following tabulation presents information relating to the background and schedule of this review:
1 19 U.S.C. 1675(c). 2 Frozen Fish Fillets From Vietnam; Institution of a Five‐Year Review, 79 FR 31345, June 2, 2014. All
interested parties were requested to respond to this notice by submitting the information requested by the Commission.
3 The Commission received one submission that was jointly filed by the Catfish Farmers of America, an association of U.S. catfish farmers and processors, and six individual catfish processers: America’s Catch Inc., Alabama Catfish Inc. dba Harvest Select Catfish, Inc., Heartland Catfish Co., Magnolia Processing, Inc. dba Pride of the Pond, Simmons Farm Raised Catfish, Inc., and Guidry’s Catfish, Inc. (collectively, “domestic interested parties”).
4 The Commission received one response from the Vietnam Association of Seafood Exporters and Producers (“VASEP”), an association of 23 producers and exporters of frozen fish fillets from Vietnam. That response did not contain substantial portions of the information requested in the Commission’s notice of institution, and VASEP declined the opportunity to provide the missing information in a supplemental response. Accordingly, the Commission determined that VASEP’s response was inadequate and that the respondent interested party group response was inadequate. The Commission’s statement of adequacy is presented in appendix A.
5 Certain Frozen Fish Fillets from Vietnam: Scheduling of an Expedited Five‐Year Review, 79 FR 56826, September 23, 2014.
I‐2
The original investigation
The original investigation resulted from a petition filed on June 28, 2002, by the Catfish Farmers of America and by individual U.S. catfish processors, alleging that an industry in the United States was materially injured and threatened with material injury by reason of less‐than‐fair‐value (“LTFV”) imports of frozen fish fillets from Vietnam. In June 2003, Commerce determined that imports of frozen fish fillets from Vietnam were being sold at LTFV.6 In August 2003, the Commission determined that an industry in the United States was materially injured by reason of LTFV imports of frozen fish fillets from Vietnam.7 Commerce issued an antidumping duty order on frozen fish fillets from Vietnam on August 12, 2003.8 U.S. import and U.S. industry data compiled by the Commission during its original investigation are presented in appendix B.
First five‐year review
The Commission instituted its first five‐year review on July 1, 2008.9 The Commission received a response filed on behalf of the Catfish Farmers of America and a group of eight individual U.S. catfish processors.10 The Commission also received a response filed on behalf of the Vietnam Association of Seafood Exporters and Producers (“VASEP”) and 24 member
6 Notice of Final Determination of Sales at Less Than Fair Value and Affirmative Critical Circumstances: Certain Frozen Fish Fillets from the Socialist Republic of Vietnam, 68 FR 37116, June 23, 2003.
7 Certain Frozen Fish Fillets from Vietnam: Determination, 68 FR 47608, August 11, 2003. 8 Notice of Antidumping Duty Order: Certain Frozen Fish Fillets from the Socialist Republic of Vietnam,
68 FR 47909, August 12, 2003. 9 Certain Frozen Fish Fillets From Vietnam: Institution of a five‐year review, 73 FR 37487, July 1, 2008. 10 Certain Frozen Fish Fillets From Vietnam, Inv. No. 731‐TA‐1012 (Review), USITC Publication 4083
(June 2009), p. 3.
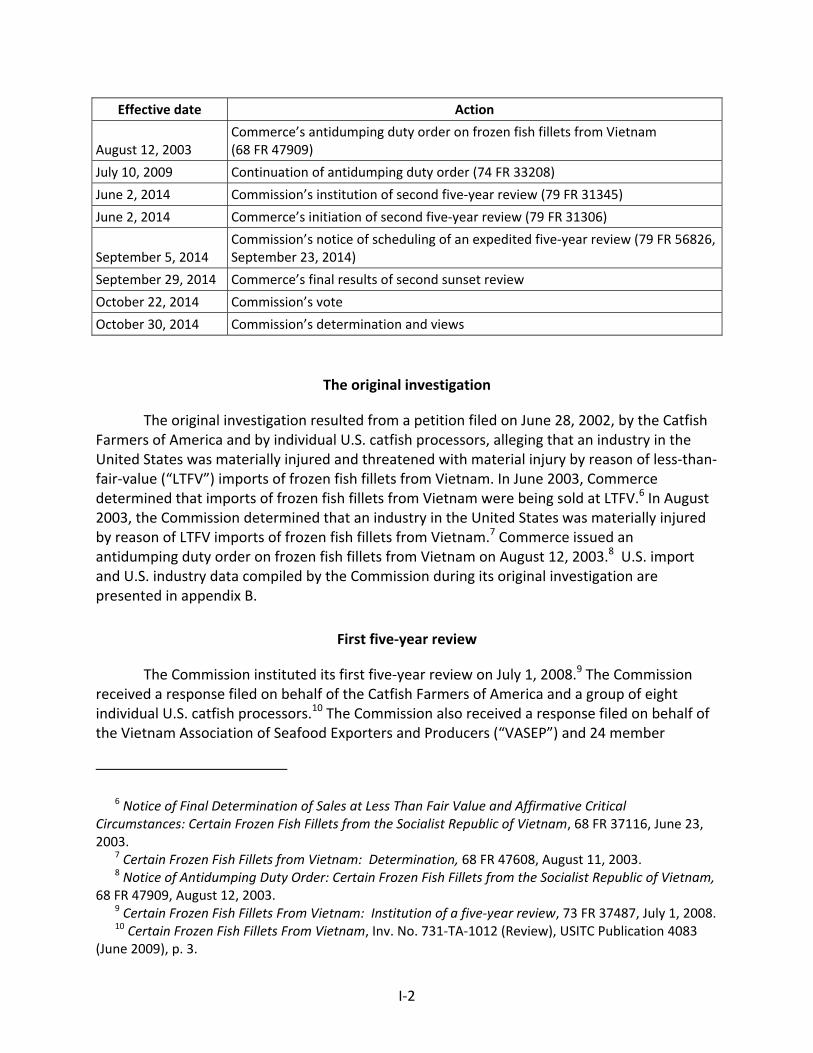
Effective date Action
August 12, 2003 Commerce’s antidumping duty order on frozen fish fillets from Vietnam (68 FR 47909)
July 10, 2009 Continuation of antidumping duty order (74 FR 33208)
June 2, 2014 Commission’s institution of second five‐year review (79 FR 31345)
June 2, 2014 Commerce’s initiation of second five‐year review (79 FR 31306)
September 5, 2014 Commission’s notice of scheduling of an expedited five‐year review (79 FR 56826, September 23, 2014)
September 29, 2014 Commerce’s final results of second sunset review
October 22, 2014 Commission’s vote
October 30, 2014 Commission’s determination and views
I‐3
companies.11 On October 6, 2008, the Commission determined that both the domestic and respondent interested party responses were adequate and determined that it should proceed to a full review pursuant to section 751(c)(5) of the Tariff Act of 1930, as amended.12
On June 26, 2009, the Commission determined that revocation of the antidumping duty order on frozen fish fillets from Vietnam would be likely to lead to continuation or recurrence of material injury to an industry in the United States within a reasonable foreseeable time.13 Commerce issued a continuation of the antidumping duty order on July 10, 2009.14 U.S. import and U.S. industry data compiled by the Commission during the first‐five year review are presented in appendix B.
Commerce’s final results of expedited second five‐year review
On September 29, 2014, Commerce issued its final results of its second expedited five‐year review. Commerce determined that revocation of the antidumping order on certain frozen fish fillets from Vietnam would likely lead to continuation or recurrence of dumping and announced weighted average margins of up to 63.88 percent.15
Previous and related title VII investigations
The Commission has not conducted any previous investigations on either catfish or on basa and tra.
THE PRODUCT
Commerce’s scope
Commerce has defined the subject merchandise as follows:
The product covered by this order is frozen fish fillets, including regular, shank, and strip fillets and portions thereof, whether or not breaded or marinated, of the species Pangasius Bocourti, Pangasius Hypophthalmus (also known as Pangasius Pangasius), and Pangasius Micronemus. Frozen fish fillets are lengthwise cuts of whole fish. The fillet products covered by the scope include
11 Ibid. 12 Certain Frozen Fish Fillets From Vietnam: Notice of Commission Determination to Conduct a Full
Five‐year Review, 73 FR 62318, October 20, 2008. 13 Certain Frozen Fish Fillets From Vietnam: Determination, 74 FR 31975, July 6, 2009. 14 Continuation of Antidumping Duty Order on Certain Frozen Fish Fillets From the Socialist Republic of
Vietnam, 74 FR 33208, July 10, 2009. 15 Certain Frozen Fish Fillets from the Socialist Republic of Vietnam: Final Results of Expedited Second
Sunset Review of the Antidumping Duty Order, Issues and Decision Memorandum, Gary Tavermann, U.S. Department of Commerce, September 29, 2014, p. 9.
I‐4
boneless fillets with the belly flap intact (“regular” fillets), boneless fillets with the belly flap removed (“shank” fillets), boneless shank fillets cut into strips (“fillets strips/finger”), which include fillets cut into strips, chunks, blocks, skewers, or any other shape. Specifically excluded from the scope are frozen whole fish (whether or not dressed), frozen steaks, and frozen belly‐flap nuggets. Frozen whole dressed fish are deheaded, skinned, and eviscerated. Steaks are bone‐in, cross‐section cuts of dressed fish. Nuggets are the belly‐flaps. The subject merchandise will be hereinafter referred to as frozen “basa” and “tra” fillets, which are the Vietnamese common names for these species of fish.16
U.S. tariff treatment
Certain frozen fish fillets are currently classifiable in the Harmonized Tariff Schedule of the United States (“HTS”) under subheading 0304.62.00.17 At the time of the original investigation, the tariff rate on frozen fish fillets from Vietnam and all general duty rate countries was free (prior to December 1, 2001, the tariff rate applicable to Vietnam was the column 2 rate of 5.5 cents per kilogram). The 2014 general rate of duty on U.S. imports of certain frozen fish fillet is free.18
Domestic like product and domestic industry
The domestic like product is the domestically produced product or products that are like, or in the absence of like, most similar in characteristics and uses with, the subject merchandise. In the original investigation and the first five‐year review, the Commission found the domestic like product to be frozen catfish fillets, whether plain, breaded, or marinated. In the first full five‐year review the Commission stated:
The Commission found {in the original investigation} that there was no domestic product that was “like” the subject imports, so the Commission found a domestic like product that was “most similar” in terms of physical characteristics and uses. The Commission found that the record indicated that basa, tra, and domestic catfish are all freshwater white fish, with similar 6‐month shelf lives when frozen, similar texture, and a neutral/mild flavor. Further, it found that basa, tra, and domestic catfish are all typically individually quick frozen, packaged in 15‐pound
16 Continuation of Antidumping Duty Order on Certain Frozen Fish Fillets From the Socialist Republic of Vietnam, 74 FR 33208, July 10, 2009.
17 The HTS subheading 0304.62.00 was created in February 2012. There have been several changes to the HTS classifications for reporting U.S. imports of certain frozen fish fillets. The following are the relevant statistical reporting numbers for subject frozen fish fillets during previous periods:
Until July 1, 2004: 0304.20.6030, 0304.20.6096, 0304.20.6043, and 0304.20.6057. Until February 1, 2007: 0304.20.6033. After February 1, 2007: 1604.19.4000, 1604.19.5000, 0305.59.4000, 0304.29.6033. 18 Harmonized Tariff Schedule of the United States (2014).
I‐5
boxes, and sold in the same size increments, primarily to the food service industry and secondarily to restaurants. As additional support, the Commission noted that during the original investigation frozen basa and tra fillets from Vietnam were widely marketed, sold, and even labeled in the United States as “catfish” under product names similar to U.S. catfish producers’ products or that implied domestic origin. For these reasons, the Commission concluded that frozen catfish fillets were the product most similar to the subject imports of frozen basa and tra fillets. In this review, the Domestic Parties have indicated that they agree with the Commission’s definition of the domestic like product in the original investigation. Moreover, there is no new information obtained during this review that would suggest any reason to revisit the Commission’s domestic like product definition from the original investigation. Consistent with our domestic like product definition in the original investigation, we define the domestic like product as frozen catfish fillets, whether plain, breaded, or marinated.19
According to their response to the notice of institution, the domestic interested parties concur with this definition.20 VASEP did not take a position as to the definition of the domestic like product.21
The domestic industry is defined as the U.S. producers as a whole of the domestic like product, or those producers whose collective output of the domestic like product constitutes a major proportion of the total domestic production of the product. In the original investigation, the Commission considered whether to include catfish farmers as part of the domestic industry, under the processed agricultural product provision of the statute, but concluded that the statutory test was not satisfied.22 In the first full five‐year review, the Commission once again considered whether to include catfish farmers in the domestic industry, and again, found that the statutory test was not satisfied.23 In both the original investigation and first five‐year review, the Commission considered the relationship and interdependence of catfish farmers and processors to be an important condition of competition.24 According to their response to the notice of institution, the domestic interested parties concur with this definition.25 VASEP did not take a position as to the definition of the domestic industry. 26
19 Certain Frozen Fish Fillets From Vietnam, Inv. No. 731‐TA‐1012 (Review), USITC Publication 4083 (June 2009), pp. 5‐6.
20 Domestic Interested Parties’ Response to the Notice of Institution, July 2, 2014, p. 37. 21 VASEP’s Response to the Notice of Institution, July 2, 2014, p. 12. 22Certain Frozen Fish From Vietnam, Inv. No. 731‐TA‐1012 (Final), USITC Publication 3617, p. 8‐9. 23 Certain Frozen Fish From Vietnam, Inv. No. 731‐TA‐1012 (Review), USITC Publication 4083, p. 6. 24 Certain Frozen Fish From Vietnam, Inv. No. 731‐TA‐1012 (Final), USITC Publication 3617, pp. 6‐12;
Certain Frozen Fish From Vietnam, Inv. No. 731‐TA‐1012 (Review), USITC Publication 4083, pp. 6 and 9. 25 Domestic Interested Parties’ Response to the Notice of Institution, July 2, 2014, p. 37. 26 VASEP’s Response to the Notice of Institution, July 2, 2014, p. 12.
I‐6
Physical characteristics and uses27
Basa/tra and catfish belong to separate families of freshwater fish with distinct physical characteristics, but both are regarded in the food industry as mild‐tasting, white meat, freshwater fish, and when processed into frozen fillets are considered generally similar in appearance, price, texture, and taste. A fillet is one of two sides of a fish with head, tail, bones, and entrails removed. “Regular” fillets include the belly flap, or “nugget;” “shank” fillets have the flap removed; and “strip” (or “finger”) fillets are finger‐sized strips cut from regular or shank fillets. Each fillet ranges in size from 2 ounces to over 12 ounces frozen.
Production process28
Virtually all of the basa/tra and catfish from which the subject fillets are made are commercially raised on farms, which may or may not be related to the processing plants that produce the subject product. Regardless of any joint ownership, farming and processing, discussed separately below, generally take place at separate locations.
Farming
In the United States, catfish are raised in man‐made, earthen ponds, 10 to 20 acres in size and 3 to 6 feet deep, on over 1,000 farms, located mainly in the Southeast (particularly in Mississippi, Alabama, and Arkansas) where climate and topography favor the process. The ponds are stocked with fingerlings 2 to 3 inches in length29 that receive a daily feeding until they reach a foodsize of at least 0.75 pound and usually not over 3 pounds, which is generally the range that can be processed efficiently.30 Fingerlings reach foodsize in about 10 weeks, and harvesting is year‐round, although individual farms may only harvest 2 or 3 times annually. Because several sizes of catfish are in a pond at any one time, harvesting generally takes place using nets that allow fish smaller than foodsize to escape. Processors generally are very particular about the size and flavor of the fish they purchase, often testing the fish in specific ponds for flavor and sometimes rejecting a pond’s fish on the basis of flavor alone.31 After harvesting, the fish are placed into tank trucks and are transported live to the processing plant. Catfish farmers in the United States raise no other kinds of fish, and the vast bulk of the fish they raise is sold to processors. The remainder is sold fresh to local markets.
27 Information in this section is largely drawn from the staff report of the first five‐year review. Certain Frozen Fish From Vietnam, Inv. No. 731‐TA‐1012 (Review), USITC Publication 4083, pp. I‐16‐I‐18.
28 Ibid. 29 Some farmers raise fingerlings only, selling these as feedstock to the other farmers. 30 Yields drop significantly after the fish reaches 2‐3 pounds and additional costs are incurred per
pound to raise the fish. 31 Off‐flavors are generally caused by blooms of certain algae, and such blooms are usually short‐
lived. If a specific pond’s fish are rejected for flavor several times in a row, the farmer may move the fish to another pond with less algae or apply an algaecide to kill all the algae in the pond. The latter is detrimental to the pond as algae aid in the pond’s oxygenation.
I‐7
In Vietnam, the fish are raised in cages in the Mekong River, mostly in the delta region, and at harvest are transported live downriver in cage boats to processors. The number of individual farms in Vietnam is unknown.
Processing
To produce frozen fish fillets, U.S. and Vietnamese processing plants perform the same steps, either automatically or manually depending on the individual processor, although most Vietnamese processors are not automated. Currently, 17 processing plants operate in the United States.32 The fish, held live in pre‐processing tanks, are first deheaded, eviscerated, skinned, and filleted, and then, after chilling and sorting by weight, are quick‐frozen and glazed. Any breading or marinating is done before freezing. Quick freezing, by which the fillets are reduced from 32 degrees Fahrenheit to 15 degrees Fahrenheit in 30 minutes or less, enables the fish to retain more of its original (fresh) quality.33 Upon leaving the freezer, a sprayer or water bath coats the fillets with a thin layer of ice (glaze). Finally, the fillets are packaged according to size in 15‐pound cardboard shipping cartons lined with polyethylene bags and warehoused at 0 degrees Fahrenheit or below until shipment. The Vietnamese product is packaged in 10‐pound cartons.
Most processors in the United States process catfish exclusively, but into many commercial products other than frozen fillets, including fresh (or “iced”) fillets, fresh and frozen whole fish, fresh and frozen dressed fish (deheaded, eviscerated, and skinned), and fresh and frozen steaks (cross sections of large fish). The nuggets of shank fillets are also sold separately, both fresh and frozen. Based on questionnaire responses, in 2008, 23 percent of the weight of the U.S.‐grown live catfish that processors used was processed into frozen fillets, 29 percent was processed into other products (especially whole fresh fish, fresh fish fillets, and frozen belly‐flap nuggets), and 48 percent was offal‐unused parts of the fish that were mostly sold for use in fish meal, fertilizer, and oil. Unlike U.S. processors, the Vietnamese processors also process water animals other than the subject product, including various types of mollusks, crustaceans, and other types of fish.
Interchangeability and customer and producer perceptions
During the original investigation, the Commission concluded that the marketing of frozen fillets of basa and tra had changed to some extent as a result of the labeling law, but the record indicated that the subject imports and the domestic product still competed because consumers viewed basa and tra as comparable to domestic catfish fillets.34 Further, the
32 Domestic interested parties’ response to Notice of Institution, July 2, Exhibit 18. 33 In the United States the fillets are treated with a tripolyphosphate solution prior to freezing to
prevent excessive water loss. 34 Certain Frozen Fish Fillets From Vietnam, Inv. No. 731‐TA‐1012 (Final), USITC Publication 3617, p.
11. The Farm Security and Rural Investment Act of 2002 included a provision that limits the use of the name “catfish” in food product labeling to fish of the Ictaluridae family, which is the species of catfish
(continued...)
I‐8
Commission found that frozen catfish fillets and basa and tra fillets competed for sales at the same accounts and that large purchasers switched from domestic catfish to the subject imports.35 The Commission observed that even if the labeling laws addressed marketing practices, they did not reverse the commercial ties that existed in a market that responded to price.
During the first review, the Commission observed that the level of substitutability between frozen catfish fillets and frozen basa and tra fillets from Vietnam may have decreased somewhat in the U.S. market as a result of the stricter labeling requirements at the federal and state levels noted by the Commission in the original investigation.36 Moreover, 15 of the 26 responding purchasers indicated that buying the domestic product rather than imports is important.37 The Commission also observed, however, that distributors, sellers, and restaurant owners still appeared to be marketing the subject imports as a substitute for catfish in oral communications, price lists, and menus.38 Basa and tra reportedly were sold to customers in restaurants in generic terms such as “southern fried fish.”39 The Commission noted also that the market share of subject imports increased during the period of review while the market share of domestic catfish declined. The Commission found that, given the record as a whole, including the similarities in physical characteristics of the products, and the contrasting trends in market share, there appeared to be at least moderate substitutability between domestic frozen catfish fillets and frozen basa and tra fillets from Vietnam.40
(…continued) raised in the United States. In addition, the 2002 farm bill included catfish in country‐of‐origin (“COOL”) labeling requirements that apply to retail sales, but specifically exempted restaurants.
The Food, Conservation and Energy Act of 2008 (the 2008 farm bill) amended the inspection regulations for catfish in the United States, requiring domestic and imported catfish to be subject to a mandatory continuous inspection program by the USDA’s Food Safety and Inspection Service (FSIS), rather than it had previously under the Food and Drug Administration. The proposed implementing regulations include the Food Safety and Inspection Service (FSIS) definition of “catfish,” details regarding country of origin labeling requirements, equivalency of foreign inspection systems, and provide for detention, seizure, condemnation of adulterated or misbranded product. 76 FR 10433, February 24, 2011. The FSIS catfish inspection program is continued in the Agricultural Act of 2014.
Six states have laws regarding catfish labeling, but only Mississippi, Arkansas, and Louisiana have laws that regulate the use of the term “catfish” on restaurant menus. Certain Frozen Fish Fillets From Vietnam, Inv. No. 731‐TA‐1012 (Review), USITC Publication 4083 (June 2009), p. I‐3.
35 Certain Frozen Fish Fillets From Vietnam, Inv. No. 731‐TA‐1012 (Final), USITC Publication 3617, p. 12.
36 Ibid., p. 11. 37 Certain Frozen Fish Fillets From Vietnam, Inv. No. 731‐TA‐1012 (Review), USITC Publication 4083
(June 2009), p. 11. 38 Ibid., p. 11. 39 Ibid., p. 11. 40 Ibid., p. 11.
I‐9
Channels of distribution
In the original investigation, The Commission found that a substantial share of subject imports was sold in the southern region of the United States, the principal market for the domestic product. The record indicated that frozen catfish fillets were primarily consumed in restaurants that feature southern fare.41 Subject imports and domestic frozen catfish fillets were also competing in the same channels of distribution, as 62 percent of domestic frozen catfish fillets were sold to food service distributors, while *** percent of importers’ shipments were destined for food service distributors.42
During the first review, the Commission observed that U.S. processors and importers sell to food service distributors, grocery chains, warehouse clubs, and directly to restaurants.43 Food service distributors in turn generally sell to restaurants, where consumers purchase the vast majority of certain frozen fish fillets. Food service distributors also reported selling to hotels, school systems, healthcare facilities, nursing homes, the military, and casinos.44 Most U.S. sales of the domestic product and the subject merchandise are made on a spot basis, with some sales arranged on a short‐term basis either by contract or oral agreement.45
Pricing and related information
During the original investigation, the Commission found that U.S. processors were able to lower their costs to some extent by paying the farmers lower prices for catfish, but several of the processors were owned by catfish farms, thereby limiting the extent to which lower revenue from depressed prices could be passed down to the farmers.46 The Commission found that subject imports of basa and tra undersold the domestic product in all 139 monthly price comparisons, by margins ranging from 9.2 percent to 38.6 percent, and concluded that the underselling was significant.47 The Commission also found that significant price depression occurred during the period of investigation. Despite increasing demand, average prices for the domestic like product
41 Certain Frozen Fish Fillets From Vietnam, Inv. No. 731‐TA‐1012 (Final), USITC Publication 3617, p. 12.
42 Ibid. 43 In the first five‐year review, ten food service distributors accounted for 74.5 percent of the
quantity of total purchases of certain frozen fish fillets reported during the period of investigation, and five restaurant chains accounted for 12.1 percent of the quantity reported. One food service company, ***, alone accounted for approximately *** of all purchases during the period. Certain Frozen Fish Fillets From Vietnam, Inv. No. 731‐TA‐1012 (Review), USITC Publication 4083 (June 2009), p. 12.
44 Certain Frozen Fish Fillets From Vietnam, Inv. No. 731‐TA‐1012 (Review), USITC Publication 4083 (June 2009), p. 12.
45 Certain Frozen Fish Fillets From Vietnam, Inv. No. 731‐TA‐1012 (Review), USITC Publication 4083 (June 2009), p. 12.
46 Certain Frozen Fish Fillets From Vietnam, Inv. No. 731‐TA‐1012 (Final), USITC Publication 3617, p. 10.
47 Ibid. at p. 15.
I‐10
declined from a high of $2.88 per pound in March and April 2000 to a low of $2.37 per pound in March and April 2002, before stabilizing at significantly lower levels.48
During the first review, the Commission observed that the domestic industry’s profitability had suffered during the period.49 The industry reported its greatest operating income of $16.1 million in 2003, the first year of the period examined. In 2007 and 2008, the industry reported operating income of just $574,000 and $3.6 million, respectively.50 The majority of the domestic producers reported losses in those two years.51 The industry had difficulty reducing its costs because raw material costs increased during the period examined, as the industry’s primary input, live catfish, increased in price due to higher feed costs. The Commission also noted that despite the antidumping duty order, the industry’s ability to raise its prices was constrained due to price pressure from increasing volumes of low‐priced subject imports. 52
THE INDUSTRY IN THE UNITED STATES
U.S. producers
During the first review, there were 20 known catfish processors as of January 2008. Since the original investigation, at least four domestic catfish processors (Aquafarms, Arkansas Catfish Growers LLC dba SEACAT, Prairie Lands, and Pride of the South Catfish Company) have ceased operations and one other domestic processor (Southern Pride) has closed several plants. In June 2008, Country Select and Delta Pride entered into an operating agreement whereby all sales and production of these two processors would be merged into and conducted by a newly created company, Consolidated Catfish Producers. In addition, Heartland Catfish purchased the operations of Southern Pride in September 2008. In 2012, due to market conditions, Heartland ceased all processing operations at that plant, and currently uses those facilities only for packaging and distribution.53 There is a large degree of integration between the catfish processors and catfish farmers and most processors are farmer‐owned.54 Since the last five‐year review, many U.S. catfish farming operations closed as a result of increases in feed prices and downward pricing pressure from Vietnamese imports.55 Also, the processing
48 Ibid. 49 Certain Frozen Fish Fillets From Vietnam, Inv. No. 731‐TA‐1012 (Review), USITC Publication 4083
(June 2009), p. 20. 50 Ibid. 51 Ibid. 52 Ibid. 53 The capacity at the Heartland processing facility was ***. Domestic Interested Parties’ Response to
the Notice of Institution, July 2, 2014, p. 26. 54 Certain Frozen Fish Fillets From Vietnam, Inv. No. 731‐TA‐1012 (Review), USITC Publication 4083
(June 2009), p. I‐19. 55 The number of catfish farming operations in the United States plummeted from 1,617 at the
beginning of 2008 to 624 at the beginning of January 2013, a decrease of 61.4 percent. Domestic Interested Parties’ Response to the Notice of Institution, July 2, 2014, p. 36 (citing USDA NASS Catfish Production Report, January 2013).
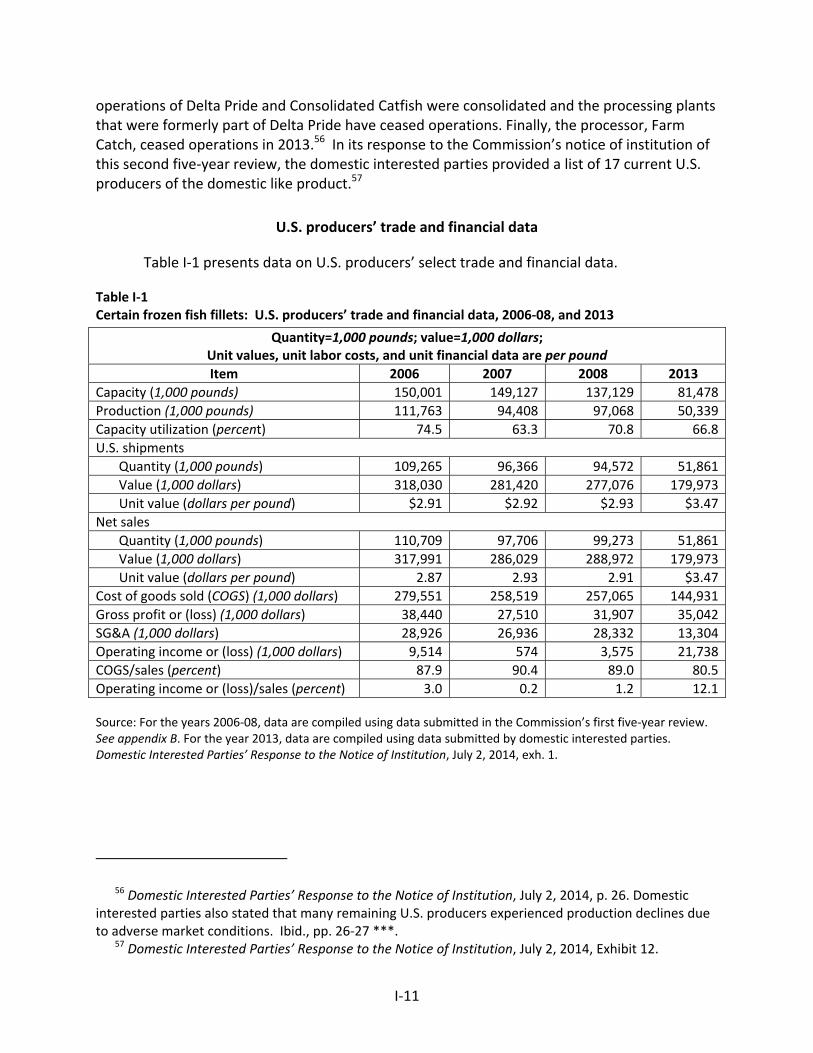
I‐11
operations of Delta Pride and Consolidated Catfish were consolidated and the processing plants that were formerly part of Delta Pride have ceased operations. Finally, the processor, Farm Catch, ceased operations in 2013.56 In its response to the Commission’s notice of institution of this second five‐year review, the domestic interested parties provided a list of 17 current U.S. producers of the domestic like product.57
U.S. producers’ trade and financial data
Table I‐1 presents data on U.S. producers’ select trade and financial data.
Table I‐1 Certain frozen fish fillets: U.S. producers’ trade and financial data, 2006‐08, and 2013
Quantity=1,000 pounds; value=1,000 dollars; Unit values, unit labor costs, and unit financial data are per pound
Item 2006 2007 2008 2013
Capacity (1,000 pounds) 150,001 149,127 137,129 81,478
Production (1,000 pounds) 111,763 94,408 97,068 50,339
Capacity utilization (percent) 74.5 63.3 70.8 66.8
U.S. shipments
Quantity (1,000 pounds) 109,265 96,366 94,572 51,861
Value (1,000 dollars) 318,030 281,420 277,076 179,973
Unit value (dollars per pound) $2.91 $2.92 $2.93 $3.47
Net sales
Quantity (1,000 pounds) 110,709 97,706 99,273 51,861
Value (1,000 dollars) 317,991 286,029 288,972 179,973
Unit value (dollars per pound) 2.87 2.93 2.91 $3.47
Cost of goods sold (COGS) (1,000 dollars) 279,551 258,519 257,065 144,931
Gross profit or (loss) (1,000 dollars) 38,440 27,510 31,907 35,042
SG&A (1,000 dollars) 28,926 26,936 28,332 13,304
Operating income or (loss) (1,000 dollars) 9,514 574 3,575 21,738
COGS/sales (percent) 87.9 90.4 89.0 80.5
Operating income or (loss)/sales (percent) 3.0 0.2 1.2 12.1
Source: For the years 2006‐08, data are compiled using data submitted in the Commission’s first five‐year review. See appendix B. For the year 2013, data are compiled using data submitted by domestic interested parties. Domestic Interested Parties’ Response to the Notice of Institution, July 2, 2014, exh. 1.
56 Domestic Interested Parties’ Response to the Notice of Institution, July 2, 2014, p. 26. Domestic interested parties also stated that many remaining U.S. producers experienced production declines due to adverse market conditions. Ibid., pp. 26‐27 ***.
57 Domestic Interested Parties’ Response to the Notice of Institution, July 2, 2014, Exhibit 12.
I‐12
U.S. IMPORTS AND APPARENT U.S. CONSUMPTION
In the original investigation, the Commission received questionnaire responses from seven U.S. importers, which accounted for 23 percent of U.S. imports from Vietnam. All were seafood distributers unrelated to any Vietnamese processor or grower.58 In the first five‐year review, the Commission received questionnaire responses from 11 U.S. importers of the subject import, accounting for *** of imports from Vietnam and *** of total imports in 2008.59
The domestic interested parties list 135 possible U.S. importers of the subject merchandise in their response to the notice of institution. The domestic interested parties also noted that U.S. imports of the subject merchandise from Vietnam increased from 41.3 million pounds in 2007 to 224.5 million pounds in 2013, and that the U.S. market went from representing 3.8 percent of Vietnamese pangasius exports in 2008 to 21.6 percent in 2013.60 61
58 Certain Frozen Fish Fillets From Vietnam, Inv. No. 731‐TA‐1012 (Final), USITC Publication, 3617, IV‐1.
59 Certain Frozen Fish Fillets From Vietnam, Inv. No. 731‐TA‐1012 (Review), USITC Publication 4083, IV‐1‐5.
60 Domestic Interested Parties’ Response to the Notice of Institution, July 2, 2014 p. 12‐13. In 2009, Commerce made an affirmative finding of duty absorption with respect to QVD Food and its U.S. affiliate QVD USA, Inc. Ibid., at p. 30; Certain Frozen Fish Fillets From the Socialist Republic of Vietnam: Final Results of the Antidumping Duty Administrative Review and New Shipper Reviews, 74 FR 11349, March 17, 2009 (Fourth Administrative Review).
61 The domestic interested parties also stated that subject imports are being purposefully mislabeled in order to circumvent the antidumping duty order, providing various articles and other documentation about mislabeling schemes, including court documents in which Vietnamese exporters and U.S. importers were found guilty or liable for mislabeling subject merchandise to evade antidumping duties. Domestic Interested Parties’ Response to the Notice of Institution, July 2, 2014, pp. 16‐17.
In 2004‐06, Commerce found that two related Vietnamese firms circumvented the antidumping order by importing whole, live basa and tra into Cambodia and processing them into frozen fish fillets for export to the United States. Consequently, Commerce clarified the scope of the order to include frozen fish fillets processed in Cambodia by Lian Heng from Vietnamese‐origin whole live fish for export to the United States. 71 FR 38608 (July 7, 2006).
In 2007, Commerce directed U.S. Customs to impose a per unit (kg) antidumping duty on frozen basa and tra fillets from Vietnam, rather than an ad valorem rate, as a result of certain importers undervaluing shipments to reduce the burden of the antidumping duty.
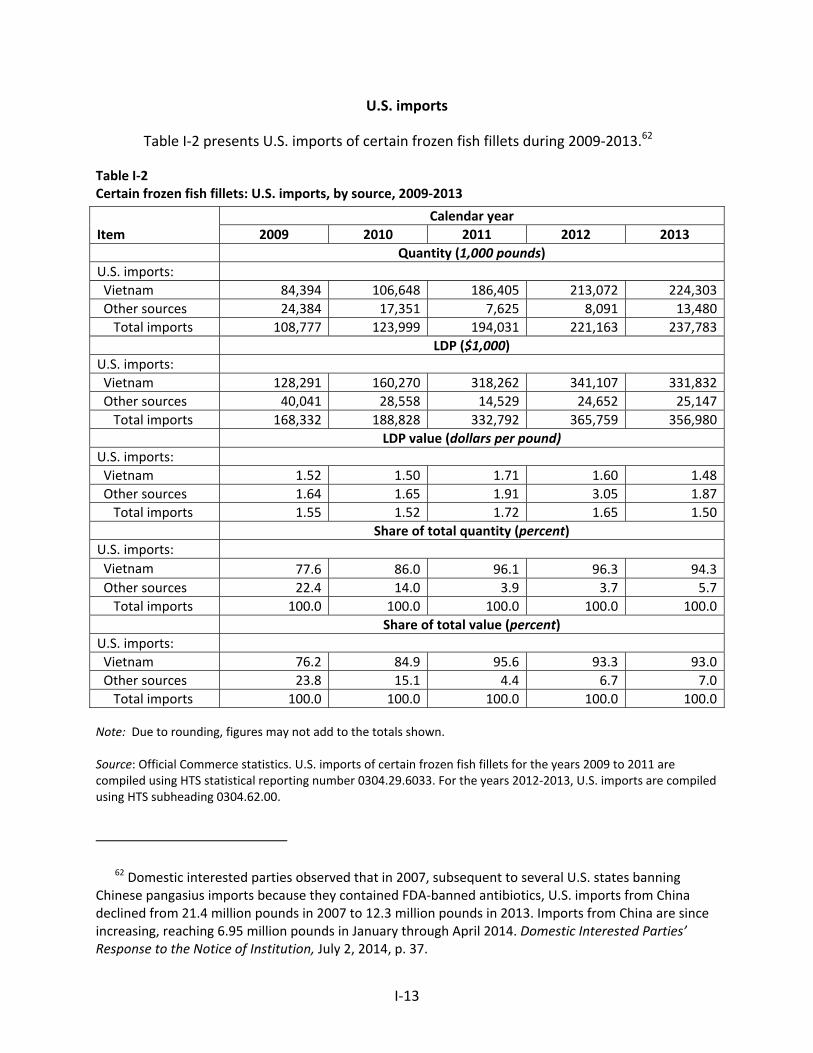
I‐13
U.S. imports
Table I‐2 presents U.S. imports of certain frozen fish fillets during 2009‐2013.62
Table I‐2 Certain frozen fish fillets: U.S. imports, by source, 2009‐2013
Item
Calendar year
2009 2010 2011 2012 2013
Quantity (1,000 pounds)
U.S. imports:
Vietnam 84,394 106,648 186,405 213,072 224,303
Other sources 24,384 17,351 7,625 8,091 13,480
Total imports 108,777 123,999 194,031 221,163 237,783
LDP ($1,000)
U.S. imports:
Vietnam 128,291 160,270 318,262 341,107 331,832
Other sources 40,041 28,558 14,529 24,652 25,147
Total imports 168,332 188,828 332,792 365,759 356,980
LDP value (dollars per pound)
U.S. imports:
Vietnam 1.52 1.50 1.71 1.60 1.48
Other sources 1.64 1.65 1.91 3.05 1.87
Total imports 1.55 1.52 1.72 1.65 1.50
Share of total quantity (percent)
U.S. imports:
Vietnam 77.6 86.0 96.1 96.3 94.3
Other sources 22.4 14.0 3.9 3.7 5.7
Total imports 100.0 100.0 100.0 100.0 100.0
Share of total value (percent)
U.S. imports:
Vietnam 76.2 84.9 95.6 93.3 93.0
Other sources 23.8 15.1 4.4 6.7 7.0
Total imports 100.0 100.0 100.0 100.0 100.0 Note: Due to rounding, figures may not add to the totals shown. Source: Official Commerce statistics. U.S. imports of certain frozen fish fillets for the years 2009 to 2011 are compiled using HTS statistical reporting number 0304.29.6033. For the years 2012‐2013, U.S. imports are compiled using HTS subheading 0304.62.00.
62 Domestic interested parties observed that in 2007, subsequent to several U.S. states banning Chinese pangasius imports because they contained FDA‐banned antibiotics, U.S. imports from China declined from 21.4 million pounds in 2007 to 12.3 million pounds in 2013. Imports from China are since increasing, reaching 6.95 million pounds in January through April 2014. Domestic Interested Parties’ Response to the Notice of Institution, July 2, 2014, p. 37.
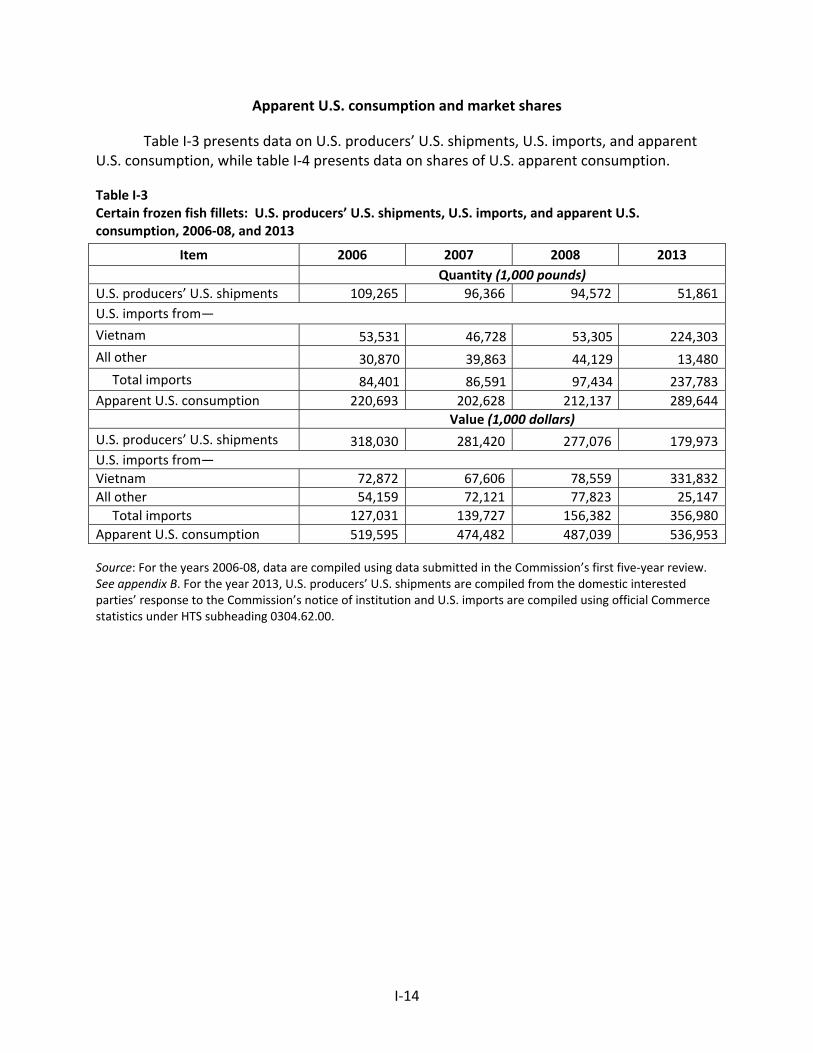
I‐14
Apparent U.S. consumption and market shares
Table I‐3 presents data on U.S. producers’ U.S. shipments, U.S. imports, and apparent U.S. consumption, while table I‐4 presents data on shares of U.S. apparent consumption.
Table I‐3 Certain frozen fish fillets: U.S. producers’ U.S. shipments, U.S. imports, and apparent U.S. consumption, 2006‐08, and 2013
Item 2006 2007 2008 2013
Quantity (1,000 pounds)
U.S. producers’ U.S. shipments 109,265 96,366 94,572 51,861
U.S. imports from—
Vietnam 53,531 46,728 53,305 224,303
All other 30,870 39,863 44,129 13,480
Total imports 84,401 86,591 97,434 237,783
Apparent U.S. consumption 220,693 202,628 212,137 289,644
Value (1,000 dollars)
U.S. producers’ U.S. shipments 318,030 281,420 277,076 179,973
U.S. imports from—
Vietnam 72,872 67,606 78,559 331,832
All other 54,159 72,121 77,823 25,147
Total imports 127,031 139,727 156,382 356,980
Apparent U.S. consumption 519,595 474,482 487,039 536,953 Source: For the years 2006‐08, data are compiled using data submitted in the Commission’s first five‐year review. See appendix B. For the year 2013, U.S. producers’ U.S. shipments are compiled from the domestic interested parties’ response to the Commission’s notice of institution and U.S. imports are compiled using official Commerce statistics under HTS subheading 0304.62.00.
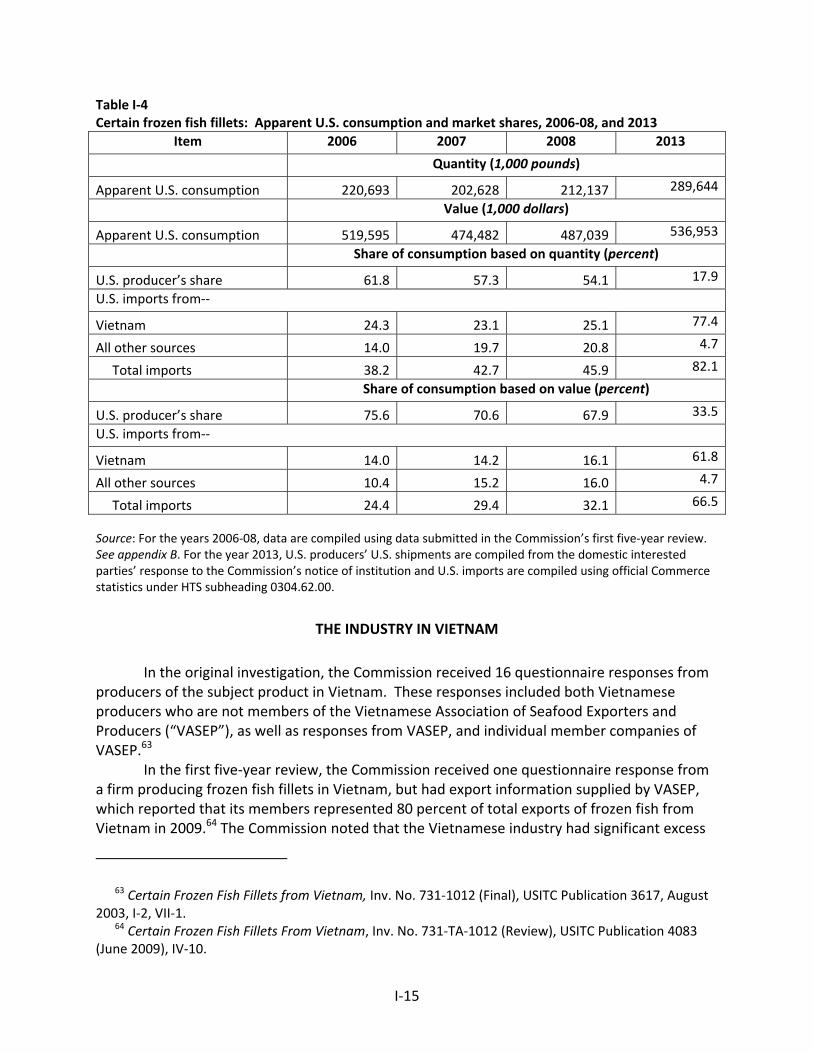
I‐15
Table I‐4 Certain frozen fish fillets: Apparent U.S. consumption and market shares, 2006‐08, and 2013
Item 2006 2007 2008 2013
Quantity (1,000 pounds)
Apparent U.S. consumption 220,693 202,628 212,137 289,644
Value (1,000 dollars)
Apparent U.S. consumption 519,595 474,482 487,039 536,953
Share of consumption based on quantity (percent)
U.S. producer’s share 61.8 57.3 54.1 17.9
U.S. imports from‐‐
Vietnam 24.3 23.1 25.1 77.4
All other sources 14.0 19.7 20.8 4.7
Total imports 38.2 42.7 45.9 82.1
Share of consumption based on value (percent)
U.S. producer’s share 75.6 70.6 67.9 33.5
U.S. imports from‐‐
Vietnam 14.0 14.2 16.1 61.8
All other sources 10.4 15.2 16.0 4.7
Total imports 24.4 29.4 32.1 66.5
Source: For the years 2006‐08, data are compiled using data submitted in the Commission’s first five‐year review. See appendix B. For the year 2013, U.S. producers’ U.S. shipments are compiled from the domestic interested parties’ response to the Commission’s notice of institution and U.S. imports are compiled using official Commerce statistics under HTS subheading 0304.62.00.
THE INDUSTRY IN VIETNAM
In the original investigation, the Commission received 16 questionnaire responses from producers of the subject product in Vietnam. These responses included both Vietnamese producers who are not members of the Vietnamese Association of Seafood Exporters and Producers (“VASEP”), as well as responses from VASEP, and individual member companies of VASEP.63
In the first five‐year review, the Commission received one questionnaire response from a firm producing frozen fish fillets in Vietnam, but had export information supplied by VASEP, which reported that its members represented 80 percent of total exports of frozen fish from Vietnam in 2009.64 The Commission noted that the Vietnamese industry had significant excess
63 Certain Frozen Fish Fillets from Vietnam, Inv. No. 731‐1012 (Final), USITC Publication 3617, August 2003, I‐2, VII‐1.
64 Certain Frozen Fish Fillets From Vietnam, Inv. No. 731‐TA‐1012 (Review), USITC Publication 4083 (June 2009), IV‐10.
I‐16
capacity and announced expansion plans. The Commission also described the industry as export‐oriented, acknowledging an increasing volume of exports to the European Union, Australia, Russia, and Ukraine.65
In its response to the notice of institution, VASEP stated that Vietnamese production facilities run at high capacity utilization rates and that Vietnamese producers are committed to the home market and third‐country markets.66 In their response to the notice of institution, domestic interested parties reported that Vietnam has a large excess processing capacity, with the two largest exporters having an excess 25 and 30 percent respectively and that other processors have even more excess capacity, going as high as 70 percent excess capacity.67 The domestic interested parties stated that since the first review, production capacity and the volume of exports from Vietnam of the subject merchandise have increased.68 The number of processors has grown from 80 identified during the first review to 100 processors in Vietnam in 2012.69 The domestic interested parties noted plans to expand by the Vietnamese industry, citing that in 2011, the Vietnamese government issued an Aquaculture Plan to produce 2 million metric tons (4.4 billion pounds) of pangasius per year by 2020, with reported figures being 3,300 metric tons (7.3 million pounds) in 2007 and 1.3 million metric tons (2.9 billion pounds) in 2012.70 The domestic interested parties also cite numerous announcements of capacity expansion by Vietnamese producers in the last five years.71
Table I‐5 presents available export shipment data of certain frozen fish fillets from Vietnam to its largest global markets as reported by VASEP.
65 Ibid., pp. 14‐15. 66 VASEP’s Response to the Notice of Institution, July 2, 2014, p. 5. 67 Domestic Interested Parties’ Response to the Notice of Institution, July 2, 2014 p.15. 68 Domestic interested parties claimed that the volume of Vietnamese export of pangasius to the
United States has increased from representing 3.8 percent of total Vietnamese pangasius exports in 2008 to 21.6 percent of total Vietnamese pangasius exports in 2013. Domestic Interested Parties’ Response to the Notice of Institution, July 2, 2014, pp. 12‐13.
Domestic interested parties also cited a report by VASEP that stated that in 2012, Vietnam pangasius exporters started shifting their shipments from the EU and to the U.S. market because of “fear of late payment by European buyers,” low export prices, and a drop in European demand. Ibid., exh. 23 (citing VASEP, Report on Vietnam Seafood Export Quarter I/2012 at 27).
69 Ibid., p. 10. 70 Ibid., pp. 10‐11. 71 Ibid. p. 16.
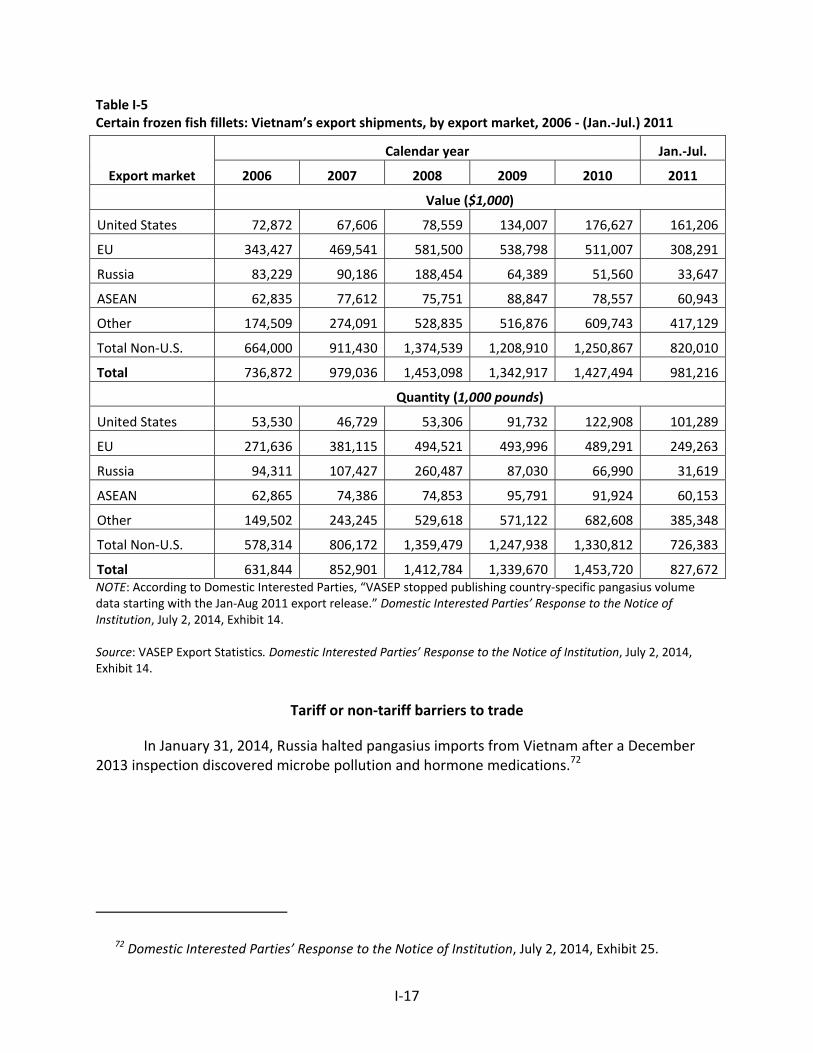
I‐17
Table I‐5 Certain frozen fish fillets: Vietnam’s export shipments, by export market, 2006 ‐ (Jan.‐Jul.) 2011
Export market
Calendar year Jan.‐Jul.
2006 2007 2008 2009 2010 2011
Value ($1,000)
United States 72,872 67,606 78,559 134,007 176,627 161,206
EU 343,427 469,541 581,500 538,798 511,007 308,291
Russia 83,229 90,186 188,454 64,389 51,560 33,647
ASEAN 62,835 77,612 75,751 88,847 78,557 60,943
Other 174,509 274,091 528,835 516,876 609,743 417,129
Total Non‐U.S. 664,000 911,430 1,374,539 1,208,910 1,250,867 820,010
Total 736,872 979,036 1,453,098 1,342,917 1,427,494 981,216
Quantity (1,000 pounds)
United States 53,530 46,729 53,306 91,732 122,908 101,289
EU 271,636 381,115 494,521 493,996 489,291 249,263
Russia 94,311 107,427 260,487 87,030 66,990 31,619
ASEAN 62,865 74,386 74,853 95,791 91,924 60,153
Other 149,502 243,245 529,618 571,122 682,608 385,348
Total Non‐U.S. 578,314 806,172 1,359,479 1,247,938 1,330,812 726,383
Total 631,844 852,901 1,412,784 1,339,670 1,453,720 827,672NOTE: According to Domestic Interested Parties, “VASEP stopped publishing country‐specific pangasius volume data starting with the Jan‐Aug 2011 export release.” Domestic Interested Parties’ Response to the Notice of Institution, July 2, 2014, Exhibit 14. Source: VASEP Export Statistics. Domestic Interested Parties’ Response to the Notice of Institution, July 2, 2014, Exhibit 14.
Tariff or non‐tariff barriers to trade
In January 31, 2014, Russia halted pangasius imports from Vietnam after a December 2013 inspection discovered microbe pollution and hormone medications.72
72 Domestic Interested Parties’ Response to the Notice of Institution, July 2, 2014, Exhibit 25.

A‐1
APPENDIX A
STATEMENT OF ADEQUACY

A‐2
EXPLANATION OF COMMISSION DETERMINATION ON ADEQUACY
in
Certain Frozen Fish Fillets from Vietnam
Inv. No. 731‐TA‐1012 (Second Review)
On September 5, 2014, the Commission unanimously determined to conduct an
expedited review in the subject five‐year review pursuant to section 751(c)(3)(B) of the Tariff
Act of 1930, as amended, 19 U.S.C. § 1675(c)(3)(B).
The Commission received a response to the notice of institution that was jointly filed by
the Catfish Farmers of America, an association of U.S. catfish farmers and processors, and six
individual catfish processers: America’s Catch Inc., Alabama Catfish Inc. dba Harvest Select
Catfish, Inc., Heartland Catfish Co., Magnolia Processing, Inc. dba Pride of the Pond, Simmons
Farm Raised Catfish, Inc., and Guidry’s Catfish, Inc. (collectively, “domestic interested parties”).
The Commission found each of the processers’ responses individually adequate. Because the
Commission received adequate responses from interested parties accounting for a substantial
share of U.S. production of frozen catfish fillets, the Commission determined that the domestic
interested party group response was adequate.
The Commission also received a response from the Vietnam Association of Seafood
Exporters and Producers (“VASEP”), an association of 23 producers and exporters of frozen fish
fillets from Vietnam. That response did not contain substantial portions of the information
requested in the Commission’s notice of institution, and VASEP declined the opportunity to
provide the missing information in a supplemental response. Accordingly, the Commission
determined that VASEP’s response was inadequate and that the respondent interested party
group response was inadequate.
The Commission did not find any circumstances that would warrant conducting a full
review. The Commission, therefore, decided to conduct an expedited review of this order.
A record of the Commissioners' votes is available from the Office of the Secretary and at
the Commission's web site (www.usitc.gov).
B-1
APPENDIX B
SUMMARY DATA FROM ORIGINAL INVESTIGATION AND FIRST FIVE‐YEAR REVIEW

B-2
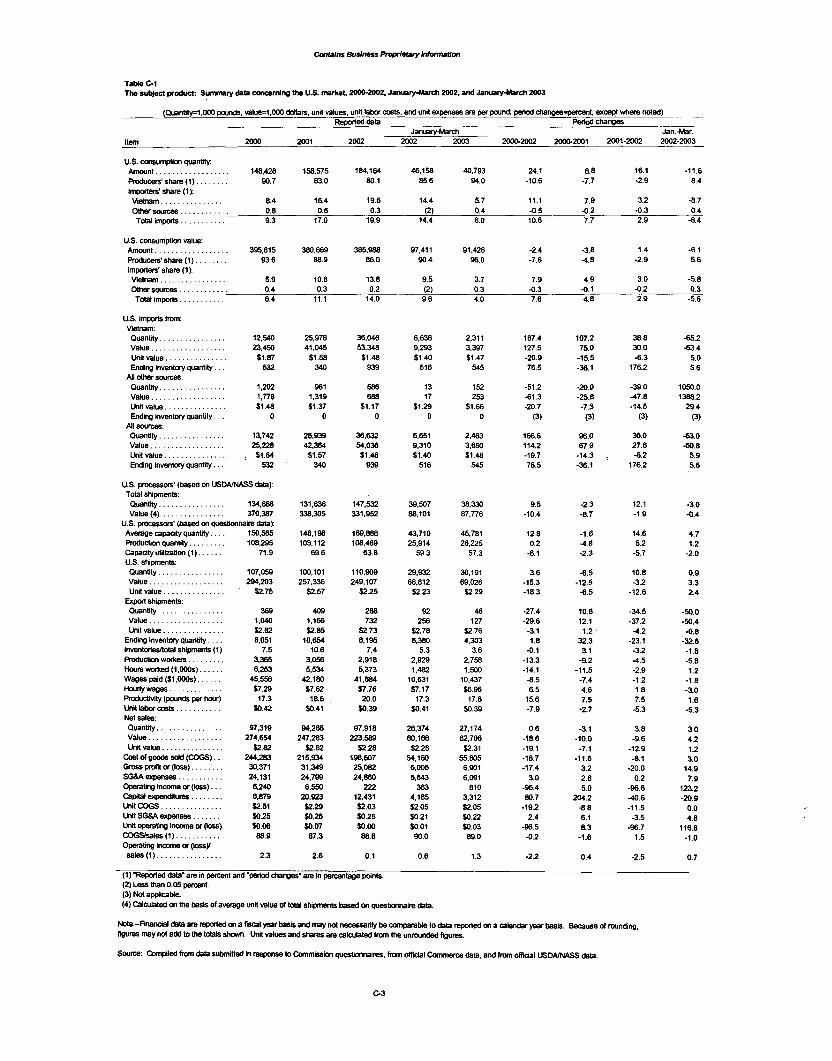
Table GI The ru- prOdu*: Sumrpry dae wmornlng Va US. market, 2000-2002. January4Aarch 2002. and Jamury-March ZOO3
(Quanbly-1.003 pamds. value=l ,003 dollars. und values. und labor a b . and und expenses are per pound. period chang8s=pemnt, except where med) - Reported data penodchan!xs
Januafy-Mamh Jan -Mar Item m 2001 2002 2302 2003 2ooo-2oM 2ooo-2001 2001-2002 2002-2003
US. ansumptlon quantity: Amount . . . . . . . . . . . . . . . . . . 148.428 158.575 184.164 46.158 40.793 24.1 6.8 16.1 -11.6 Roducers'share (1). . . . . . . . 90.7 83.0 80.1 85.6 94.0 -10.6 -7.7 -2.9 8.4 Imputecishare (1): Vietnam . . . . . . . . . . . . . . . . 8.4 16.4 19.6 14.4 5.7 11.1 7.9 3.2 -8.7 omar sources . . . . . . . . . . . . 0.8 0.6 0.3 (2) 0.4 0.5 -0.2 0.3 0 4 Total impofls. . . . . . . . . . . 9.3 17.0 19.9 14.4 6.0 10.6 7.7 2.9 -8.4
US. mosumption value: Amount . . . . . . . . . . . . . . . . . . 395.615 380.669 385.988 97,411 91.426 -2.4 -3.8 1.4 -6.1
Impaterr' share (1): Producefs'Share(1). ....... 93.6 88.9 86.0 90.4 96.0 -7.6 4.6 -2.9 5.6
Velnam . . . . . . . . . . . . . . . . 5.9 10.8 13.8 9.5 3.7 7.9 4.9 3.0 -5.8 omar swnes ............ 0.4 0.3 0.2 (2) 0.3 0.3 -0.1 0.2 0.3
Total importJ. . . . . . . . . . . 6.4 11.1 14.0 9.6 4.0 7.6 4.8 2.9 -5.6
US. IrnpMs fmm: Vietnam: Quantity. . . . . . . . . . . . . . . . Value . . . . . . . . . . . . . . . . . . Unit value, . . . . . . . . . . . . . . Ending inventory quanti . . .
All other sources: Quantity . . . . . . . . . . . . . . . . Value. . . . . . . . . . . . . . . . . . Unit value. . . . . . . . . . . . . . . Ending inventory quantity. . .
Quantity. . . . . . . . . . . . . . . . Value. . . . . . . . . . . . . . . . . . Mi value . . . . . . . . . . . . . . . ~
All sources:
Ending inventory quantity.. .
12.540 23.450 $1.87
532
1.202 1 .TI8 $1.48
0
13,742 25.228 $1.84
532
U.S. proce~~ors' (based MI USWNASS data): Total shipments: Quantity.. . . . . . . . . . . . . . . 134,686 Value (4). . . . . . . . . . . . . . . . 370.367
U.S. procewm' (based on questimnaire data): Arne capacity quantity. . . . 150.565 ROducUon quantity.. . . . . . . . 108.295 Capadtyutiliition (1). ..... 71.9
Quantity. ............... 107,059 Value. . . . . . . . . . . . . . . . . . 294,203 Unit value, .............. 52.75
Quantity. . . . . . . . . . . . . . . . 369 Value 1.040 Unit value. . . . . . . . . . . . . . . 52.82
Ending inventory quantity. ... 8.051 InventcdeMotal shipments (1) 7.5 RoductiMI workers. ........ 3.385 H o u r s ~ ( 1 . o M ) s ) ...... 6.253 Wages paid ($l.ooOS). . . . . . 45.556 Hourly wages . . . . . . . . . . . . . $7.29 Productivity (pounds per hour) 17.3 Unii tabor msts . . . . . . . . . . . 50.42 Net sales:
US. shipments:
Expat shipments:
. . . . . . . . . . . . . . . . . .
Value. . . . . . . . . . . . . . . . . . 274.654 unit value. .............. 52.82
~ O f Q o o d s S O ! d ( ~ ) . . 244283 Gross Worn or (loss). . . . . . . . 30,371 SGMexpenSes. . ......... 24,131 Opemtirq lnmme or (kxs). .. 6,240 Capital expenditures. . . . . . . . 6.879 UnitcoGs . . . . . . . . . . . . . . . $2.51 Unit S W expanses . . . . . . . 50.25 Unii oparatlng income or (loss) $0.06 m s a I e s ( 1 ) . .......... 88.9 Openting income or (Imsy sales (1). ............... 2.3
25.978 41,045
$1.58 340
961 1.319 $1.37
0
26.939 42.364 $1.57 340
131.636 338.305
148.198 103.112
69.6
100.101 257.336
52.57
409 1.166 52.85
10.654 10.6
3.056 5.534
42.180 $7.62 18.6
$0.41
94,288 247,283
$2.62 215.934 31,349 24.7S9 6.550
20.823 $2.29 $0.26 50.07 87.3
2.6
36.046 53.348 $1.48
939
586 688
$1.17 0
36.632 54,036 51.48
939
147.532 331.952
169.888 108.469
63.8
11o.m 249.107
52.25
268 732
52.73 8.1%
7.4 2,918 5.373
41.684 $7.76 20.0
$0.39
97.918 223.589
52.28 198,507 25.082 24.860 a
12.431 52.03 $0.25 50.00 88.8
0.1
6.638 9.293 $1.40
516
13 17
$1.29 0
6,651 9.310 $1.40
516
39.507 88,101
43.710 25.914
59.3
29.932 66.812 $2.23
92 256
52.78 6.380
5.3 2,929 1.482
10,631 $7.17 17.3
$0.41
26,374 60.166 52.28
54.160 6.006 5.843 363
4,185 52.05 $0.21 50.01 90.0
0.6
2.31 1 3.397 $1.47
545
152 253
$1.66 0
2.463 3.650 $1.48
545
38.330 87.776
45.781 26.225
57.3
30,191 69.026 52.29
46 127
$2.76 4.303
3.6 2.758 1.500
10.437 $6.96 17.6
$0.39
27.174 62.706 $2.31
55.805 6.901 6.091
810 3.312 $2.05 50.22 $0.03 89.0
1.3
187.4 127.5 -20.9 76.5
-51.2 -61.3 -20.7
(3)
166.6 114.2 -19.7 76.5
9.5 -10.4
12.8 0.2
-8.1
3.6 -15.3 -18.3
-27.4 -29.6 -3.1 1.8
0.1 -13.3 -14.1 -8.5 6.5
15.6 -7.9
0.6 -18.6 -19.1 -18.7 -17.4
3.0 -96.4 80.7
-19.2 2.4
-96.5 0.2
-2.2
107.2 75.0
-15.5 -36.1
-20.0 -25.8 -7.3
(3)
96.0 67.9
-14.3 : -36.1
-2.3 -8.7
-1.0 4.0 -2.3
-6.5 -12.5 -6.5
10.8 12.1 1.2
32.3 3.1
-9.2 -11.5 -7.4 4.6 7.5 -2.7
-3.1 -10.0 -7.1
-11.6 3.2 2.8 5.0
204.2 -8.8 6.1 8.3
-1.6
0.4
(1)~eddata'areinpenentandIperiadchanges'arelnpercentaeepoints. (2) Less than 0.05 percent (3) Not applicable. (4) Calculated on the basis of avenge unit value Of total shipnents based on questionnaire data.
38.8 30.0 -6.3
176.2
-39.0 -47.8 -14.5
(3)
36.0 27.6 -6.2
176.2
12.1 -1.9
14.6 5.2
-5.7
10.8 -3.2
-12.6
-34.5 -37.2 4.2
-23.1 -3.2 4.5 -2.9 -1.2 1.8 7.5 -5.3
3.8 -9.6
-12.9 -8.1
-20.0 0.2
-96.6 4 . 6 -11.5 -3.5
46.7 1.5
-2.5
-65.2 -63.4
5.0 5.6
1050.0 1388.2
29.4 (3)
-63.0 M . 8
5.9 5.6
-3.0 -0.4
4.7 1.2
-2.0
0.9 3.3 2.4
-50.0 -50.4 4.8
-32.6 -1.8 -5.8 1.2
-1.8 -3.0 1.6
-5.3
3.0 4.2 1.2 3.0
14.9 7.9
123.2 -20.9
0.0 4.8
116.6 -1.0
0.7
Note.-Financial data are repated on a fiscal year basis and may not necessarily be comparable to data repated on a calendar year bass. Beguse of munding. Roures may not add to the totab shown. VnB values and shares am calculated from the unmunded l~ures.
Source: Compiled fmn data sumined In response to CommisJion quesmnaires. ~IWI official Commerce data. and from official USDAMASS &ta.
C 3
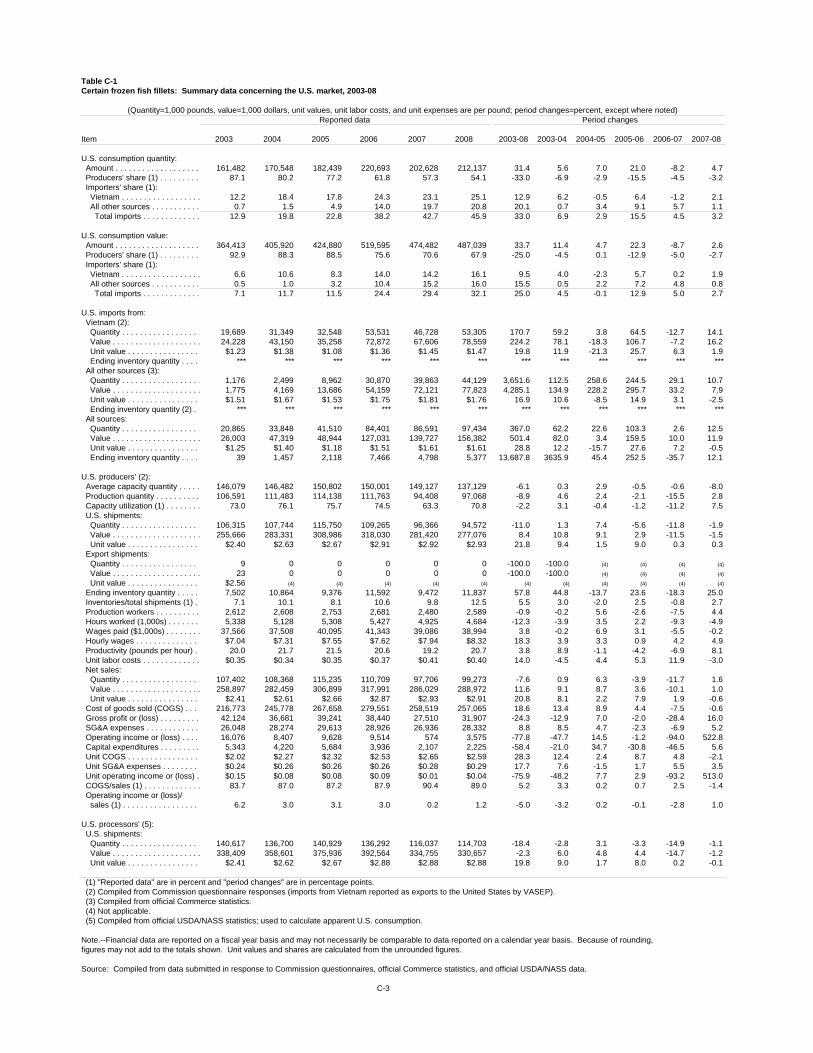
Table C-1Certain frozen fish fillets: Summary data concerning the U.S. market, 2003-08
(Quantity=1,000 pounds, value=1,000 dollars, unit values, unit labor costs, and unit expenses are per pound; period changes=percent, except where noted)Reported data Period changes
Item 2003 2004 2005 2006 2007 2008 2003-08 2003-04 2004-05 2005-06 2006-07 2007-08
U.S. consumption quantity: Amount . . . . . . . . . . . . . . . . . . . 161,482 170,548 182,439 220,693 202,628 212,137 31.4 5.6 7.0 21.0 -8.2 4.7 Producers' share (1) . . . . . . . . . 87.1 80.2 77.2 61.8 57.3 54.1 -33.0 -6.9 -2.9 -15.5 -4.5 -3.2 Importers' share (1): Vietnam . . . . . . . . . . . . . . . . . . 12.2 18.4 17.8 24.3 23.1 25.1 12.9 6.2 -0.5 6.4 -1.2 2.1 All other sources . . . . . . . . . . . 0.7 1.5 4.9 14.0 19.7 20.8 20.1 0.7 3.4 9.1 5.7 1.1 Total imports . . . . . . . . . . . . . 12.9 19.8 22.8 38.2 42.7 45.9 33.0 6.9 2.9 15.5 4.5 3.2
U.S. consumption value: Amount . . . . . . . . . . . . . . . . . . . 364,413 405,920 424,880 519,595 474,482 487,039 33.7 11.4 4.7 22.3 -8.7 2.6 Producers' share (1) . . . . . . . . . 92.9 88.3 88.5 75.6 70.6 67.9 -25.0 -4.5 0.1 -12.9 -5.0 -2.7 Importers' share (1): Vietnam . . . . . . . . . . . . . . . . . . 6.6 10.6 8.3 14.0 14.2 16.1 9.5 4.0 -2.3 5.7 0.2 1.9 All other sources . . . . . . . . . . . 0.5 1.0 3.2 10.4 15.2 16.0 15.5 0.5 2.2 7.2 4.8 0.8 Total imports . . . . . . . . . . . . . 7.1 11.7 11.5 24.4 29.4 32.1 25.0 4.5 -0.1 12.9 5.0 2.7
U.S. imports from: Vietnam (2): Quantity . . . . . . . . . . . . . . . . . . 19,689 31,349 32,548 53,531 46,728 53,305 170.7 59.2 3.8 64.5 -12.7 14.1 Value . . . . . . . . . . . . . . . . . . . . 24,228 43,150 35,258 72,872 67,606 78,559 224.2 78.1 -18.3 106.7 -7.2 16.2 Unit value . . . . . . . . . . . . . . . . $1.23 $1.38 $1.08 $1.36 $1.45 $1.47 19.8 11.9 -21.3 25.7 6.3 1.9 Ending inventory quantity . . . . *** *** *** *** *** *** *** *** *** *** *** *** All other sources (3): Quantity . . . . . . . . . . . . . . . . . . 1,176 2,499 8,962 30,870 39,863 44,129 3,651.6 112.5 258.6 244.5 29.1 10.7 Value . . . . . . . . . . . . . . . . . . . . 1,775 4,169 13,686 54,159 72,121 77,823 4,285.1 134.9 228.2 295.7 33.2 7.9 Unit value . . . . . . . . . . . . . . . . $1.51 $1.67 $1.53 $1.75 $1.81 $1.76 16.9 10.6 -8.5 14.9 3.1 -2.5 Ending inventory quantity (2) . . *** *** *** *** *** *** *** *** *** *** *** *** All sources: Quantity . . . . . . . . . . . . . . . . . . 20,865 33,848 41,510 84,401 86,591 97,434 367.0 62.2 22.6 103.3 2.6 12.5 Value . . . . . . . . . . . . . . . . . . . . 26,003 47,319 48,944 127,031 139,727 156,382 501.4 82.0 3.4 159.5 10.0 11.9 Unit value . . . . . . . . . . . . . . . . $1.25 $1.40 $1.18 $1.51 $1.61 $1.61 28.8 12.2 -15.7 27.6 7.2 -0.5 Ending inventory quantity . . . . 39 1,457 2,118 7,466 4,798 5,377 13,687.8 3635.9 45.4 252.5 -35.7 12.1
U.S. producers' (2): Average capacity quantity . . . . . 146,079 146,482 150,802 150,001 149,127 137,129 -6.1 0.3 2.9 -0.5 -0.6 -8.0 Production quantity . . . . . . . . . . 106,591 111,483 114,138 111,763 94,408 97,068 -8.9 4.6 2.4 -2.1 -15.5 2.8 Capacity utilization (1) . . . . . . . . 73.0 76.1 75.7 74.5 63.3 70.8 -2.2 3.1 -0.4 -1.2 -11.2 7.5 U.S. shipments: Quantity . . . . . . . . . . . . . . . . . . 106,315 107,744 115,750 109,265 96,366 94,572 -11.0 1.3 7.4 -5.6 -11.8 -1.9 Value . . . . . . . . . . . . . . . . . . . . 255,666 283,331 308,986 318,030 281,420 277,076 8.4 10.8 9.1 2.9 -11.5 -1.5 Unit value . . . . . . . . . . . . . . . . $2.40 $2.63 $2.67 $2.91 $2.92 $2.93 21.8 9.4 1.5 9.0 0.3 0.3 Export shipments: Quantity . . . . . . . . . . . . . . . . . . 9 0 0 0 0 0 -100.0 -100.0 (4) (4) (4) (4)
Value . . . . . . . . . . . . . . . . . . . . 23 0 0 0 0 0 -100.0 -100.0 (4) (4) (4) (4)
Unit value . . . . . . . . . . . . . . . . $2.56 (4) (4) (4) (4) (4) (4) (4) (4) (4) (4) (4)
Ending inventory quantity . . . . . 7,502 10,864 9,376 11,592 9,472 11,837 57.8 44.8 -13.7 23.6 -18.3 25.0 Inventories/total shipments (1) . 7.1 10.1 8.1 10.6 9.8 12.5 5.5 3.0 -2.0 2.5 -0.8 2.7 Production workers . . . . . . . . . . 2,612 2,608 2,753 2,681 2,480 2,589 -0.9 -0.2 5.6 -2.6 -7.5 4.4 Hours worked (1,000s) . . . . . . . 5,338 5,128 5,308 5,427 4,925 4,684 -12.3 -3.9 3.5 2.2 -9.3 -4.9 Wages paid ($1,000s) . . . . . . . . 37,566 37,508 40,095 41,343 39,086 38,994 3.8 -0.2 6.9 3.1 -5.5 -0.2 Hourly wages . . . . . . . . . . . . . . . $7.04 $7.31 $7.55 $7.62 $7.94 $8.32 18.3 3.9 3.3 0.9 4.2 4.9 Productivity (pounds per hour) . 20.0 21.7 21.5 20.6 19.2 20.7 3.8 8.9 -1.1 -4.2 -6.9 8.1 Unit labor costs . . . . . . . . . . . . . $0.35 $0.34 $0.35 $0.37 $0.41 $0.40 14.0 -4.5 4.4 5.3 11.9 -3.0 Net sales: Quantity . . . . . . . . . . . . . . . . . . 107,402 108,368 115,235 110,709 97,706 99,273 -7.6 0.9 6.3 -3.9 -11.7 1.6 Value . . . . . . . . . . . . . . . . . . . . 258,897 282,459 306,899 317,991 286,029 288,972 11.6 9.1 8.7 3.6 -10.1 1.0 Unit value . . . . . . . . . . . . . . . . $2.41 $2.61 $2.66 $2.87 $2.93 $2.91 20.8 8.1 2.2 7.9 1.9 -0.6 Cost of goods sold (COGS) . . . . 216,773 245,778 267,658 279,551 258,519 257,065 18.6 13.4 8.9 4.4 -7.5 -0.6 Gross profit or (loss) . . . . . . . . . 42,124 36,681 39,241 38,440 27,510 31,907 -24.3 -12.9 7.0 -2.0 -28.4 16.0 SG&A expenses . . . . . . . . . . . . 26,048 28,274 29,613 28,926 26,936 28,332 8.8 8.5 4.7 -2.3 -6.9 5.2 Operating income or (loss) . . . . 16,076 8,407 9,628 9,514 574 3,575 -77.8 -47.7 14.5 -1.2 -94.0 522.8 Capital expenditures . . . . . . . . . 5,343 4,220 5,684 3,936 2,107 2,225 -58.4 -21.0 34.7 -30.8 -46.5 5.6 Unit COGS . . . . . . . . . . . . . . . . $2.02 $2.27 $2.32 $2.53 $2.65 $2.59 28.3 12.4 2.4 8.7 4.8 -2.1 Unit SG&A expenses . . . . . . . . . $0.24 $0.26 $0.26 $0.26 $0.28 $0.29 17.7 7.6 -1.5 1.7 5.5 3.5 Unit operating income or (loss) . $0.15 $0.08 $0.08 $0.09 $0.01 $0.04 -75.9 -48.2 7.7 2.9 -93.2 513.0 COGS/sales (1) . . . . . . . . . . . . . 83.7 87.0 87.2 87.9 90.4 89.0 5.2 3.3 0.2 0.7 2.5 -1.4 Operating income or (loss)/ sales (1) . . . . . . . . . . . . . . . . . 6.2 3.0 3.1 3.0 0.2 1.2 -5.0 -3.2 0.2 -0.1 -2.8 1.0
U.S. processors' (5): U.S. shipments: Quantity . . . . . . . . . . . . . . . . . . 140,617 136,700 140,929 136,292 116,037 114,703 -18.4 -2.8 3.1 -3.3 -14.9 -1.1 Value . . . . . . . . . . . . . . . . . . . . 338,409 358,601 375,936 392,564 334,755 330,657 -2.3 6.0 4.8 4.4 -14.7 -1.2 Unit value . . . . . . . . . . . . . . . . $2.41 $2.62 $2.67 $2.88 $2.88 $2.88 19.8 9.0 1.7 8.0 0.2 -0.1
(1) "Reported data" are in percent and "period changes" are in percentage points. (2) Compiled from Commission questionnaire responses (imports from Vietnam reported as exports to the United States by VASEP). (3) Compiled from official Commerce statistics. (4) Not applicable. (5) Compiled from official USDA/NASS statistics; used to calculate apparent U.S. consumption.
Note.--Financial data are reported on a fiscal year basis and may not necessarily be comparable to data reported on a calendar year basis. Because of rounding,figures may not add to the totals shown. Unit values and shares are calculated from the unrounded figures.
Source: Compiled from data submitted in response to Commission questionnaires, official Commerce statistics, and official USDA/NASS data.
C-3