Ceropegia sandersonii Mimics Attacked Honeybees to · PDF fileCeropegia sandersonii Mimics...
10
Current Biology, Volume 26 Supplemental Information Ceropegia sandersonii Mimics Attacked Honeybees to Attract Kleptoparasitic Flies for Pollination Annemarie Heiduk, Irina Brake, Michael von Tschirnhaus, Matthias Göhl, Andreas Jürgens, Steven D. Johnson, Ulrich Meve, and Stefan Dötterl
Transcript of Ceropegia sandersonii Mimics Attacked Honeybees to · PDF fileCeropegia sandersonii Mimics...

Current Biology, Volume 26
Supplemental Information
Ceropegia sandersonii Mimics Attacked Honeybees
to Attract Kleptoparasitic Flies for Pollination
Annemarie Heiduk, Irina Brake, Michael von Tschirnhaus, Matthias Göhl, AndreasJürgens, Steven D. Johnson, Ulrich Meve, and Stefan Dötterl

0,6 mm
0,4 mm
A
B
user
Schreibmaschinentext
Figure S1

100
0
B
A
C
D
E
Figure S2
Devanem
Sticky Note
Marked set by Devanem
Devanem
Sticky Note
Marked set by Devanem
user
Textfeld
user
Schreibmaschinentext
Figure S2

Supplemental Figure legends
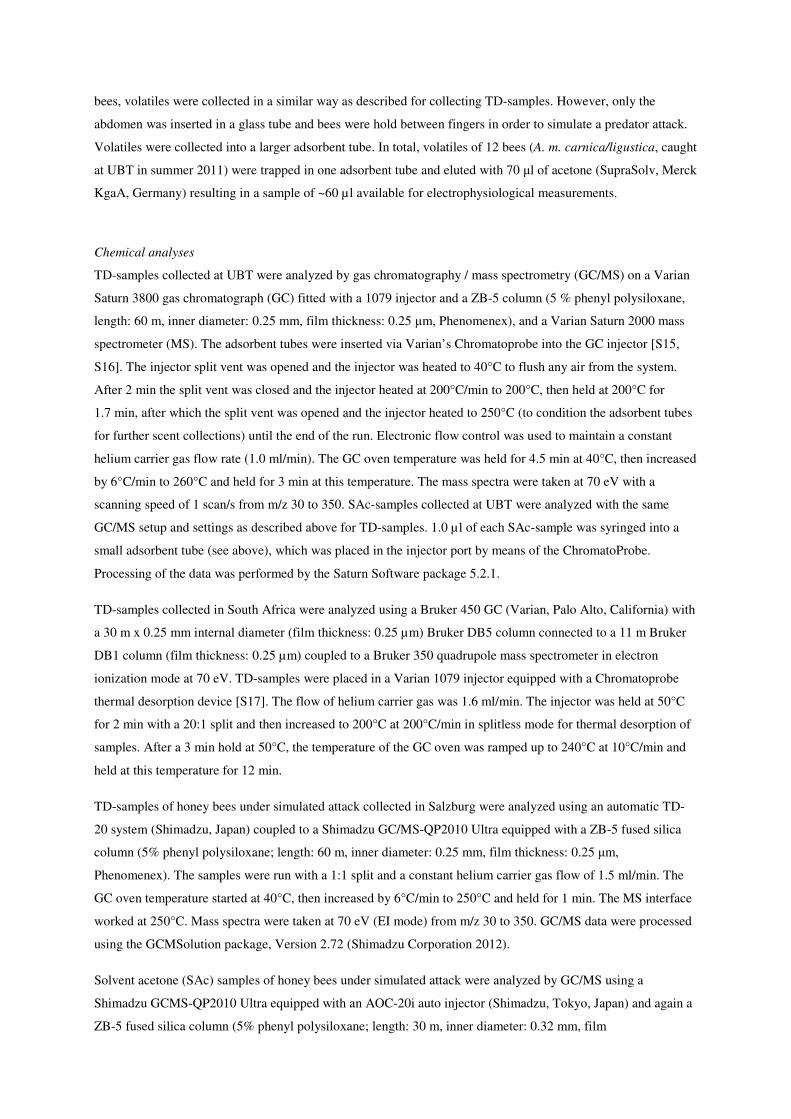
Figure S1 (related to Table 1 and to Supplemental Experimental Procedures - Flower visitors and
pollinators). Desmometopa cf. nudigena flies with pollinaria attached to their mouthparts.
Flies were collected from flowers of Ceropegia sandersonii in KwaZulu-Natal, South Africa. A: habitus. B:
close up of a head. Arrows indicate pollinia of attached pollinaria.
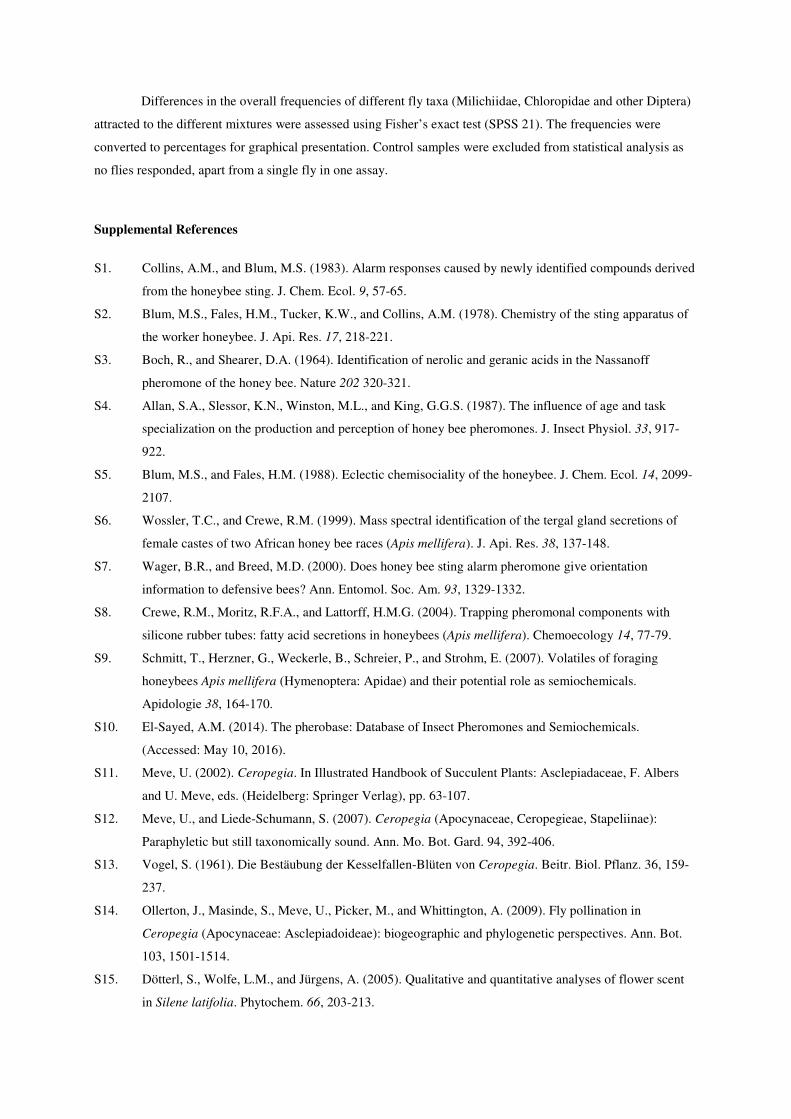
Figure S2 (related to Figure 1, Table 2, and to Supplemental Experimental Procedures - Volatile collection
– Western honey bees). Experimental setup for collection of volatiles from honey bees under simulated
attack.
A: Flow meter, B: pump, C: adsorbent tube, D: glass tube with honey bee, E: glass pipette to simulate an attack.
Flow meter, pump, adsorbent tube, and glass tube with honey bee are connected via silicone tubes. Red arrows
indicate direction of air flow. Colored dots indicate volatile molecules released from sting (green), Nasonov
(red), and mandible (blue) glands.
Supplemental Experimental Procedures
Plant material and study sites
The genus Ceropegia L. is restricted to the Old World and comprises more than 180 species [S11]. The plants
grow in tropical and subtropical habitats from Canary Islands and West-Africa as far as Australia. The maximum
diversity occurs in south-east Africa, India, Madagascar and China [S12]. Ceropegia sandersonii Decne. ex
Hook. f. is widespread, typically found in dry scrub and forest or bushveld of South Africa (Eastern Cape,
KwaZulu-Natal, Mpumalanga, Mozambique and Swaziland). For the present study plants from natural
populations were investigated at four different localities in KwaZulu-Natal, South Africa (Muden: 28°58'23.8"S;
30°24'21.0"E; Inanda Dam: 29°40'25.6"S; 30°51'01.7"E; Ashburton: 29°39'23.75"S; 30°27'32.05"E; Kloof:
29°47'30.04''S; 30°50'04.88''E). In addition, we investigated C. sandersonii plants cultivated within the range of
its natural distribution (Botanical Garden of the University of KwaZulu-Natal [BG-UKZN], Pietermaritzburg,
South Africa), and plants grown in greenhouses outside the natural distribution range (Europe: University of
Bayreuth [UBT], Germany; Botanical Garden of the University of Salzburg [BG-SBG], Austria).
Flower visitors and pollinators
Flower visitors and pollinators of C. sandersonii were observed from January to March 2013 and 2014 in its
native range in South Africa and from May to October 2010-2012 and August/September 2014 in its non-native
range at UBT and BG-SBG, respectively. Flies trapped inside flowers were collected and preserved in a 4%
solution of glycerin in ethanol (99.8%) for later identification to family level. Milichiidae and Chloropidae were
further identified to genus, morphospecies or species level. Collected flies were also examined for presence of

pollinaria on their body. A pollinarium is formed by two pollinia connected via caudicles and the corpusculum,
and is clipped to the flies’ mouthparts as a whole. During the pollination process flies insert a single pollinium of
a pollinarium into a so called “guide rail” of the gynostegium, the synorganized reproductive organs [S13]. Flies
carrying pollinaria (corpuscula with no, one, or two pollinia; cf. Figure S1) were treated as pollinators [S14].
Volatile collection
Flowers
To obtain thermal desorption (TD) samples of Ceropegia sandersonii flower scent, volatiles were collected from
single newly opened flowers (BG-UKZN: three plant individuals, three flowers, one flower was sampled twice;
UBT: two plant individuals, three flowers per plant, one sample each) as described by [S15]. Single flowers were
enclosed in polyester oven bags (Toppits®, Germany) for a minimum of 10 min (UBT samples) and up to 20 min
depending on the intensity of scent as perceived by the human nose. The accumulated floral volatiles were
trapped by pulling air from the bag through small adsorbent tubes for 5 min using a membrane pump (G12/01
EB, Rietschle Thomas Inc., Puchheim, Germany) at a flow rate of 200 ml/min. The adsorbent tubes were made
of ChromatoProbe quartz microvials of Varian Inc. (length: 15 mm, inner diameter: 2 mm), from which the
closed end was cut off. These tubes were filled with a mixture of 1.5 mg Tenax-TA (mesh 60-80) and 1.5 mg
Carbotrap B (mesh 20-40) (both Supelco, Bellefonte, PA, USA) embedded in glass wool. Additional samples of
the surrounding air were collected to distinguish between floral scent compounds and compounds in the ambient
air.
To obtain SAc-samples for electrophysiological analyses 18 individual C. sandersonii flowers from greenhouse
plants in Bayreuth were enclosed into separate oven bags as described above. The emitted scent was trapped
using larger adsorbent tubes (glass capillaries; length: 8 cm, inner diameter: 2.5 mm) filled with 15 mg Tenax-
TA (mesh 60-80) and 15 mg Carbotrap B (mesh 20-40). The scent was trapped for 6 hrs during daytime (9 am to
6 pm) at a flow rate of 100 ml/min. The volatiles trapped on an adsorbent tube were eluted with 60 µl of acetone
(SupraSolv, Merck KgaA, Germany). Samples were pooled to finally obtain three SAc-samples (SAc1: one
flower in ~50 µl; SAc2: six flowers in ~300 µl; SAc3: eleven flowers in ~550 µl) for electrophysiological
measurements.
Western honey bees
To obtain TD-samples of honey bees under attack, foraging worker bees (Apis mellifera) were caught at the BG-
SBG in summer 2015 (23 individuals, A. m. carnica/ligustica) and at the BG-UKZN in May 2016 (five
individuals, A. m. scutellata; this subspecies co-occurs with C. sandersonii). Single bees were inserted, abdomen
first, in glass tubes (inner diameter: 5.4 mm) and “attacked” with the tip of a glass pipette (Figure S2). As
consequence, the bees a) bit into the glass pipette, and b) extruded their sting and tried to pierce the glass tube.
The volatile compounds released from these bees were collected for two minutes per bee in an adsorbent trap
(BG-SBG, 2015: one sample collected from five bees; three samples collected from six bees each, flow rate
200ml/min; BG-UKZN, 2016: five samples collected from a single bee each, flower rate 50ml/min) which was
coupled to the glass tube at the side of the bee’s abdomen. To specifically identify alarm components, control
samples were taken from each A. m. carnica/ligustica individual before being “attacked” with a glass pipette.
Samples of A. m. scutellata were analyszd against an ambient control sample. To obtain a SAc-sample of honey
bees, volatiles were collected in a similar way as described for collecting TD-samples. However, only the
abdomen was inserted in a glass tube and bees were hold between fingers in order to simulate a predator attack.
Volatiles were collected into a larger adsorbent tube. In total, volatiles of 12 bees (A. m. carnica/ligustica, caught
at UBT in summer 2011) were trapped in one adsorbent tube and eluted with 70 µl of acetone (SupraSolv, Merck
KgaA, Germany) resulting in a sample of ~60 µl available for electrophysiological measurements.
Chemical analyses
TD-samples collected at UBT were analyzed by gas chromatography / mass spectrometry (GC/MS) on a Varian
Saturn 3800 gas chromatograph (GC) fitted with a 1079 injector and a ZB-5 column (5 % phenyl polysiloxane,
length: 60 m, inner diameter: 0.25 mm, film thickness: 0.25 µm, Phenomenex), and a Varian Saturn 2000 mass
spectrometer (MS). The adsorbent tubes were inserted via Varian’s Chromatoprobe into the GC injector [S15,
S16]. The injector split vent was opened and the injector was heated to 40°C to flush any air from the system.
After 2 min the split vent was closed and the injector heated at 200°C/min to 200°C, then held at 200°C for
1.7 min, after which the split vent was opened and the injector heated to 250°C (to condition the adsorbent tubes
for further scent collections) until the end of the run. Electronic flow control was used to maintain a constant
helium carrier gas flow rate (1.0 ml/min). The GC oven temperature was held for 4.5 min at 40°C, then increased
by 6°C/min to 260°C and held for 3 min at this temperature. The mass spectra were taken at 70 eV with a
scanning speed of 1 scan/s from m/z 30 to 350. SAc-samples collected at UBT were analyzed with the same
GC/MS setup and settings as described above for TD-samples. 1.0 µl of each SAc-sample was syringed into a
small adsorbent tube (see above), which was placed in the injector port by means of the ChromatoProbe.
Processing of the data was performed by the Saturn Software package 5.2.1.
TD-samples collected in South Africa were analyzed using a Bruker 450 GC (Varian, Palo Alto, California) with
a 30 m x 0.25 mm internal diameter (film thickness: 0.25 µm) Bruker DB5 column connected to a 11 m Bruker
DB1 column (film thickness: 0.25 µm) coupled to a Bruker 350 quadrupole mass spectrometer in electron
ionization mode at 70 eV. TD-samples were placed in a Varian 1079 injector equipped with a Chromatoprobe
thermal desorption device [S17]. The flow of helium carrier gas was 1.6 ml/min. The injector was held at 50°C
for 2 min with a 20:1 split and then increased to 200°C at 200°C/min in splitless mode for thermal desorption of
samples. After a 3 min hold at 50°C, the temperature of the GC oven was ramped up to 240°C at 10°C/min and
held at this temperature for 12 min.
TD-samples of honey bees under simulated attack collected in Salzburg were analyzed using an automatic TD-
20 system (Shimadzu, Japan) coupled to a Shimadzu GC/MS-QP2010 Ultra equipped with a ZB-5 fused silica
column (5% phenyl polysiloxane; length: 60 m, inner diameter: 0.25 mm, film thickness: 0.25 µm,
Phenomenex). The samples were run with a 1:1 split and a constant helium carrier gas flow of 1.5 ml/min. The
GC oven temperature started at 40°C, then increased by 6°C/min to 250°C and held for 1 min. The MS interface
worked at 250°C. Mass spectra were taken at 70 eV (EI mode) from m/z 30 to 350. GC/MS data were processed
using the GCMSolution package, Version 2.72 (Shimadzu Corporation 2012).
Solvent acetone (SAc) samples of honey bees under simulated attack were analyzed by GC/MS using a
Shimadzu GCMS-QP2010 Ultra equipped with an AOC-20i auto injector (Shimadzu, Tokyo, Japan) and again a
ZB-5 fused silica column (5% phenyl polysiloxane; length: 30 m, inner diameter: 0.32 mm, film

thickness: 0.25 µm, Phenomenex). 1.0 µl of the samples was injected (injection temperature: 220°C; split ratio
1:1), and the column flow (carrier gas: helium) was set at 3 ml/min. The GC oven temperature was held at 40°C
for 1 min, then increased by 10°C/min to 220°C and held for 2 min. The MS interface worked at 220°C. Mass
spectra were again taken at 70 eV (in EI mode) from m/z 30 to 350 and data processed as described above.
Scent components of the GC/MS spectra were identified using the mass spectral data bases NIST 11, Wiley 9,
MassFinder 3, FFNSC 2, and Adams [S18]. Where possible, compounds were verified using retention times and
mass spectra of authentic standards (purchased from Sigma Aldrich) or by comparison with published Kovats
retention indices (KRI). For estimation of total scent emission, known amounts of monoterpenoids, aromatics,
and aliphatics (applied to small adsorbent tubes) were injected, and the mean peak area of these compounds was
used for quantification [S15].
Electrophysiological analyses (GC/EAD)
The flower scent of C. sandersonii was tested on the antennae of nine Desmometopa sordida flies (SAc3: eight
runs with five females and two males; antenna of one male was used twice; SAc1: two runs with two female
flies) collected from C. sandersonii flowers (UBT, 2010 and 2011), and 19 D. microps flies (SAc2: 25 runs with
13 females and six males; antennae of two females and two males were used twice, of one male and one female
both antennae were used) collected from inflorescences of Solidago canadensis (BG-SBG, 2013). The SAc-
sample of honey bees under simulated attack was tested on the antennae of three female D. sordida flies (one run
per antenna) collected from C. sandersonii flowers (UBT, 2011). Some of the measurements did not deliver clear
results and were excluded from the analyses. The number of fly individuals and antennae finally analyzed is
given in Table 2 and Table S1.
The analyses with D. sordida and D. microps flies were performed with a Carlo Erba Vega 6000 Series 2
(Rodano, Italy) and an Agilent 7890A (Santa Clara, California, USA) gas chromatograph, respectively. Both
GCs were equipped with a flame ionization detector (FID) and an EAD setup (heated transfer line, 2-channel
USB acquisition controller) provided by Syntech (Kirchzarten, Germany). For each run an acetone scent sample
(flower scent: 1.0 µl, alarm pheromone: 1.5 µl) was injected in splitless mode (injector temperature: 250°C; oven
temperature: 40°C). In both systems, the split opened 30 sec after injection, and the oven heated by 10°C/min to
220°C. Both GCs were equipped with a Zebron ZB-5 column for analysis (5% phenyl polysiloxane;
length: 30 m, inner diameter: 0.32 mm, film thickness: 0.25 µm, Phenomenex). In the Carlo Erba GC, the
column was split at the end by a four-arm flow splitter (GRAPHPACK 3D/2, Gerstel, Mühlheim, Germany) into
two deactivated capillaries (length: 50 cm, inner diameter: 0.32 mm) leading to the FID and to the EAD setup.
Helium was introduced as a make-up gas through the fourth-arm splitter. In the Agilent GC, the column was split
at the end by a µFlow splitter (Gerstel, Mühlheim, Germany; nitrogen was used as make-up gas) into two
deactivated capillaries, one (length: 2 m, inner diameter: 0.15 mm) again leading to the FID setup, the other
(length: 1 m, inner diameter: 0.2 mm) leading to the EAD setup. In both GC systems the outlet of the EAD was
placed in a cleaned, humidified air flow directed over the fly antenna.
Flies used for measurements were anaesthetized (CO2) and their heads cut off. Two glass micropipette electrodes
were filled with insect Ringer’s solution (8.0 g/l NaCl, 0.4 g/l KCl, 4.0 g/l CaCl2) and connected to silver wires.

The caudal side of the head was connected to the reference electrode, and the recording electrode was placed in
contact with the antenna tip (first flagellomere).
To identify the EAD-active compounds, 1.0 µl each of the SAc-samples was analyzed by GC/MS (see above).
Bioassays
Geraniol (Sigma-Aldrich, 98%), 2-heptanone (Merck, >98%), and 2-nonanol (Sigma-Aldrich, 99%) were
commercially available, and (E)-2-octen-1-yl acetate was synthesized by acetylation with acetic anhydride and
pyridine in CH2Cl2 under DMAP catalysis ([S19]; purity >99%). The synthetic substances were offered as a four
component mixture (henceforth complete mixture; equal volumes, dilution in acetone: 10-2
; v/v). The complete
mixture was offered in a 1 ml glass vial (Supelco) partially pushed into soil and tested against a similarly placed
control glass vial containing an equal amount of acetone only. The two vials were placed 30 cm apart and each
assay lasted a minimum of 30 min and up to 60 min. The position of test sample and control was exchanged at
half-time. As determined by dynamic headspace and GC/MS, the average amount of scent released from the test
vial containing the complete mixture was a good approximation of the amount of scent released from 1-3
flowers. Approaching flies were caught with a small insect net when flying or sitting within a radius of 10 cm
around the vials. This bioassay was conducted nine times on nine different days and at two different sites in
South Africa (BG-UKZN: n = 6; Muden: n = 3) in February/March 2013.
Five-choice assays with reduced mixtures (Mix A: no (E)-2-octen-1-yl acetate, Mix B: no 2-heptanone,
Mix C: no geraniol, and Mix D: no 2-nonanol) were performed eight times on eight different days and two
different sites in South Africa (BG UKZN: n = 6; Muden: n = 2) in February/March 2014. The mixtures A-D and
an acetone control were offered on sticky traps. A trap consisted of a black colored styrofoam square
(9 cm x 9 cm) with a hole (8 mm diameter) in the center. The upper side of the square was covered with
colorless insect glue (Tanglefoot®). A 1 ml glass vial (Supelco) was filled with 700 µl of the sample (dilution:
10-2
; v/v) and inserted with its’ neck into the hole from below. A wooden stick (25 cm length) was taped to the
sample vial to place the trap in ~20 cm height above ground. In each assay the traps were placed with a distance
of 6 m to each other and offered for at least 4 hours and up to 8 hours. Flies were collected from the sticky traps,
rinsed with kerosene to remove the insect glue, and stored and identified as described before.
Statistical analyses
Bioassay data were analyzed using generalized linear models implemented in SPSS 21 (IBM Corp.). Differences
in the mean counts of insects attracted to each volatile mixture were analyzed in models with a negative binomial
distribution and log link function. For experiments that involved several trials, each trial was treated as the
subject in generalized estimating equations (GEE) to account for lack of independence in responses during each
trial. These models used an exchangeable correlation matrix to account for correlations within trials and Wald
statistics to assess significance. For graphical representation of marginal (adjusted) means and standard errors,
we used back-transformed values, resulting in asymmetric standard errors. Post-hoc comparisons of the mean
number of insects attracted to each mixture were obtained using the sequential Sidak method which is known to
achieve a good balance between the possibilities of type 1 versus type 2 errors.
Differences in the overall frequencies of different fly taxa (Milichiidae, Chloropidae and other Diptera)
attracted to the different mixtures were assessed using Fisher’s exact test (SPSS 21). The frequencies were
converted to percentages for graphical presentation. Control samples were excluded from statistical analysis as
no flies responded, apart from a single fly in one assay.
Supplemental References
S1. Collins, A.M., and Blum, M.S. (1983). Alarm responses caused by newly identified compounds derived
from the honeybee sting. J. Chem. Ecol. 9, 57-65.
S2. Blum, M.S., Fales, H.M., Tucker, K.W., and Collins, A.M. (1978). Chemistry of the sting apparatus of
the worker honeybee. J. Api. Res. 17, 218-221.
S3. Boch, R., and Shearer, D.A. (1964). Identification of nerolic and geranic acids in the Nassanoff
pheromone of the honey bee. Nature 202 320-321.
S4. Allan, S.A., Slessor, K.N., Winston, M.L., and King, G.G.S. (1987). The influence of age and task
specialization on the production and perception of honey bee pheromones. J. Insect Physiol. 33, 917-
922.
S5. Blum, M.S., and Fales, H.M. (1988). Eclectic chemisociality of the honeybee. J. Chem. Ecol. 14, 2099-
2107.
S6. Wossler, T.C., and Crewe, R.M. (1999). Mass spectral identification of the tergal gland secretions of
female castes of two African honey bee races (Apis mellifera). J. Api. Res. 38, 137-148.
S7. Wager, B.R., and Breed, M.D. (2000). Does honey bee sting alarm pheromone give orientation
information to defensive bees? Ann. Entomol. Soc. Am. 93, 1329-1332.
S8. Crewe, R.M., Moritz, R.F.A., and Lattorff, H.M.G. (2004). Trapping pheromonal components with
silicone rubber tubes: fatty acid secretions in honeybees (Apis mellifera). Chemoecology 14, 77-79.
S9. Schmitt, T., Herzner, G., Weckerle, B., Schreier, P., and Strohm, E. (2007). Volatiles of foraging
honeybees Apis mellifera (Hymenoptera: Apidae) and their potential role as semiochemicals.
Apidologie 38, 164-170.
S10. El-Sayed, A.M. (2014). The pherobase: Database of Insect Pheromones and Semiochemicals.
(Accessed: May 10, 2016).
S11. Meve, U. (2002). Ceropegia. In Illustrated Handbook of Succulent Plants: Asclepiadaceae, F. Albers
and U. Meve, eds. (Heidelberg: Springer Verlag), pp. 63-107.
S12. Meve, U., and Liede-Schumann, S. (2007). Ceropegia (Apocynaceae, Ceropegieae, Stapeliinae):
Paraphyletic but still taxonomically sound. Ann. Mo. Bot. Gard. 94, 392-406.
S13. Vogel, S. (1961). Die Bestäubung der Kesselfallen-Blüten von Ceropegia. Beitr. Biol. Pflanz. 36, 159-
237.
S14. Ollerton, J., Masinde, S., Meve, U., Picker, M., and Whittington, A. (2009). Fly pollination in
Ceropegia (Apocynaceae: Asclepiadoideae): biogeographic and phylogenetic perspectives. Ann. Bot.
103, 1501-1514.
S15. Dötterl, S., Wolfe, L.M., and Jürgens, A. (2005). Qualitative and quantitative analyses of flower scent
in Silene latifolia. Phytochem. 66, 203-213.

S16. Amirav, A., and Dagan, S. (1997). A direct sample introduction device for mass spectrometry studies
and gas chromatography mass spectrometry analyses. Eur. Mass Spectrom. 3, 105-111.
S17. Gordin, A., and Amirav, A. (2000). SnifProbe: new method and device for vapor and gas sampling. J.
Chromatogr. A 903, 155-172.
S18. Adams, R.P. (2007). Identification of essential oil components by gas chromatography/mass
spectrometry, 4th Edition, (Carol Stream, Illinois: Allured Publishing Corporation).
S19. Göhl, M., and Seifert, K. (2014). Synthesis of the sesquiterpenes albicanol, drimanol, and drimanic acid,
and the marine sesquiterpene hydroquinone deoxyspongiaquinol. European J. Org. Chem. 2014, 6975-
6982.