CEREBRAL FUNCTION MONITORING - Brighton and Sussex ... · method for electro-cortical monitoring...
9
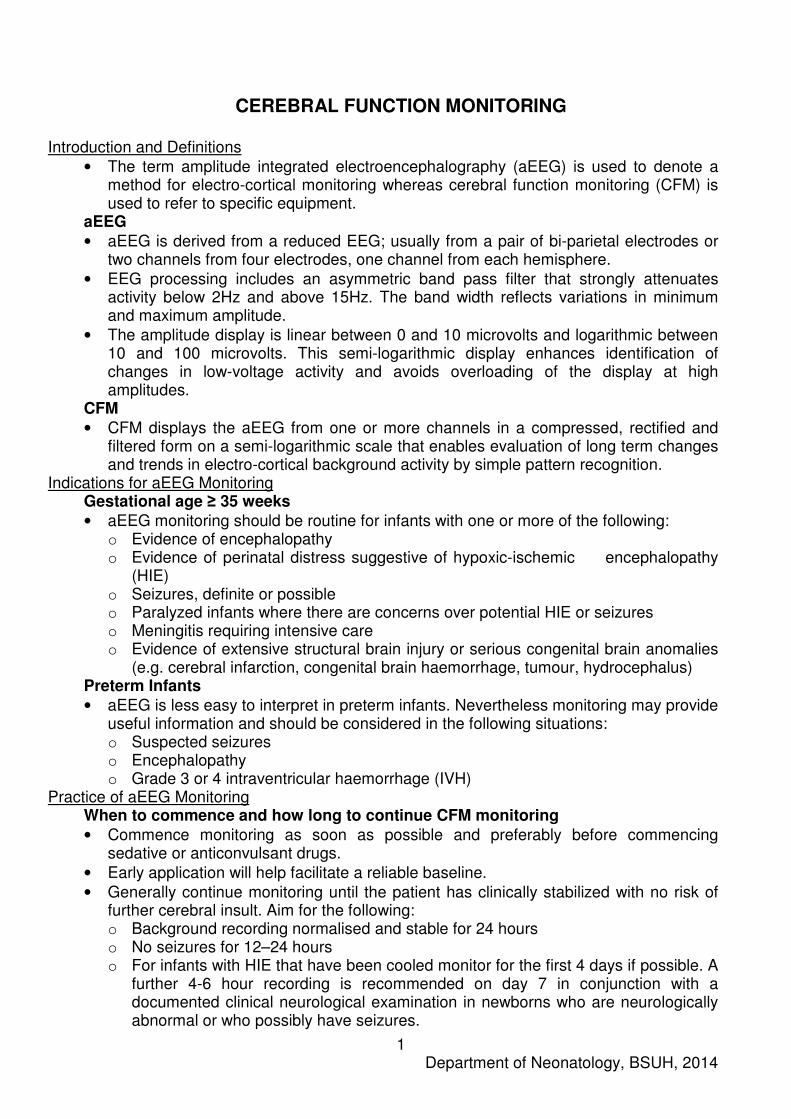
Department of Neonatology, BSUH, 2014 1 CEREBRAL FUNCTION MONITORING Introduction and Definitions • The term amplitude integrated electroencephalography (aEEG) is used to denote a method for electro-cortical monitoring whereas cerebral function monitoring (CFM) is used to refer to specific equipment. aEEG • aEEG is derived from a reduced EEG; usually from a pair of bi-parietal electrodes or two channels from four electrodes, one channel from each hemisphere. • EEG processing includes an asymmetric band pass filter that strongly attenuates activity below 2Hz and above 15Hz. The band width reflects variations in minimum and maximum amplitude. • The amplitude display is linear between 0 and 10 microvolts and logarithmic between 10 and 100 microvolts. This semi-logarithmic display enhances identification of changes in low-voltage activity and avoids overloading of the display at high amplitudes. CFM • CFM displays the aEEG from one or more channels in a compressed, rectified and filtered form on a semi-logarithmic scale that enables evaluation of long term changes and trends in electro-cortical background activity by simple pattern recognition. Indications for aEEG Monitoring Gestational age ≥ 35 weeks • aEEG monitoring should be routine for infants with one or more of the following: o Evidence of encephalopathy o Evidence of perinatal distress suggestive of hypoxic-ischemic encephalopathy (HIE) o Seizures, definite or possible o Paralyzed infants where there are concerns over potential HIE or seizures o Meningitis requiring intensive care o Evidence of extensive structural brain injury or serious congenital brain anomalies (e.g. cerebral infarction, congenital brain haemorrhage, tumour, hydrocephalus) Preterm Infants • aEEG is less easy to interpret in preterm infants. Nevertheless monitoring may provide useful information and should be considered in the following situations: o Suspected seizures o Encephalopathy o Grade 3 or 4 intraventricular haemorrhage (IVH) Practice of aEEG Monitoring When to commence and how long to continue CFM monitoring • Commence monitoring as soon as possible and preferably before commencing sedative or anticonvulsant drugs. • Early application will help facilitate a reliable baseline. • Generally continue monitoring until the patient has clinically stabilized with no risk of further cerebral insult. Aim for the following: o Background recording normalised and stable for 24 hours o No seizures for 12–24 hours o For infants with HIE that have been cooled monitor for the first 4 days if possible. A further 4-6 hour recording is recommended on day 7 in conjunction with a documented clinical neurological examination in newborns who are neurologically abnormal or who possibly have seizures.
Transcript of CEREBRAL FUNCTION MONITORING - Brighton and Sussex ... · method for electro-cortical monitoring...
Department of Neonatology, BSUH, 2014 1
CEREBRAL FUNCTION MONITORING
Introduction and Definitions
• The term amplitude integrated electroencephalography (aEEG) is used to denote a method for electro-cortical monitoring whereas cerebral function monitoring (CFM) is used to refer to specific equipment.
aEEG
• aEEG is derived from a reduced EEG; usually from a pair of bi-parietal electrodes or two channels from four electrodes, one channel from each hemisphere.
• EEG processing includes an asymmetric band pass filter that strongly attenuates activity below 2Hz and above 15Hz. The band width reflects variations in minimum and maximum amplitude.
• The amplitude display is linear between 0 and 10 microvolts and logarithmic between 10 and 100 microvolts. This semi-logarithmic display enhances identification of changes in low-voltage activity and avoids overloading of the display at high amplitudes.
CFM
• CFM displays the aEEG from one or more channels in a compressed, rectified and filtered form on a semi-logarithmic scale that enables evaluation of long term changes and trends in electro-cortical background activity by simple pattern recognition.
Indications for aEEG Monitoring Gestational age ≥ 35 weeks
• aEEG monitoring should be routine for infants with one or more of the following: o Evidence of encephalopathy o Evidence of perinatal distress suggestive of hypoxic-ischemic encephalopathy
(HIE) o Seizures, definite or possible o Paralyzed infants where there are concerns over potential HIE or seizures o Meningitis requiring intensive care o Evidence of extensive structural brain injury or serious congenital brain anomalies
(e.g. cerebral infarction, congenital brain haemorrhage, tumour, hydrocephalus) Preterm Infants
• aEEG is less easy to interpret in preterm infants. Nevertheless monitoring may provide useful information and should be considered in the following situations: o Suspected seizures o Encephalopathy o Grade 3 or 4 intraventricular haemorrhage (IVH)
Practice of aEEG Monitoring When to commence and how long to continue CFM monitoring
• Commence monitoring as soon as possible and preferably before commencing sedative or anticonvulsant drugs.
• Early application will help facilitate a reliable baseline.
• Generally continue monitoring until the patient has clinically stabilized with no risk of further cerebral insult. Aim for the following: o Background recording normalised and stable for 24 hours o No seizures for 12–24 hours o For infants with HIE that have been cooled monitor for the first 4 days if possible. A
further 4-6 hour recording is recommended on day 7 in conjunction with a documented clinical neurological examination in newborns who are neurologically abnormal or who possibly have seizures.

Department of Neonatology, BSUH, 2014 2
What montage to use
• Routine use of two channel recording is recommended as although there were no major differences between seizure detection with one or two channel aEEG, two channel aEEG does give additional information about unilateral brain lesions.
How to place electrodes and start recording (copy by the machine) Nicolet One Cerebral Function Monitor
• Switch on at mains and at rocker switch to rear of screen
• Wait for Windows screen
• Password Nicolet and Return
• Double click the desktop icon Nic Vue
• To register new patient to database click New on tool bar
• Enter patient details (American date) and click OK
• Your patient should now appear on the patient list. Now click Nicolet One on the tool bar. The next screen will show patient details, a drop down protocol list and impedance threshold
• Select Toby Trial 1 Ch or 4 Channel and set the impedance threshold at 5 kOhm
• Attach leads to baby according to the Toby Trial or 4 Channel montage.
• Insert needle electrodes subcutaneously aiming to the back of the head and fix with a
small bead of collodion adhesive. The leads will then come out from under the baby’s hat anteriorly allowing its easy removal at a later date if required.
• Plug the leads into the sockets marked 1 to 16 and REF on the amplifier box shown in the picture below.
• Lastly stick the leads to the hat using pink tape and make sure all leads and the
amplifier box are placed safely.
• Check impedance, all electrode dots on screen should change from red to green i.e. impedance <5k Ohm.
• Press Start and the screen should display 4 lines of live EEG if using the 4 channel montage or an aEEG trace and a single line of live EEG if using the Toby Trial 1 Ch montage.
Toby Trial 4 Channel
• P3 = 1
• P4 = 2
• Reference = Ref
• Fp1 = 1
• Fp2 = 2
• C3 = 3
• C4 = 4
• O1 = 5
• O2 = 6
• Reference = Ref
Toby Trial 4 Channel
25mm
mm
75 mm
75 mm
face
occiput
= Ref.
= Vertex
P3 P4
C3
Fp1
C4
Fp2
O1 O2
Department of Neonatology, BSUH, 2014 3
• Press Panel from the tool bar to display a pictorial montage view on the right side of the screen.
• To display an aEEG trace when using the 4 Channel montage open the trend drop down menu. Click Fp1-O1 and 3 aEEG traces (Fp1-O1, Fp2-O2 and C3-C4) will appear above the live EEG.
• Now adjust the remaining drop down menus: duration = 4 hours, type = aEEG, min = 0 µV and max = 100µV.
• To mark an event, click on an event marker to the right of the live EEG trace.
• To review a recording whilst still recording click Review
• Either click on the paging arrows , page up and down keys on the keyboard or click on the right or left side of the review trace with the arrow cursor. The
slide bar on the tool bar can be used to vary the speed of review.
• To mark an event in retrospect click Review. Click an event marker to the right of the review panel and then once on the review panel. Event markers will also show below the aEEG trace as small, coloured lines.
• To finish recording, click Close button on tool bar. The recording will automatically be saved to the database.
• To review a saved recording, select Nic Vue, select patient from the patient list and then the recording you would like to review from the exam list at the bottom of the screen. Now click Review on the tool bar. Or review raw data by double clicking the Reader desktop icon. Open files: My Computer/Local Disk(C)/Nicolet/Nic One/data. Raw data will be displayed in number form including the date of recording. The files can be renamed by right clicking on the file number or exported onto USB.
Interpretation of aEEG Monitoring
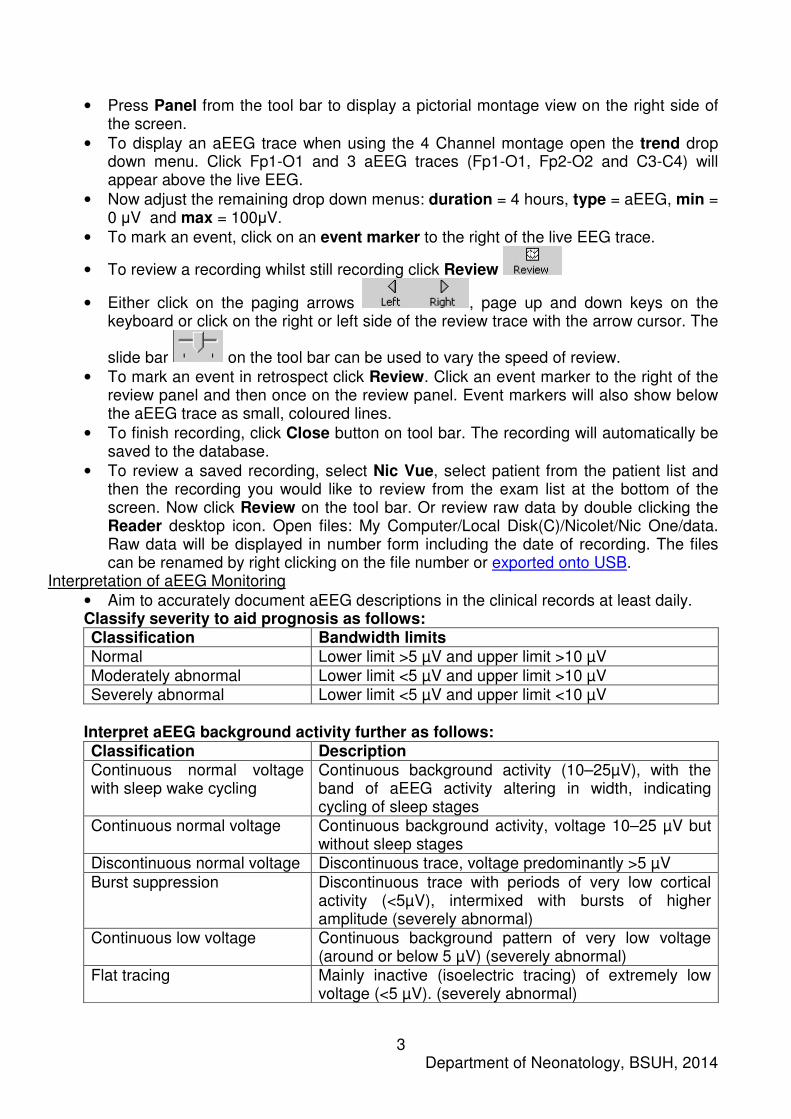
• Aim to accurately document aEEG descriptions in the clinical records at least daily. Classify severity to aid prognosis as follows: Classification Bandwidth limits Normal Lower limit >5 µV and upper limit >10 µV Moderately abnormal Lower limit <5 µV and upper limit >10 µV Severely abnormal Lower limit <5 µV and upper limit <10 µV
Interpret aEEG background activity further as follows: Classification Description Continuous normal voltage with sleep wake cycling
Continuous background activity (10–25µV), with the band of aEEG activity altering in width, indicating cycling of sleep stages
Continuous normal voltage Continuous background activity, voltage 10–25 µV but without sleep stages
Discontinuous normal voltage Discontinuous trace, voltage predominantly >5 µV Burst suppression Discontinuous trace with periods of very low cortical
activity (<5µV), intermixed with bursts of higher amplitude (severely abnormal)
Continuous low voltage Continuous background pattern of very low voltage (around or below 5 µV) (severely abnormal)
Flat tracing Mainly inactive (isoelectric tracing) of extremely low voltage (<5 µV). (severely abnormal)

Department of Neonatology, BSUH, 2014 4
Sleep-Wake Cycling (SWC)
• Normal finding characterized by smooth sinusoidal variations, mostly in the minimum amplitude. Broader bandwidth represents discontinuous background activity during quiet sleep, and narrower bandwidth corresponds to the more continuous activity during wakefulness and active sleep. SWF can be divided into: o No SWC - no cyclic variation of the aEEG background Imminent/immature SWC -
some, but not fully developed, cyclical variation of the lower amplitude; not developed as compared with normative gestational age-representative traces
o Developed SWC - clearly identifiable sinusoidal variations between discontinuous and more continuous background activity, with cycle duration >20 min
Seizures
• Epileptic seizure activity is usually seen in the aEEG as an abrupt rise in the minimum amplitude and a simultaneous rise in the maximum amplitude, often followed by a short period of decreased amplitude. The raw EEG should show simultaneous seizure activity, with a gradual build-up of high amplitude waves and then decline in frequency and amplitude of repetitive spikes. Status epilepticus is defined as ongoing seizure activity for >30 minutes.
• Presence of epileptic seizure activity is always abnormal at all gestational ages.
• Only 34% of electrographic seizures have overt clinical signs.
• No presence of seizure activity on CFM does not reliably exclude all seizure activity (e.g. focal seizures, deep central seizures).
• Neonatal seizures are over-diagnosed by aEEG signifying the need for standard EEG confirmation. Anti-convulsants are known to cause electro-clinical dissociation.
• Background activity, including sleep-wake cycling, may be depressed by medications. Examples of aEEG interpretation
• Classifications using the pattern recognition method (right) and voltage method (left) at 3 to 6 hours of age:

Department of Neonatology, BSUH, 2014 5
aEEG background patterns
A Continuous background pattern, with prominent SWC: upper-margin voltage is >10
mV and lower margin voltage is >5 mV B Discontinuous background pattern: upper margin is >10 mV and lower margin is <5
mV C,D Burst suppression pattern: upper and lower margin voltages are <10 and <5 mV
respectively, with >100 bursts per hour (C) and <100 bursts per hour (D) E Continuous low voltage: upper margin is <10 mV and lower margin is <5 mV.
Occasional spikes are seen over 10 mV F Isoelectric or flat tracing: both margins are <5 mV and prominent spikes are likely
due to patient movement. aEEG, amplitude-integrated electroencephalography
A
B
C
D
E
F

Department of Neonatology, BSUH, 2014 6
Sleep Wake Cycling patterns
A Normal SWC - SWC on a CNV background pattern, with the lower margin of the
bandwidth >5µV. Cycle period is unusually prolonged in this sample. B Normal SWC (suboptimal variant) - the lower margin of the bandwidth is <5 µV during
quiet sleep. C Abnormal SWC - SWC on a discontinuous background pattern with the lower margin
of the bandwidth <5µV at all times. Neonatal seizures
• Several discrete seizure episodes ( ) on a background of burst suppression; seizures
clearly show an abrupt rise in both upper and lower margins

Department of Neonatology, BSUH, 2014 7
• Status epilepticus: multiple marked seizure events dominating nearly the entire
tracing. Artefacts
• High-frequency oscillatory ventilation (HFOV) may cause significant artefact
resembling seizures. Correlation with the raw electroencephalography (EEG) tracing above is essential

Department of Neonatology, BSUH, 2014 8
• A similar effect is seen from muscle artefact in both hemispheres
Prognosis Abnormal aEEG background patterns with associated outcomes at different gestational ages:Background Pattern Outcome Gestational Age (weeks)
Background Pattern Outcome
<33 Reduced continuity in first 7 days postnatal
Associated with large IVH; long term outcome not assessed
<33 Burst Suppression, Low Voltage, or Flat Trace in first 48 h postnatal
Severe handicap/death in infants with IVH Grade 3 to 4
≥37
Discontinuous Normal outcome if present only within the first 6–12 following perinatal asphyxia
≥37
Low voltage Abnormal outcome after perinatal asphyxia
≥37
Burst suppression Abnormal outcome after perinatal asphyxia; some infants healthy if aEEG background becomes continuous within 12 to 24 h
≥37
Flat trace Severely abnormal outcome (death or major handicap) after perinatal asphyxia
• The combination of the abnormalities in both the neurological examination performed within 12 hours after delivery and the aEEG yield the highest specificity and positive predictive value for the short term outcome of persistent encephalopathy (94% and 85% respectively).
• A poor background pattern seen within the first 6 hours after birth predict a poor outcome with a positive predictive value of 86% and the onset of SWC after 36 hours after birth predict a poor outcome.
• In infants with good outcome background pattern normalises by 24 hours when treated with normothermia and by 48 hours when treated with hypothermia.

Department of Neonatology, BSUH, 2014 9
• SWC is considered to reflect brain integrity. SWC can be seen from the gestational age of 29 weeks. The presence, time of onset and quality of SWC are influenced by the hypoxic-ischemic insult to which the newborns were exposed and good neuro-developmental outcome is associated with early onset and normal SWC.
• Bursts are defined as activity greater than 100mcV. The number of bursts per hour during the first 24 to 48 hours after birth seems to be of predictive outcome in infants who have IVH grade 3 to 4.


![Monitoria multimodal cerebral multimodal monitoring[2]](https://static.fdocuments.in/doc/165x107/552957004a79599a158b46fd/monitoria-multimodal-cerebral-multimodal-monitoring2.jpg)